Article

Molecular Identification of the G-Protein Genes and Their Expression Profiles in Response to Nitrogen Deprivation in Brassica napus

1
College of Natural Resources and Environment, Northwest A&F University, Yangling, Xianyang 712100, China
2
Hybrid Rapeseed Research Center of Shaanxi Province, Yangling, Xianyang 712100, China
3
Key Laboratory of Plant Nutrition and the Agri-Environment in Northwest China, Ministry of Agriculture, Yangling, Xianyang 712100, China
*
Authors to whom correspondence should be addressed.
Int. J. Mol. Sci. 2022, 23(15), 8151; https://doi.org/10.3390/ijms23158151
Submission received: 20 June 2022 / Revised: 19 July 2022 / Accepted: 19 July 2022 / Published: 24 July 2022
(This article belongs to the Section Molecular Genetics and Genomics)

Abstract

:
Heterotrimeric guanine nucleotide binding protein (G-protein) consisting of Gα, Gβ, and Gγ subunits is one of the key signal transducers in plants. Recent studies indicated that G-protein has been proposed as an important mediator of nitrogen responses in rice, wheat, and Arabidopsis. However, little is known about these G-proteins in Brassica napus (B. napus), except for three identified G-proteins, BnGA1, BnGB1, and BnGG2. Therefore, the aim of the present study is to characterize the members of the G-protein gene family in allotetraploid B. napus and to analyze their expression profiles in response to nitrogen deprivation. In total, 21 G-protein family members were identified in B. napus, encoding two Gα, six Gβ, and 13 Gγ. Sequence and phylogenetic analyses showed that although genome-wide triploid events increased the number of genes encoding Gα, Gβ, and Gγ subunits, the gene structure and protein properties of the genes encoding each G-protein subunit were extremely conserved. Collinearity analysis showed that most G-protein genes in B. napus had syntenic relationships with G-protein members of Arabidopsis, Brassica rape (B. rapa), and Brassica oleracea (B. oleracea). Expression profile analysis indicated that Gα and C-type Gγ genes (except BnGG10 and BnGG12 were highly expressed in flower and ovule) were barely expressed in most organs, whereas most Gβ and A-type Gγ genes tended to be highly expressed in most organs. G-protein genes also showed various expression patterns in response to nitrogen-deficient conditions. Under nitrogen deficiency, Gα and five C-type Gγ genes were upregulated initially in roots, while in leaves, Gα was downregulated initially and five C-type Gγ genes were highly expressed in different times. These results provide a complex genetic dissection of G-protein genes in B. napus, and insight into the biological functions of G-protein genes in response to nitrogen deficiency.

1. Introduction

Heterotrimeric guanine nucleotide binding protein (hereafter G-protein) is an evolutionary conserved signal transduction intermediate, composed of three subunits of Gα, Gβ, and Gγ. When receiving external stimulus signals, GDP is replaced by GTP on an associated Gα subunit. At the same time, Gβγ separates from Gα in the form of dimers, and transmits the signal to downstream effectors [1]. After that, the internal GTPase activity in Gα starts to activate Gα-GTP to Gα-GDP, while Gβγ reconnects with Gα to form the inactive G-protein heterotrimer complex [2]. Both Gα and Gβγ can transduce signals by interacting with various intracellular effectors, modulating diverse biological and physiological processes in the plant [3].
In general, the Gα subunit contains a Ras-like domain and a helical domain. The Gβ subunit contains a coiled-coil domain in the N-terminal region and has seven WD40 repeats. The Gγ proteins are subdivided into three types, and the A-type is defined by a CaaX motif. Whereas B-type is similar to A-type but lacks the CaaX motif, C-types contain enriched cysteine residue at the C-terminal and N-terminal similar to the canonical Gγ subunits [4,5]. Although evolution of the G-protein is conserved, there are fewer G-proteins in plants compared with the animal counterparts. While humans contain 23 Gα, 5 Gβ, and 12 Gγ proteins [6], the Arabidopsis genome is composed of one Gα, one Gβ, and three Gγ proteins [5]. In addition, in most plants, the number of G-proteins is different. For example, rice has one Gα, one Gβ, and five Gγ [7], while Brassica rape (B. rape) has one Gα, three Gβ, and five Gγ [8]. Similarly, the Camelina sativa genome is composed of three Gα, three Gβ, and nine Gγ [9]. These differences in subunits may lead to the various signaling mechanisms in plants.
Plant G-proteins play fundamental roles in almost every developmental process [10]. Early studies revealed that G-protein acts in controlling hypocotyl elongation, hook angle, rosette diameter, leaf shape [11], auxin-mediated cell division, lateral root proliferation [12], plant height [13], and seed size and number [14,15]. In recent years, plant G-proteins have also been found to be involved in plant responses to nitrogen (N). In wheat, TaNBP1 is identified to encode Gβ proteins that increase N uptake in response to nitrogen deprivation [16]. Similarly, in rice, the Gγ subunit encoding gene of rice, the dep1-1 allele increases the absorption and assimilation of nitrogen, and increases the harvest index and grain yield under moderate nitrogen fertilizer levels [17,18,19]. These studies have shown that wheat and rice G-proteins participate in the regulation of nitrogen absorption, transport, and assimilation, increasing nitrogen efficiency, and can be used as a potential biotechnology target for improving nitrogen efficiency. Unlike rice and wheat, the current understanding of the genetic basis of Arabidopsis G-protein in nitrogen efficiency remains at the level that it affects nitrogen-related gene expression. For example, gpa1-5 upregulates the expression of the nitrogen transport gene AtNRT2.1 [20] and participates in the response to nitrogen by regulating the configuration of roots under different nitrogen concentrations through interaction with the Atagb1 [21]. In addition, overexpression of AtAGG3 increases the expression of genes related to nitrogen uptake and transport [22]. However, the functions of G-protein genes in Brassica napus (B. napus) in mediating plant adaptation to the N-starvation stress are still largely unknown and need to be further investigated.
B. napus is an important oilseed crop. Nitrogen is a nutrient massively essential for plant growth, development, and production. For a long time, large amounts of N fertilizers have been applied to arable land around the world to achieve high yields of B. napus [23]. However, most of the N applied to the soil is lost because of nitrate leaching, ammonia volatilization, runoff, and denitrification, which has harmful effects on the environment [24,25]. Identification of genes involved in nitrogen signaling in B. napus and elucidation of gene expression patterns under low nitrogen conditions could provide new insights into the molecular mechanisms of plant tolerance to low nitrogen stress, as well as provide a theoretical basis for generating crop cultivars with improved nitrogen use efficiency. In this study, 21 G-protein genes in B. napus were identified and analyzed for molecular characterization, expression patterns, and expression patterns under low nitrogen conditions. Our results showed that all selected Gα genes and five C-type Gγ genes were extremely sensitive to low nitrogen stress.

2. Results

2.1. Identification and Analysis of G-Protein Genes in B. napus

Using the five G-protein protein sequences in Arabidopsis thaliana (A. thaliana) as queries, 21 G-protein genes were identified from B. napus, including two Gα subunit genes, six Gβ subunit genes, and 13 Gγ subunit genes (Table 1). The nomenclature used for B. napus G-protein genes was based on three known G-protein genes (BnGA1, BnGB1, and BnGG2—therein, we renamed BnGG2 as BnGG8, but BnGB1 was not retrieved in our result, so we did not select it in this article) [26,27,28] and the corresponding A. thaliana G-protein orthologs. Both BnGα full-length protein sequences were 383 amino acids, with a predicted molecular weight of 44.5 kda and an estimated isoelectric point of 5.78 (Table 1). Amino acid sequence alignments of BnGα with Gα proteins from A. thaliana and Rice showed 97.13–96.61% and 75.20–75.47% identity, respectively. Sequence comparison further confirmed the presence of five GTP-binding and GTP-hydrolyzing consensus sequences (G1–G5) and a myristoylated/palmitoylated lipid modification pattern in the N-terminal region, which is required for their plasma membrane localization. In addition, the conserved glutamine (Q) important for the GTPase activity of Gα proteins, the putative ADP ribosylation target (R) for cholera toxin, residue (G) for Gα and the RGS-box interaction were also present in both BnGα proteins (Figure S1A).
The BnGβ proteins were encoded by 327–378 amino acids, with a predicted molecular weight of 35.42–41.03 kda and an estimated isoelectric point of 6.66–7.12 (Table 1). The BnGβ proteins were highly conserved, with 90.21–94.69% and 73.56–76.25% identity to the Arabidopsis AtAGB1 and rice OsRGB1 proteins, respectively. The coiled-coil hydrophobic structure necessary for its N-terminal interaction with the Gγ subunit were conserved in all BnGβ proteins (Temple and Jones, 2007). Besides, the seven WD repeat motifs were also found to be present in all BnGβ proteins, except for in BnGB3, where the seventh WD was missing (Figure S1B).
Thirteen coding sequences of Gγ proteins in B. napus were highly divergent in size, ranging from 89–265 amino acids, with a predicted molecular weight of 9.95–28.96 kda and an estimated isoelectric point of 4.23–9.35 (Table 1). Amino acid sequence alignment of BnGγ proteins with Arabidopsis (AtAGG1, AtAGG2, and AtAGG3) and rice (OsRGG1, OsRGG2, OsGS3, OsDEP1, and OsGGC2) showed 26.32–94.00% identity with Arabidopsis Gγ proteins and 23.64–57.14% of sequence identity with rice Gγ proteins. Sequence comparison further showed that BnGG1, BnGG2, BnGG3, and BnGG4 were the closest homologs of AtAGG1 and OsRGG1; BnGG5, BnGG6, BnGG7, and BnGG8 were homologous to AtAGG2 and OsRGG2; and BnGG9, BnGG10, BnGG11, BnGG12, and BnGG13 were the homologs of AtAGG3, OsGS3, OsDEP1, and OsGGC2, respectively. Sequence alignment further revealed that BnGG1–BnGG8 contained the signature CAAX motif at its C-terminal end, which belonged to A-type Gγ proteins together with Arabidopsis AGG1, AGG2, and rice RGG1, whereas BnGG9–BnGG13 belonged to C-type Gγ proteins because of its large size and a very large number of cysteine residues in its C-terminal region. In addition, all BnGγ proteins included a DPLL motif with an important hydrophobic contact with the Gβ subunit protein and an N-terminal helix that forms a coiled-coil structure with Gβ, both of which are conserved in these plant species (Figure S1C). Similarly, we also identified 13 candidate G-protein homologs in Brassica oleracea (B. oleracea) from NCBI by the same method (Table S1).

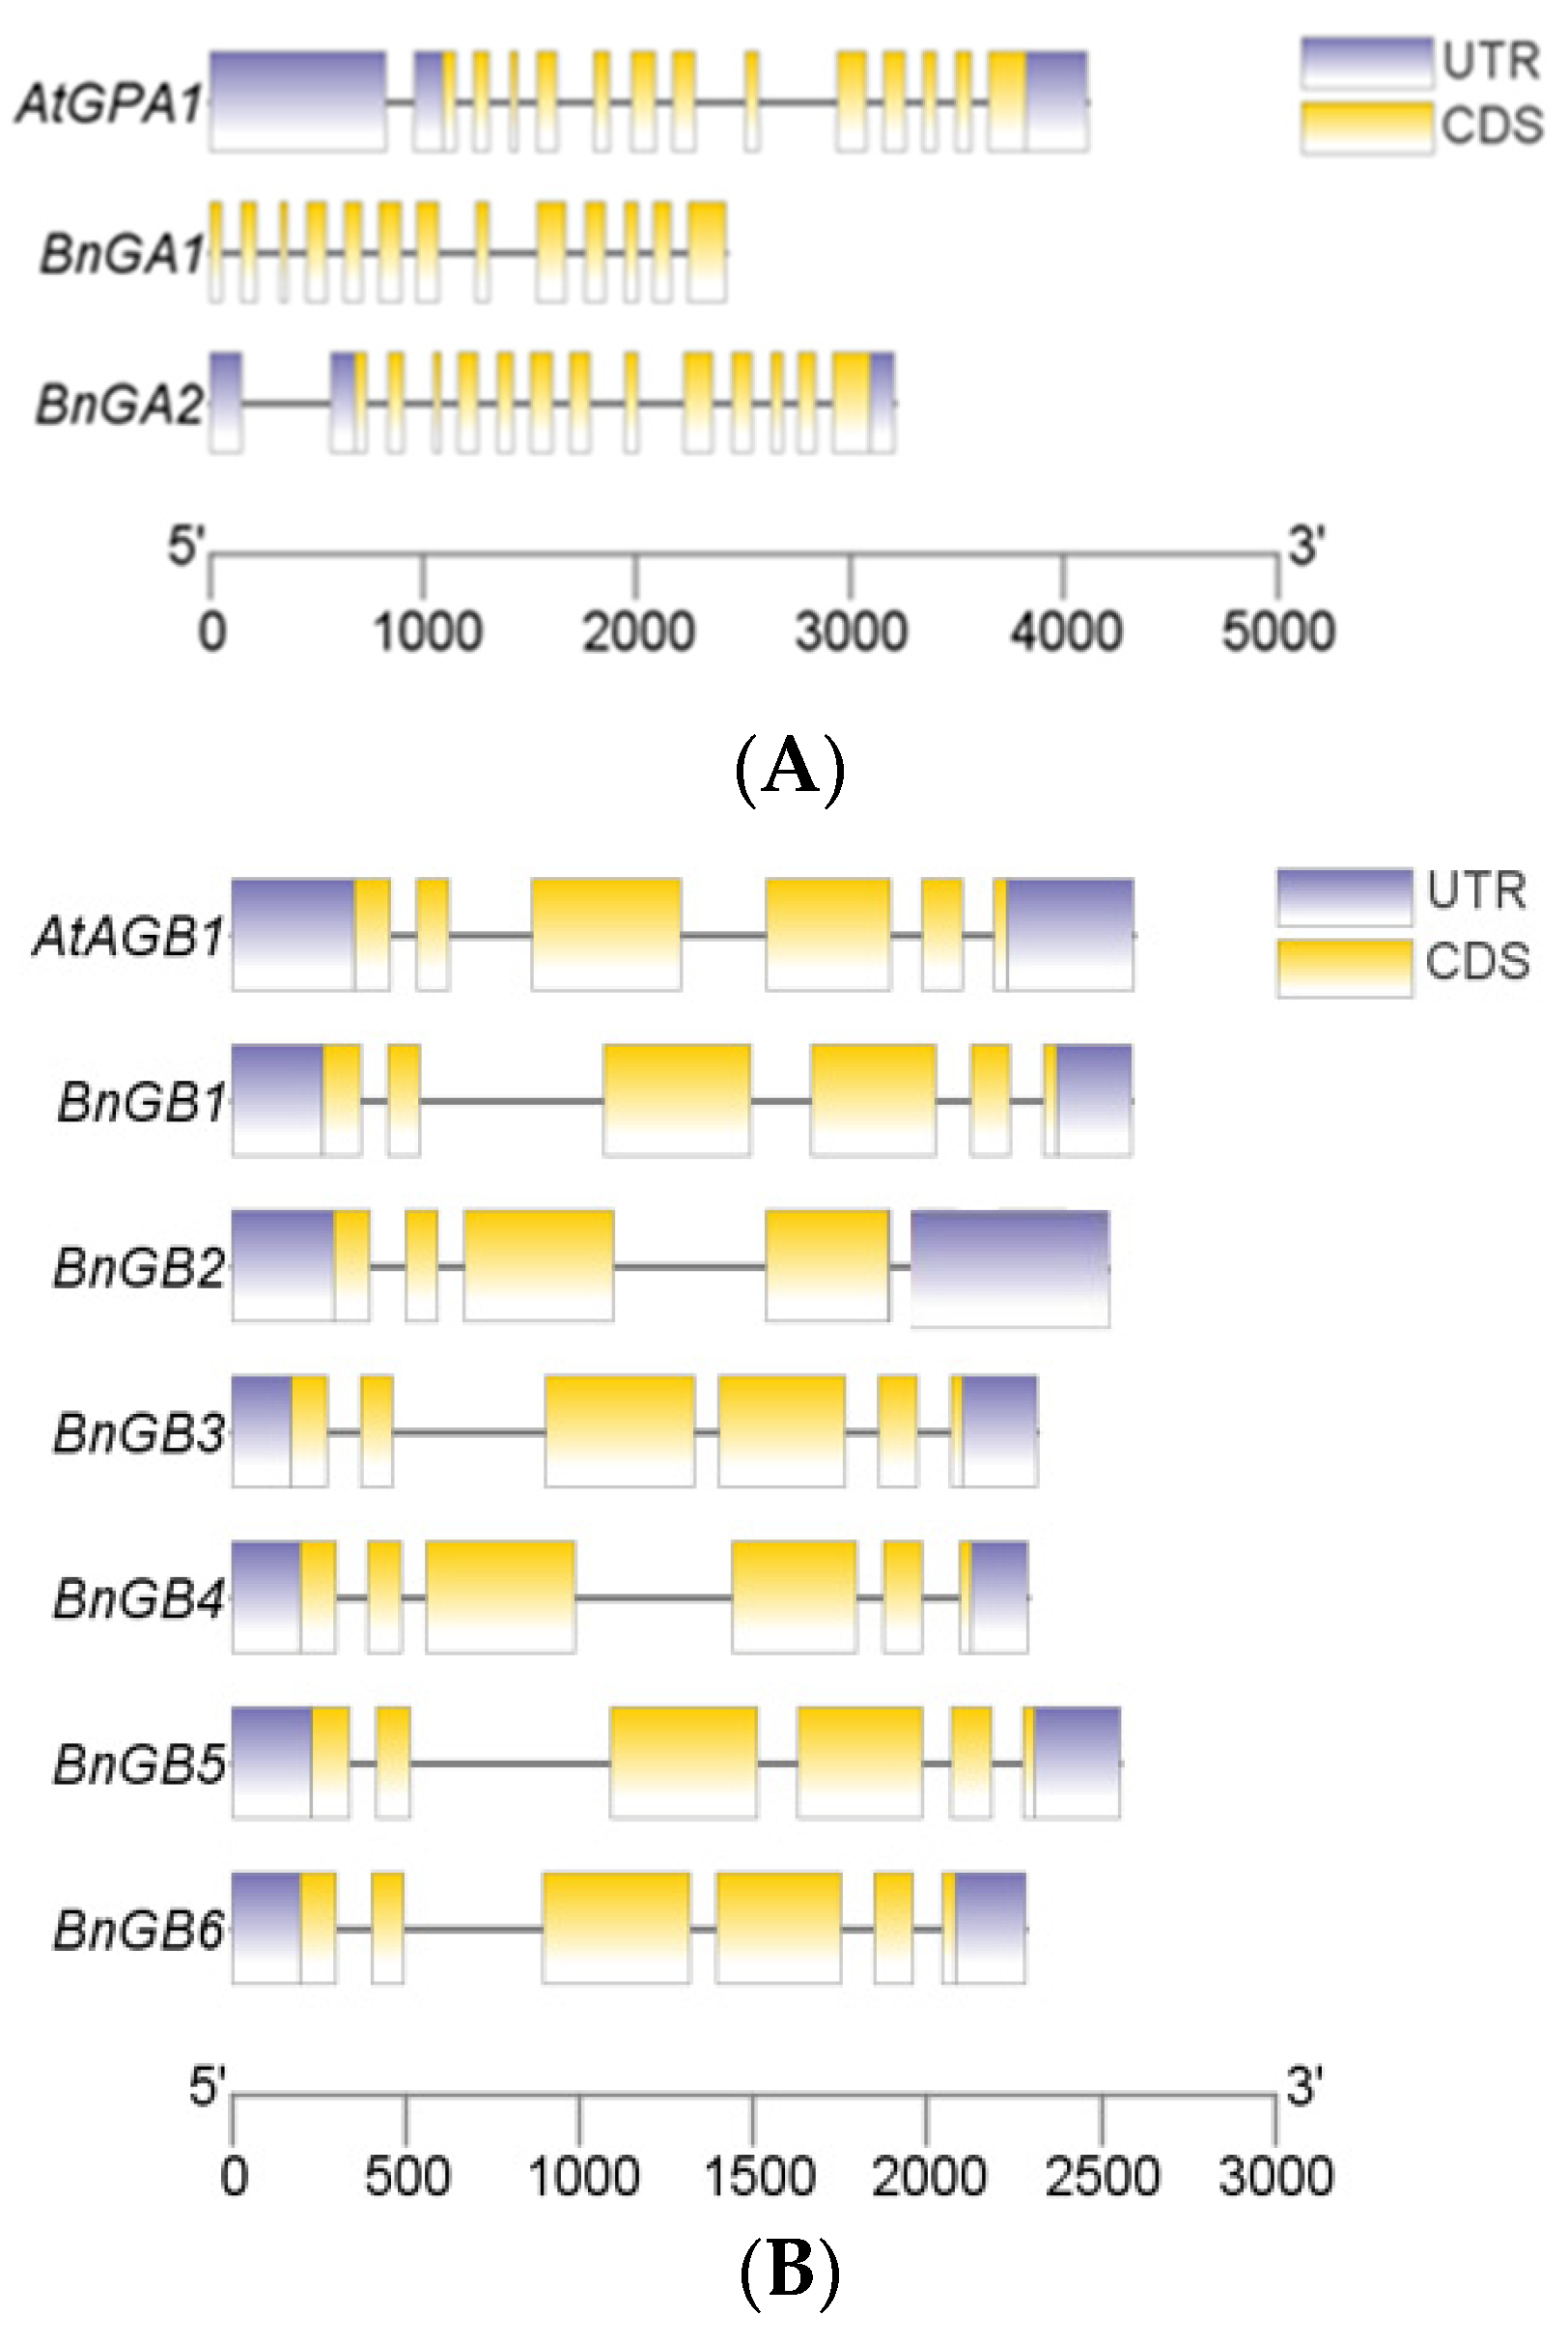
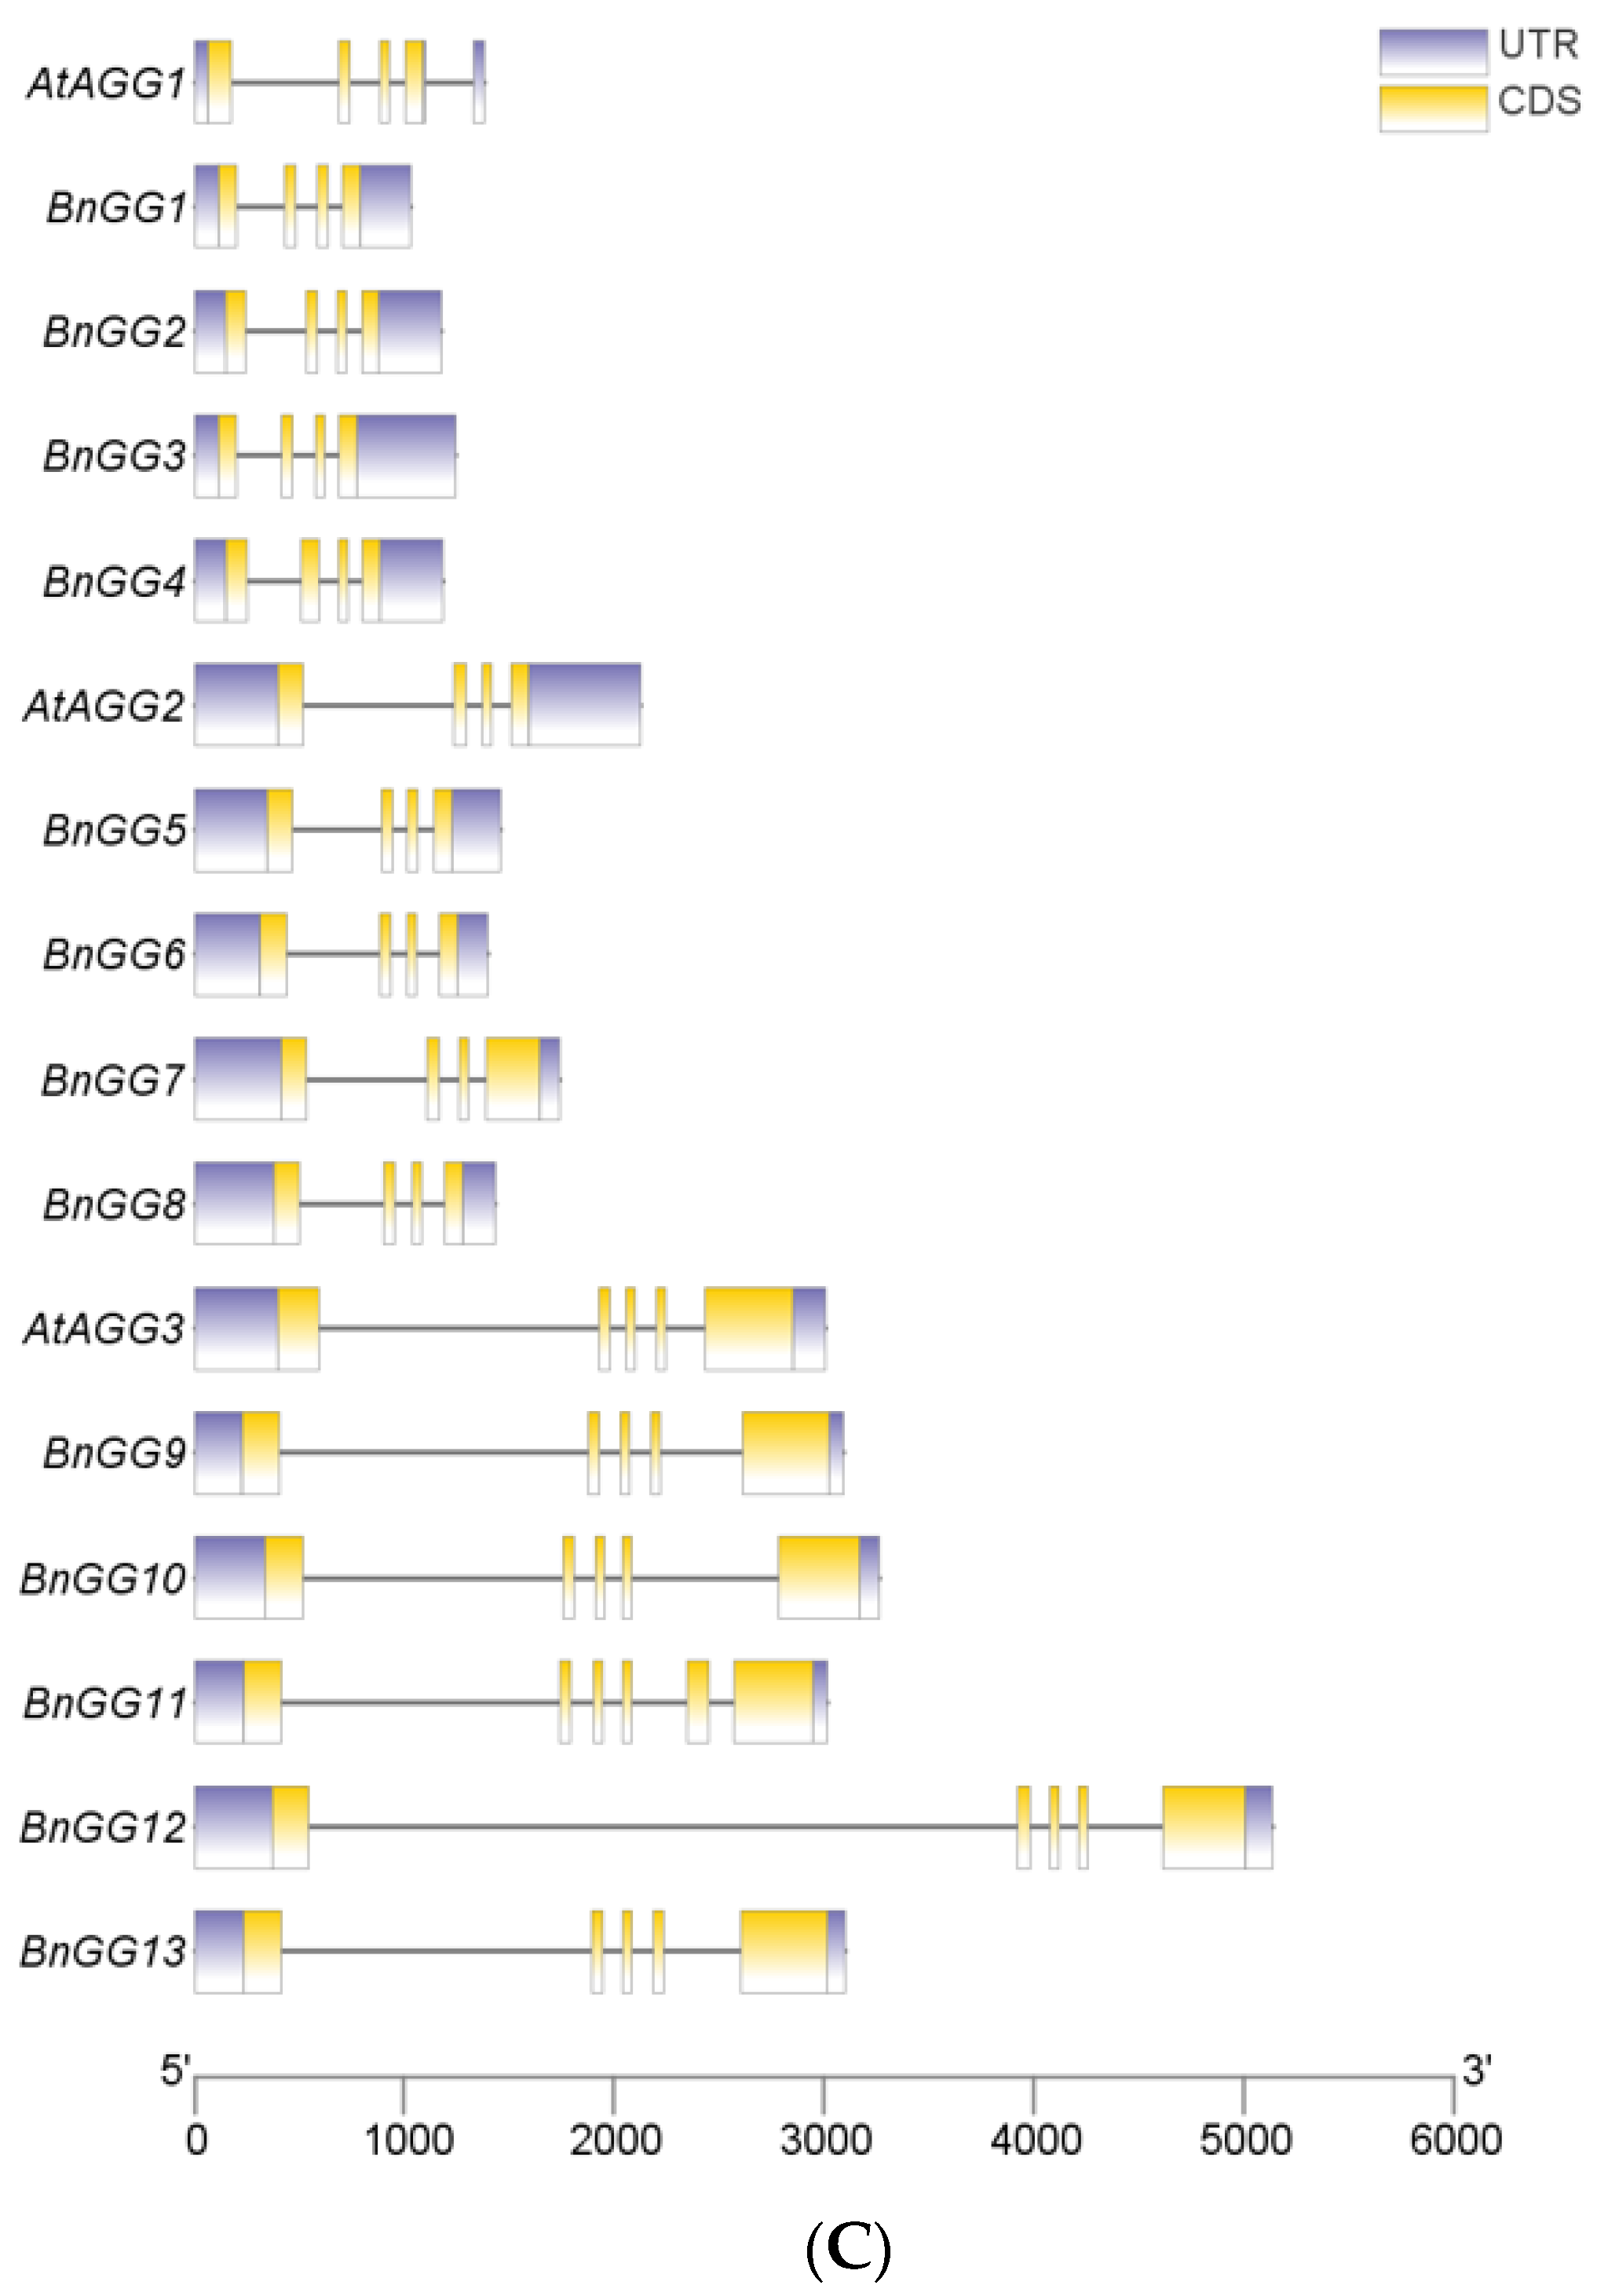
2.2. Gene Structure Analyses

To compare gene structures of G-protein between A. thaliana and B. napus, structures of introns/exons were determined by the alignment of genomic DNA with full-length cDNA of A. thaliana G-protein and B. napus G-protein. The similar gene structures were not only observed in the same G-protein subunits in B. napus, but also were found within G-protein homologs in B. napus and A. thaliana (Figure 1A–C). Among the B. napus G-protein genes, all BnGα genes contained 13 exons and 12 introns, and most BnGβ members contained 6 exons and 5 introns, except for BnGB2 (4 exons and 3 introns each). All A-type Gγ genes contained 4 exons and 3 introns, while members in C-type Gγ genes contained 5 exons and 4 introns, except for BnGG11 (6 exons and 5 introns).

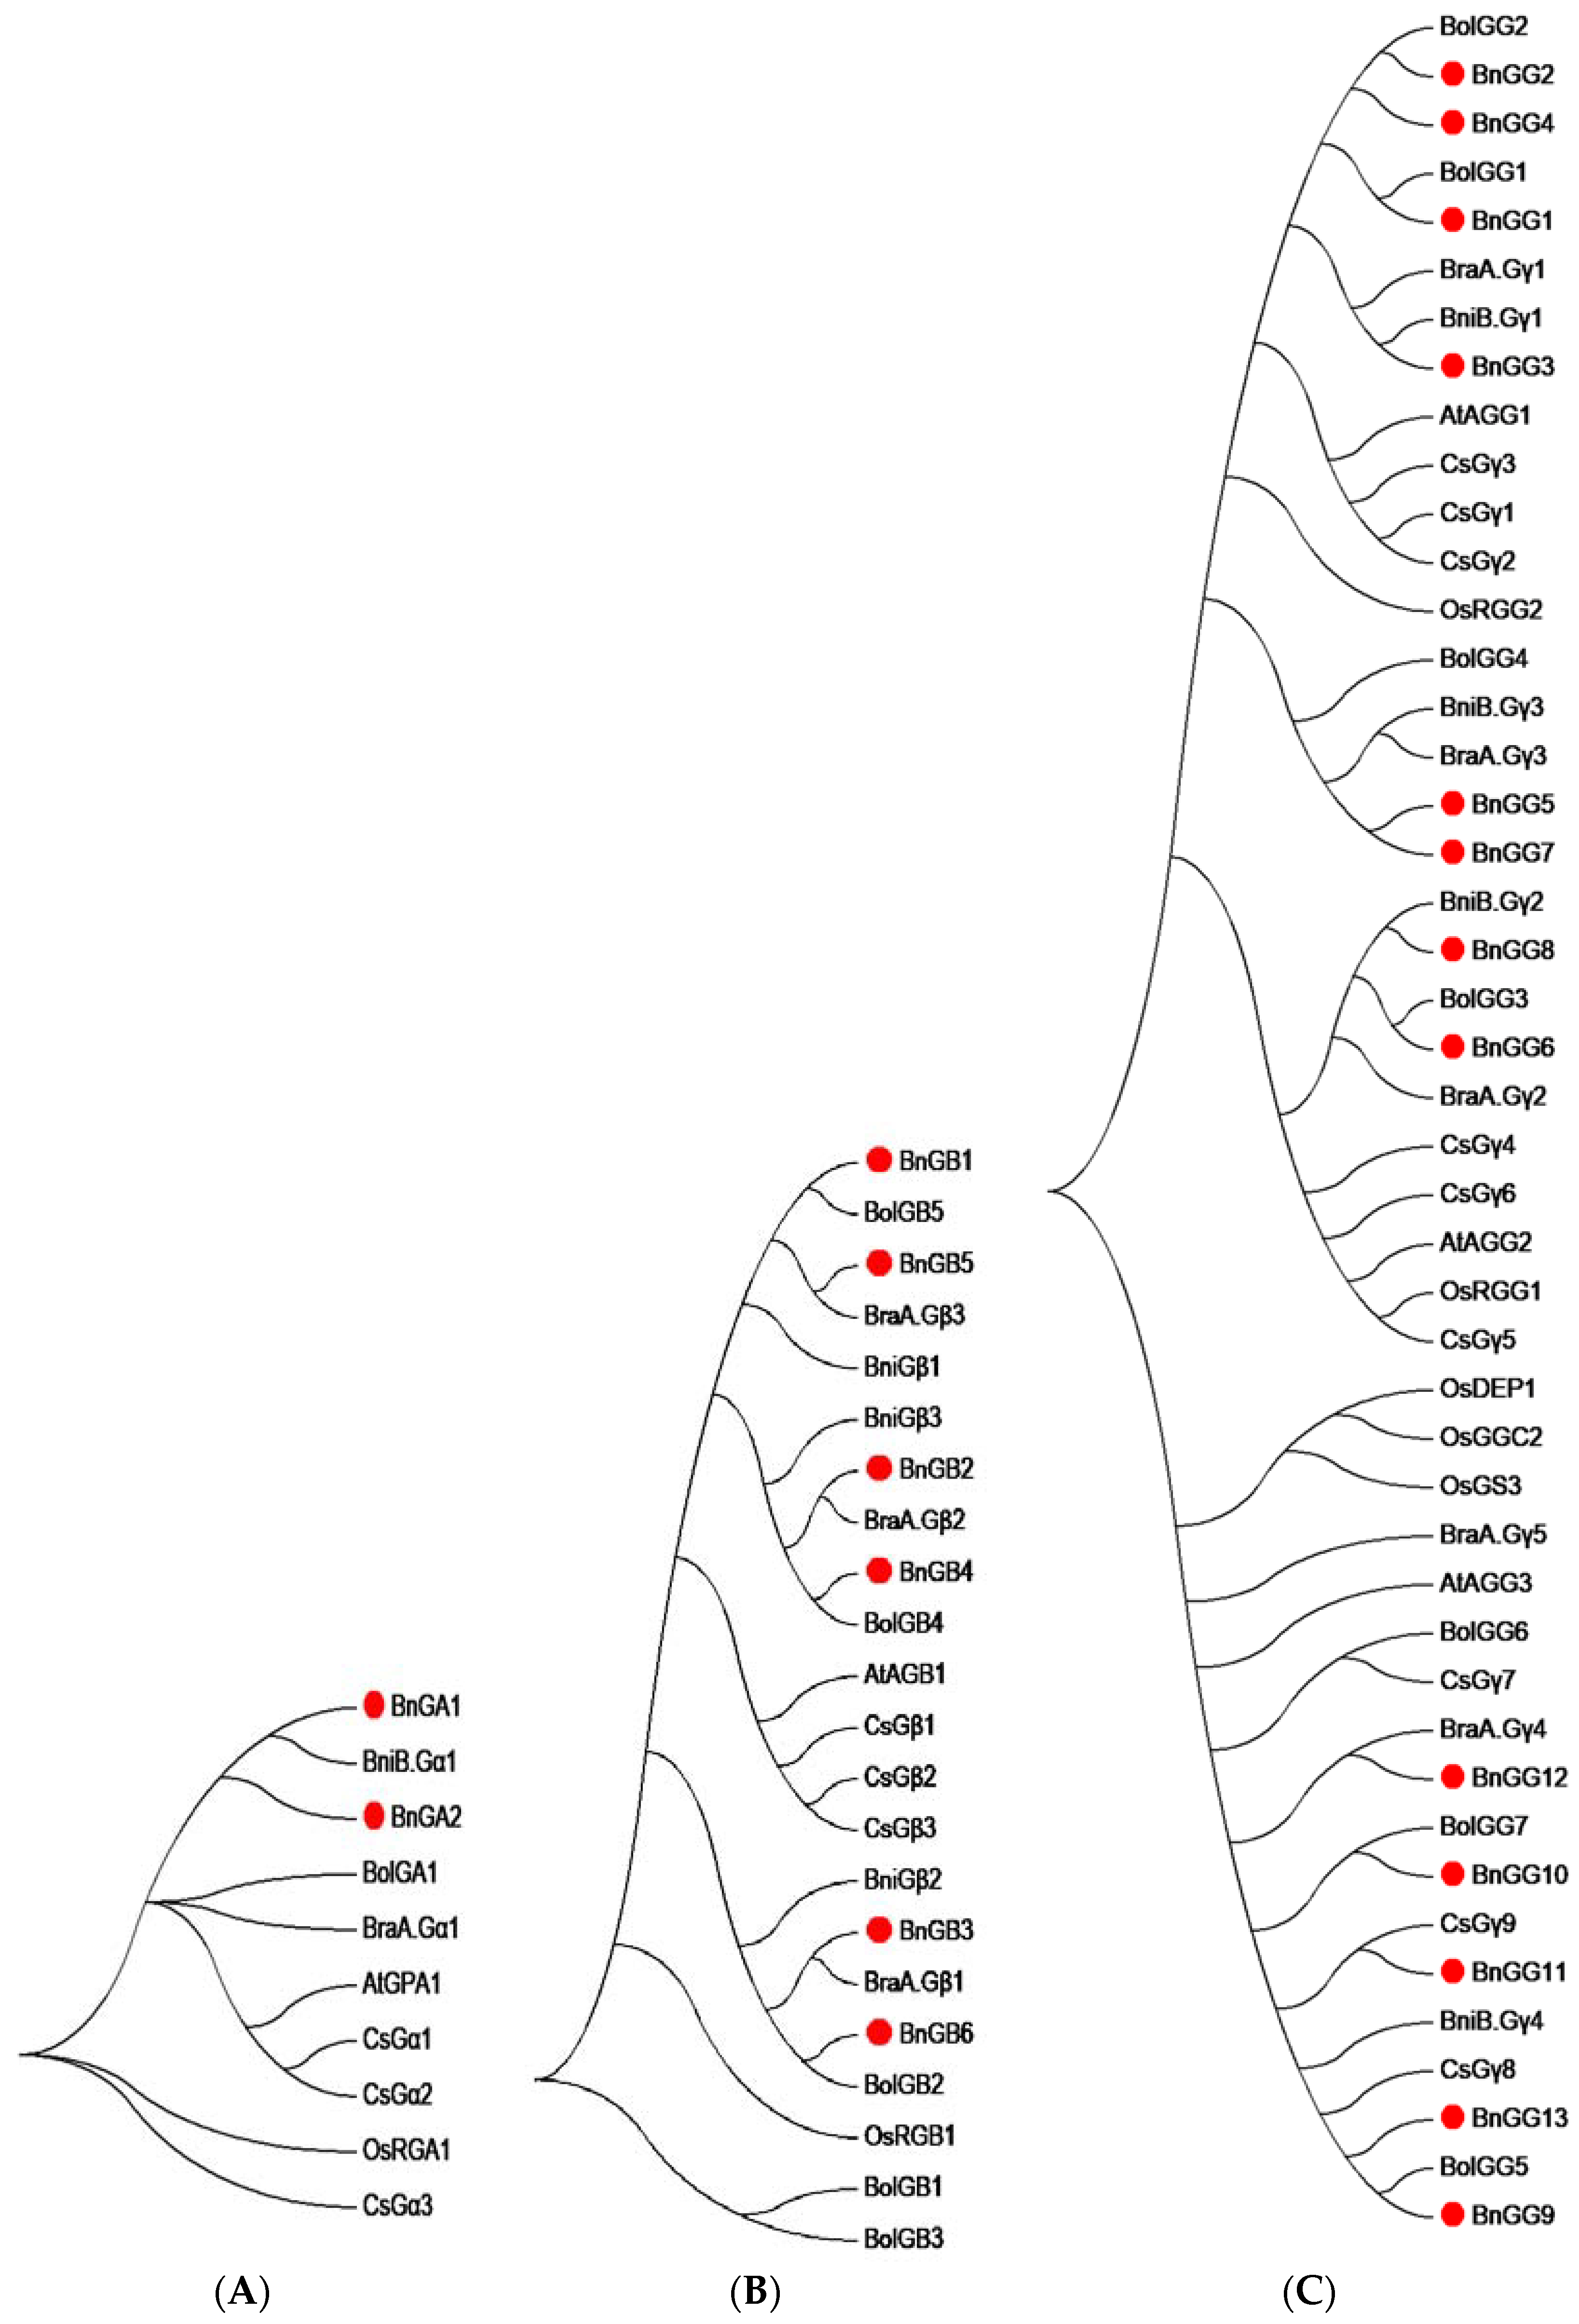
2.3. Phylogenetic Analysis of G-Protein

To analyze the evolutionary relationships of G-protein genes in Brassica napus, Brassica rape, Brassica oleracea, Brassica nigra (B. nigra), Arabidopsis, rice, and Camelina sativa, an unrooted phylogenetic tree was constructed using full length amino acid sequences. In total, Ga proteins with publicly reported G-protein sequences from other plant species showed that BnGA1 and BnGA2 proteins were evolutionarily conserved with BniGα1 (Figure 2A). Upon phylogenetic analysis, all six BnGβ subunits also shared the same clade with the hybridization of two progenitor species, Brassica rapa and Brassica oleracea [29] (Figure 2B). The relative position of the six BnGβ subunits in the phylogenetic tree further suggested that the six divergent copies of Gβ subunits could be a consequence of a whole genome triplication event [30]. Gγ proteins was divided into two groups, with the A-type Gγ proteins (BnGG1–BnGG8) and C-type Gγ proteins (BnGG9–BnGG13). Moreover, BnGG9–BnGG13 proteins were grouped together with Arabidopsis AtAGG3 and rice Gγ protein DEP1, which were recently reported to be yield- and nitrogen-related (Figure 2C) [14,17,18,19,22]; therefore, we conducted subcellular localization to further explore the function of C-type G-protein. First, BnGG10, BnGG11, and BnGG12 were selected randomly, transient expression of fused with GFP was performed in tobacco (Figure 3), and these proteins were located in cell membranes, which was consistent with the Arabidopsis [31]. In a word, a total of 21 G-proteins were identified in Brassica napus, with a possibility of 156 Gαβγ combinations, which made it a highly diverse G-protein signaling network, while the model plants Arabidopsis and rice have only three and five such combinations [4].

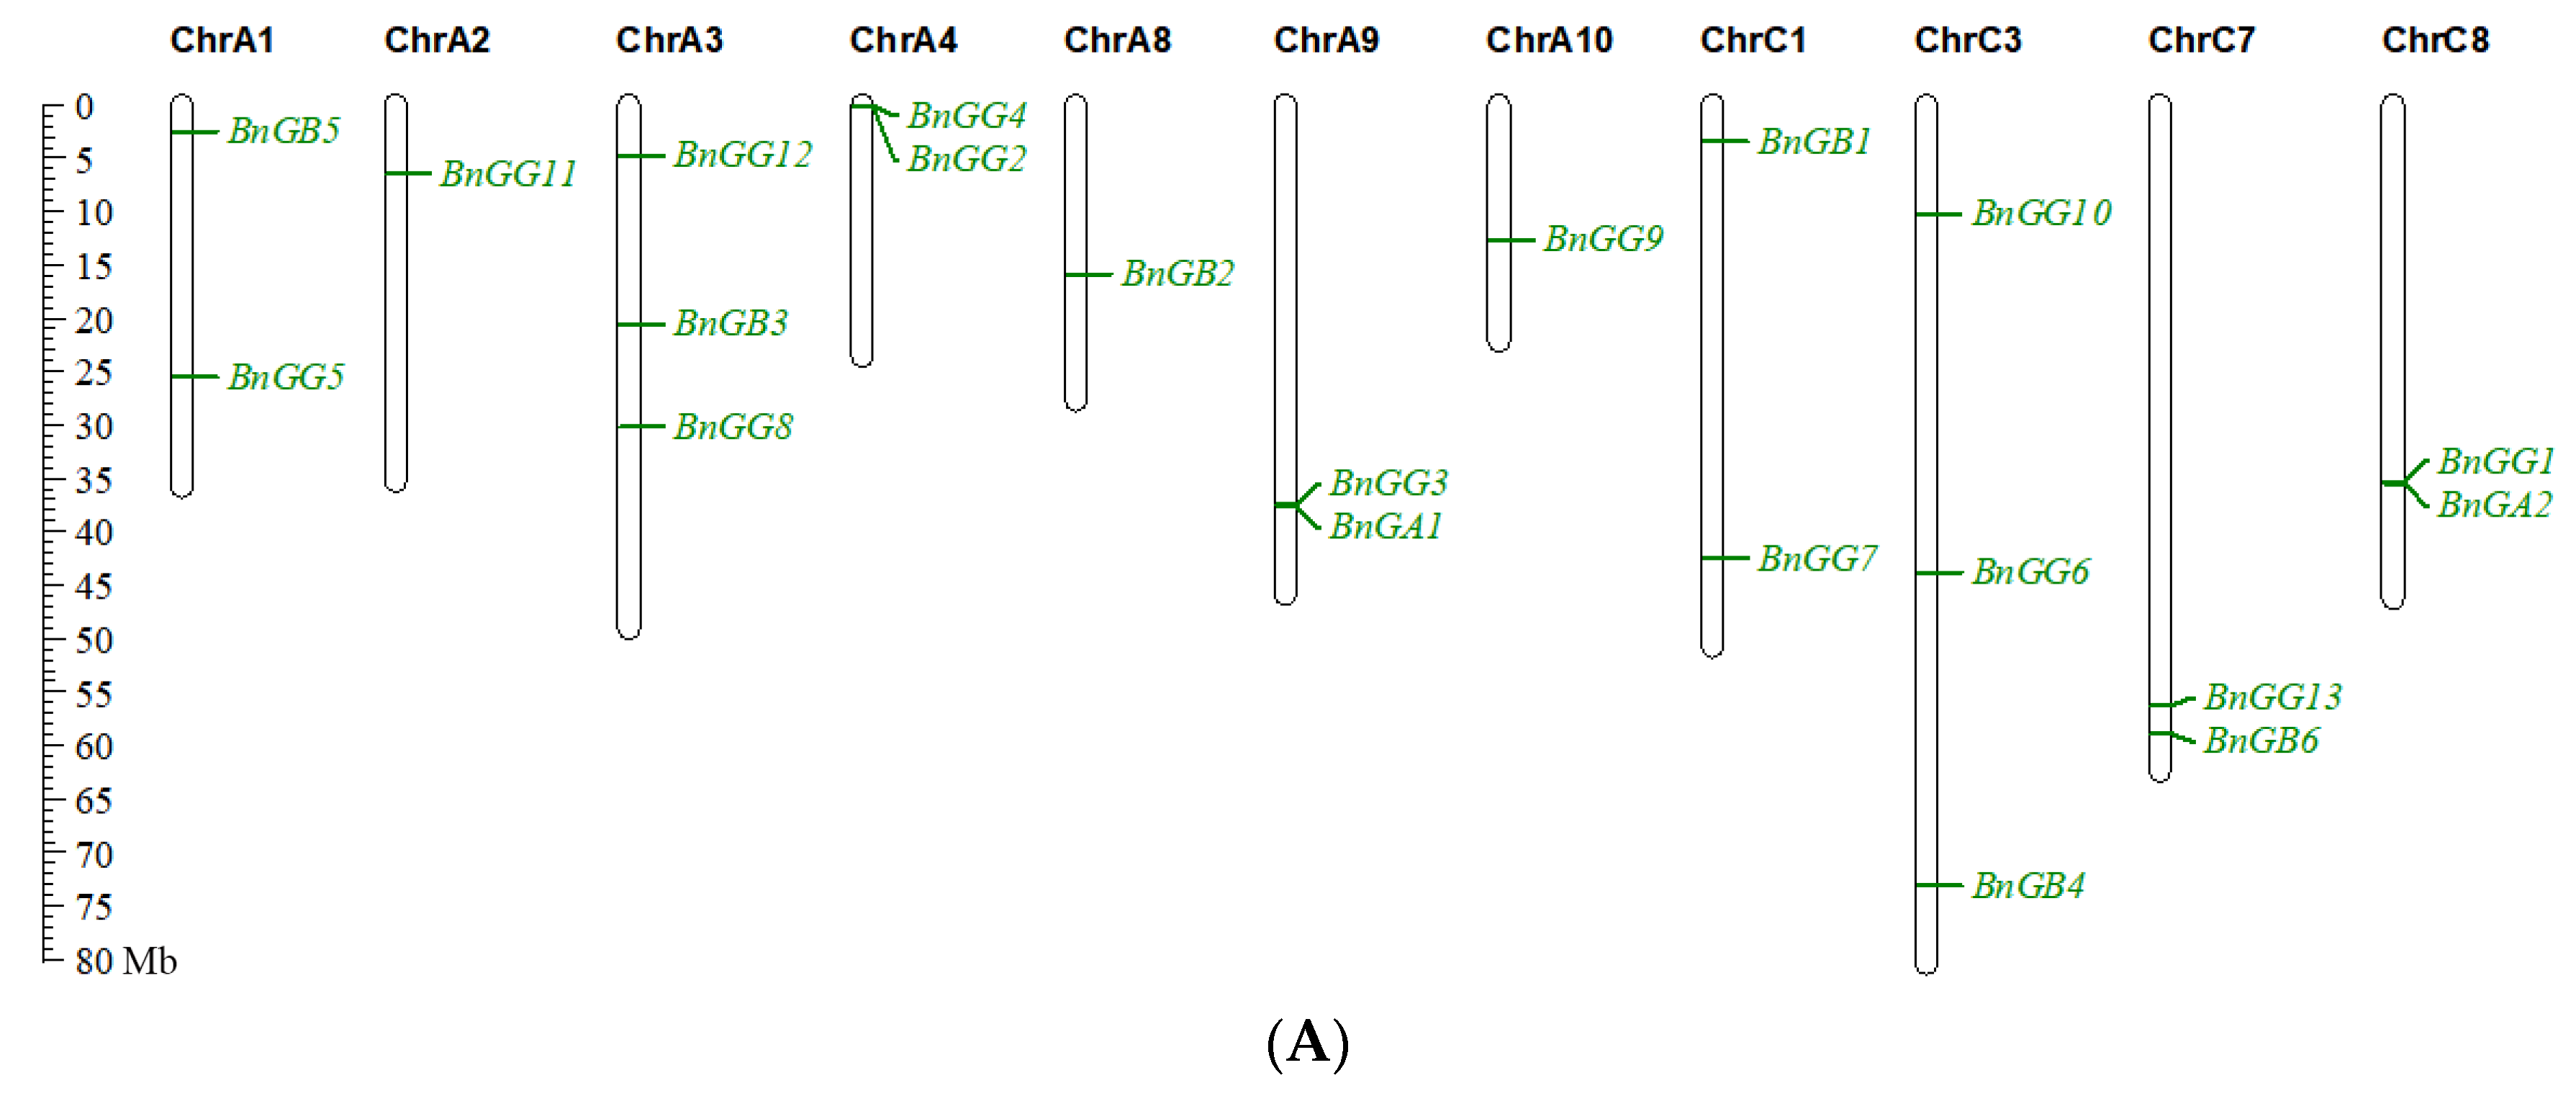
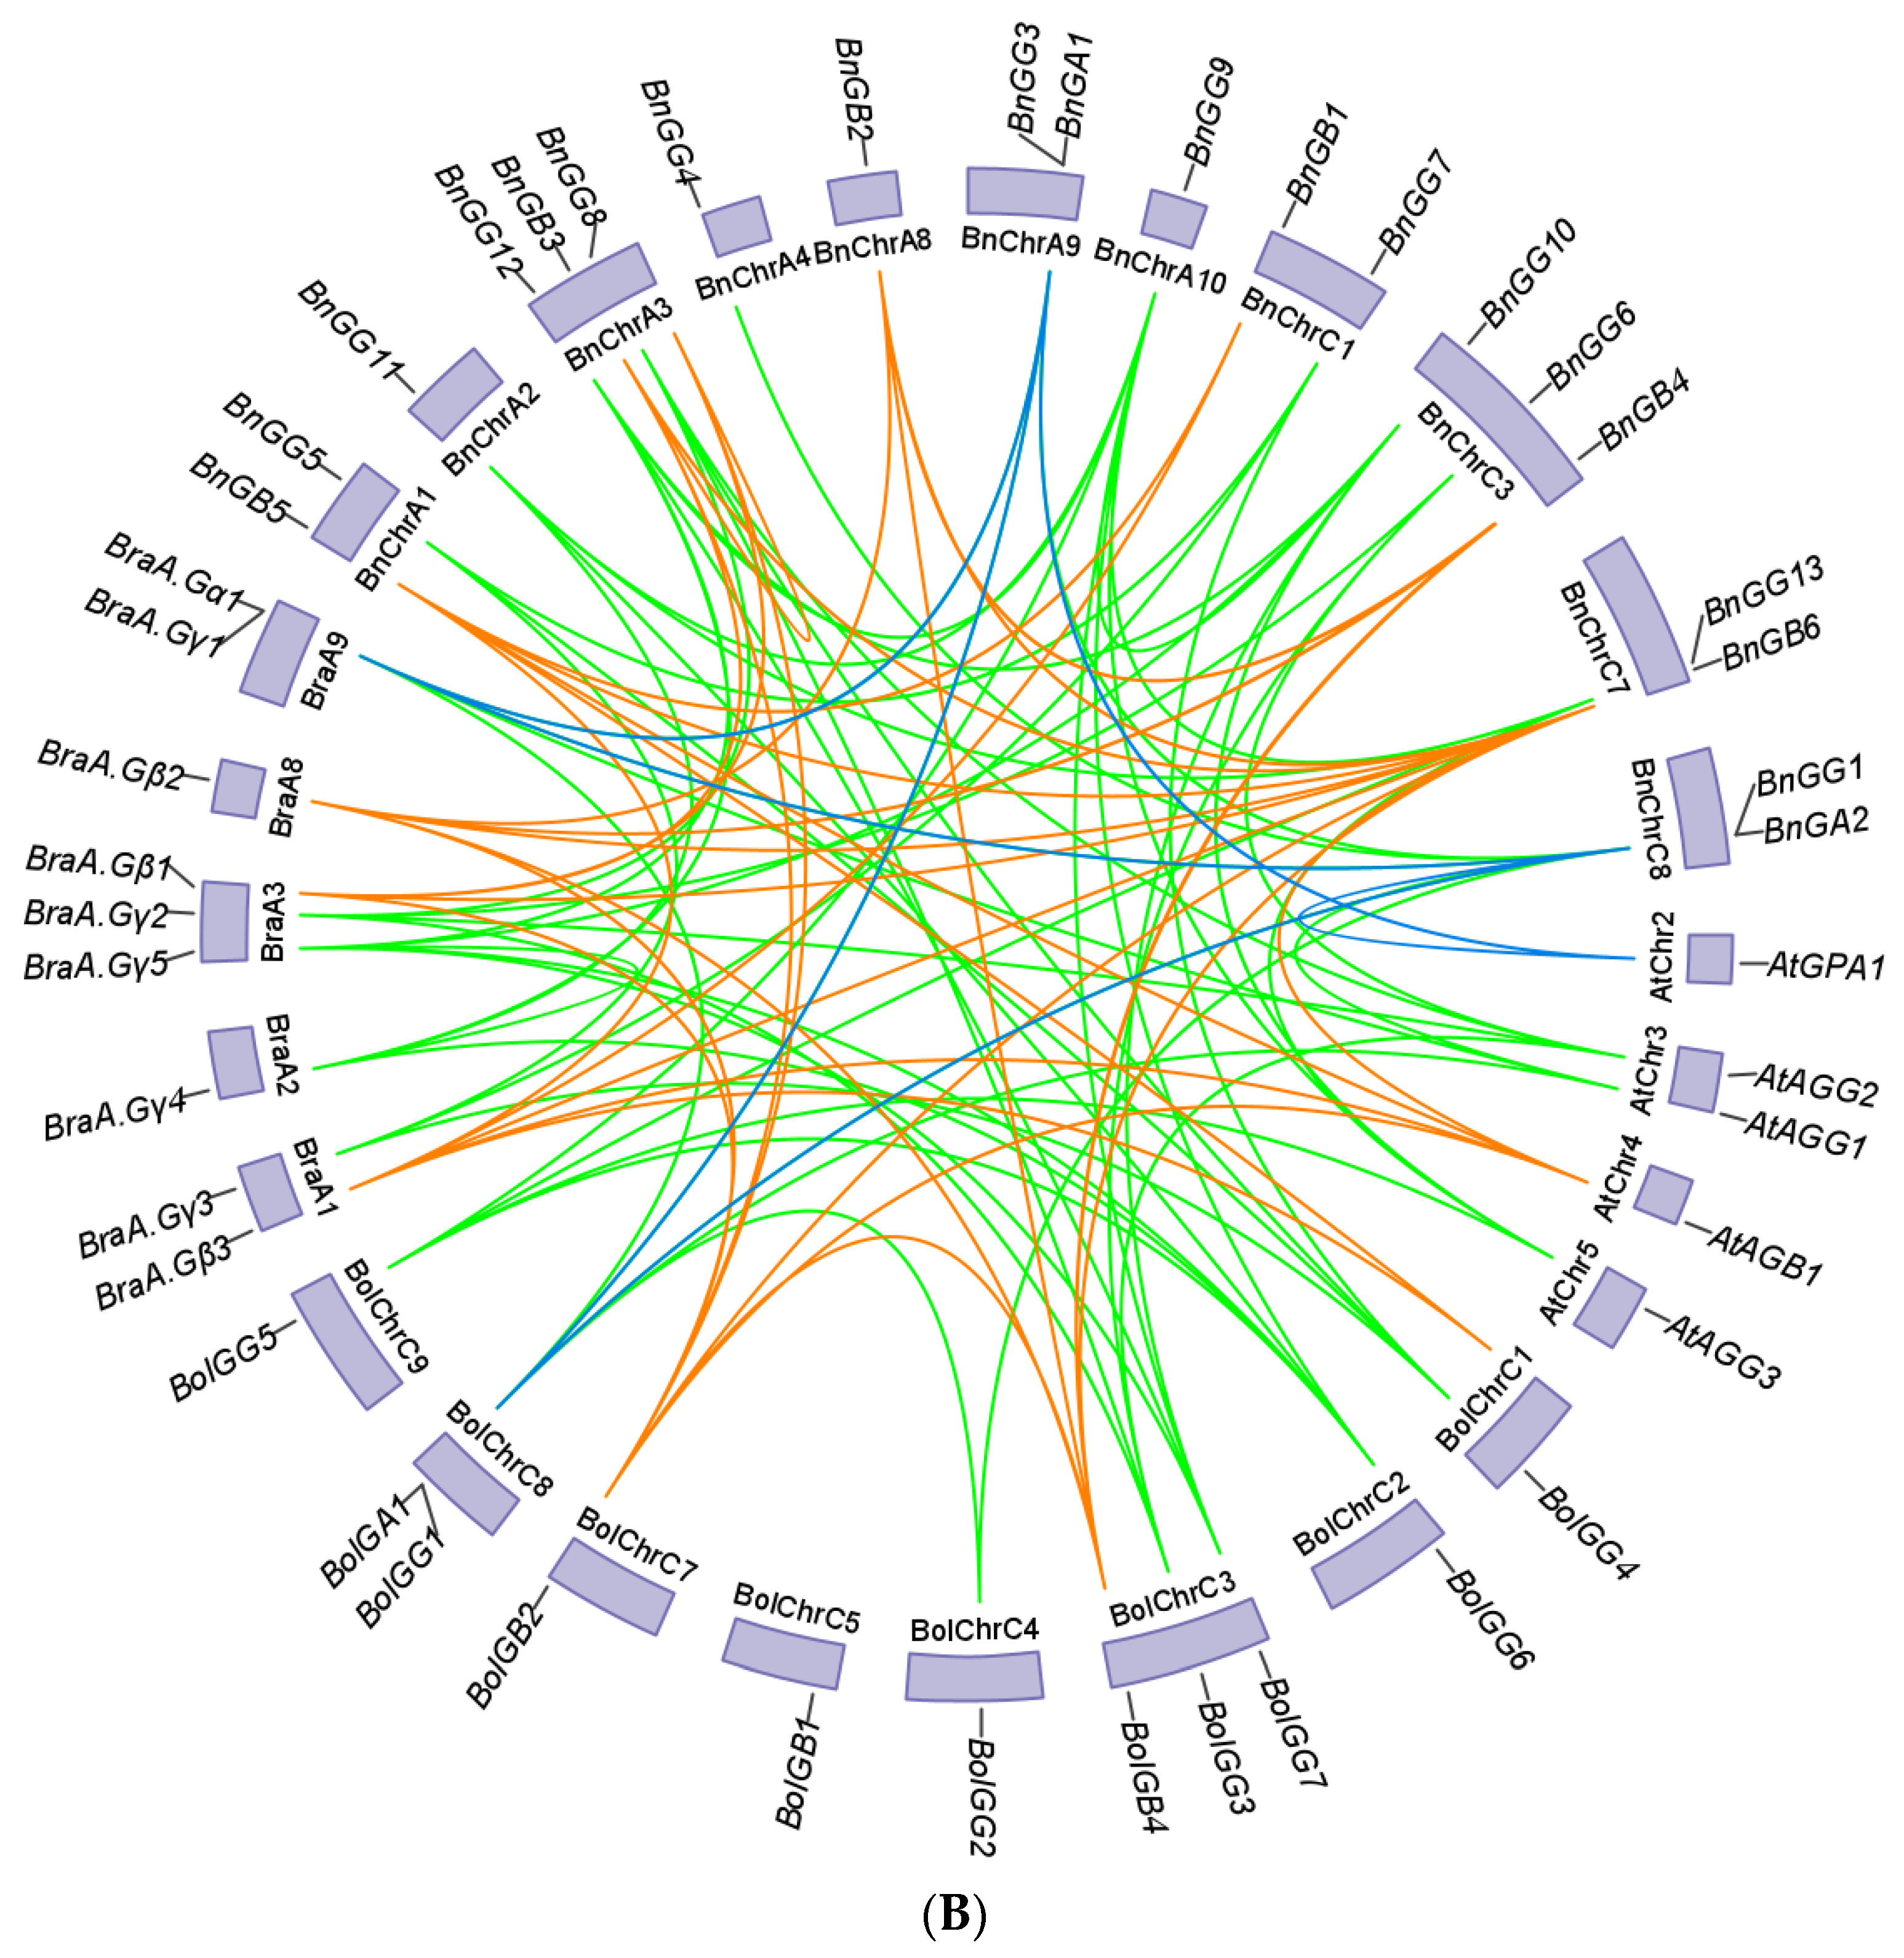
2.4. Chromosomal Location and Gene Duplication of G-Protein

The 21 G-protein genes were distributed on 11 Brassica napus chromosomes randomly (Figure 4A), with 12 genes in the A subgenome and 9 genes in the C subgenome. Three G-protein genes each were identified on chromosomes A3 and C3, and two were found on A1, A4, A9, C1, C7, and C8. Only one G-protein gene was found on chromosomes A2, A8, and A10. In addition, the synteny relationship of G-protein genes was analyzed using the genome information from B. napus, A. thaliana, B. rapa, and B. oleracea (Figure 4B). A total of 12 pairs of syntenic paralogs and 78 pairs of syntenic orthologs were found in these genomes. Eight, one, and three pairs of G-protein syntenic paralogs were obtained in B. napus, B. rapa, and B. oleracea, respectively, and none in A. thaliana. Ten pairs of G-protein syntenic orthologs were observed between B. napus and A. thaliana, 23 pairs of G-protein syntenic orthologs were observed between B. napus and B. rapa, and 27 between B. napus and B. oleracea. In addition, 11 pairs of G-protein syntenic orthologous genes were observed between B. rapa and B. oleracea, suggesting possible chromosomal rearrangement and reduction of the G-protein gene code after a whole genome triplication event.
Of 21 identified B. napus G-protein duplicated pairs, none of the genes were confirmed to be tandem duplicated genes. Additionally, nine genes (BnGB2–BnGB5 and BnGG1, BnGG4, BnGG9, BnGG12, and BnGG13) were segmentally duplicated genes (Table S2). Interestingly, all segmental duplicated genes belonged to Gβ and Gγ, which accounted for 42.9% of the G-protein genes in B. napus. Based on the above results, it could be inferred that segmental duplication played a predominant role in the expansion of the B. napus G-protein family.
To better understand the evolutionary constraints acting on the G-protein gene family, the nonsynonymous rate (Ka), synonymous rate (Ks), and evolutionary constraint (Ka/Ks) ratio were estimated for B. napus (Figure 5) [32]. Our results showed that the Ka/Ks ratio for Gα and Gγ subunit genes were <1, indicating that these genes are functionally conserved and had experienced strong purifying selective pressure during evolution, while the Ka/Ks ratio for the homologous genes in the Gβ subunit genes was >1, which might have been subjected to positive pressures after the whole genome triplication (WGT) event in B. napus, making BnGβ subunit genes’ functions more diverse. In addition, although the Ka/Ks ratio of Gγ subunit genes was <1, the Ka/Ks ratio of A-type Gγ subunit genes was two or three times larger than that of C-type Gγ subunit genes, indicating that A-type Gγ subunit genes had evolved more diverse functions.

2.5. Analysis of Cis-Acting Element in G-Protein Genes’ Promoters

Cis-elements are short, specific DNA sequences that bind with TFs to regulate the transcription of genes. Cis-elements identification is a key step in understanding transcriptional regulation mechanisms. To further study the potential regulatory mechanisms of B. napus G-protein genes, we screened for cis-elements in the 2000 bp upstream promoter sequences of these genes using PlantCARE [33]. Forty-seven types of cis-elements were detected in the promoters of G-protein genes. Except for essential cis-elements, the others (light response elements, five hormone responsive elements, four abiotic stress response elements, MBSI, O2-site, circadian, MSA-like, CAT-box, and GCN4_motif) were analyzed (Figure 6) and 42 physiological-process-related cis-elements were observed in most of the G-protein promoters. All G-proteins possessed at least one light-responsive element. Gα subunit members might be associated with stress responsiveness, especially BnGA1, which had one or more stress-response elements. Gβγ as a dimer might have a potential response under abscisic acid, MeJA, and anaerobic responsiveness. In addition, BnGB2, BnGB4, and BnGG3 contained more hormone-responsive elements, while BnGB5, BnGB6, and BnGG12 contained more stress-responsive elements compared with other Gβ and Gγ subunit members. In any event, the cis-element analysis illustrated that B. napus G-protein genes could respond to different physiological processes involving hormone regulation, stress responsiveness, and aging.

2.6. Expression Patterns of G-Protein Genes in Different Tissues

Using the RNA-seq data, a heatmap of 21 G-protein genes, represented in different tissues and organs in B. napus, was established by TBtools (Figure 7). Calculation of the expression levels of the G-protein genes revealed diverse expression patterns in different subunits. All Gα subunit genes (BnGA1 and BnGA2), were barely expressed in any tissues or organs. Three Gβ subunit genes including BnGB1, BnGB4, and BnGB5 were highly expressed in all of the tissues, while BnGB2 and BnGB6 showed high expression levels only in some tissues, and BnGB3 was barely expressed in any tissue. All A-type Gγ subunit genes, except for BnGG2, BnGG4, and BnGG7, showed relatively high expression levels in all organs. Most C-type Gγ subunit genes (BnGG9, BnGG11, and BnGG13) were barely expressed in any tissues or organs. However, BnGG10 and BnGG12 were highly expressed in vegetative organs, such as flowers and ovules, which were grouped together with AGG3, GS3, and DEP1 genes related to the regulation of grain yield in the phylogenetic tree (Figure 2C). In general, members of Gβ and A-type Gγ subunits often shared different expression patterns, whereas Gα and C-type Gγ genes were relatively conserved, which was consistent with their Ka/Ks ratio.

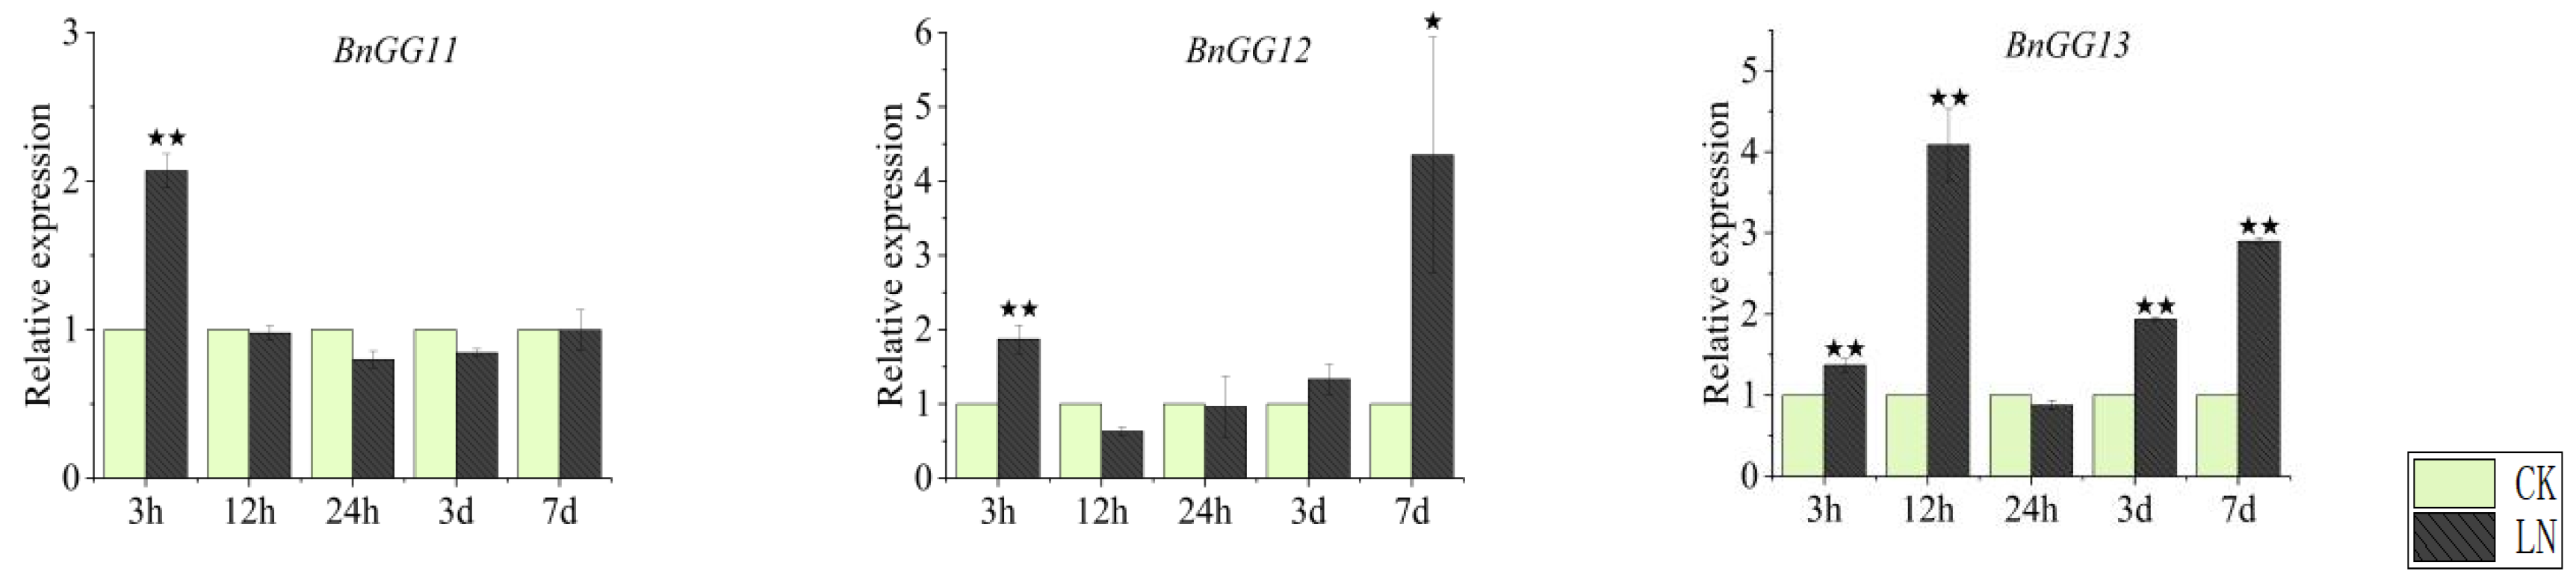
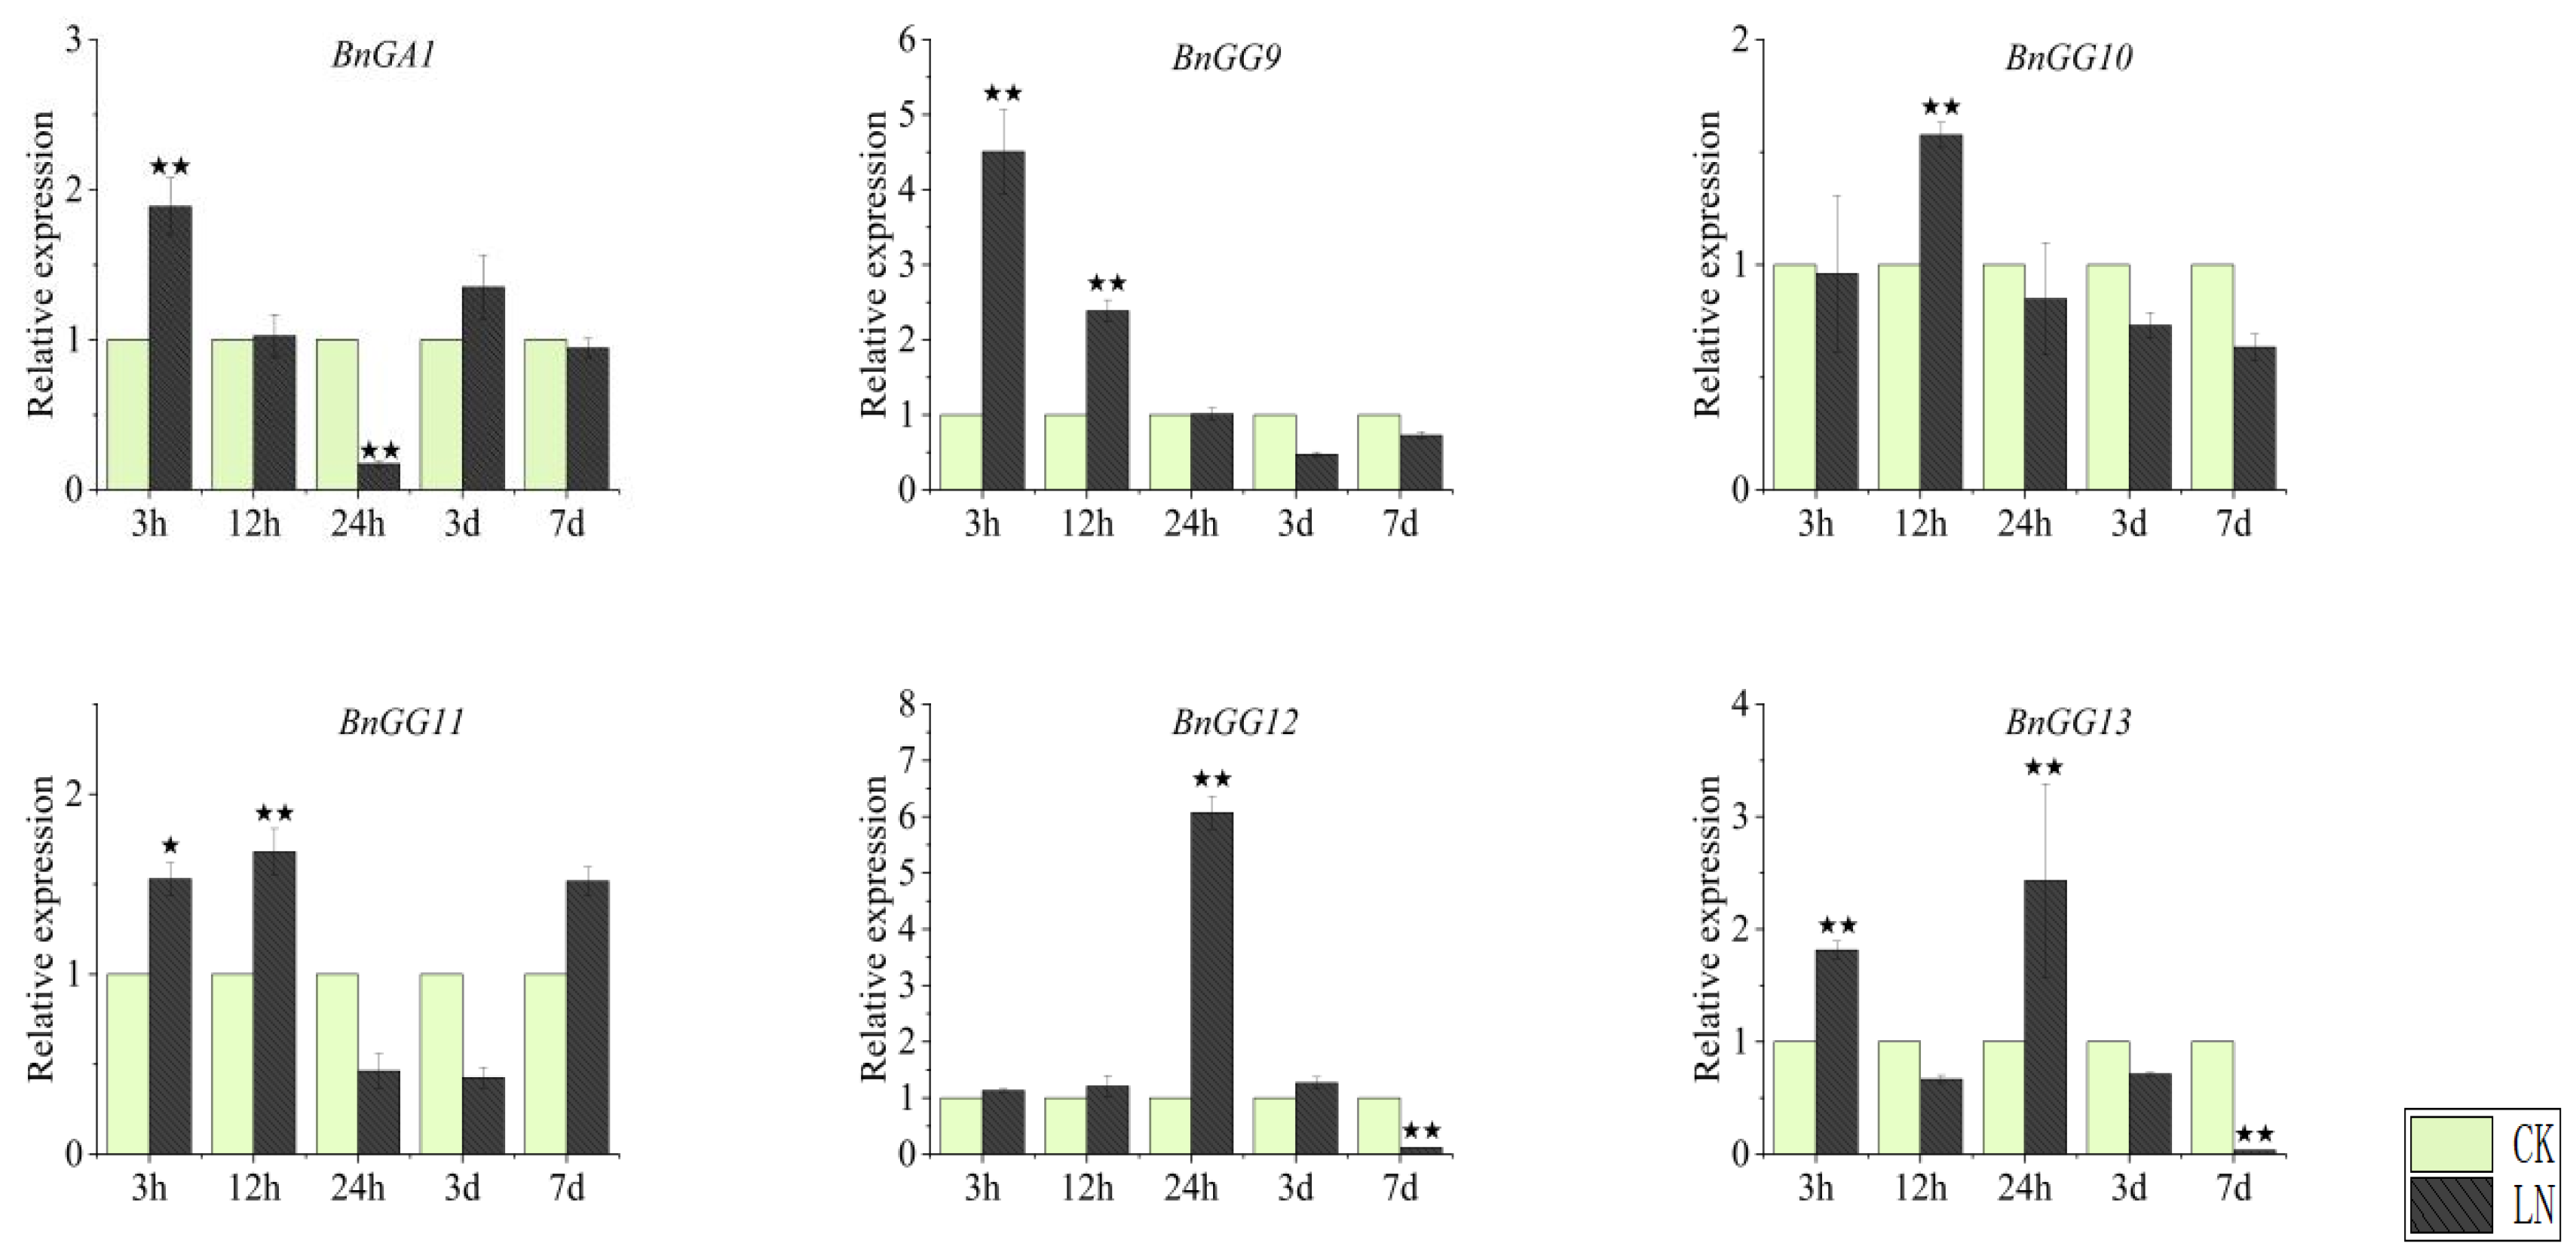
2.7. Expression Patterns of G-Protein Genes under Nitrogen Deficiency

To investigate the expression patterns of B. napus G-protein genes under nitrogen deficiency, seedling leaves and seedling roots were harvested at various time points (0 to 7 d) after culturing in a Hoagland nutrient solution with high nitrogen (normal N condition, CK) and low nitrogen (N deficient condition, LN) content. In leaves (Figure 8), under LN treatment, Gα subunit gene BnGA1 was significantly downregulated immediately and subsequently showed no significant difference with CK after 24 h. BnGG10 was significantly downregulated first and then significantly upregulated after 24 h. However, the other members of other C-type Gγ subunit genes were significantly upregulated first, and subsequently BnGG9 showed a downregulated expression and BnGG11 showed no significant difference with CK, while BnGG12 and BnGG13 remained upregulated.
However, the responses of most G-protein genes in roots to LN treatment were highly different to those in leaves (Figure 8 and Figure 9). Under LN treatment, BnGA1 was more sensitive to nitrogen deficiency under 3 h and 24 h treatment in roots than in leaves, which was upregulated at 3 h, downregulated at 24 h, and had no significant difference with CK in other time points (Figure 8 and Figure 9). Among five C-type Gγ subunit members, all were upregulated first and then three (BnGG9, BnGG10, and BnGG11) showed no significant difference with CK, while BnGG12 and BnGG13 were downregulated after LN treatment (Figure 9).

3. Discussion

G-protein, as a key signal transducer, is an evolutionarily conserved signaling intermediate that regulates signal recognition and transduction, hormone perception, and stress responses [10]. Studies on plants’ G-proteins have improved the knowledge of essential physiological and agronomic properties. With the availabilities of the whole genome sequences of many plants, several G-protein families have been identified, such as five, seven, nine, and eight G-protein genes in Arabidopsis, rice, B. rape, and B. nigra, respectively [5,8,34,35]. However, little is known about the G-protein family in B. napus except for three known genes (BnGA1, BnGB1, and BnGG2) that have been reported [26,27,28]. The current study identified 21 B. napus G-protein family genes and analyzed their structure, chromosomal location, phylogeny, gene duplication, Ka/Ks ratio, cis-elements, and expression patterns in different tissues and nitrogen deficiency. The study provides comprehensive information on the B. napus G-protein gene family and will aid in understanding the functional divergence of G-protein genes in B. napus.
B. napus has a polyploid genome formed by interspecific crosses between B. rapa and B. oleracea [36], B. rapa has nine G-protein genes (one Gα, three Gβ, and five Gγ) [9], and B. oleracea has thirteen G-protein genes (one Gα, five Gβ, and seven Gγ) (Table S1), thus B. napus is expected to have multiple G-protein members. Brassica lineage have undergone a whole-genome triploidy (WGT) event with many genomic arrangements and gene losses, which greatly shaped the genomic framework of existing Brassica species [37]. Although, the WGT event shaped the Gβ genes (six homologs) and Gγ genes (thirteen homologs) in B. napus, only two Gα genes (BnGA1 and BnGA2) were identified in the present study. Interestingly, as found in B. napus, there was only one typical Gα subunit gene in both the B. rapa (Bra007761) and B. oleracea (LOC106307271) progenitors.
Gene structure plays a crucial role in the evolution of several gene families. In the present study, BnGα proteins might have maintained functional conservation, with highly similar gene structures, conserved domains, and close phylogenetic relationships between the two Gα subunit genes. Similarly, six BnGβ proteins and thirteen BnGγ proteins retained the necessary structural domains (WD40 and GGL, respectively), but the sequences of some BnGβ and BnGγ genes had been separated from each other. For example, BnGB2 contained fewer exons than the remaining BnGβ genes; BnGG11 had one more exon than the other C-type Gγ. Therefore, functional divergence might have occurred in these duplicated genes, including neo- and sub-functionalization. Accordingly, these were also confirmed by different Ka/Ks ratios of each subunit genes; Gα had the most conservative evolution and Gβ had the most positive evolution. Interestingly, although Gγ had evolved conservatively, A-type Gγ had evolved faster than C-type Gγ. Thus, all these results suggested that the functions of Gβ and A-type Gγ might be diversified, and Gα and C-type Gγ proteins might have retained functional conservation.
The expression patterns of G-protein genes in different tissues have been investigated in many species, such as Arabidopsis, rice, B. rapa, and B. nigra [8,34,38]. In B. rapa and B. nigra, Gα genes (BraA.Gα1 and BniB.Gα1) express ubiquitously and maintain an almost similar expression pattern across different developing stages [8,34]. In rice, OsRGA1 are highly expressed in leaves of seedlings, representing the most abundant OsRGA1 transcripts [38]. BjuA.Gα1 in B. juncea are highly expressed in leaves, roots, male catkins, xylem, seeds, and female catkins [15]. Gβγ have ubiquitous, overlapping but distinct expression profiles across plant development [34]. Thus, there is no uniform gene expression pattern for plant G-protein genes. According to the RNA-seq data of B. napus (Figure 6), although the two canonical BnGα genes retained an almost low expression profile across different tissue types, the multiple members of the BnGβ and BnGγ subunit genes exhibited an incongruous spatio-temporal expression pattern in various tissues, indicating that different BnGβγ heterodimers might have diverse functions across plant growth and development. In the current study, BnGB1 and BnGB5 were highly and indiscriminately expressed in all organs, such as flower, ovule, pistil, silique. Similar expression levels with several A-type Gγ genes (BnGG1, BnGG5, BnGG3, BnGG6, and BnGG8) were also found in B. napus. Interestingly, in recent years, the C-type Gγ subunit genes have been shown to regulate organ development, seed size and shape, and oil production in plants [13,14,17,18,19,22,39,40]. Similar to previous reports [8,34], in this study, C-type Gγ subunit genes (BnGG10 and BnGG12) showed specific expression activity in flower, ovule, and pistil, the main source organ during the podding and flowering stage in B. napus, suggesting that BnGG10 and BnGG12 genes might be involved in seed development.
G-protein genes involved in the response to nitrogen have been reported in several plants [16,17,18,19,20,21]. In Arabidopsis, GPA1 and GCR1 cooperatively regulate the nitrate response [20]. In rice, DEP1, a Gγ subunit-encoded protein, can efficiently balance carbon and nitrogen metabolism and thus increase tiller and seed number while improving nitrogen use efficiency [17,18,19]. In wheat, TaNBP1, a gene encoding a Gβ subunit, is adapting to nitrogen starvation by regulating nitrogen acquisition [16]. Thus, we selected some genes with high homology within previous studies. Because the genes with high homology of wheat Gβ subunit gene (TaNBP1) in B. napus displayed annotation without the key word “guanine nucleotide-binding subunit” and BnGA2 had no specific primer, we chose BnGA1 and five C-type Gγ genes with high homology. In this study, we found that all G-protein genes we chose were sensitive to N starvation, either highly expressed or suppressed in leaves and roots. Interestingly, in roots, all G-protein were upregulated in the initial period under low nitrogen (Figure 9). These upregulated G-protein genes might play a key role in nitrogen uptake and utilization in response to the short time demand for nitrogen in B. napus during low nitrogen. However, BnGA1 was suppressed in leaves, providing insights that BnGA1 might be improving nitrogen absorption in roots during low nitrogen. Of these C-type Gγ subunit genes, BnGG9 and BnGG11 were highly expressed in the first 3 h, and BnGG10 and BnGG12 were highly expressed in 3 d and 7 d, only the BnGG13 were highly expressed in leaves during 3 h–7 d (Figure 8). These suggested that C-type Gγ subunit genes, especially BnGG13, might have been involved in coordinating the N balance of leaves during various periods, for storing nitrogen to coordinate leaf growth and photosynthesis, or for increasing nitrogen partitioning to promote plant growth and improve yield. The different expression profiles of these G-protein genes in roots and leaves after nitrogen-deficiency treatment suggested that these C-type Gγ subunit members had experienced sub-functionalization during the polyploidy evolution of B. napus, pointing to different nitrogen utilization mechanisms among B. napus G-proteins.
Compared with the expression pattern represented by RNA-seq data, the expression profile generated by qRT-PCR was not completely equal to that. The difference of expression pattern might be caused by the fact that these genes were involved in stress responses. Similar to a previous study [8], most C-type BnGγ are the barely abundant transcripts among Gγ genes across all the tissue types tested, whereas it was preferentially upregulated during nitrogen-stress conditions.
In summary, a genome-wide analysis of the B. napus G-protein family was performed and 21 B. napus G-protein genes were identified. Analyses of G-protein genes on gene structures, protein character, phylogeny, chromosomal location, synteny, cis-elements, and expression patterns in different organs and nitrogen stress were conducted to define their biological functions. We found that G-protein genes had various expression patterns, and all Gα and five C-type Gγ genes were extremely sensitive to nitrogen deficiency. This provides insights into the biological functions of B. napus G-protein genes in response to nitrogen deficiency.

4. Materials and Methods

4.1. Identification of the G-Protein Family Members in Brassica napus Genome

The whole Brassica napus and Brassica oleracea protein sequence was downloaded from NCBI (https://www.ncbi.nlm.nih.gov/genome/?term=Brassica+napus, accessed on 26 July 2020). To identify Brassica napus G-protein candidates, a BLASTP-algorithm-based [41] search using Arabidopsis G-protein amino acid sequences as queries was conducted with an e-value ≤ 1 × 10⁻²⁰. To avoid missing probable G-protein members, the hidden Markov model (HMM) analysis [42] was used for the search. We downloaded the HMM profiles of Gα (PF00503), Gβ (PF00400), and Gγ (PF00631) from the Pfam protein family database (http://pfam.xfam.org/, accessed on 26 July 2020) and used it as the query (p < 0.001) to search the B. napus protein sequence data. Additionally, keywords “guanine nucleotide-binding protein” were employed to search against NCBI. After removing all of the redundant sequences, the output putative G-protein protein sequences were submitted to Pfam (http://www.ebi.ac.uk/Tools/pfa/pfamscan/, accessed on 26 July 2020) and SMART (http://smart.embl-heidelberg.de/, accessed on 26 July 2020) to confirm the conserved Gα (G-alpha), Gβ (WD40), and Gγ (GGL) domain. All of the non-redundant and high-confidence genes were assigned as B. napus G-proteins. These G-protein genes were named on the basis of known B. napus G-protein genes (BnGA1, BnGB1, and BnGG2) [26,27,28] and the corresponding Arabidopsis G-protein orthologs.
The same methods were applied to identify the candidate G-proteins in B. oleracea genomes in NCBI.

4.2. Sequence Analysis and Structural Characterization

All the B. napus G-protein sequences were submitted to ExPASy (http://web.expasy.org/protparam/, accessed on 26 July 2020) to predict the number of amino acids, molecular weights, and theoretical isoelectric points (pI).
TBtools was used to count the map of the exon/intron structures [43].

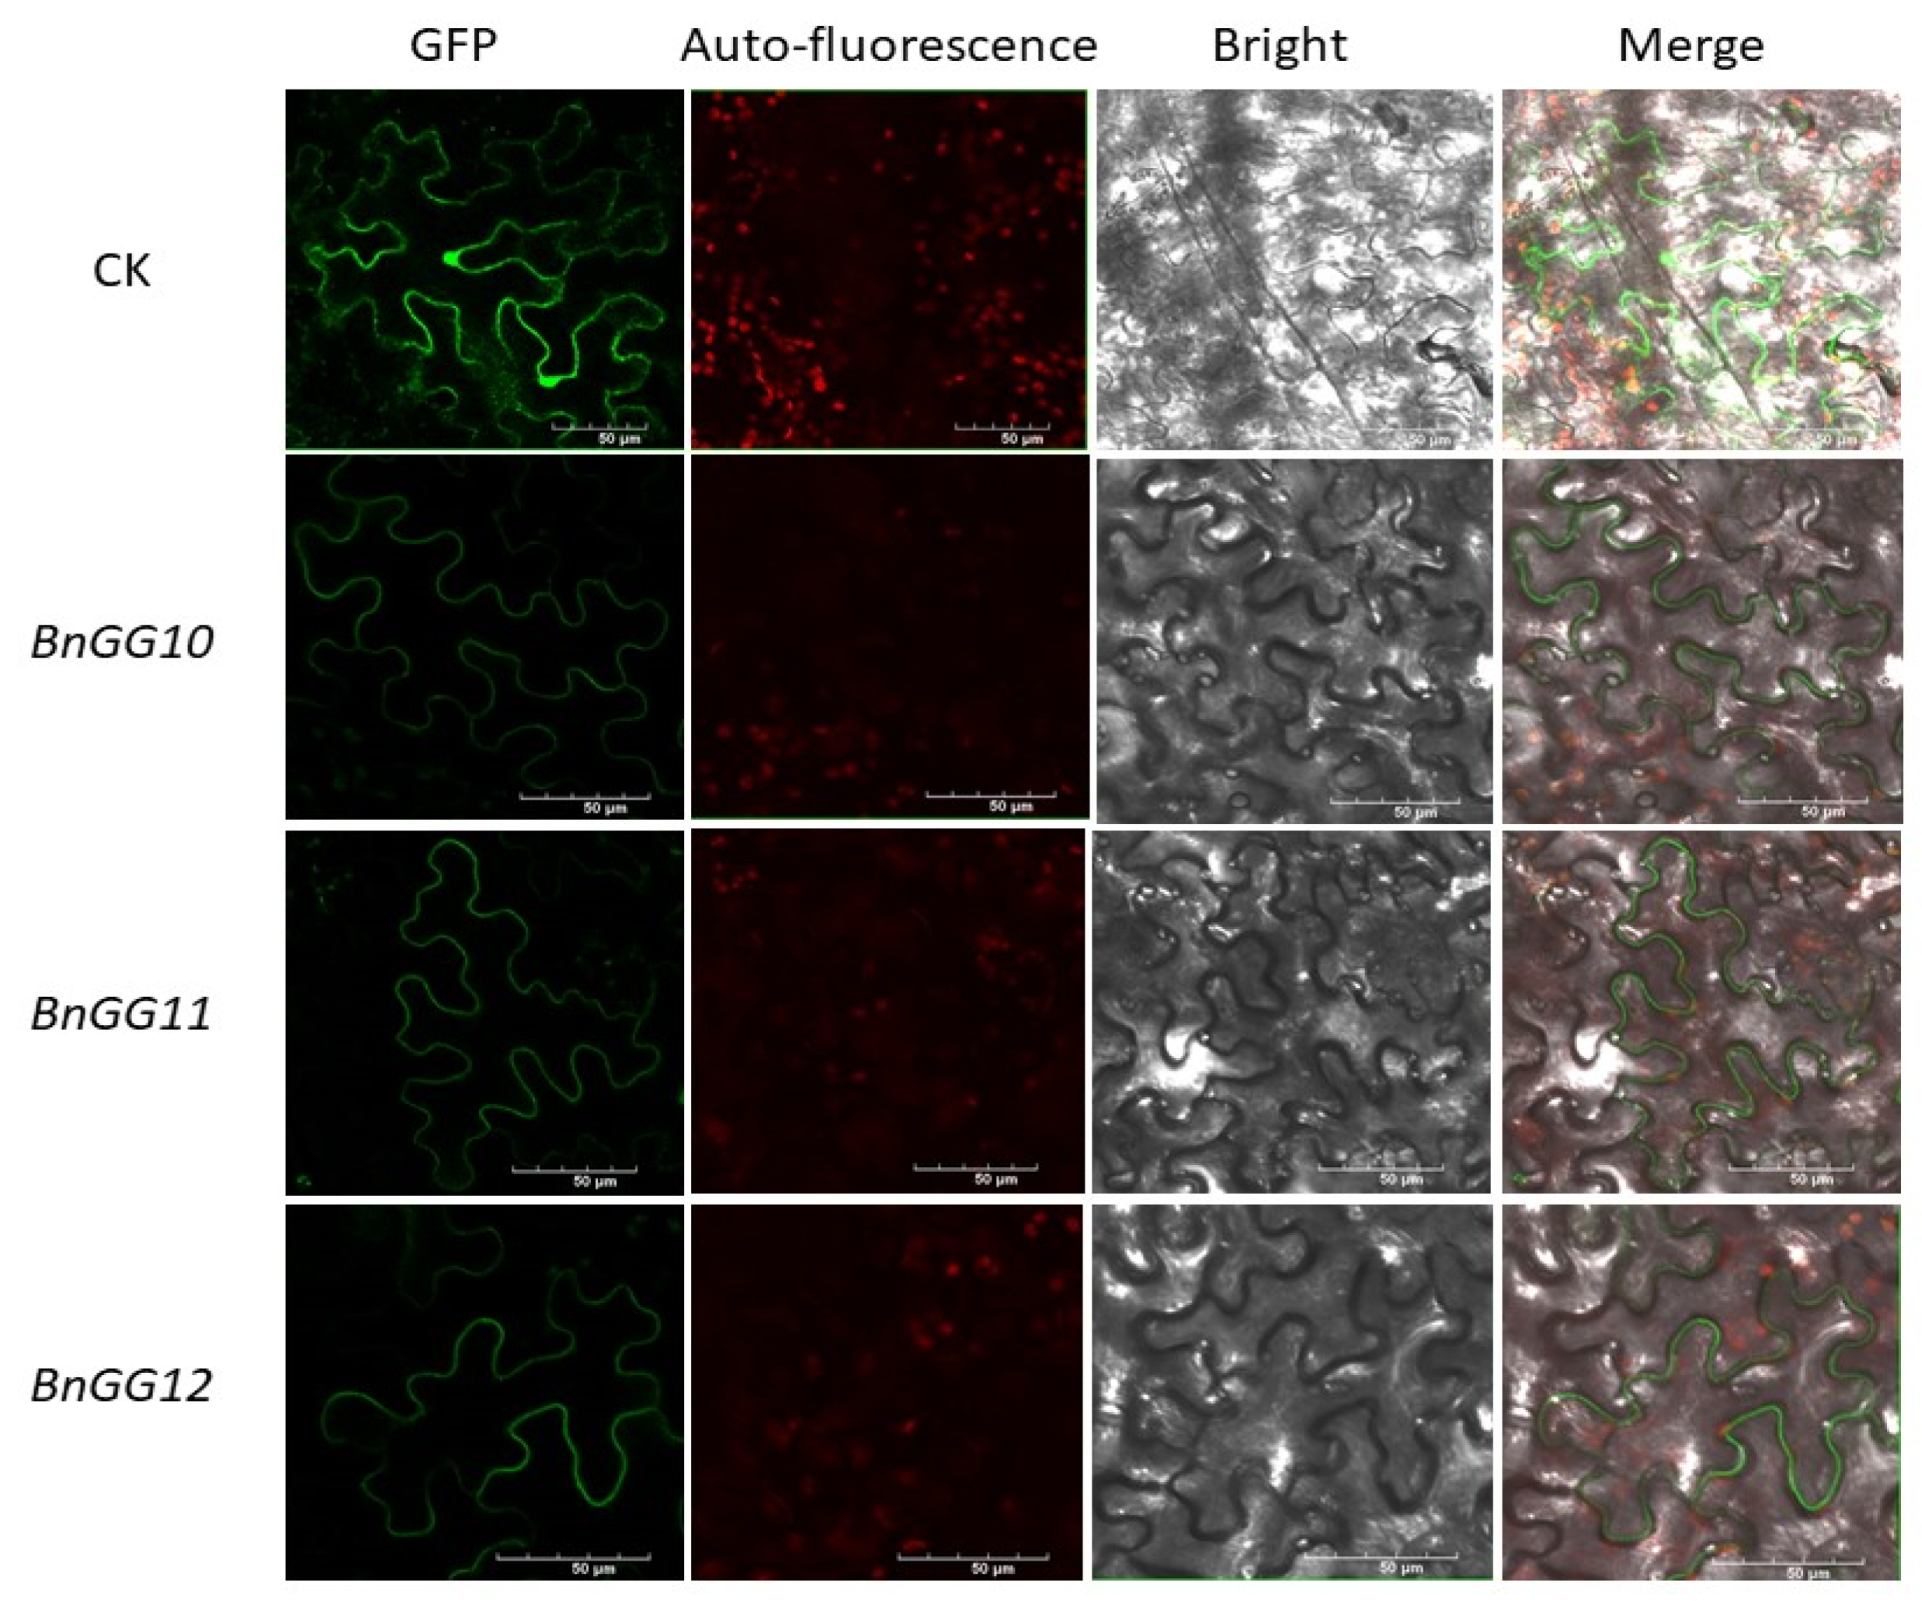
4.3. Phylogenetic Analysis and Subcellular Localization of G-Protein

The full-length amino acid sequences from various plant species including Brassica rape [8], Brassica nigra [34], Arabidopsis [5], Oryza sativa [5], Camelina sativa [9], Brassica oleracea, and Brassica napus were identified as derived from published paper and current study, respectively. Multiple sequence alignments of the G-protein sequences were performed using the ClustalW tool in MEGA 7.0 [44]. Based on these alignments, three phylogenetic trees, comprising 10 Gα, 22 Gβ, and 46 Gγ protein full-length sequences, respectively, were constructed using the neighbor-joining method, Poisson correction, pairwise deletion, and bootstrapping (1000 replicates; random seeds) as the required parameters.
The coding sequence of BnGG10, BnGG11, and BnGG12 was amplified from the cDNA of Brassica napus cultivar “Zhongshuang11 (ZS11)” and cloned into a green fluorescent protein (GFP) fusion expression vector pEGFP via an enzyme (SpeI) digestion-ligation method. All the primers were synthesized by TSINKE Biotech and are listed in Table S3. The Agrobacterium tumefaciens strain GV3101 harboring the 35S:BnGG10, 11, and 12-GFP constructs were injected into tobacco leaves, and cultured at 28 °C for two days. The florescence images were obtained by using a confocal microscope (Olympus, FV3000, Tokyo, Japan).

4.4. Chromosomal Localization and Gene Duplication

Chromosomal locations of the B. napus G-protein genes were obtained from NCBI using the accession number. The MapChart2.2 (https://mapchart.net/, accessed on 1 July 2022) was then used to draw chromosomal location diagrams for these genes [45].
A multiple collinearity scan toolkit (MCScanX) was adopted to analyze the gene duplication events with the default parameters. The synteny relationship of the G-protein in B. napus, A. thaliana, B. rape, and B. oleracea were constructed using TBtools [43].

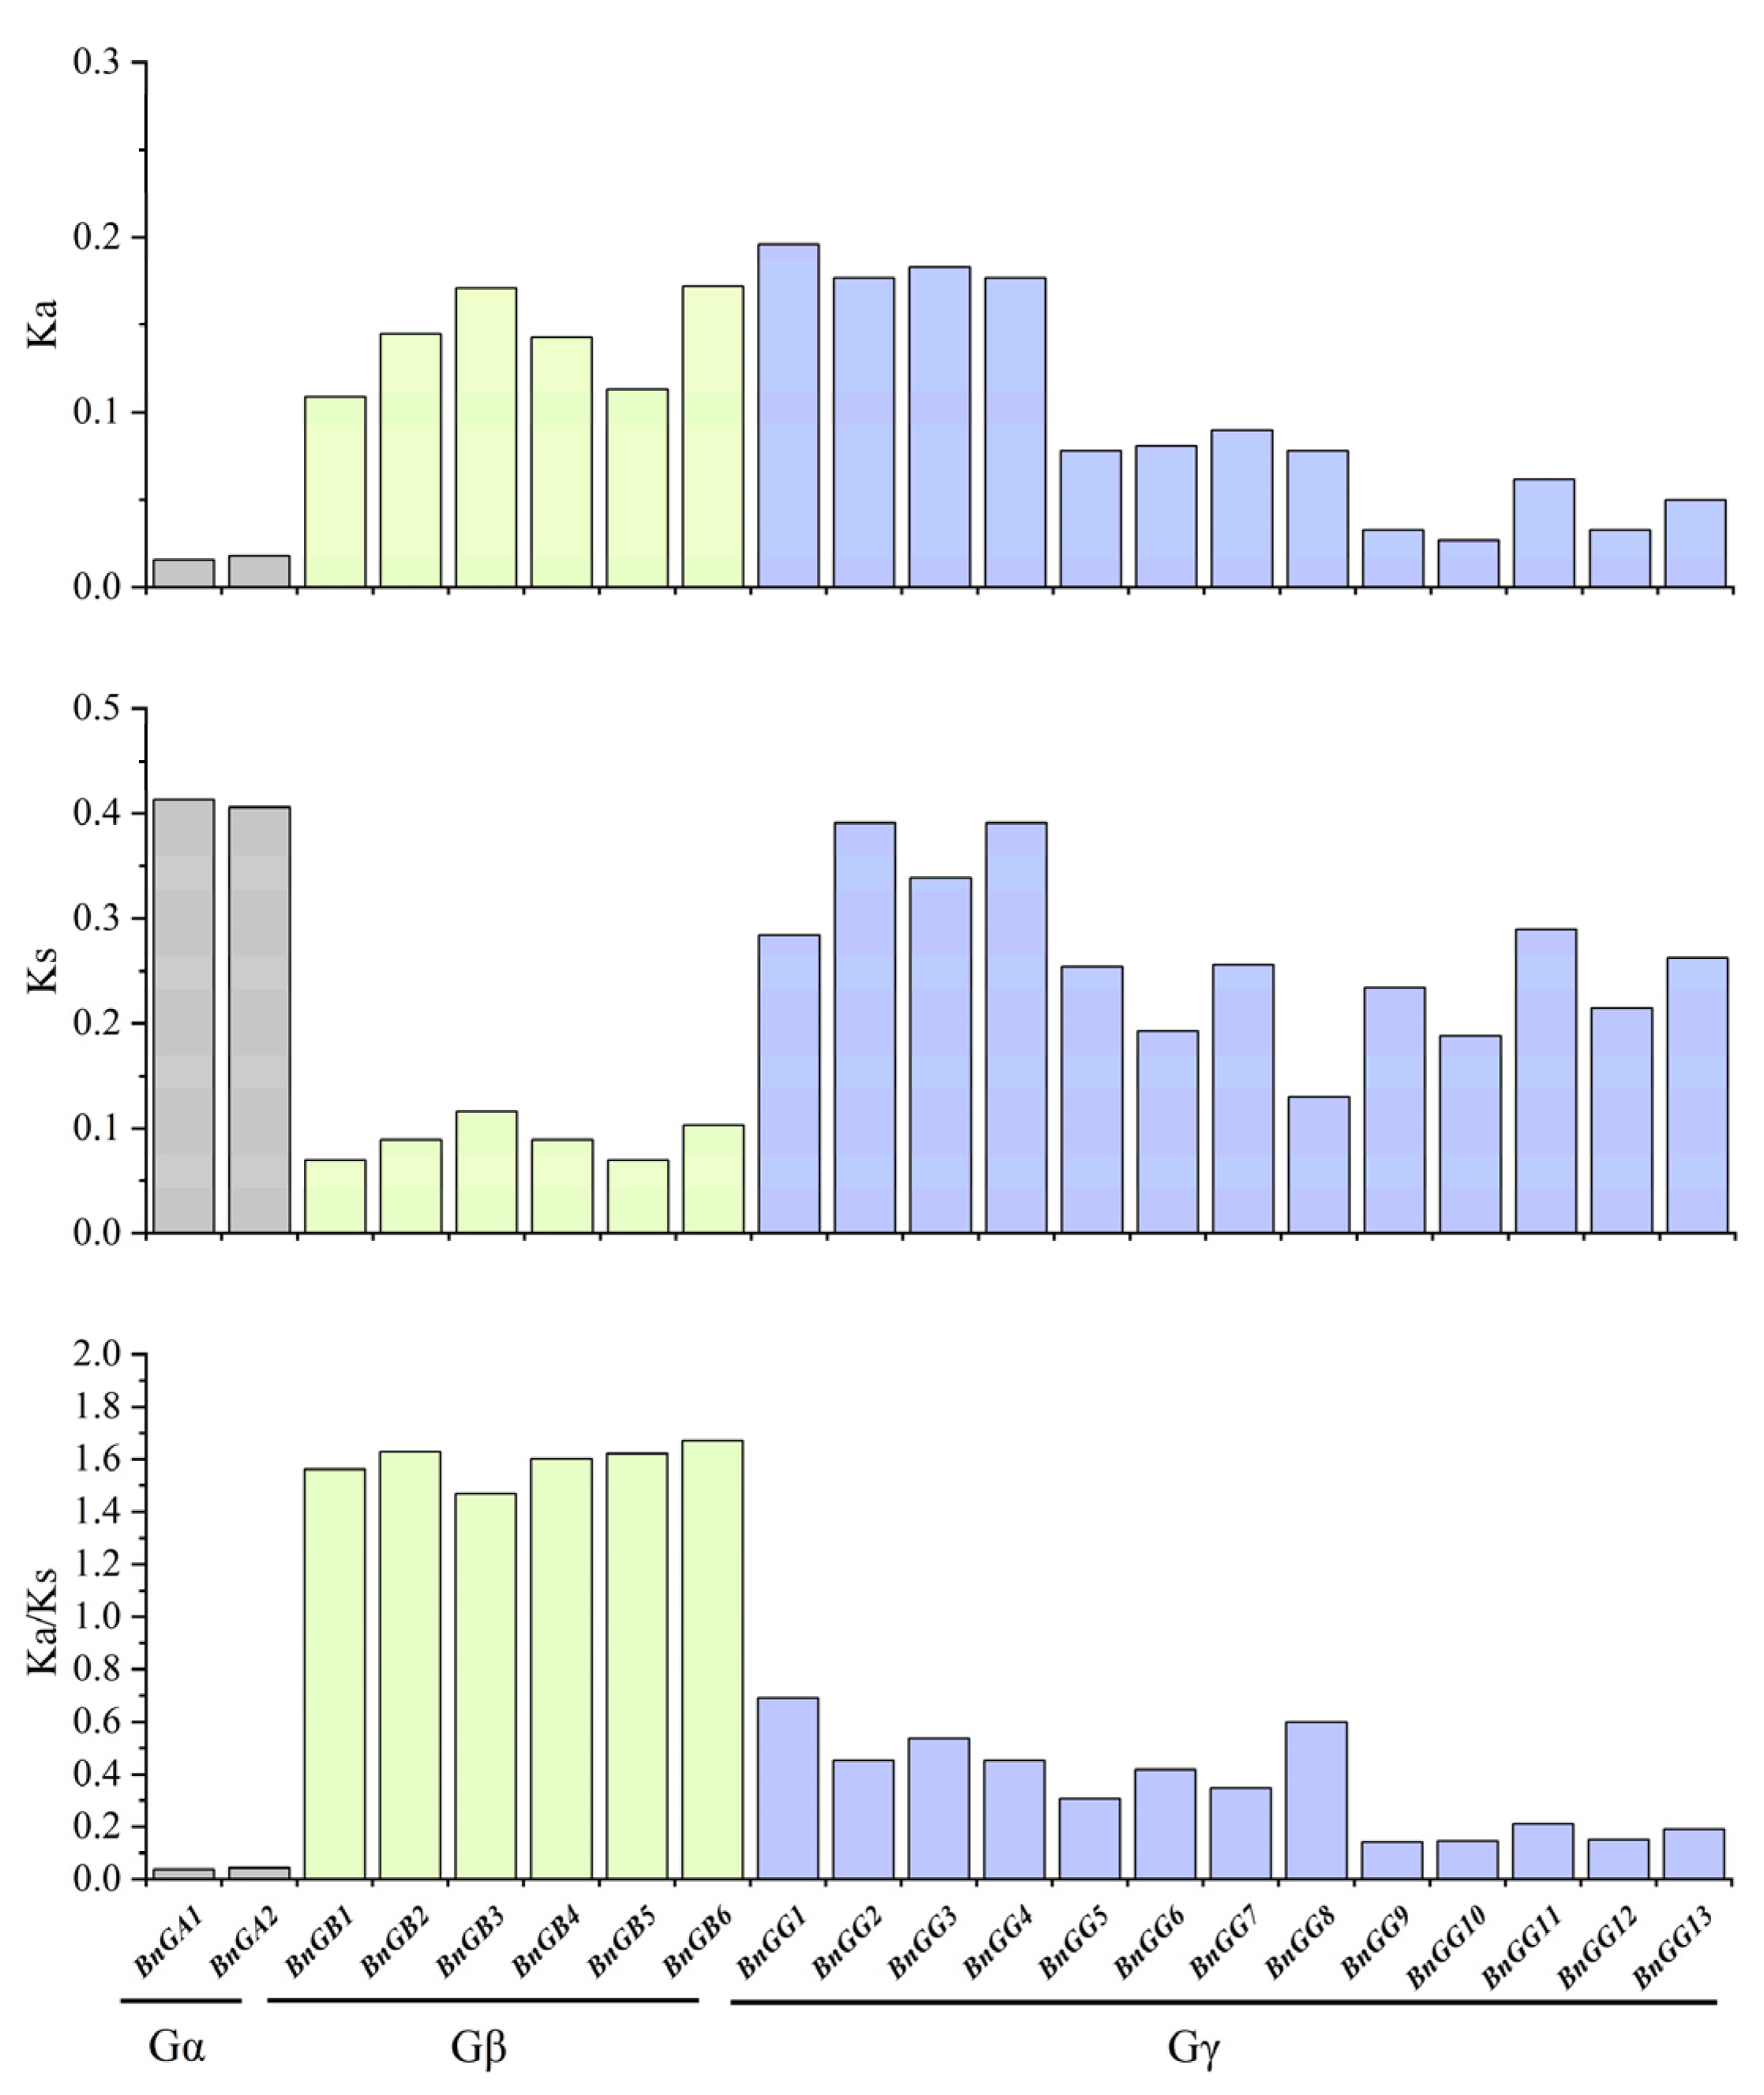
4.5. Calculation of the Ka/Ks Values of G-Protein Genes

The CDS sequences of orthologous G-protein gene pairs between B. napus and A. thaliana were first aligned using ClustalW. Then, the nonsynonymous rate (Ka), synonymous rate (Ks), and evolutionary constraint (Ka/Ks) between the orthologous gene pairs were calculated according to their CDS sequence alignments by using Dnasp5 in the Ka/Ks_calculator program [46].

4.6. Analysis of Cis-Acting Element in B. napus G-Protein Genes’ Promoters

The upstream sequences (2 kb) of the B. napus G-protein genes were retrieved from the NCBI and then submitted to PlantCARE (http://bioinformatics.psb.ugent.be/webtools/plantcare/html/, accessed on 26 July 2020) to analyze the cis-acting element [33].

4.7. Plant Materials and Nitrogen Deprivation Treatments

Seeds of Brassica napus cultivar ZS11 were germinated in plant growth chambers and transplanted into pots in full-strength Hoagland solution (7.5 mmol/L) in a plant growth chamber with a thermo-photoperiod of 25 °C for 16 h/18 °C for 8 h (light/dark) [47]. One-month-old seedlings were transferred into new full-strength Hoagland solution (7.5 mmol/L, CK) and modified N-deficient Hoagland nutrient solution (0.19 mmol/L, LN) for treatment [48]. All nutrition solutions were renewed every three and a half days. Three biological replicates of leaves and roots were harvested after 0, 3, 12, 24 h, 3, and 7 d of treatment. All samples were immediately frozen in liquid nitrogen and stored at −80 °C.

4.8. RNA Isolation, RNA-Sequencing, and Quantitative Reverse-Transcription PCR

Total RNA was extracted from the organ using an RNA extraction kit (Bioteke, Beijing, China), and cDNA was synthesized from 1 µg of total RNA using M-MLV transcriptase (Bioteke, Beijing, China) according to the manufacturer’s instructions.
The B. napus ‘ZS11’ RNA-seq data (BioProject ID PRJNA394926) were downloaded from the NCBI-SRA database (https://www.ncbi.nlm.nih.gov/sra/, accessed on 26 July 2020) to study the organ-specific expression patterns of B. napus G-protein genes. The RNA-seq data (Table S4) included different tissues. To render the data suitable for cluster displays, absolute fragments per kilobase of exon per million reads mapped (FPKM) values were divided by the mean of all of the values, and the ratios were used to construct the heatmaps by TBtools.
Reverse transcription quantitative PCR (RT-qPCR) was performed on the QuantStudio 5 Real Time PCR System (ABI Quantstudio 5, Foster city, CA, USA). Gene-specific primer sequences for the G-protein genes were obtained from NCBI Primer-blast [49] (Table S5). Each reaction was carried out in biological triplicate in a reaction volume of 10 µL containing 1.0 µL of gene-specific primers (1.0 µM), 2.0 µL of cDNA, 5 µL of SYBR green, 0.1 µL of ROX Reference Dye II, and 3 µL of sterile distilled water. The PCR program was as follows: 95 °C for 10 min; 40 cycles of 10 s at 95 °C and 30 s at 60 °C; and then melt curve 65 °C to 95 °C, increment 0.5 °C for 5 s. Melting curves were generated to estimate the specificity of these reactions (Figure S2). Relative expression levels were calculated using the 2−∆∆Ct method, with BnACTIN7 used as an internal control due to its stable expression in leaf and root samples of B. napus under nitrogen deficiency [50].

4.9. Statistical Analysis

All experiments were repeated at least three times independently and data were analyzed using the Office 2010 software. Statistical analyses were calculated with SPSS25 software using Student’s t-test with a p-value threshold of 0.05 () or 0.01 (★★).

Supplementary Materials

The following supporting information can be downloaded at https://www.mdpi.com/article/10.3390/ijms23158151/s1.

Author Contributions

Conceptualization, Y.X.; methodology, Y.X.; software, Y.X. and W.H.; validation, A.A., W.H. and H.T.; experiment, Y.X. and Y.N.; resources, Y.Z. and Y.G.; data curation, Y.N.; writing—original draft preparation, Y.X. and Y.N.; writing—review and editing, H.T. and Y.G.; visualization, A.A.; supervision, Y.Z.; funding acquisition, Y.G. All authors have read and agreed to the published version of the manuscript.

Funding

This research was supported by grants from the National Key R&D Program of China [2021YFD1700202, 2018YFD0200907]; grants from the Special Fund for Agro-scientific Research in the Public Interest [201503124]; and the Innovative Research Team Plan of the Agriculture Ministry.

Institutional Review Board Statement

Not applicable.

Informed Consent Statement

Not applicable.

Data Availability Statement

The RNA-Seq data used in this study are available in the Sequence Read Archive (SRA) at NCBI (SRA accession: PRJNA394926) repository.

Conflicts of Interest

The authors declare no conflict of interest.

References

  1. Gilman, A.G. G proteins: Transducers of receptor-generated signals. Annu. Rev. Biochem. 1987, 56, 615–649. [Google Scholar] [CrossRef]
  2. Klopffleisch, K.; Phan, N.; Augustin, K.; Bayne, R.S.; Booker, K.S.; Botella, J.R.; Carpita, N.C.; Carr, T.; Chen, J.G.; Cooke, T.R. Arabidopsis G-protein interactome reveals connections to cell wall carbohydrates and morphogenesis. Mol. Syst. Biol. 2011, 7, 532. [Google Scholar] [CrossRef] [PubMed]
  3. Wu, T.-Y.; Urano, D. Genetic and systematic approaches toward G protein-coupled abiotic stress signaling in plants. Front. Plant Sci. 2018, 9, 1378. [Google Scholar] [CrossRef]
  4. Ofoe, R. Signal transduction by plant heterotrimeric G-protein. Plant Biol. 2021, 23, 3–10. [Google Scholar] [CrossRef]
  5. Temple, B.R.S.; Jones, A.M. The plant heterotrimeric G-protein complex. Annu. Rev. Plant Biol. 2007, 58, 249–266. [Google Scholar] [CrossRef] [PubMed] [Green Version]
  6. Milligan, G.; Kostenis, E. Heterotrimeric G-proteins: A short history. Br. J. Pharmacol. 2006, 147, S46–S55. [Google Scholar] [CrossRef] [Green Version]
  7. Chakravorty, D.; Trusov, Y.; Botella, J.R. Site-directed mutagenesis of the Arabidopsis heterotrimeric G protein β subunit suggests divergent mechanisms of effector activation between plant and animal G proteins. Planta 2012, 235, 615–627. [Google Scholar] [CrossRef]
  8. Arya, G.C.; Kumar, R.; Bisht, N.C. Evolution, expression differentiation and interaction specificity of heterotrimeric G-protein subunit gene family in the mesohexaploid Brassica rapa. PLoS ONE 2014, 9, e105771. [Google Scholar] [CrossRef] [PubMed]
  9. Roy Choudhury, S.; Marlin, M.A.; Pandey, S. The Role of Gβ Protein in Controlling Cell Expansion via Potential Interaction with Lipid Metabolic Pathways. Plant Physiol. 2019, 179, 1159–1175. [Google Scholar] [CrossRef] [Green Version]
  10. Liu, C.Y.; Xu, Y.Z.; Fan, W.; Long, D.P.; Cao, B.N.; Xiang, Z.H.; Zhao, A.C. Identification of the genes involved in heterotrimeric G-protein signaling in mulberry and their regulation by abiotic stresses and signal molecules. Biol. Plant. 2018, 62, 277–286. [Google Scholar] [CrossRef]
  11. Ullah, H.; Chen, J.-G.; Young, J.C.; Im, K.-H.; Sussman, M.R.; Jones, A.M. Modulation of cell proliferation by heterotrimeric G protein in Arabidopsis. Science 2001, 292, 2066–2069. [Google Scholar] [CrossRef] [PubMed] [Green Version]
  12. Ullah, H.; Chen, J.-G.; Temple, B.; Boyes, D.C.; Alonso, J.M.; Davis, K.R.; Ecker, J.R.; Jones, A.M. The β-subunit of the Arabidopsis G protein negatively regulates auxin-induced cell division and affects multiple developmental processes. Plant Cell 2003, 15, 393–409. [Google Scholar] [CrossRef] [PubMed] [Green Version]
  13. Fujisawa, Y.; Kato, T.; Ohki, S.; Ishikawa, A.; Kitano, H.; Sasaki, T.; Asahi, T.; Iwasaki, Y. Suppression of the heterotrimeric G protein causes abnormal morphology, including dwarfism, in rice. Proc. Natl. Acad. Sci. USA 1999, 96, 7575–7580. [Google Scholar] [CrossRef] [PubMed] [Green Version]
  14. Li, S.; Liu, Y.; Zheng, L.; Chen, L.; Li, N.; Corke, F.; Lu, Y.; Fu, X.; Zhu, Z.; Bevan, M.W. The plant-specific G protein γ subunit AGG3 influences organ size and shape in Arabidopsis thaliana. New Phytol. 2012, 194, 690–703. [Google Scholar] [CrossRef]
  15. Kumar, R.; Bisht, N.C. Heterotrimeric Gα subunit regulates plant architecture, organ size and seed weight in the oilseed Brassica juncea. Plant Mol. Biol. 2020, 104, 549–560. [Google Scholar] [CrossRef]
  16. Liu, Z.; Zhao, Y.; Wang, X.; Yang, M.; Guo, C.; Xiao, K. TaNBP1, a guanine nucleotide-binding subunit gene of wheat, is essential in the regulation of N starvation adaptation via modulating N acquisition and ROS homeostasis. BMC Plant Biol. 2018, 18, 167. [Google Scholar] [CrossRef]
  17. Sun, H.; Qian, Q.; Wu, K.; Luo, J.; Wang, S.; Zhang, C.; Ma, Y.; Liu, Q.; Huang, X.; Yuan, Q. Heterotrimeric G proteins regulate nitrogen-use efficiency in rice. Nat. Genet. 2014, 46, 652–656. [Google Scholar] [CrossRef]
  18. Xu, X.; Wu, K.; Xu, R.; Yu, J.; Wang, J.; Zhao, Y.; Wang, Y.; Song, W.; Wang, S.; Gao, Z. Pyramiding of the dep1-1 and NAL1 NJ6 Alleles Achieves Sustainable Improvements in Nitrogen-Use Efficiency and Grain Yield in Japonica Rice Breeding. J. Genet. Genom. 2019, 46, 325–328. [Google Scholar] [CrossRef]
  19. Zhao, M.; Zhao, M.; Gu, S.; Sun, J.; Ma, Z.; Wang, L.; Zheng, W.; Xu, Z. DEP1 is involved in regulating the carbon–nitrogen metabolic balance to affect grain yield and quality in rice (Oriza sativa L.). PLoS ONE 2019, 14, e0213504. [Google Scholar] [CrossRef] [Green Version]
  20. Chakraborty, N.; Kanyuka, K.; Jaiswal, D.K.; Kumar, A.; Arora, V.; Malik, A.; Gupta, N.; Hooley, R.; Raghuram, N. GCR1 and GPA1 coupling regulates nitrate, cell wall, immunity and light responses in Arabidopsis. Sci. Rep. 2019, 9, 5838. [Google Scholar] [CrossRef]
  21. Liang, Y.; Zhao, X.; Jones, A.M.; Gao, Y. G proteins sculp root architecture in response to nitrogen in rice and Arabidopsis. Plant Sci. 2018, 274, 129–136. [Google Scholar] [CrossRef] [PubMed]
  22. Kaur, J.; Roy Choudhury, S.; Vijayakumar, A.; Hovis, L.; Rhodes, Z.; Polzin, R.; Blumenthal, D.; Pandey, S. Arabidopsis type III Gγ Protein AGG3 is a positive regulator of yield and stress responses in the model monocot Setaria viridis. Front. Plant Sci. 2018, 9, 109. [Google Scholar] [CrossRef] [PubMed] [Green Version]
  23. Crawford, N.M. Nitrate: Nutrient and signal for plant growth. Plant Cell 1995, 7, 859–868. [Google Scholar] [PubMed] [Green Version]
  24. Liu, X.; Zhang, F. Nitrogen fertilizer induced greenhouse gas emissions in China. Curr. Opin. Environ. Sustain. 2011, 3, 407–413. [Google Scholar]
  25. Zou, X.Y.; Liu, B.L.; Song, L.Q.; Guan, C.Y. Effects of nitrogen application on yield and nitrogen use efficiency of rapeseed (Brassica napus). J. Appl. Ecol. 2016, 27, 1169–1176. [Google Scholar]
  26. Gao, Y.; Li, T.; Liu, Y.; Ren, C.; Zhao, Y.; Wang, M. Isolation and characterization of gene encoding G protein α subunit protein responsive to plant hormones and abiotic stresses in Brassica napus. Mol. Biol. Rep. 2010, 37, 3957–3965. [Google Scholar] [CrossRef]
  27. Gao, Y.; Zhao, Y.; Li, T.; Ren, C.; Liu, Y.; Wang, M. Cloning and characterization of a G protein β subunit gene responsive to plant hormones and abiotic stresses in Brassica napus. Plant Mol. Biol. Rep. 2010, 28, 450–459. [Google Scholar] [CrossRef]
  28. Gao, Y.; Li, T.; Zhao, Y.; Ren, C.; Zhang, Y.; Wang, M. Isolation and characterization of a G protein γ subunit gene responsive to plant hormones and abiotic stresses in Brassica napus L. Acta Physiol. Plant. 2011, 33, 391–399. [Google Scholar] [CrossRef]
  29. Nagaharu, U.; Nagaharu, N. Genome analysis in Brassica with special reference to the experimental formation of B. napus and peculiar mode of fertilization. Jpn. J. Bot. 1935, 7, 389–452. [Google Scholar]
  30. Cheng, F.; Mandáková, T.; Wu, J.; Xie, Q.; Lysak, M.A.; Wang, X. Deciphering the diploid ancestral genome of the mesohexaploid Brassica rapa. Plant Cell 2013, 25, 1541–1554. [Google Scholar] [CrossRef] [Green Version]
  31. Chakravorty, D.; Trusov, Y.; Zhang, W.; Acharya, B.R.; Sheahan, M.B.; McCurdy, D.W.; Assmann, S.M.; Botella, J.R. An atypical heterotrimeric G-protein γ-subunit is involved in guard cell K+-channel regulation and morphological development in Arabidopsis thaliana. Plant J. 2011, 67, 840–851. [Google Scholar] [CrossRef] [PubMed]
  32. Nekrutenko, A.; Makova, K.D.; Li, W.-H. The KA/KS ratio test for assessing the protein-coding potential of genomic regions: An empirical and simulation study. Genome Res. 2002, 12, 198–202. [Google Scholar] [CrossRef] [PubMed] [Green Version]
  33. Lescot, M.; Déhais, P.; Thijs, G.; Marchal, K.; Moreau, Y.; Van de Peer, Y.; Rouzé, P.; Rombauts, S. PlantCARE, a database of plant cis-acting regulatory elements and a portal to tools for in silico analysis of promoter sequences. Nucleic Acids Res. 2002, 30, 325–327. [Google Scholar] [CrossRef] [PubMed]
  34. Kumar, R.; Arya, G.C.; Bisht, N.C. Differential expression and interaction specificity of the heterotrimeric G-protein family in Brassica nigra reveal their developmental-and condition-specific roles. Plant Cell Physiol. 2014, 55, 1954–1968. [Google Scholar] [CrossRef] [PubMed]
  35. Wang, S.; Assmann, S.M.; Fedoroff, N.V. Characterization of the Arabidopsis heterotrimeric G protein. J. Biol. Chem. 2008, 283, 13913–13922. [Google Scholar] [CrossRef] [Green Version]
  36. Chalhoub, B.; Denoeud, F.; Liu, S.; Parkin, I.A.P.; Tang, H.; Wang, X.; Chiquet, J.; Belcram, H.; Tong, C.; Samans, B. Early allopolyploid evolution in the post-Neolithic Brassica napus oilseed genome. Science 2014, 345, 950–953. [Google Scholar] [CrossRef] [Green Version]
  37. Liu, S.; Liu, Y.; Yang, X.; Tong, C.; Edwards, D.; Parkin, I.A.P.; Zhao, M.; Ma, J.; Yu, J.; Huang, S. The Brassica oleracea genome reveals the asymmetrical evolution of polyploid genomes. Nat. Commun. 2014, 5, 3930. [Google Scholar] [CrossRef]
  38. Seo, H.-S.; Kim, H.-Y.; Jeong, J.-Y.; Lee, S.-Y.; Cho, M.-J.; Bahk, J.-D. Molecular cloning and characterization of RGA1 encoding a G protein α subunit from rice (Oryza sativa L. IR-36). Plant Mol. Biol. 1995, 27, 1119–1131. [Google Scholar] [CrossRef]
  39. Roy Choudhury, S.; Riesselman, A.J.; Pandey, S. Constitutive or seed-specific overexpression of A rabidopsis G-protein γ subunit 3 (AGG 3) results in increased seed and oil production and improved stress tolerance in C amelina sativa. Plant Biotechnol. J. 2014, 12, 49–59. [Google Scholar] [CrossRef]
  40. Li, S.; Liu, W.; Zhang, X.; Liu, Y.; Li, N.; Li, Y. Roles of the Arabidopsis G protein γ subunit AGG3 and its rice homologs GS3 and DEP1 in seed and organ size control. Plant Signal. Behav. 2012, 7, 1357–1359. [Google Scholar] [CrossRef] [Green Version]
  41. Altschul, S.F.; Gish, W.; Miller, W.; Myers, E.W.; Lipman, D.J. Basic local alignment search tool. J. Mol. Biol. 1990, 215, 403–410. [Google Scholar] [CrossRef]
  42. Eddy, S.R. Accelerated profile HMM searches. PLoS Comput. Biol. 2011, 7, e1002195. [Google Scholar] [CrossRef] [PubMed] [Green Version]
  43. Chen, C.; Chen, H.; Zhang, Y.; Thomas, H.R.; Frank, M.H.; He, Y.; Xia, R. TBtools: An integrative toolkit developed for interactive analyses of big biological data. Mol. Plant 2020, 13, 1194–1202. [Google Scholar] [CrossRef] [PubMed]
  44. Kumar, S.; Stecher, G.; Tamura, K. MEGA7: Molecular evolutionary genetics analysis version 7.0 for bigger datasets. Mol. Biol. Evol. 2016, 33, 1870–1874. [Google Scholar] [CrossRef] [PubMed] [Green Version]
  45. Voorrips, R.E. MapChart: Software for the graphical presentation of linkage maps and QTLs. J. Hered. 2002, 93, 77–78. [Google Scholar] [CrossRef] [Green Version]
  46. Librado, P.; Rozas, J. DnaSP v5: A software for comprehensive analysis of DNA polymorphism data. Bioinformatics 2009, 25, 1451–1452. [Google Scholar] [CrossRef] [Green Version]
  47. Hoagland, D.R.; Arnon, D.I. The water-culture method for growing plants without soil. In Circular. California Agricultural Experiment Station; CABI: Wallingford, UK, 1950; Volume 347. [Google Scholar]
  48. Qin, L.; Walk, T.C.; Han, P.; Chen, L.; Zhang, S.; Li, Y.; Hu, X.; Xie, L.; Yang, Y.; Liu, J. Adaption of roots to nitrogen deficiency revealed by 3D quantification and proteomic analysis. Plant Physiol. 2019, 179, 329–347. [Google Scholar] [CrossRef] [Green Version]
  49. Ye, J.; Coulouris, G.; Zaretskaya, I.; Cutcutache, I.; Rozen, S.; Madden, T.L. Primer-BLAST: A tool to design target-specific primers for polymerase chain reaction. BMC Bioinform. 2012, 13, 134. [Google Scholar] [CrossRef] [Green Version]
  50. Han, P.; Qin, L.; Li, Y.; Liao, X.; Xu, Z.; Hu, X.; Xie, L.; Yu, C.; Wu, Y.; Xing, L. Identification of suitable reference genes in leaves and roots of rapeseed (Brassica napus L.) under different nutrient deficiencies. J. Integrat. Agric. 2017, 16, 809–819. [Google Scholar] [CrossRef] [Green Version]
Figure 1. Gene structure analysis of Gα (A), Gβ (B), and Gγ (C) genes between A. thaliana and B. napus. Yellow boxes represent exons and black lines represent introns. The upstream/downstream region of G-protein genes are indicated in purple boxes. The length of exons can be inferred by the scale at the bottom.
Ijms 23 08151 g001aIjms 23 08151 g001b
Figure 2. Evolutionary relationship of B. napus G-protein. The phylogenetic analysis of (A) Gα, (B) Gβ, and (C) Gγ proteins isolated from B. napus, with their corresponding G-protein subunit proteins in B. rape (Bra), B. oleracea (Bol), B. nigra (Bni), Arabidopsis (At), Oryza sativa (Os) and Camelina sativa (Cs), was performed using the neighbor-joining method in MEGA 7.0, with 1000 bootstrap replications. The red dots represent B. napus G-protein.
Ijms 23 08151 g002
Figure 3. Subcellular localization of three selected B. napus G-protein genes in tobacco cells.
Ijms 23 08151 g003
Figure 4. Chromosomal location of B. napus G-proteins (A) and syntenic relationships of G-protein in A. thaliana, B. napus, B. rapa, and B. oleracea (B). (B): blue lines represent Gα synteny, orange lines represent Gβ synteny, green lines represent Gγ synteny.
Ijms 23 08151 g004aIjms 23 08151 g004b
Figure 5. Nonsynonymous rate (Ka), synonymous rate (Ks), and evolutionary constraint (Ka/Ks) ratio between A. thaliana G-proteins and the corresponding orthologs in B. napus. Gray, green and purple represents Gα subunit genes, Gβ subunit genes, and Gγ subunit genes, respectively.
Ijms 23 08151 g005
Figure 6. Predicted cis-elements in B. napus G-protein promoters. Promoter sequences (2000 bp) of 21 G-proteins are analyzed by PlantCARE. Cis-elements were identified in the promoters of all 21 G-proteins and were classified into four main groups (black, green, blue, and orange, respectively, represent groups). Black means that gene has one cis-element at least, and white means that there is no cis-element.
Ijms 23 08151 g006
Figure 7. Expression profiles of G-proteins in different tissues and organs of B. napus. FPKM values of G-protein genes were transformed by log2 and the heatmap was constructed by TBtools.
Ijms 23 08151 g007
Figure 8. Expression profiles of G-protein genes in leaves under normal and nitrogen-deficient conditions. Quantitative RT-PCR was used to investigate the expression levels of one Gα gene (BnGA1) and five C-type Gγ genes (BnGG9, BnGG10, BnGG11, BnGG12, BnGG13). Leaves were collected under normal-growth and nitrogen-deficient conditions at 0 h, 3 h, 12 h, 24 h, 3 d, and 7 d after treatments. Data were normalized to the BnActin7 gene and vertical bars indicate standard deviation. Compared with the expression of G-protein genes in CK condition at each time point, represents the significant level, represents the extremely significant level.
Ijms 23 08151 g008aIjms 23 08151 g008b
Figure 9. Expression profiles of G-protein genes in roots under normal and nitrogen-deficient conditions. Quantitative RT-PCR was used to investigate the expression levels of one Gα gene (BnGA1) and five C-type Gγ genes (BnGG9, BnGG10, BnGG11, BnGG12, and BnGG13). Roots were collected under normal-growth and nitrogen-deficient conditions at 0 h, 3 h, 12 h, 24 h, 3 d, and 7 d after treatments. Data were normalized to the BnActin7 gene and vertical bars indicate standard deviation. Compared with the expression of G-protein genes in CK condition at each time point, represents the significant level, represents the extremely significant level.
Ijms 23 08151 g009
Table 1. Features of G-protein genes identified in B. napus.
NameGene IDChr.Genomic LocationAAMW (kDa)pI
BnGA1106368534A937616342–3761950338344.51 5.83
BnGA2106416165C835538778–3554198138344.52 5.83
BnGB1106355793C13466087–346867437740.95 7.12
BnGB2106361031A815871124–1587352432735.42 6.81
BnGB3106393802A320605662–2060797837841.03 6.84
BnGB4106434467C373099901–7310218737840.98 6.66
BnGB5111200422A12483391–248594437740.96 7.12
BnGB6111207516C758909449–5891173137840.95 6.66
BnGG1106415923C835416454–354174858910.03 4.32
BnGG2106444922A4160931–1621149310.44 4.87
BnGG3111200375A937488644–37489890899.95 4.23
BnGG4106444926A4148539–14972110211.55 8.96
BnGG5106378744A125494898–2549635810111.46 5.67
BnGG6106416661C343845900–4384729410111.22 4.69
BnGG7106453742C142473926–4247566415617.81 9.35
BnGG8106444151A330215792–3021722810111.16 4.69
BnGG9106370440A1012691034–1269412624326.59 8.71
BnGG10106385330C310289041–1029230123625.67 8.71
BnGG11106425695A26534486–653750026528.96 8.78
BnGG12106443216A34798356–4803485 23725.76 8.71
BnGG13106409403C756275611–5627872024626.86 8.63
Publisher’s Note: MDPI stays neutral with regard to jurisdictional claims in published maps and institutional affiliations.

