Article

A NanoBRET-Based H3R Conformational Biosensor to Study Real-Time H3 Receptor Pharmacology in Cell Membranes and Living Cells

Division of Medicinal Chemistry, Faculty of Science, Amsterdam Institute of Molecular and Life Sciences, Vrije Universiteit Amsterdam, 1081 HZ Amsterdam, The Netherlands
*
Author to whom correspondence should be addressed.
Int. J. Mol. Sci. 2022, 23(15), 8211; https://doi.org/10.3390/ijms23158211
Submission received: 13 July 2022 / Revised: 22 July 2022 / Accepted: 23 July 2022 / Published: 26 July 2022
(This article belongs to the Special Issue Molecular Biology of Histamine Systems 2.0)

Abstract

:
Conformational biosensors to monitor the activation state of G protein-coupled receptors are a useful addition to the molecular pharmacology assay toolbox to characterize ligand efficacy at the level of receptor proteins instead of downstream signaling. We recently reported the initial characterization of a NanoBRET-based conformational histamine H3 receptor (H3R) biosensor that allowed the detection of both (partial) agonism and inverse agonism on living cells in a microplate reader assay format upon stimulation with H3R ligands. In the current study, we have further characterized this H3R biosensor on intact cells by monitoring the effect of consecutive ligand injections in time and evaluating its compatibility with photopharmacological ligands that contain a light-sensitive azobenzene moiety for photo-switching. In addition, we have validated the H3R biosensor in membrane preparations and found that observed potency values better correlated with binding affinity values that were measured in radioligand competition binding assays on membranes. Hence, the H3R conformational biosensor in membranes might be a ready-to-use, high-throughput alternative for radioligand binding assays that in addition can also detect ligand efficacies with comparable values as the intact cell assay.

1. Introduction

G protein-coupled receptors (GPCRs) are membrane-associated seven transmembrane (7TM) proteins that trigger intracellular signaling upon binding of extracellular messengers such as hormones and neurotransmitters. GPCR activation by agonists involves conformational changes in the 7TM domain with most significantly an outward movement of the intracellular side of TM6 to create a pocket at the intracellular interface of TM3, TM5, TM6 and intracellular loop (IL)2 to engage the coupling of heterotrimeric G proteins, GPCR kinases, or β-arrestins, as revealed by X-ray crystallography and more recent cryo-electron microscopy (cryo-EM) structures [1,2,3]. This outward movement of TM6 is smaller for partial agonists as compared to full agonists resulting in a sub-efficient coupling of intracellular signaling transducers and consequently submaximal cellular responses despite full receptor occupancy [4,5,6].
Real-time agonist-induced changes in GPCR conformations have been dynamically measured in living cells using intramolecular resonance-energy transfer (RET)-based biosensors by incorporating a RET acceptor molecule into (the truncated) intracellular loop (IL)3 of the GPCR and fusing a RET donor molecule to its C-terminal tail, or vice versa, allowing for the real-time monitoring of the distance between the two GPCR domains [7,8]. In addition, ligand-induced changes in the distance between TM4 and TM6 has also been measured by labeling-introduced cysteines at the intracellular end of these TMs with optimized Cy3B and Cy7 fluorophores followed by single molecule fluorescent RET imaging [6]. In line with structural studies, full agonists induce a larger change in basal RET in these intramolecular biosensors as compared to partial agonists. Moreover, an opposite change of RET can be observed upon the addition of inverse agonists confirming that GPCRs can adopt a conformation with some basal activity in the absence of ligands [9,10,11,12,13]. Initially, cyan and yellow fluorescent proteins (CFP and YFP) were used as fluorescence resonance energy transfer (FRET) donor and acceptor, respectively, in intramolecular GPCR conformation sensors to measure the distance/re-orientation between IL3 and the C-terminal tail, with the substitution of YFP with the much smaller Fluorescein Arsenical Hairpin Binder (FlAsH) as an improved alternative due to its reduced effect on the GPCR structure [14,15,16]. More recently, bioluminescent luciferases such as Renilla luciferase or the engineered NanoLuc in combination with fluorescent proteins, FlAsH, or the self-labeling fluorescent HaloTag have been employed in BRET-based GPCR conformation sensors to allow for the measurements of conformational changes in GPCRs in a microplate reader assay format [11,12,17,18,19,20,21].
We have recently reported on the development and initial characterization of a NanoBRET-based H3R conformational biosensor (Δicl3-H3RNluc/Halo(618)) that was based on an earlier reported FRET-based H3R biosensor with CFP and YFP [22]. In the NanoBRET-based H3R sensor the IL3 was substituted from residues Arg230 to Arg347 with a HaloTag that was subsequently self-labeled with ‘NanoBRET 618’ dye, and NanoLuc was fused in frame to the C-terminal tail (Figure 1A) [12]. The histamine H3 receptor (H3R) is associated with various neurological disorders such as Alzheimer’s disease, Parkinson’s disease, narcolepsy, and sleeping and learning disorders due to its important role in the central nervous system (CNS) by pre-synaptically controlling the release of histamine and other neurotransmitters including acetylcholine, dopamine, noradrenaline, serotonin, γ-aminobutyric acid, and glutamate [23]. The H3R is a constitutively active GPCR that display increased basal signaling in the absence of histamine [24,25]. Moreover, this spontaneous H3R activity can be inhibited in native mouse brains by inverse agonists resulting in reduced G protein activation and a consequently increased release of histamine from synaptosomes [26]. Several H3R-targeting antagonists/inverse agonists have entered pre-clinical trials for different CNS disorders in the last decade [27,28]. Moreover, pitolisant (Wakix®) has been approved as H3R inhibitor in 2017 and 2019 by the European Medicine Agency (EMA) and the Food and Drug Administration in the United States (FDA), respectively, to treat patients with narcolepsy [29,30].
The new NanoBRET-based H3R conformational biosensor accurately discriminates between H3R ligands with different efficacies, including full and partial agonists but also inverse agonists, suggesting that it adopts a constitutive active conformation in the absence of ligands [12]. In this study, we have used the Δicl3-H3RNluc/Halo(618) biosensor to pharmacologically characterize a small selection of pre-clinical H3R antagonists/inverse agonists and two recently reported photo-switchable H3R tool ligands on living cells [31,32]. In addition, we have explored for the first time the function of a GPCR conformational biosensor in membrane preparations instead of intact cells to potentially further increase the assay’s flexibility and throughput.

2. Results

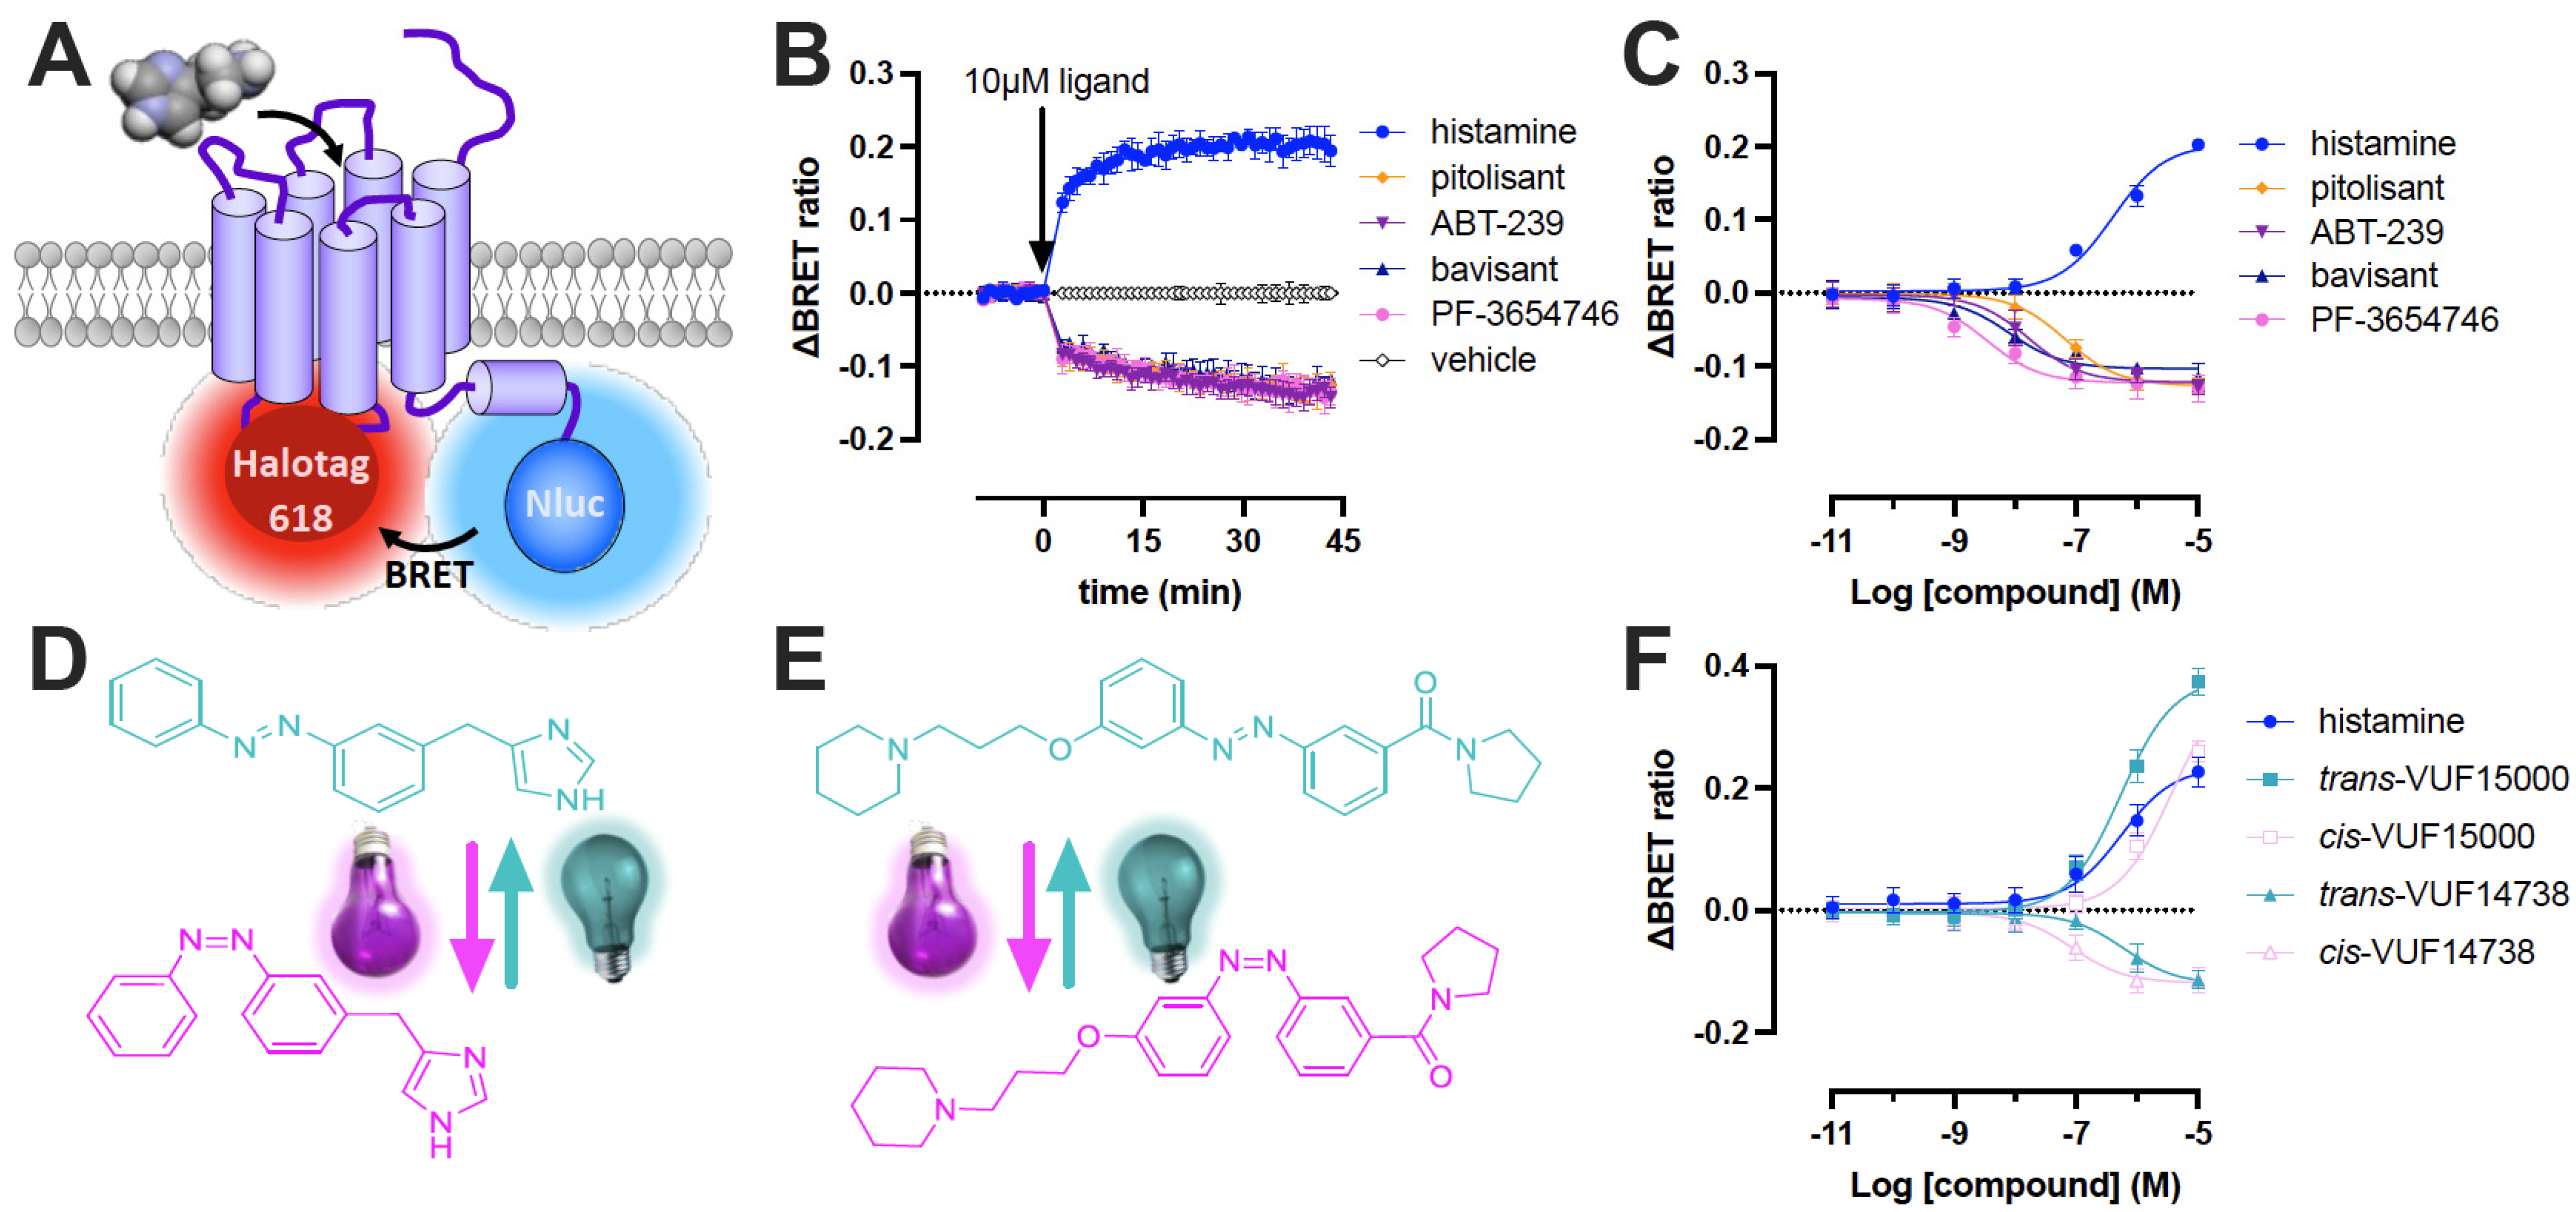
2.1. Efficacy of (Pre) Clinical and Photoswitchable H3R Ligands on the H3R Biosensor in Living Cells

Stimulation of HEK293A cells stably expressing the Δicl3-H3RNluc/Halo(618) conformational biosensor with 10 µM of the endogenous agonist histamine or the EMA/FDA-approved inverse agonist pitolisant rapidly increased and decreased BRET, respectively, as compared to the ligand-free (basal) BRET signal (Figure 1B) [12]. The oppositely directed BRET changes both stabilized within approximately 30–45 min. Next, the pre-clinical H3R antagonists/inverse agonists ABT-239, PF-3654746 and bavisant were tested on the H3R biosensor. All three ligands (10 µM) acted as inverse agonists and reduced the BRET signal with comparable kinetics to pitolisant (Figure 1B), but displayed 4- to 20-fold higher potencies (pEC50) than pitolisant (Figure 1C; Table 1), which is in line with their 3- to 25-fold higher binding affinities (pKi) for the H3R biosensor as compared to pitolisant (Table 1). Bavisant acted as a partial inverse agonist (IA = (−)0.77 ± 0.07) in comparison to pitolisant, whereas both ABT-239 and PF-3654746 (IA = (−)0.96 ± 0.05 and (−)0.92 ± 0.11, respectively) acted as full inverse agonists on the H3R biosensor (Figure 1C; Table 1).
Next, the compatibility of the BRET-based H3R biosensor with azobenzene-containing photo-switchable ligands was evaluated. The previously reported photo-switchable H3R tool compounds, the agonist VUF15000 and antagonist VUF14738 (Figure 1D–F), showed decreased (cis-off) and increased (cis-on) binding affinities for the wild type H3R upon photo-switching from trans into the PSS-cis isomer by illumination at 365 nm [31,32]. These affinity shifts were readily translated into a shifted potency (pEC50) or antagonizing potency (pIC50), respectively, in functional H3R assays such as [35S]-GTPγS binding to activated G proteins and downstream G protein-coupled inwardly rectifying potassium (GIRK) channel activity [31,32]. First, binding affinities for the photo-switchable ligands were determined in a competition binding assay with [3H]NAMH on cell membranes expressing the Δicl3-H3RNluc/Halo(618). The Photo-switchable agonist VUF15000 and antagonist VUF14738 displayed an 8.0-fold decrease and a 31.6-fold increase in binding affinity for the Δicl3-H3RNluc/Halo(618) sensor, respectively, upon photoisomerization from trans- to PSS-cis-isomer (Table 1), which is comparable to their light-induced affinity shifts on wild type H3R (Supplementary Table S1) [31,32].
Next, intact cells expressing the H3R biosensor were first incubated for 20 min with increasing concentration of the trans- or cis-isomers of VUF15000 and VUF14738 in the dark, followed by addition of the NanoGlo substrate and immediate detection of ΔBRET signal. Both trans- and cis-isomers of VUF15000 act as full agonists with higher intrinsic activities than histamine, whereas similar maximum responses were previously observed in a [35S]-GTPγS binding [31]. cis-VUF15000 displayed a 7.9-fold lower potency as compared to trans-VUF15000 (Figure 1F; Table 1). Oppositely, both VUF14738 isomers behave as inverse agonists with cis-VUF14738 having a 7.9-fold higher potency than trans-VUF14738 (Figure 1F; Table 1). The smaller light-induced shifts in pEC50 as compared to pKi values for VUF14738 might be the consequence of unintended cis to trans switching at 430 nm by the lower wavelength shoulder of the Nluc peak bioluminescence at 460 nm [33]. Hence, the use of red-shifted Nanoluc substrates in combination with far-red acceptor fluophores could be explored in future optimizations of the H3R biosensor for photopharmacology research to avoid interference with photoligand switching [34].

2.2. Dynamics of H3R Biosensor in Intact Cells

To further explore the dynamics of monitoring conformational changes in the H3R biosensor, we first stimulated Δicl3-H3RNluc/Halo(618)-expressing cells with 10 µM histamine followed by a second injection after 20 min with vehicle or the competitive inverse agonist pitolisant (0.1 to 10 µM). Pitolisant rapidly antagonized the histamine-induced conformational change of the Δicl3-H3RNluc/Halo(618) biosensor in a concentration-dependent manner and stabilized a more inactive receptor conformation at 1 and 10 µM as compared to vehicle (only)-stimulated cells, indicating that pitolisant fully displaced histamine from the biosensor within the measured timeframe at these concentrations (Figure 2A). In addition, stimulation of Δicl3-H3RNluc/Halo(618)-expressing cells by consecutive injections of increasing concentrations of histamine in the same well with 15 min time intervals resulted in a concentration-dependent increase in BRET (Figure 2B). The concentration-response curve (pEC50 = 6.6 ± 0.07) generated from the ΔBRET ratios that were taken 15 min after each consecutive injection had a comparable amplitude to the concentration-response curve that was obtained from wells that were each stimulated with a different histamine concentration (pEC50 = 6.4 ± 0.1) (Figure 2C).

2.3. Behavior of the H3R Conformational Biosensor in Membrane Preparations

We have previously shown in radioligand binding experiments on cell membrane preparations that the Δicl3-H3RNluc/Halo(618) conformational biosensor binds ligands with comparable affinities to wild type H3R [12]. To evaluate whether the conformational biosensor can also detect ligand efficacy, as ΔBRET changes in membrane preparations, the H3R biosensor was first labeled with the HaloTag 618 dye, followed by the addition of NanoGlo® substrate and stimulation with a small selection H3R ligands that have also been (previously) tested on intact cells. The agonists histamine and imetit (10 μM) induced an increase in the ΔBRET ratio that peaked 15–20 min after stimulation followed by a gradual decrease (Figure 3A), which contrasts with the (previously) observed steady-state response for at least 45 min on intact cells expressing this H3R conformational sensor (see Figure 1B) [12]. The agonist peak response in membranes, however, is comparable with the observed steady-state amplitude in intact cells. All tested the inverse agonists (10 μM) steadily reduced the basal ΔBRET signal without reaching a clear steady-state plateau within the 1 h detection timeframe (Figure 3A), whereas stable bottom plateaus were previously observed on intact cells after approximately 30–45 min ligand stimulation (see Figure 1B) [12].
The Z-factor for the agonist (10 μM histamine) ΔBRET window was 0.6 ± 0.1 after 10 min stimulation (i.e., peak response) and remained above the required Z ≥ 0.5 up to 40 min indicating that the H3R biosensor in membranes is suitable for agonist screening within this timeframe [35]. However, the Z-factor decreased to 0.3 ± 0.15 after 60 min (Figure 3B,C). In contrast, the Z-factor gradually increased over time for the inverse agonist (10 μM pitolisant) ΔBRET window to Z = 0.4 ± 0.1 after 60 min and consequently did not qualify as a useful screening assay within the tested timeframe (Figure 3B,C). Extrapolation of the observed Z-factor over time suggests that a longer incubation period (e.g., 90 min) is required for inverse agonist screening to obtain Z-factors ≥ 0.5 (Figure 3C). Consequently, the simultaneous detection of agonist/inverse agonist-induced conformational changes will not be possible at one particular time-point in an end-point screening format using membranes.
Full concentration-response curves on the H3R biosensor in membranes were measured 30 min after stimulation with H3R agonists and inverse agonists (Figure 3D), resulting in intrinsic activity values that were largely comparable to those observed in intact cells (Figure 4A). Relative to the reference ligands histamine (IA = 1) and pitolisant (IA = −1), agonist imetit and all tested inverse agonists seemed to have a slightly increased amplitude (IA) on the H3R biosensor membranes as compared to intact cells (Figure 4A; Table 1).
Although some correlation was observed for the pEC50 values on the H3R biosensor in membranes versus intact cells, the rank order was different (membranes: thioperamide < bavisant < histamine <pitolisant < PF-3654746 < imetit < ABT-239 < clobenpropit versus intact cells: histamine < thioperamide <pitolisant <clobenpropit < ABT-239 < bavisant <imetit < PF-3654746) (Figure 4B; Table 1). Remarkably, histamine and clobenpropit showed a 16- and 32-fold higher potency, respectively, to change the H3R biosensor conformation in membranes preparations as compared to intact cells, whereas ABT-239 was 10-fold more potent on membrane preparations. Smaller potency differences (<5-fold) were observed for the other tested ligands with slightly increased potencies for pitolisant and imetit on H3R biosensor-expressing membranes but with decreased potency values for bavisant and PF-3654746. The potency of thioperamide was not significantly different between intact cells and membrane preparations.
One explanation for these observed potency differences is that ligand-induced H3R biosensor conformational changes were measured in two different buffers between membranes and intact cells, i.e., 50 mM Tris-HCl (pH 7.4) versus HBSS, respectively, and binding affinities for at least some H3R ligands are known to be considerably different between buffers that contain different salt concentrations [36,37,38]. Indeed, pEC50 values measured on intact cells expressing the H3R biosensor in HBSS containing 138 mM NaCl were lower for all the tested ligands, except for thioperamide, as compared to their pKi values measured on H3R biosensor-expressing membranes in 50 mM Tris-HCl buffer (pH 7.4) (Figure 4C; Table 1). Measuring ligand binding and conformational H3R changes on membranes in the same 50 mM Tris-HCl buffer (pH 7.4) yielded a better correlation between binding affinities and potency values for most ligands, except for bavisant and PF-3654746.

3. Discussion

Detection of conformational changes in GPCRs using RET between donor and acceptor molecules that are inserted in between TM5/TM6 and the C-terminal tail allows for the direct quantification of agonist and inverse agonist potency and efficacy upon ligand binding to the receptor. The FRET-based H3R sensor in intact cells and cultured on cover slips allowed for the rapid detection of ligand-induced conformational receptor changes using a fluorescent microscope equipped with a perfusion system with high temporal resolution but a relatively low throughput [22]. Substitution of YFP and CFP with respectively a red fluorescent dye covalently bound to HaloTag and NanoLuc allows a NanoBRET-based detection of conformational H3R changes in living cells using a 96-well plate reader-based format to readily generate full concentration-response curves for multiple ligands in a single assay run [12], as also previously optimized and reported for the α2A-adrenergic receptor, β2-adrenergic receptor, and the parathyroid hormone 1 receptor [11,21]. As a follow-up on our initial report on this sensor, we evaluated a number of well-known H3R tools (photo-switchable ligands or preclinical candidates) for their conformational effects. Our data indicate that all the preclinical candidates indeed act as inverse agonists, with bavisant showing a clear partial inverse agonistic effect. Moreover, the sensor also allowed the evaluation of the recently developed photo-switchable agonist and antagonist [31,32], although the light generated by the NanoLuc donor might to some extent also affect the cis-trans ratio due to spectral overlap of the cis-isomer and the NanoLuc emission.
Although this 96-well assay format significantly increases the ligand screening throughput, most microplate readers are only equipped with one or two injectors and consequently do not allow much flexibility with respect to adding multiple ligands and/or concentrations during BRET measurements. In this study we show that measurements can be paused to remove the plate from microplate reader to manually add (consecutive) ligands to the assay plate and continue the readout. Indeed, the rapid addition of pitolisant to cells that were pretreated with histamine resulted in a concentration-dependent decrease of the BRET signal showing that histamine can be quickly displaced from H3R by pitolisant thereby switching the receptor from an active into an inactive conformation. This is in line with the complete dissociation of histamine from the FRET-based H3R sensor within approximately 15 s upon washout [22]. Such a washout experiment is difficult to repeat using the NanoBRET-based H3R sensor as this will also remove the NanoGlo substrate resulting in reduced reproducibility, which could not be easily restored even by supplementing fresh NanoGlo.
In contrast to G protein-mediated downstream signaling assays, the agonist concentration–response curves on a conformational GPCR are not subjected to signal amplification and the observed potency should be comparable to binding affinity of the ligand for the receptor [39]. This makes the NanoBRET-based H3R biosensor very useful for initial drug discovery as a measure for ligand affinity and efficacy can be simultaneously obtained. However, performing pharmacological assays on living cells requires the constant availability of cells in their exponential growth phase, which can limit the numbers of assays. Considering that the NanoBRET-based H3R biosensor displayed comparable binding affinities for all tested ligands as the wild type H3R in membrane preparations that were generated from frozen cell pellets, we decided to evaluate the ligand-induced conformational H3R changes in these membranes. Ligand potency (pEC50) values measured on membranes were more in line with affinity values (pKi) obtained from radioligand competition binding assays, as compared to the potencies measured on intact cells. This is most likely related to presence of NaCl in the HBSS medium that is used for the intact cell assay, and known to affect binding affinities of H3R ligands [36,37,38]. Yet, a good correlation between the intrinsic activity of both agonists and inverse agonists was observed between the intact and membrane H3R conformational sensor assays.
In conclusion, the H3R biosensor in membranes could be a useful alternative for radioligand binding assays and allows for the simultaneous measurement of ligand affinity (via its potency) and efficacy on the H3R. Moreover, membranes expressing the H3R biosensor can be prepared in a large batch and stored in the freezer as (nearly) ready-to-use cell pellets to avoid prolonged and time-consuming culturing of an H3R biosensor-expressing stable cell line that is required for living cell assays.

4. Materials and Methods

4.1. Materials

Fetal bovine serum was obtained from Bodinco (Alkmaar, The Netherlands), and penicillin/streptomycin was purchased from GE Healthcare (Uppsala, Sweden). Dulbecco’s Modified Eagles Medium (DMEM, #41966-029), Dulbecco’s phosphate-buffered saline (DPBS, #D8662), trypsin-EDTA and Hanks’ Balanced Salt Solution (HBSS, #14025-050) were bought from Thermo Fisher Scientific (Waltham, MA, USA). Geneticin was obtained from Sigma-Aldrich (Taufkirchen, Germany). Linear polyethylenimine (PEI, 25-kDa) was obtained from Polysciences (Warrington, PA, USA). Nα-[methyl-3H] histamine ([3H]NAMH) (specific activity 81.7 Ci/mmol), Microscint-O scintillation liquid, GF/C filter plates and a Microbeta Wallac Trilux scintillation counter were purchased from PerkinElmer (Groningen, The Netherlands). Histamine·2HCl and imetit·2HBr were bought from Sigma-Aldrich (St. Louis, MO, USA). Thioperamide and clobenpropit were purchased from Abcam (Cambridge, UK), PF-3654746 and ABT-239 were obtained from Axon Medchem (Groningen, The Netherlands), and pitolisant and bavisant (JNJ-31001074) were obtained from Griffin Discoveries (Amsterdam, the Netherlands). VUF15000 and VUF14738 were synthesized in house as described previously [31,32]. NanoGlo® (N1130) and HaloTag® NanoBRET™ 618 Ligand (G9801) were bought from Promega (Madison, WI, USA). All other reagents were of analytical grade and obtained from conventional commercial sources.

4.2. Photochemistry

The photo-switchable compounds (VUF15000, VUF14738) were synthesized in-house and their in-depth photochemical properties were previously reported [31,32]. Briefly, both compounds have an λmax value for the π-π* transition of the trans-isomer of 360 ± 20 nm and an n-π* transition of the cis-isomer of 430 ± 17 nm. Photo-switchable compounds (10 mM in DMSO) were illuminated with 360 ± 20 nm light for 300 s to reach a photostationary state (PSS) containing over 86% of the cis-isomer or kept in dark to ensure more than 99% of the trans-isomer. The illumination was carried out in cylindrical clear glass vials of 4.5 mL volume, with a typical distance of 2 cm from the light source. All subsequent experimental steps were conducted in the dark or under near-infrared light. Both cis-VUF15000 and cis-VUF14738 have thermal relaxation half-lives of >100 days at room temperature.

4.3. Cell Culture

HEK293A cells stably expressing the Δicl3-H3RNluc/Halo(618) biosensor were cultured in DMEM (Dulbecco’s modified Eagle’s medium) supplemented with 10% FBS, 1% penicillin/streptomycin, 2 mM glutamine and 500 μg/mL geneticin at 37 °C, 5% CO2, as previously described [12].

4.4. BRET-Based H3R Biosensor Detection on Intact Cells

Cells were collected in culture medium supplemented with 50 nM HaloTag NanoBRET 618 dye, transferred into white bottom 96-well plates (50,000 cells/well) and cultured for another 24 h. Next, the culture medium was replaced by a 1/1000 dilution of NanoGlo® stock solution in HBSS. Subsequently, ligand solution or vehicle control was added and the stimulated BRET ratio was recorded at 37 °C using a BRETplus1 luminescence module (610 nm and 460 nm) of the PHERAstar FS (BMG labtech GmbH, Ortenberg, Germany). To avoid unintended backswitching of PSS-cis into the trans-isomer of the photo-switchable ligands VUF15000 and VUF14738 (λmax = 427) by the Nluc luminescent peak emission at 460 nm, the cells were first incubated for 20 min with the photo-switchable tool ligands followed by the addition of NanoGlo® solution and direct luminescence detection at 460 and 610 nm [31,32,33].

4.5. Membrane Preparation

HEK293A cells that stably express the Δicl3-H3RNluc/Halo(618) biosensor were collected from 10 cm dishes (90% confluency) as previously described [12]. Briefly, cells were detached using cold phosphate-buffered saline (PBS) and centrifuged at 1900× g for 15 min at 4 °C. The supernatant was discarded and the cell pellet was stored at freezer (−20 °C) for further experiments. On the day of the experiment, cell pellets were resuspended (4–6 mL/10 cm dish) in 50 mM Tris-HCl (pH 7.4) and disrupted using a Branson 250 sonifier (Boom B.V., Meppel, The Netherlands).

4.6. [3H]NAMH Competition Binding Assay on Membranes

Membrane suspensions (50 μL/well) were incubated with 2 nM [3H]NAMH in combination with increasing concentrations of unlabeled ligands for 2 h at 25 °C with gentle agitation. Incubation was stopped by harvesting the homogenates onto 96-well GF/C plates pre-soaked with 0.5% (v/v) PEI using a 96-well Filtermate harvester (PerkinElmer, Groningen, The Netherlands). The GF/C filter plates were then washed three times with cold wash buffer (50 mM Tris-HCl, pH 7.4, 4 °C) and dried for 30 min. Filter-bound radioactivity was quantified by a Microbeta Wallac Trilux scintillation counter (Perkin-Elmer) after addition of 25 μL/well scintillation liquid.

4.7. BRET-Based H3R Biosensor Detection on Membranes

Membrane suspensions (50 μL/well) were incubated with 50 nM HaloTag NanoBRET 618 dye for 2 h at 25 °C. Next, NanoGlo® stock solution (1/1000 dilution) was added per well and the basal BRET ratio was measured. Subsequently, ligand solution or vehicle control was added, and the stimulated BRET ratio was recorded at 25 °C.

4.8. Data Analysis

GraphPad Prism version 9.0 (GraphPad Software, San Diego, CA, USA) was used for data analysis and statistics.
BRET ratios were calculated by dividing the BRET signal at 610 nm by the Nluc signal at 460–480 nm. ΔBRET was used for quantifying ligand-induced changes in BRET ratio using the following equation:
Δ BRET = BRET   [ stim ] BRET   [ vehicle ]   BRET   [ vehicle ]
Concentration-response curves were fitted using the “log (agonist) vs. response (three parameters)” model:
response   = bottom   + top   bottom 1 + 10 ( Log   EC 50 Log   [ A ] )
Intrinsic activity (IA) value is calculated as:
IA = fitted   maximum   response   agonist   or   inverse   agonist fitted   maximum   response   histamine   or   pitolisant
where agonist and inverse agonists were compared to histamine and pitolisant, respectively, and inverse agonism is indicated by (−).
Competition binding curves were fitted using the “one-site—Fit log IC50” model:
binding   = bottom   + top   bottom 1 + 10 ( Log   [ A ] LogIC 50   )
Ligand binding affinities (Ki) were calculated using the Cheng-Prusoff equation [40]:
K i = IC 50 1 + [ L ] K d
where [L] and Kd represent the concentration and equilibrium dissociation constant of [3H]NAMH, respectively.
The Z-factors were calculated based on the following equation [35]:
Z factor = 1 ( 3 ×   σ [ compound ] + 3 ×   σ [ vehicle ] ) ( μ [ compound ] μ [ vehicle ] )
where σ represents the standard deviation, μ represents the average respectively.
The correlation graphs were analyzed using the “Deming regression” model.

Supplementary Materials

The following supporting information can be downloaded at: https://www.mdpi.com/article/10.3390/ijms23158211/s1.

Author Contributions

Conceptualization, R.L. and H.F.V.; methodology, X.M. and M.G.; validation, X.M. and M.G.; formal analysis, X.M.; investigation, X.M. and M.G.; resources, R.L. and H.F.V.; data curation, X.M.; writing—original draft preparation, X.M.; writing—review and editing, R.L. and H.F.V.; visualization, X.M. and H.F.V.; supervision, R.L. and H.F.V.; project administration, R.L. and H.F.V.; funding acquisition, X.M. and M.G. All authors have read and agreed to the published version of the manuscript.

Funding

X.M. (201703250074) and M.G. (202006310027) are supported by CSC Chinese scholarship grants.

Institutional Review Board Statement

Not applicable.

Informed Consent Statement

Not applicable.

Data Availability Statement

Not applicable.

Acknowledgments

We thank Hannes Schihada from the Karolinska Institutet, Stockholm, Sweden for helpful discussion. We thank Yang Zheng and Hans Custers for technical assistance with photochemistry.

Conflicts of Interest

The authors declare no conflict of interest.

References

  1. García-Nafría, J.; Tate, C.G. Cryo-Electron Microscopy: Moving Beyond X-ray Crystal Structures for Drug Receptors and Drug Development. Annu. Rev. Pharmacol. Toxicol. 2020, 60, 51–71. [Google Scholar] [CrossRef] [PubMed] [Green Version]
  2. Wingler, L.M.; Lefkowitz, R.J. Conformational Basis of G Protein-Coupled Receptor Signaling Versatility. Trends Cell Biol. 2020, 30, 736–747. [Google Scholar] [CrossRef] [PubMed]
  3. Seyedabadi, M.; Gharghabi, M.; Gurevich, E.V.; Gurevich, V.V. Structural basis of GPCR coupling to distinct signal transducers: Implications for biased signaling. Trends Biochem. Sci. 2022, 47, 570–581. [Google Scholar] [CrossRef] [PubMed]
  4. Masureel, M.; Zou, Y.; Picard, L.-P.; Van Der Westhuizen, E.; Mahoney, J.P.; Rodrigues, J.P.G.L.M.; Mildorf, T.J.; Dror, R.O.; Shaw, D.E.; Bouvier, M.; et al. Structural insights into binding specificity, efficacy and bias of a β2AR partial agonist. Nat. Chem. Biol. 2018, 14, 1059–1066. [Google Scholar] [CrossRef]
  5. Shukla, A.K. Structural Basis of Partial Agonism at the β2-Adrenergic Receptor. Biochemistry 2019, 58, 137–139. [Google Scholar] [CrossRef] [Green Version]
  6. Gregorio, G.G.; Masureel, M.; Hilger, D.; Terry, D.S.; Juette, M.; Zhao, H.; Zhou, Z.; Perez-Aguilar, J.M.; Hauge, M.; Mathiasen, S.; et al. Single-molecule analysis of ligand efficacy in β2AR-G-protein activation. Nature 2017, 547, 68–73. [Google Scholar] [CrossRef] [Green Version]
  7. Haider, R.S.; Godbole, A.; Hoffmann, C. To sense or not to sense-new insights from GPCR-based and arrestin-based biosensors. Curr. Opin. Cell Biol. 2019, 57, 16–24. [Google Scholar] [CrossRef]
  8. Kauk, M.; Hoffmann, C. Intramolecular and Intermolecular FRET Sensors for GPCRs—Monitoring Conformational Changes and Beyond. Trends Pharmacol. Sci. 2018, 39, 123–135. [Google Scholar] [CrossRef]
  9. Fernández-Dueñas, V.; Gómez-Soler, M.; López-Cano, M.; Taura, J.J.; Ledent, C.; Watanabe, M.; Jacobson, K.A.; Vilardaga, J.-P.; Ciruela, F. Uncovering caffeine's adenosine A2A receptor inverse agonism in experimental parkinsonism. ACS Chem. Biol. 2014, 9, 2496–2501. [Google Scholar] [CrossRef] [Green Version]
  10. Picard, L.-P.; Schönegge, A.-M.; Lohse, M.J.; Bouvier, M. Bioluminescence resonance energy transfer-based biosensors allow monitoring of ligand- and transducer-mediated GPCR conformational changes. Commun. Biol. 2018, 1, 106. [Google Scholar] [CrossRef]
  11. Schihada, H.; Vandenabeele, S.; Zabel, U.; Frank, M.; Lohse, M.J.; Maiellaro, I. A universal bioluminescence resonance energy transfer sensor design enables high-sensitivity screening of GPCR activation dynamics. Commun. Biol. 2018, 1, 105. [Google Scholar] [CrossRef] [PubMed]
  12. Schihada, H.; Ma, X.; Zabel, U.; Vischer, H.F.; Schulte, G.; Leurs, R.; Pockes, S.; Lohse, M.J. Development of a Conformational Histamine H3 Receptor Biosensor for the Synchronous Screening of Agonists and Inverse Agonists. ACS Sens. 2020, 5, 1734–1742. [Google Scholar] [CrossRef] [PubMed]
  13. Vilardaga, J.-P.; Bünemann, M.; Krasel, C.; Castro, M.; Lohse, M.J. Measurement of the Millisecond Activation Switch of G Protein-coupled Receptors in Living Cells. Nat Biotechnol. 2003, 21, 807–812. [Google Scholar] [CrossRef] [PubMed]
  14. Zürn, A.; Zabel, U.; Vilardaga, J.-P.; Schindelin, H.; Lohse, M.J.; Hoffmann, C. Fluorescence resonance energy transfer analysis of alpha 2a-adrenergic receptor activation reveals distinct agonist-specific conformational changes. Mol. Pharmacol. 2009, 75, 534–541. [Google Scholar] [CrossRef] [PubMed] [Green Version]
  15. Hoffmann, C.; Gaietta, G.; Bünemann, M.; Adams, S.R.; Oberdorff-Maass, S.; Behr, B.; Vilardaga, J.-P.; Tsien, R.Y.; Ellisman, M.H.; Lohse, M.J. A FlAsH-based FRET approach to determine G protein-coupled receptor activation in living cells. Nat. Methods 2005, 2, 171–176. [Google Scholar] [CrossRef] [PubMed]
  16. Ziegler, N.; Bätz, J.; Zabel, U.; Lohse, M.J.; Hoffmann, C. FRET-based sensors for the human M1-, M3-, and M5-acetylcholine receptors. Bioorg. Med. Chem. 2011, 19, 1048–1054. [Google Scholar] [CrossRef]
  17. Bourque, K.; Pétrin, D.; Sleno, R.; Devost, D.; Zhang, A.; Hébert, T.E. Distinct Conformational Dynamics of Three G Protein-Coupled Receptors Measured Using FlAsH-BRET Biosensors. Front. Endocrinol. 2017, 8, 61. [Google Scholar] [CrossRef] [Green Version]
  18. Devost, D.; Sleno, R.; Pé Trin, D.; Zhang, A.; Shinjo, Y.; Okde, R.; Aoki, J.; Inoue, A.; Hébert, T.E. Conformational profiling of the AT1 angiotensin II receptor reflects biased agonism, G protein coupling, and cellular context. J. Biol. Chem. 2017, 292, 5443–5456. [Google Scholar] [CrossRef] [Green Version]
  19. Sleno, R.; Pétrin, D.; Devost, D.; Goupil, E.; Zhang, A.; Hébert, T.E. Designing BRET-based conformational biosensors for G protein-coupled receptors. Methods 2016, 92, 11–18. [Google Scholar] [CrossRef]
  20. Szalai, B.; Barkai, L.; Turu, G.; Szidonya, L.; Várnai, P.; Hunyady, L. Allosteric interactions within the AT1 angiotensin receptor homodimer: Role of the conserved DRY motif. Biochem. Pharmacol. 2012, 84, 477–485. [Google Scholar] [CrossRef]
  21. Schihada, H.; Nemec, K.; Lohse, M.J.; Maiellaro, I. Bioluminescence in G Protein-Coupled Receptors Drug Screening Using Nanoluciferase and Halo-Tag Technology. Methods Mol. Biol. 2021, 2268, 137–147. [Google Scholar] [PubMed]
  22. Liu, Y.; Zeng, H.; Pediani, J.D.; Ward, R.J.; Chen, L.Y.; Wu, N.; Ma, L.; Tang, M.; Yang, Y.; An, S.; et al. Visualization of the activation of the histamine H3 receptor (H3R) using novel fluorescence resonance energy transfer biosensors and their potential application to the study of H3R pharmacology. FEBS J. 2018, 285, 2319–2336. [Google Scholar] [CrossRef] [PubMed] [Green Version]
  23. Panula, P.; Chazot, P.L.; Cowart, M.; Gutzmer, R.; Leurs, R.; Liu, W.L.S.; Stark, H.; Thurmond, R.L.; Haas, H.L. International Union of Basic and Clinical Pharmacology. XCVIII. Histamine Receptors. Pharmacol. Rev. 2015, 67, 601–655. [Google Scholar] [CrossRef] [PubMed] [Green Version]
  24. Rouleau, A.; Ligneau, X.; Tardivel-Lacombe, J.; Morisset, S.; Gbahou, F.; Schwartz, J.C.; Arrang, J.M. Histamine H3-receptor-mediated [35S]GTP gamma[S] binding: Evidence for constitutive activity of the recombinant and native rat and human H3 receptors. Br. J. Pharmacol. 2002, 135, 383–392. [Google Scholar] [CrossRef] [Green Version]
  25. Wieland, K.; Bongers, G.; Yamamoto, Y.; Hashimoto, T.; Yamatodani, A.; Menge, W.M.; Timmerman, H.; Lovenberg, T.W.; Leurs, R. Constitutive activity of histamine h(3) receptors stably expressed in SK-N-MC cells: Display of agonism and inverse agonism by H(3) antagonists. J. Pharmacol. Exp. Ther. 2001, 299, 908–914. [Google Scholar]
  26. Morisset, S.; Rouleau, A.; Ligneau, X.; Gbahou, F.; Tardivel-Lacombe, J.; Stark, H.; Schunack, W.; Ganellin, C.R.; Schwartz, J.C.; Arrang, J.M. High constitutive activity of native H3 receptors regulates histamine neurons in brain. Nature 2000, 408, 860–864. [Google Scholar] [CrossRef]
  27. Alhusaini, M.; Eissa, N.; Saad, A.K.; Beiram, R.; Sadek, B. Revisiting Preclinical Observations of Several Histamine H3 Receptor Antagonists/Inverse Agonists in Cognitive Impairment, Anxiety, Depression, and Sleep-Wake Cycle Disorder. Front. Pharmacol. 2022, 13, 861094. [Google Scholar] [CrossRef]
  28. Ghamari, N.; Zarei, O.; Arias-Montaño, J.-A.; Reiner, D.; Dastmalchi, S.; Stark, H.; Hamzeh-Mivehroud, M. Histamine H3 receptor antagonists/inverse agonists: Where do they go? Pharmacol. Ther. 2019, 200, 69–84. [Google Scholar] [CrossRef]
  29. Urquhart, L. FDA new drug approvals in Q3 2019. Nat. Rev. Drug Discov. 2019, 18, 816. [Google Scholar] [CrossRef]
  30. Kollb-Sielecka, M.; Demolis, P.; Emmerich, J.; Markey, G.; Salmonson, T.; Haas, M. The European Medicines Agency review of pitolisant for treatment of narcolepsy: Summary of the scientific assessment by the Committee for Medicinal Products for Human Use. Sleep Med. 2017, 33, 125–129. [Google Scholar] [CrossRef]
  31. Hauwert, N.J.; Mocking, T.A.M.; Da Costa Pereira, D.; Lion, K.; Huppelschoten, Y.; Vischer, H.F.; de Esch, I.J.P.; Wijtmans, M.; Leurs, R. A Photoswitchable Agonist for the Histamine H3 Receptor, a Prototypic Family A G-Protein-Coupled Receptor. Angew. Chem. Int. Ed. Engl. 2019, 58, 4531–4535. [Google Scholar] [CrossRef] [PubMed] [Green Version]
  32. Hauwert, N.J.; Mocking, T.A.M.; Da Costa Pereira, D.; Kooistra, A.J.; Wijnen, L.M.; Vreeker, G.C.M.; Verweij, E.W.E.; De Boer, A.H.; Smit, M.J.; de Graaf, C.; et al. Synthesis and Characterization of a Bidirectional Photoswitchable Antagonist Toolbox for Real-Time GPCR Photopharmacology. J. Am. Chem. Soc. 2018, 140, 4232–4243. [Google Scholar] [CrossRef] [PubMed] [Green Version]
  33. Hall, M.P.; Unch, J.; Binkowski, B.F.; Valley, M.P.; Butler, B.L.; Wood, M.G.; Otto, P.; Zimmerman, K.; Vidugiris, G.; Machleidt, T.; et al. Engineered luciferase reporter from a deep sea shrimp utilizing a novel imidazopyrazinone substrate. ACS Chem. Biol. 2012, 7, 1848–1857. [Google Scholar] [CrossRef] [PubMed]
  34. Shakhmin, A.; Hall, M.P.; Machleidt, T.; Walker, J.R.; Wood, K.V.; Kirkland, T.A. Coelenterazine analogues emit red-shifted bioluminescence with NanoLuc. Org. Biomol. Chem. 2017, 15, 8559–8567. [Google Scholar] [CrossRef]
  35. Zhang, J.; Chung, T.; Oldenburg, K. A Simple Statistical Parameter for Use in Evaluation and Validation of High Throughput Screening Assays. J. Biomol. Screen. 1999, 4, 67–73. [Google Scholar] [CrossRef]
  36. Clark, E.A.; Hill, S.J. Differential effect of sodium ions and guanine nucleotides on the binding of thioperamide and clobenpropit to histamine H3-receptors in rat cerebral cortical membranes. Br. J. Pharmacol. 1995, 114, 357–362. [Google Scholar] [CrossRef] [Green Version]
  37. Mocking, T.A.M.; Verweij, E.W.E.; Vischer, H.F.; Leurs, R. Homogeneous, Real-Time NanoBRET Binding Assays for the Histamine H3 and H4 Receptors on Living Cells. Mol. Pharmacol. 2018, 94, 1371–1381. [Google Scholar] [CrossRef] [Green Version]
  38. Schnell, D.; Seifert, R. Modulation of histamine H(3) receptor function by monovalent ions. Neurosci. Lett. 2010, 472, 114–118. [Google Scholar] [CrossRef]
  39. Kenakin, T. Biased Receptor Signaling in Drug Discovery. Pharmacol. Rev. 2019, 71, 267–315. [Google Scholar] [CrossRef] [Green Version]
  40. Cheng, H.C. The power issue: Determination of KB or Ki from IC50. A closer look at the Cheng-Prusoff equation, the Schild plot and related power equations. J. Pharmacol. Toxicol. Methods 2001, 46, 61–71. [Google Scholar] [CrossRef]
Figure 1. Ligand-induced changes in Δicl3-H3RNluc/Halo(618) biosensor conformation detected by BRET in intact HEK293A cells. (A) Scheme of H3R biosensor configuration with the self-labeling HaloTag protein inserted in the truncated IL3 between Thr229 and Phe348 and Nluc fused to the C-terminal tail as the BRET acceptor and donor, respectively. (B) Conformational changes in Δicl3-H3RNluc/Halo(618) upon stimulation with 10 μM H3R ligands measured as ΔBRET ratio in time. (C) Concentration-response curves measured after 30 min stimulation of the H3R biosensor with H3R ligands. Data are displayed as mean ± SD from 4 independent experiments performed in duplicate. (DE) the photo-switchable agonist VUF15000 (D) and inverse agonist VUF14738 (E) switch from trans (cyan) to cis (magenta) upon illumination with 360 nm and from cis to trans by illumination with 430 nm. (F) Concentration-response curves measured after 20 min stimulation of the H3R biosensor with dark (trans) or pre-illuminated (cis) photo-switchable VUF15000 and VUF14738. Data are displayed as the mean ± SD from 3 independent experiments performed in duplicate.
Ijms 23 08211 g001
Figure 2. Dynamic changes in Δicl3-H3RNluc/Halo(618) biosensor conformation detected by BRET in intact HEK293A cells. (A) Injection of different concentrations pitolisant attenuates the histamine-induced (10 μM) conformational change in the H3R biosensor. (B) Consecutive injection of increasing (log) concentrations of histamine in the same three wells. Data are displayed as mean ± SD from one representative experiment performed in triplicate. (C) Concentration-response curve of histamine generated from Figure 2B, 15 min after each consecutive injection of increasing concentrations histamine in triplicate (3 wells/exp) or 15 min after stimulation of individual wells with increasing concentrations histamine in triplicate (21 wells/exp). Data are displayed as mean ± SD from 3 independent experiments performed in triplicate.
Ijms 23 08211 g002
Figure 3. BRET responses of H3R ligands determined on Δicl3-H3RNluc/Halo(618) cell membrane prepared in 50 mM Tris-HCl (pH 7.4). (A) ΔBRET time course of eight H3R ligands at 10 μM concentration. (B) ΔBRET ratio measurements in 24 wells of a 96-well plate containing H3R biosensor-expressing cell membranes treated with either vehicle (10 and 60 min), 10 μM histamine (10 min) or 10 μM pitolisant (60 min) to calculate the Z-factor. One representative graph from three independent experiments is shown. (C) Z-factors over time of cell membrane treated with 10 μM histamine or pitolisant in 96-well plate. (D) Concentration-response curves measured after 30 min stimulation of H3R biosensor-expressing membranes with H3R ligands. Data are displayed as mean ± SD from at least 3 independent experiments performed in duplicate.
Ijms 23 08211 g003
Figure 4. Comparison of H3R biosensor pharmacology on intact cells versus membrane preparations in response to H3R ligands. (A,B) Comparison of intrinsic activity (IA) values (A) and pEC50 (B) obtained from H3R biosensor in intact cells versus membrane preparations upon stimulation with increasing ligand concentrations for 30 min (see Figure 1C and Figure 3D; Table 1). (C) Comparison of pKi values obtained from radioligand competition binding experiments on H3R biosensor-expressing membranes in 50 mM Tris-HCl (pH 7.4) with pEC50 values obtained from H3R biosensors in intact cells (in HBSS) and membrane preparations (in 50 mM Tris-HCl (pH 7.4)) upon stimulation with increasing ligand concentrations for 30 min (see Figure 1C and Figure 3D; Table 1). Differences between pEC50 values obtained from H3R biosensor in intact cells versus membrane preparations are indicated with grey arrows. Data are displayed as mean ± SD from at least 3 independent experiments performed in duplicate. Deming linear regression was used to compare the fitted affinity and/or potency values between the different assay formats, the dotted line represents line of unity (B,C). HA = histamine; ime = imetit; pit = pitolisant; clob = clobenpropit; thio = thioperamide; bav = bavisant; ABT = ABT-239; PF = PF-3654746.
Ijms 23 08211 g004
Table 1. Potencies (pEC50), intrinsic activities (IA) and binding affinities (pKi) of H3R ligands on the Δicl3-H3RNluc/Halo(618) biosensor expressed on intact cells and membrane preparations, measured in HBSS and 50 mM Tris-HCl (pH 7.4), respectively. The pKi values were calculated using the Cheng–Prusoff equation from the IC50 values determined in competition binding with [3H]NAMH (Supplementary Figure S1). Data represent the mean ± SD of (n) experiments. n.d.: not determined.
LigandIntact CellsMembrane Preparations
pEC50IA 1pEC50IA 1pKi
histamine6.4 ± 0.1 (3) *(+)1.00 ± 0.027.6 ± 0.1 (6) *(+)1.00 ± 0.097.9 ± 0.1 (3)
pitolisant7.2 ± 0.2 (4) *(−)1.00 ± 0.037.9 ± 0.3 (3) *(−)1.00 ± 0.087.7 ± 0.3 (3)
ABT-2397.8 ± 0.3 (4) *(−)0.96 ± 0.058.8 ± 0.1 (3) *(−)0.99 ± 0.049.1 ± 0.2 (3)
bavisant8.1 ± 0.2 (4) *(−)0.77 ± 0.077.4 ± 0.1 (4) *(−)0.88 ± 0.068.2 ± 0.2 (3)
PF-36547468.5 ± 0.1 (4) *(−)0.92 ± 0.118.1 ± 0.2 (4) *(−)1.05 ± 0.069.1 ± 0.2 (3)
trans-VUF150006.3 ± 0.1 (3) 2(+)1.36 ± 0.05 2n.d.n.d.8.0 ± 0.2 (3)
cis-VUF150005.4 ± 0.2 (3) 2(+)1.35 ± 0.04 2n.d.n.d.7.2 ± 0.0 (3)
trans-VUF147386.2 ± 0.2 (3)n.d. 4n.d.n.d.6.2 ± 0.1 (3)
cis-VUF147387.1 ± 0.2 (3)n.d. 4n.d.n.d.7.7 ± 0.3 (3)
imetit8.2 ± 0.1 3,*(+)0.61 ± 0.018.8 ± 0.1 (3) *(+)0.86 ± 0.149.1 ± 0.1 3
clobenpropit7.4 ± 0.0 3,*(−)0.38 ± 0.018.9 ± 0.1 (3) *(−)0.65 ± 0.099.3 ± 0.1 3
thioperamide7.1 ± 0.1 3(−)0.30 ± 0.017.2 ± 0.2 (3)(−)0.60 ± 0.137.2 ± 0.1 3
1 IA was calculated using the fitted ligand-induced window “span” as fraction of full agonist histamine for the agonists (+) or using full inverse agonist pitolisant for the inverse agonists (−). 2 Data for VUF15000 photoisomers were fitted using the “log(agonist) vs. response (three parameters)” model with a shared top plateau as curves could not be finished and under the assumption that trans-and cis-isomers have same efficacy as previously reported in [35S]-GTPγS binding experiments to measure G protein activation [31]. 3 Potency and affinity values that were previously reported on the H3R conformational biosensor [12]. 4 Intrinsic activity could not be calculated as the inverse agonist reference pitolisant was not included in the same experiments. * statistical difference (p < 0.05) in pEC50 values of H3R biosensor conformational changes between intact cells and membrane preparation in an unpaired t-test.
Publisher’s Note: MDPI stays neutral with regard to jurisdictional claims in published maps and institutional affiliations.

