
The Relationship between the Aberrant Long Non-Coding RNA-Mediated Competitive Endogenous RNA Network and Alzheimer’s Disease Pathogenesis


Abstract
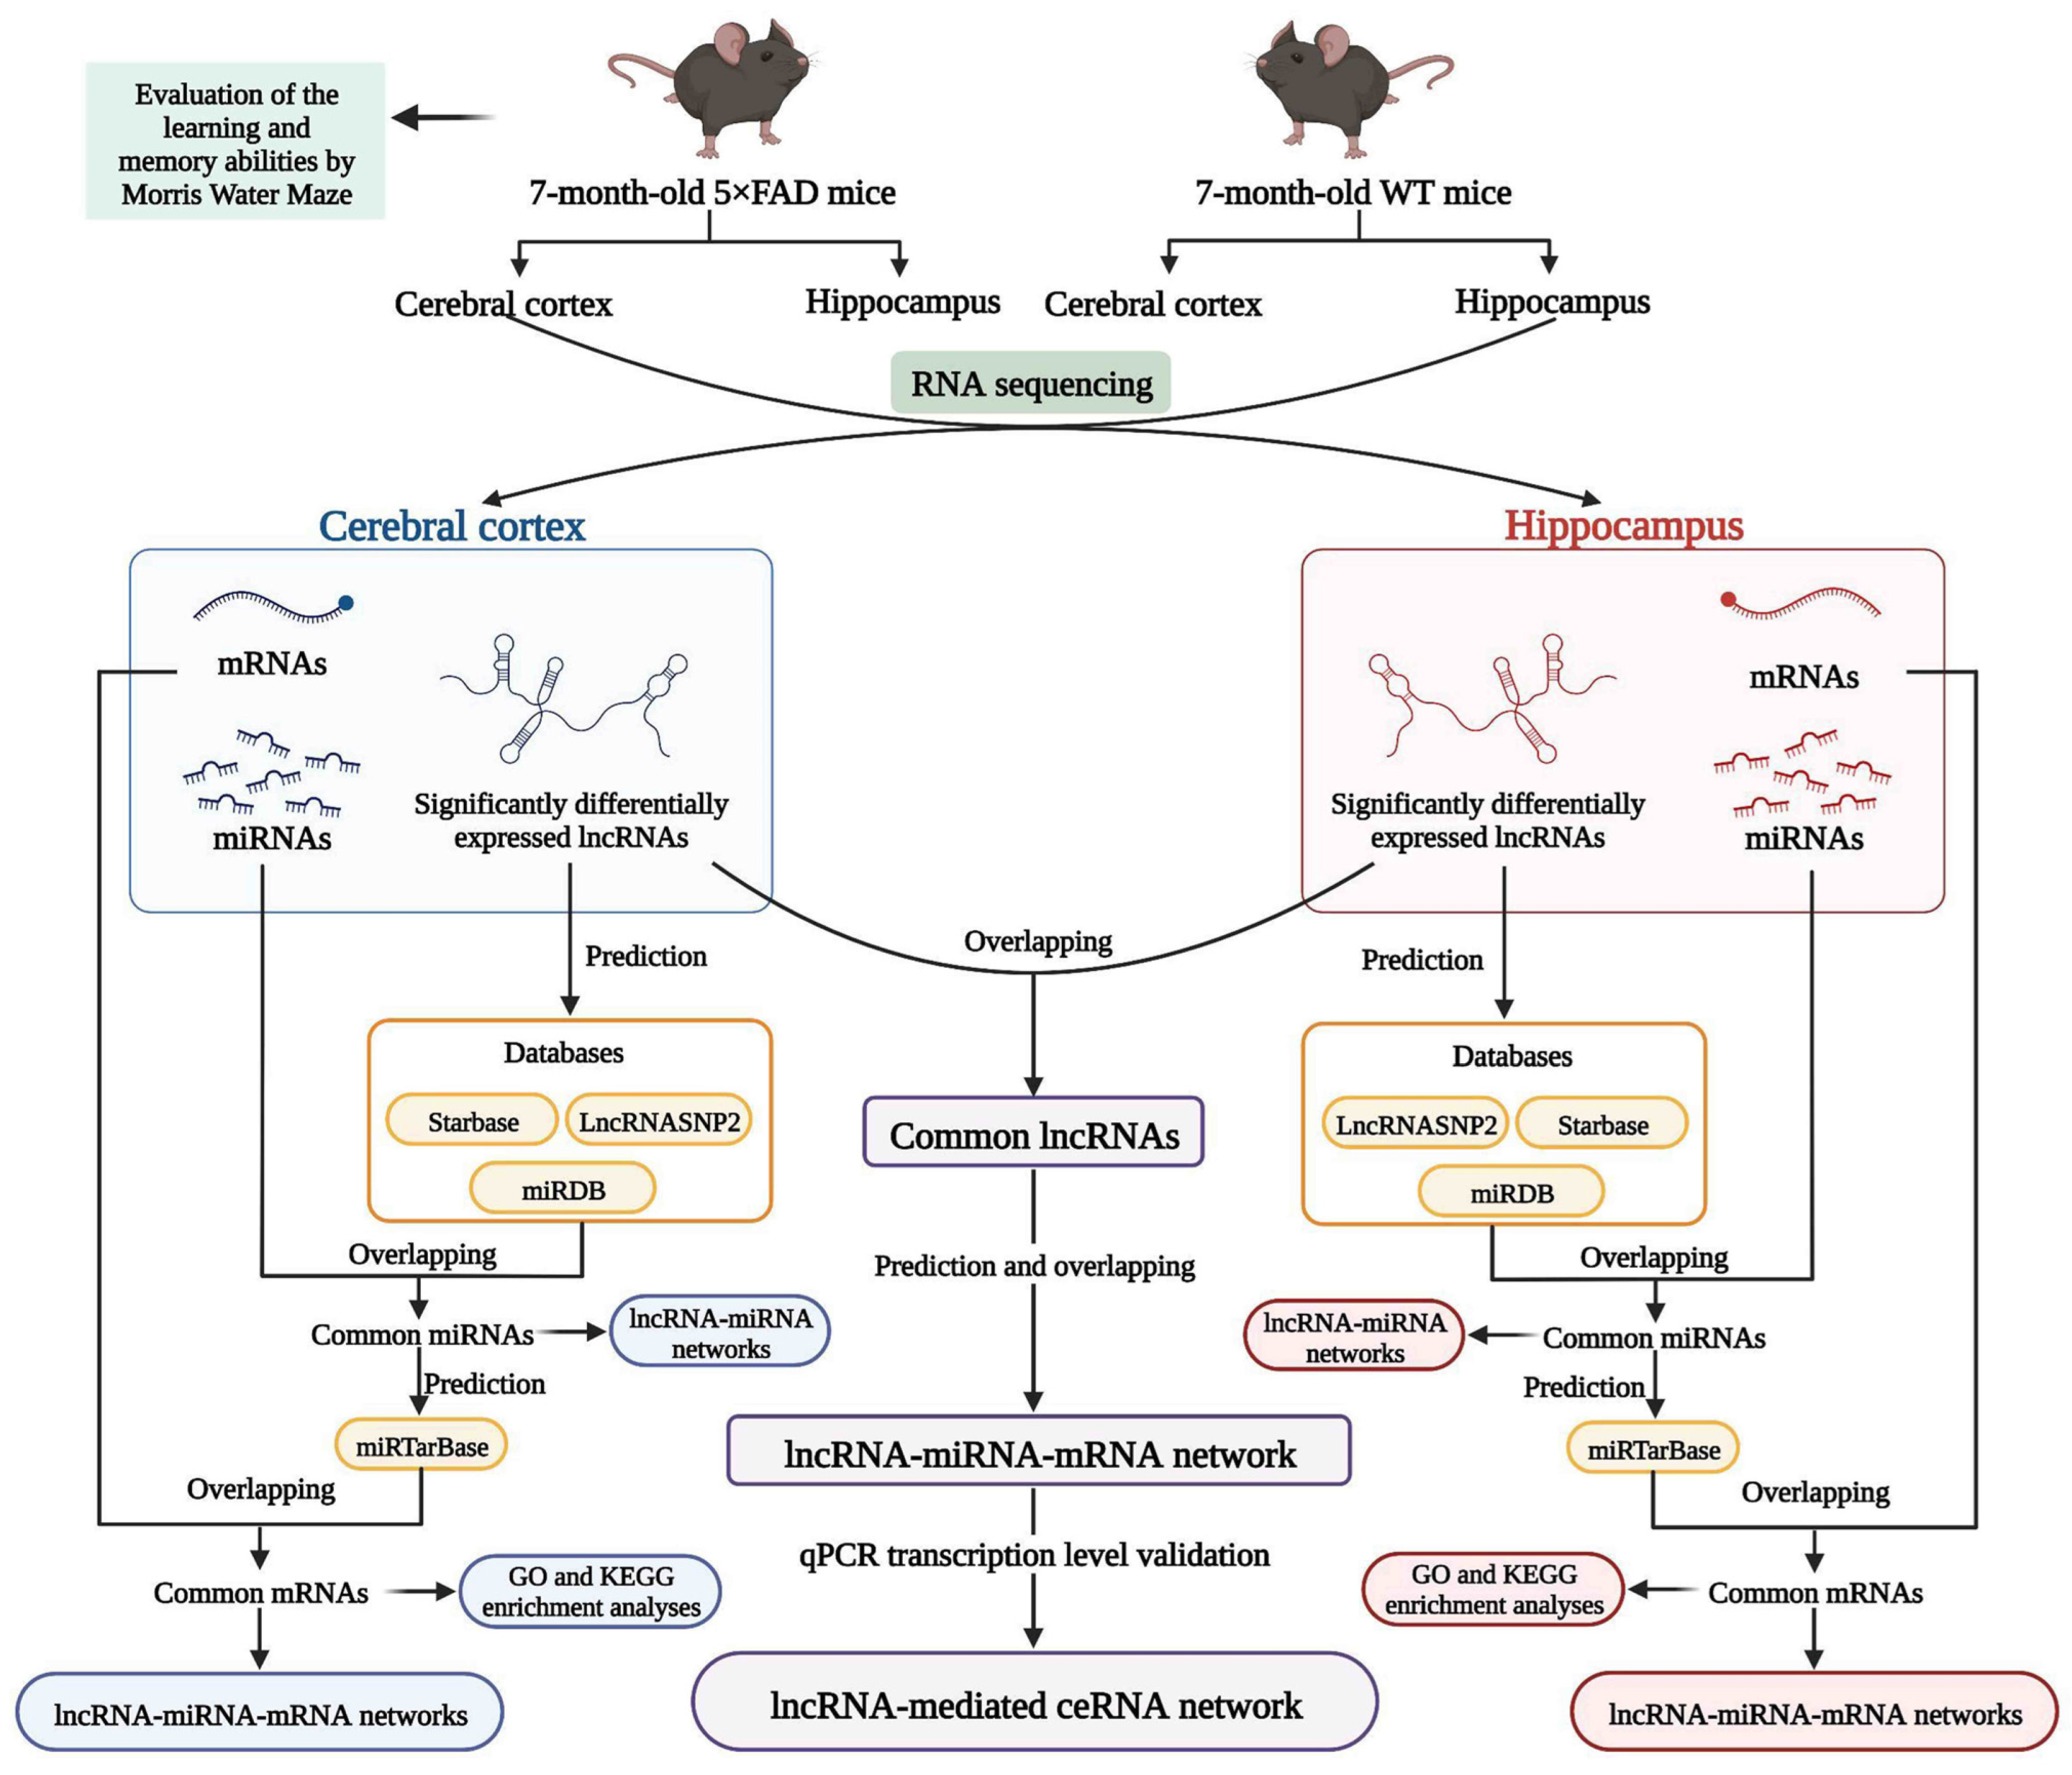
:1. Introduction
2. Results
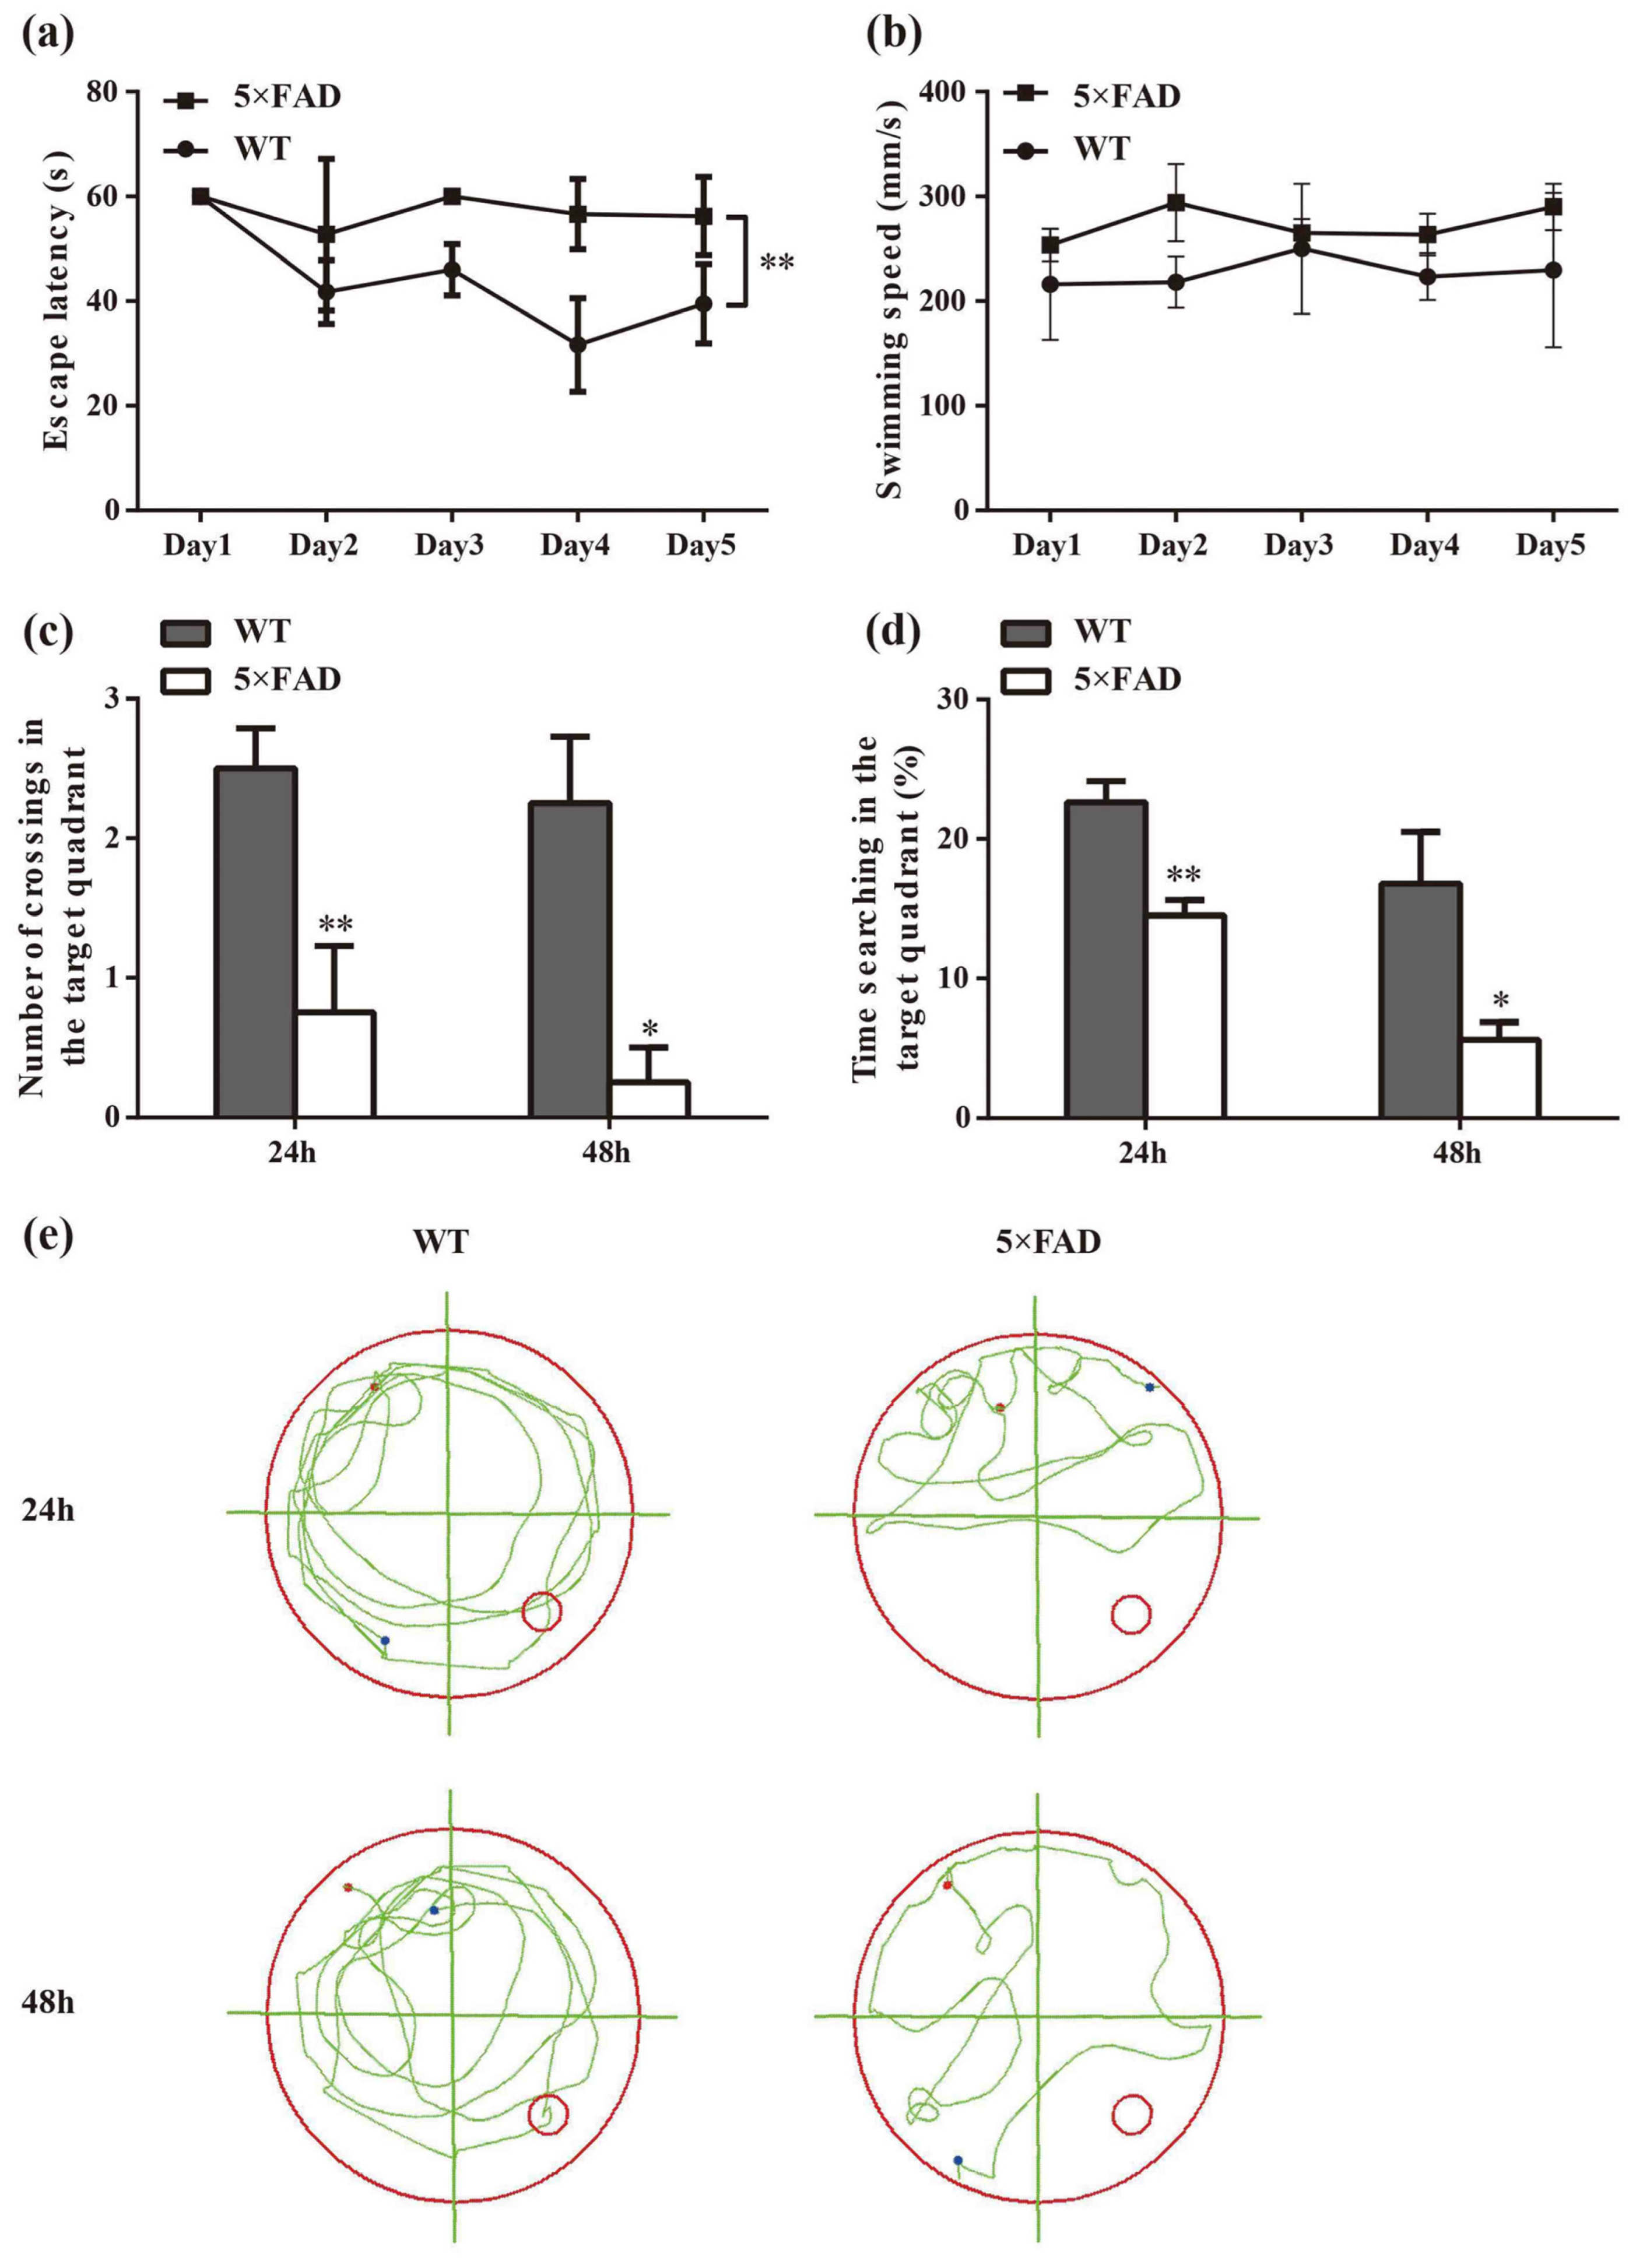
2.1. Spatial Cognition Capability Is Reduced in 5×FAD Mice
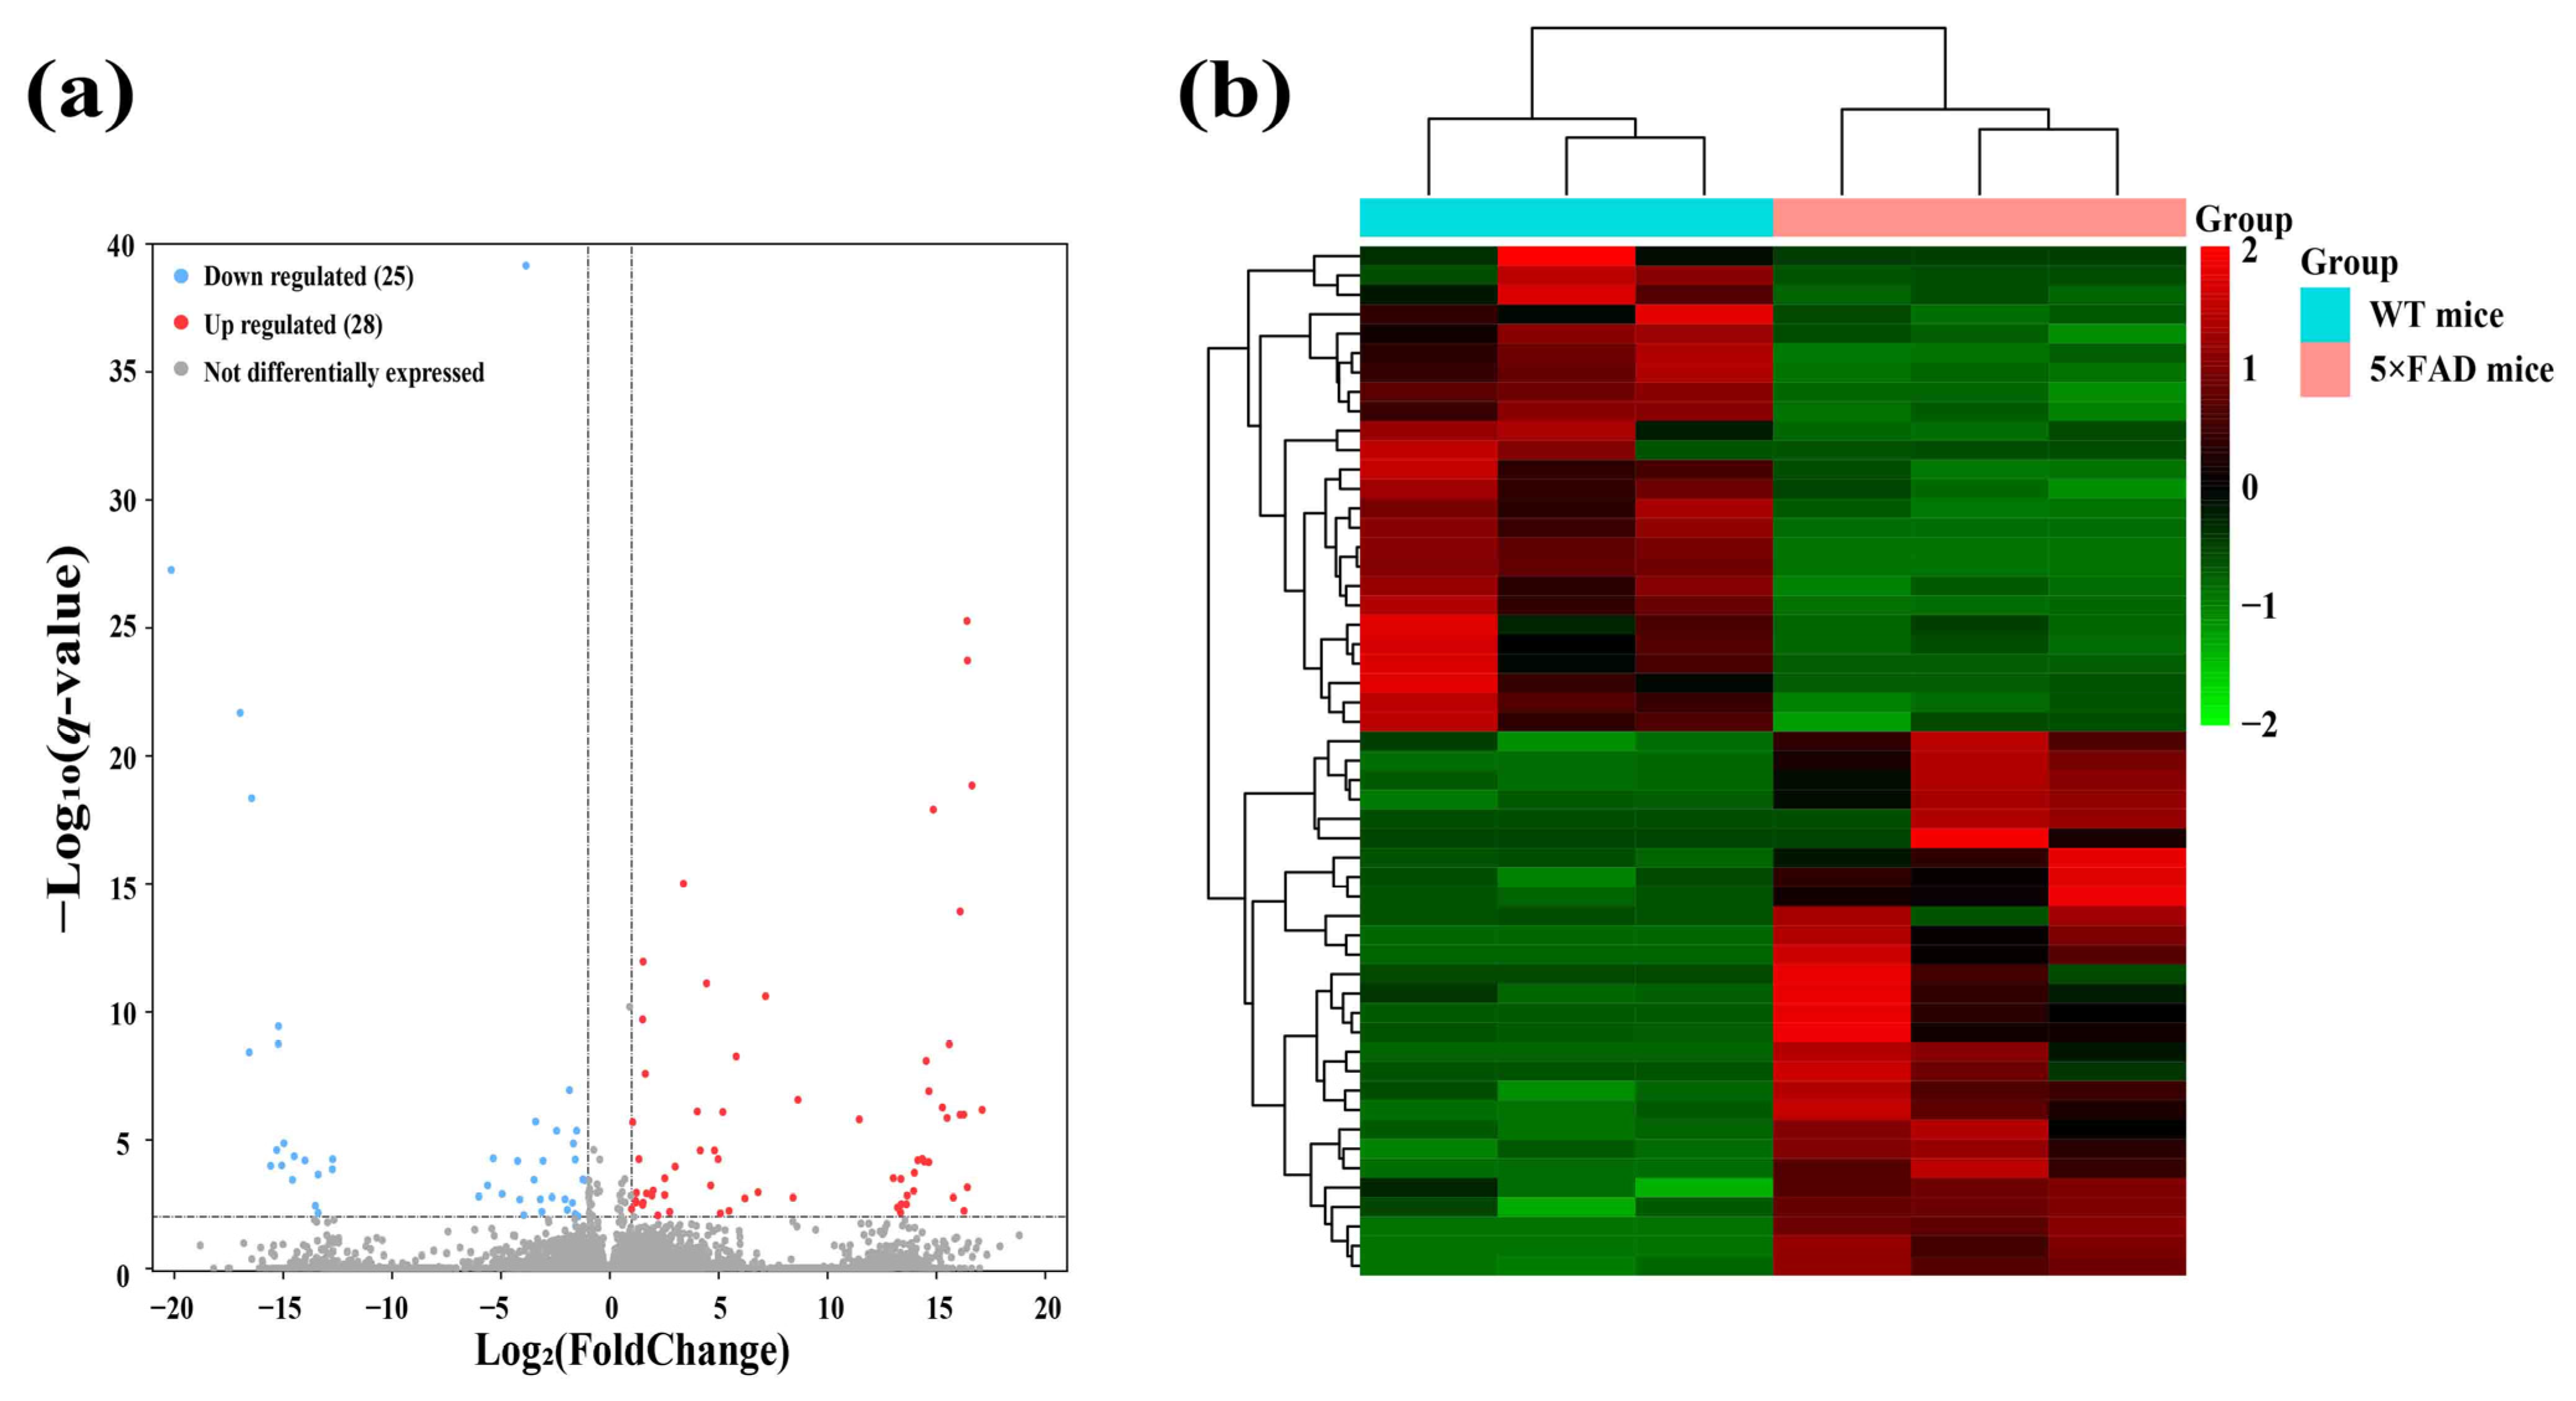
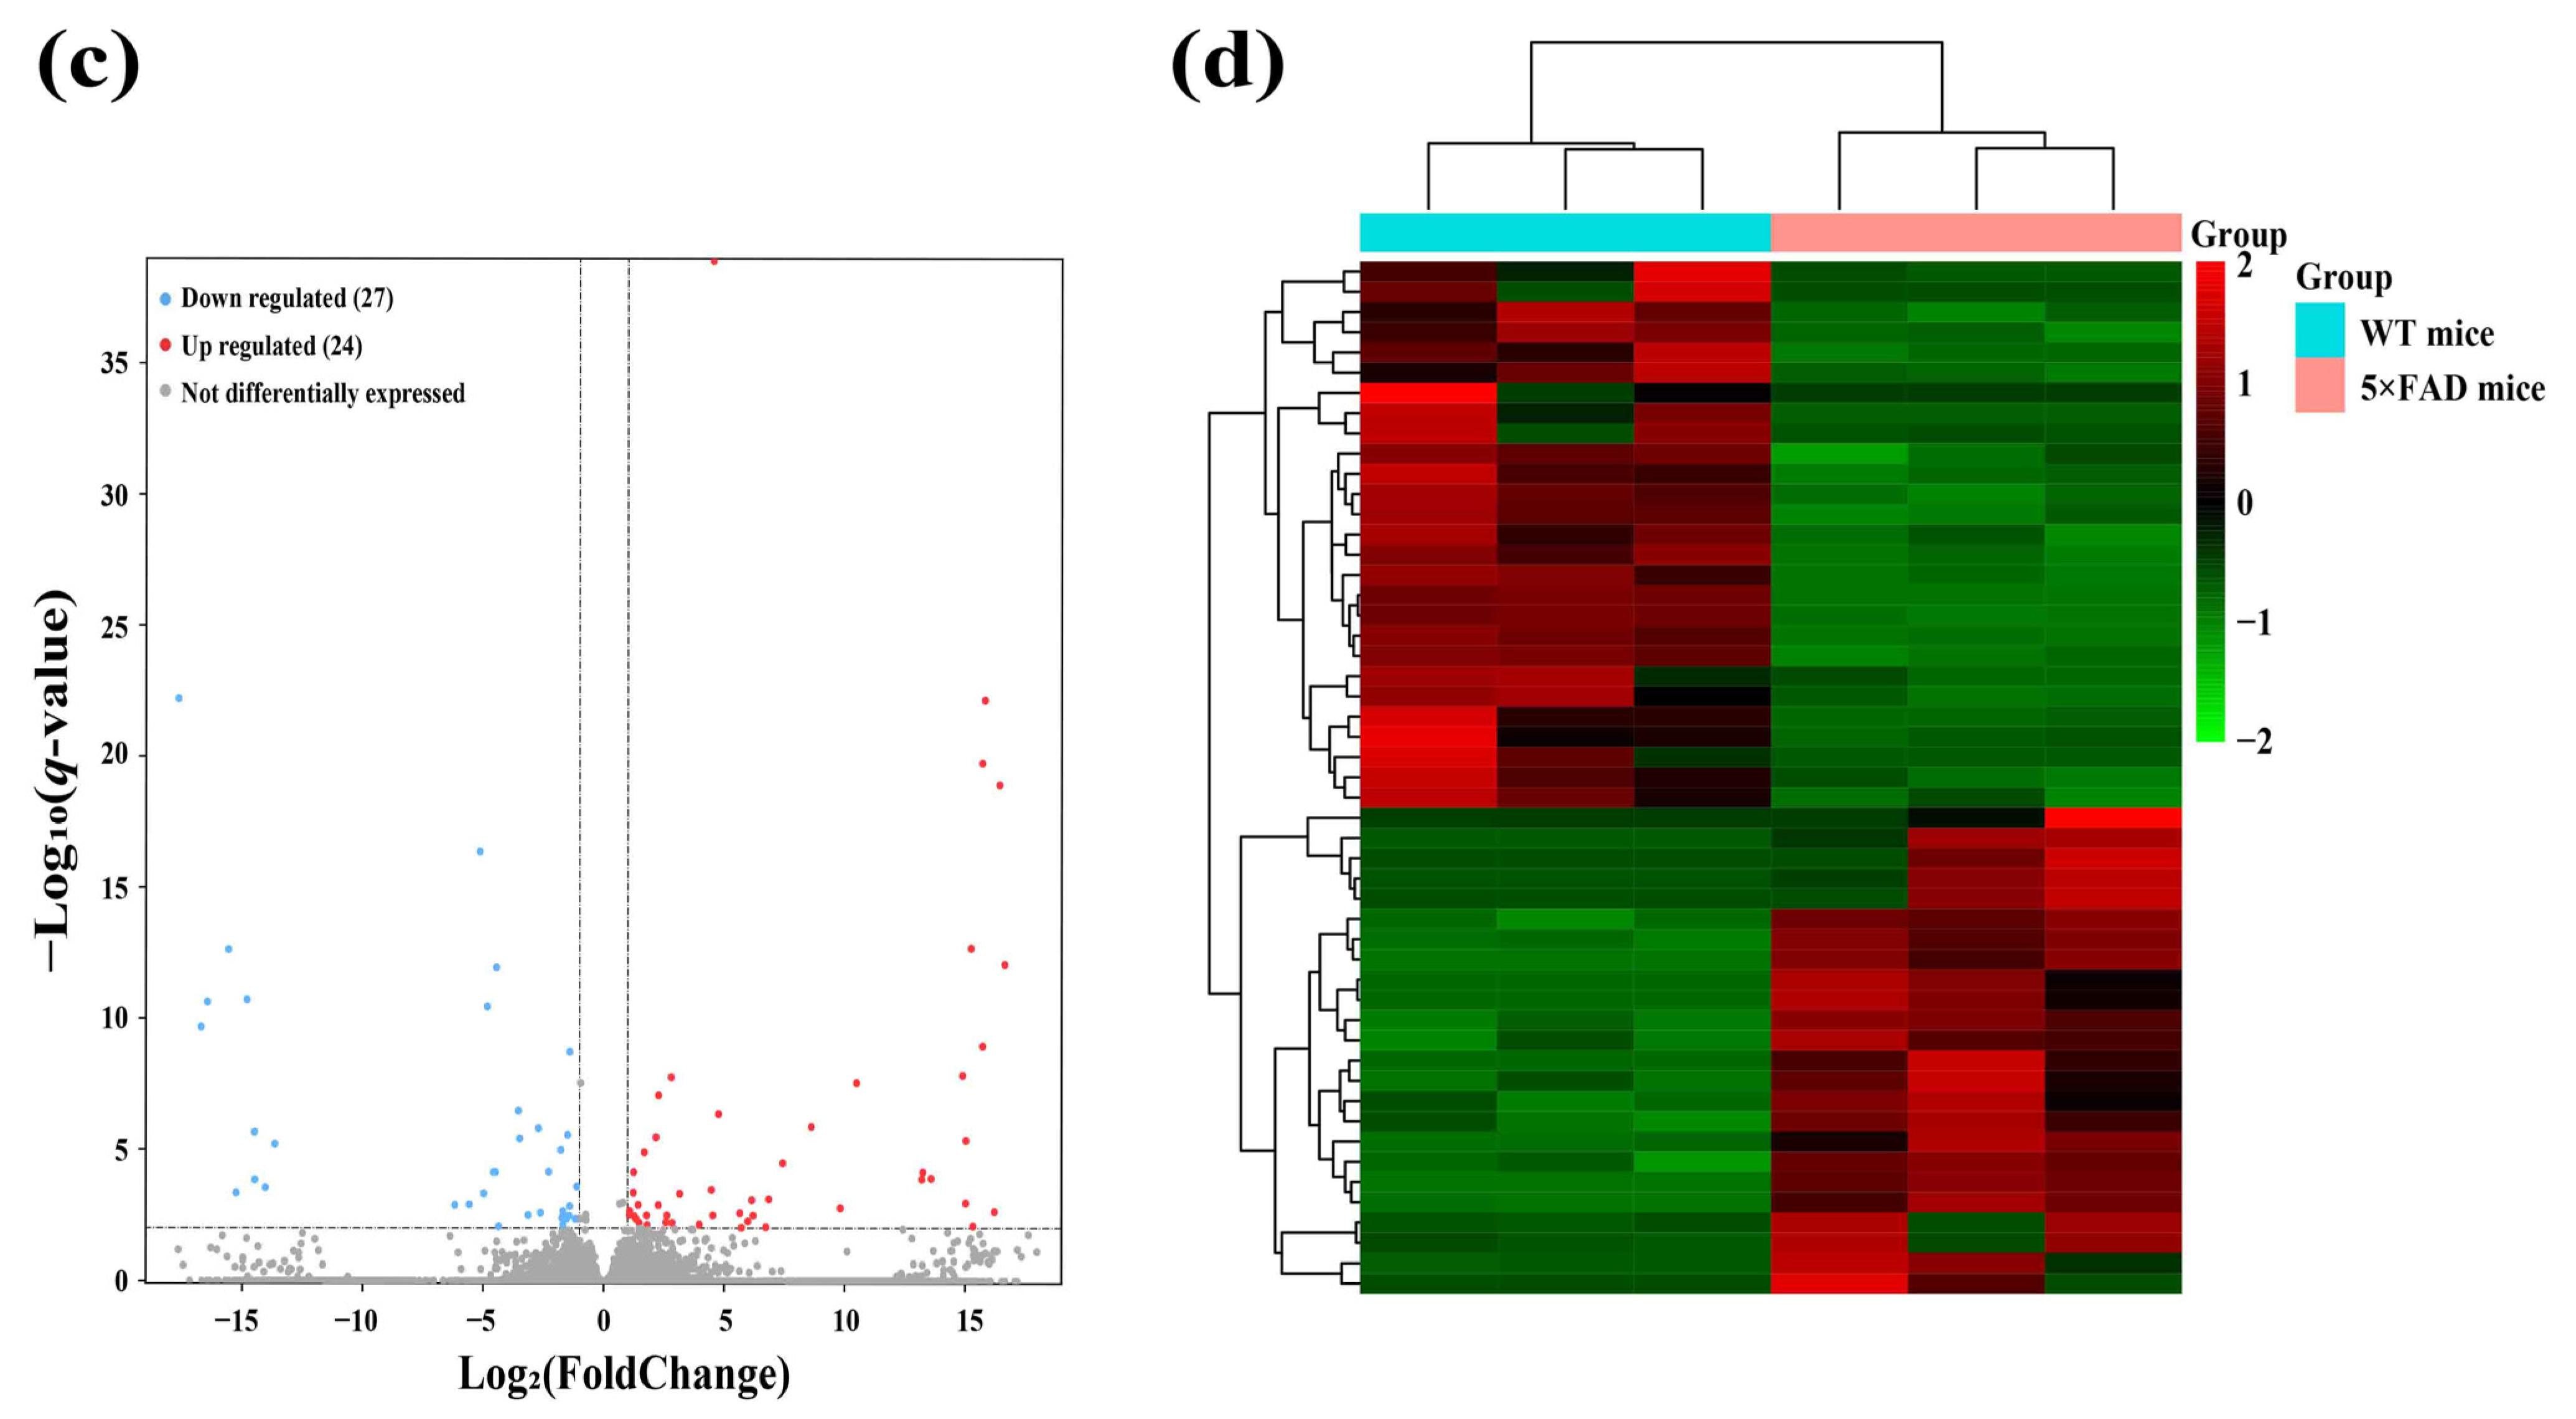
2.2. Identification and Analysis of Significantly Differentially Expressed lncRNAs (SDELs)
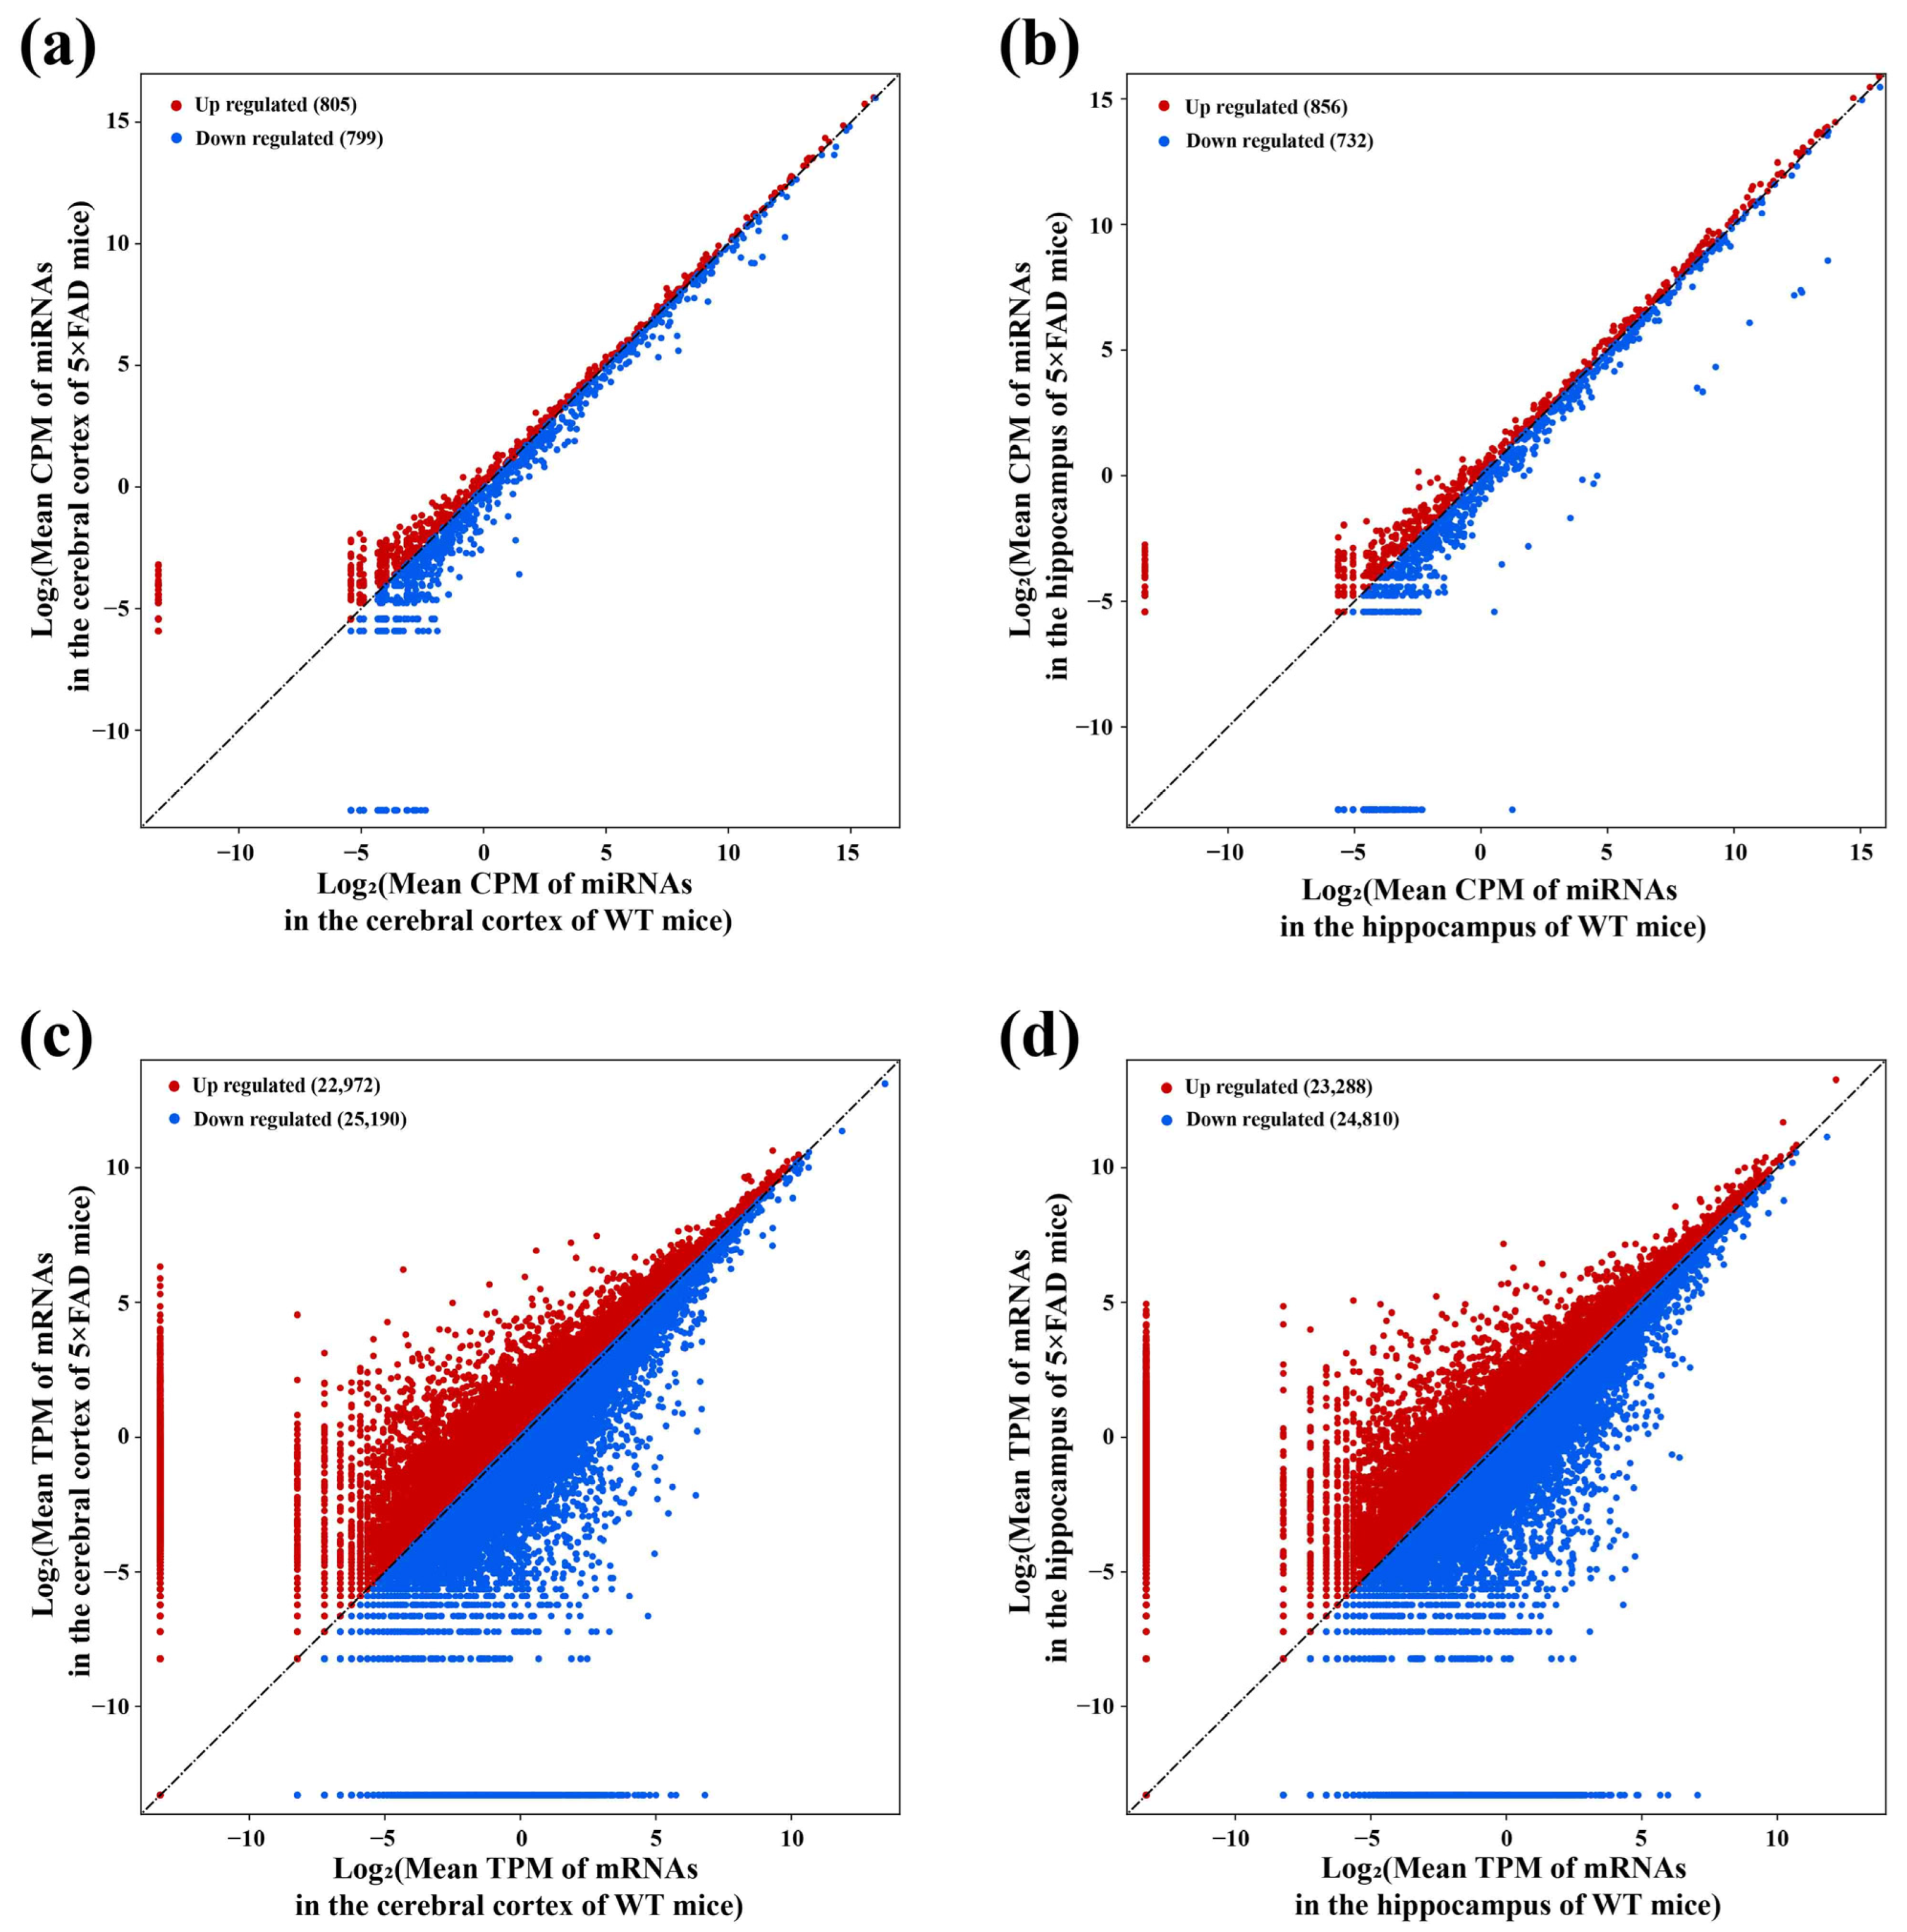
2.3. Identification of miRNAs and mRNAs Expressed in the Cerebral Cortex and Hippocampus of 5×FAD Mice
2.4. Analysis of Key lncRNAs in the Cerebral Cortex of 5×FAD Mice
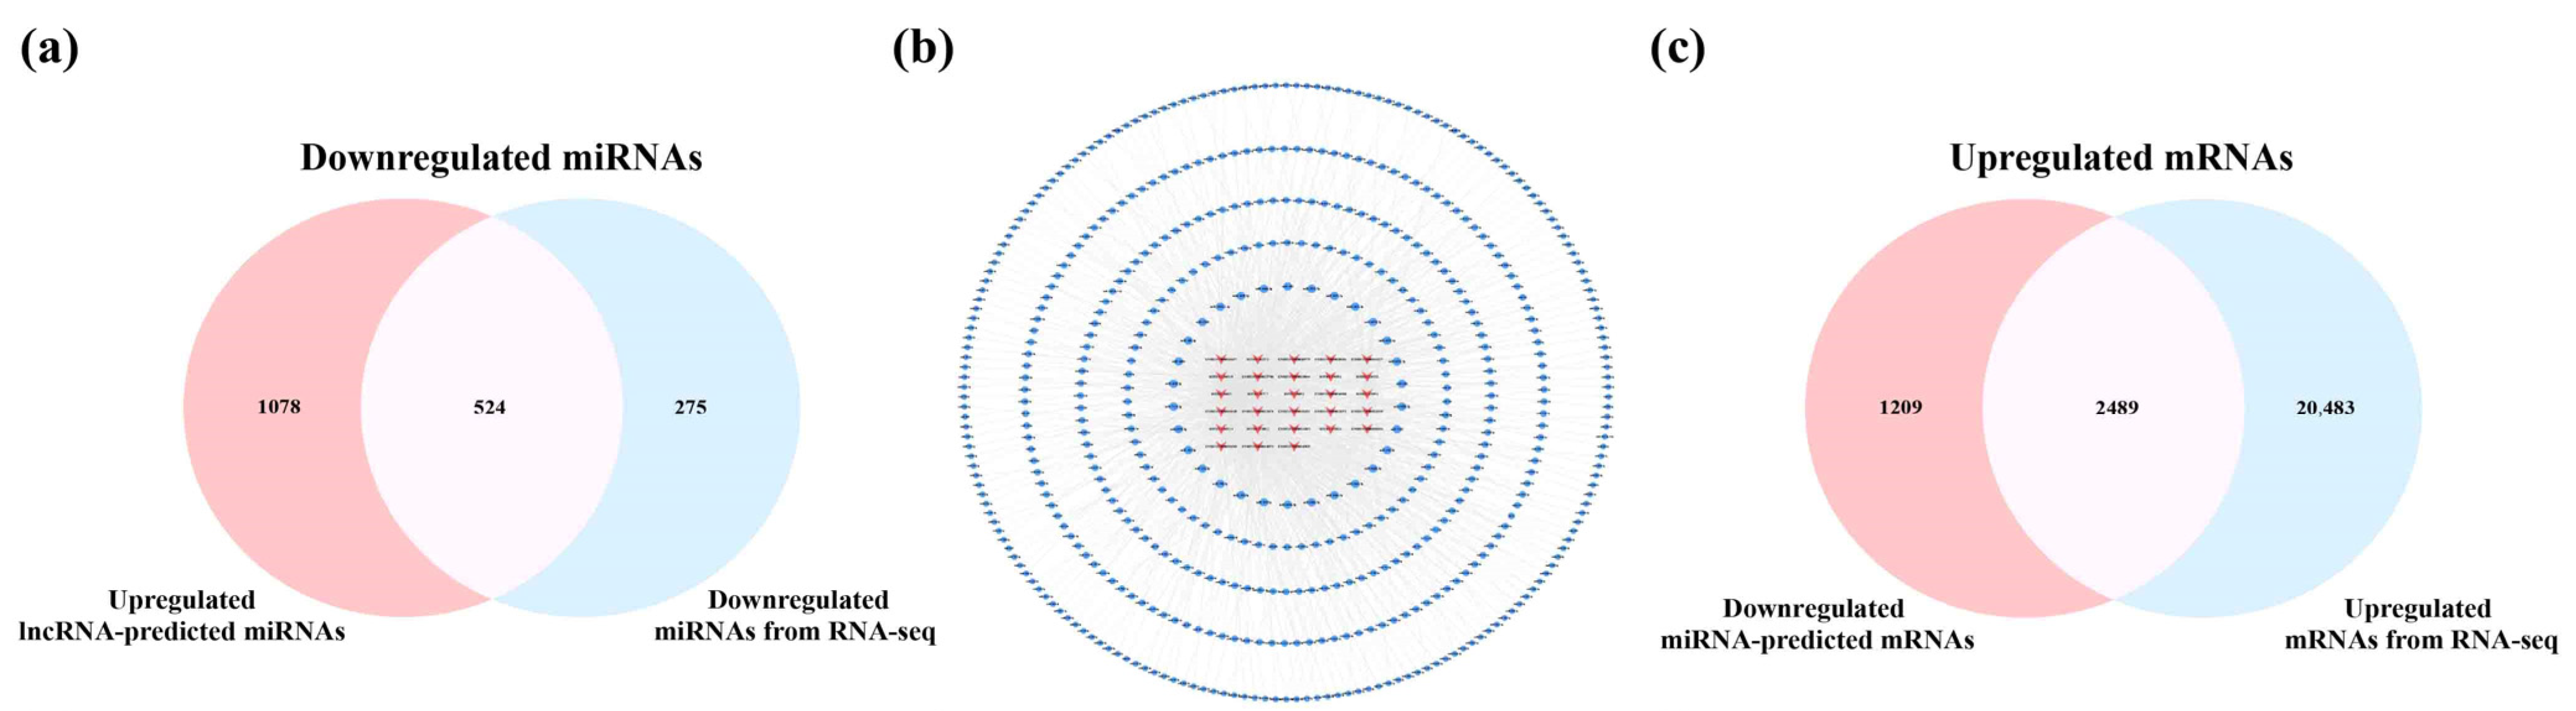
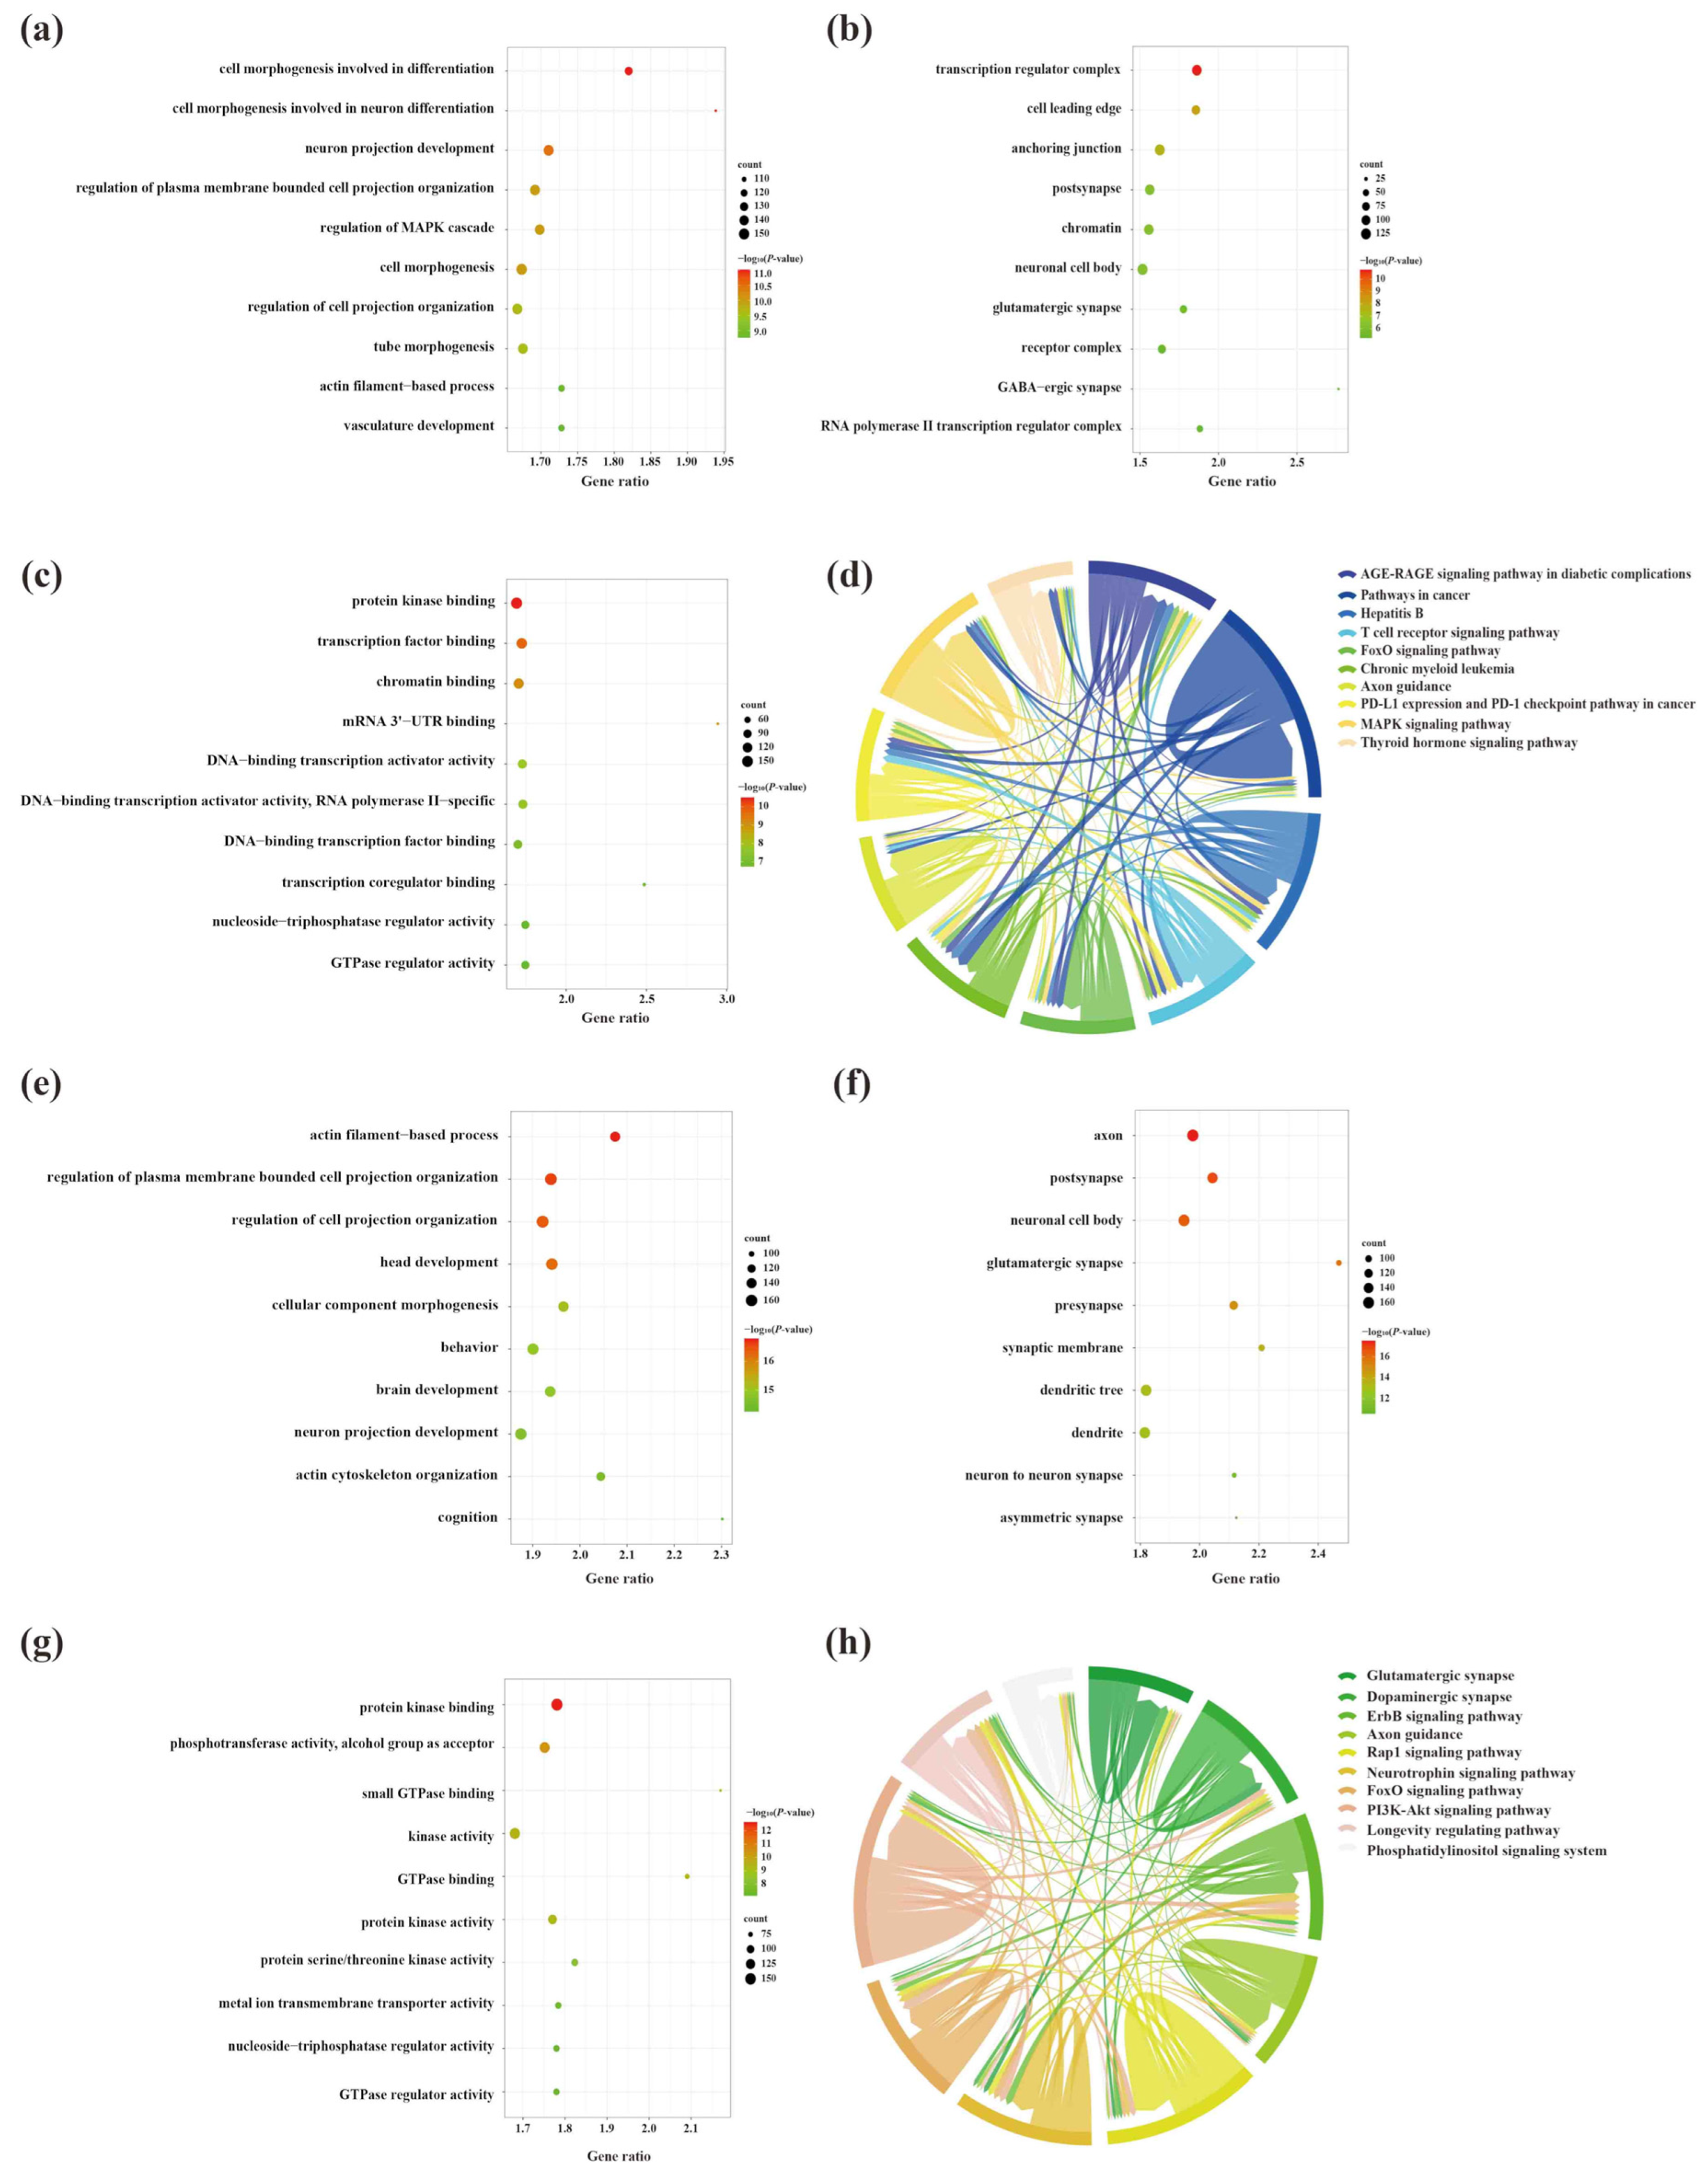
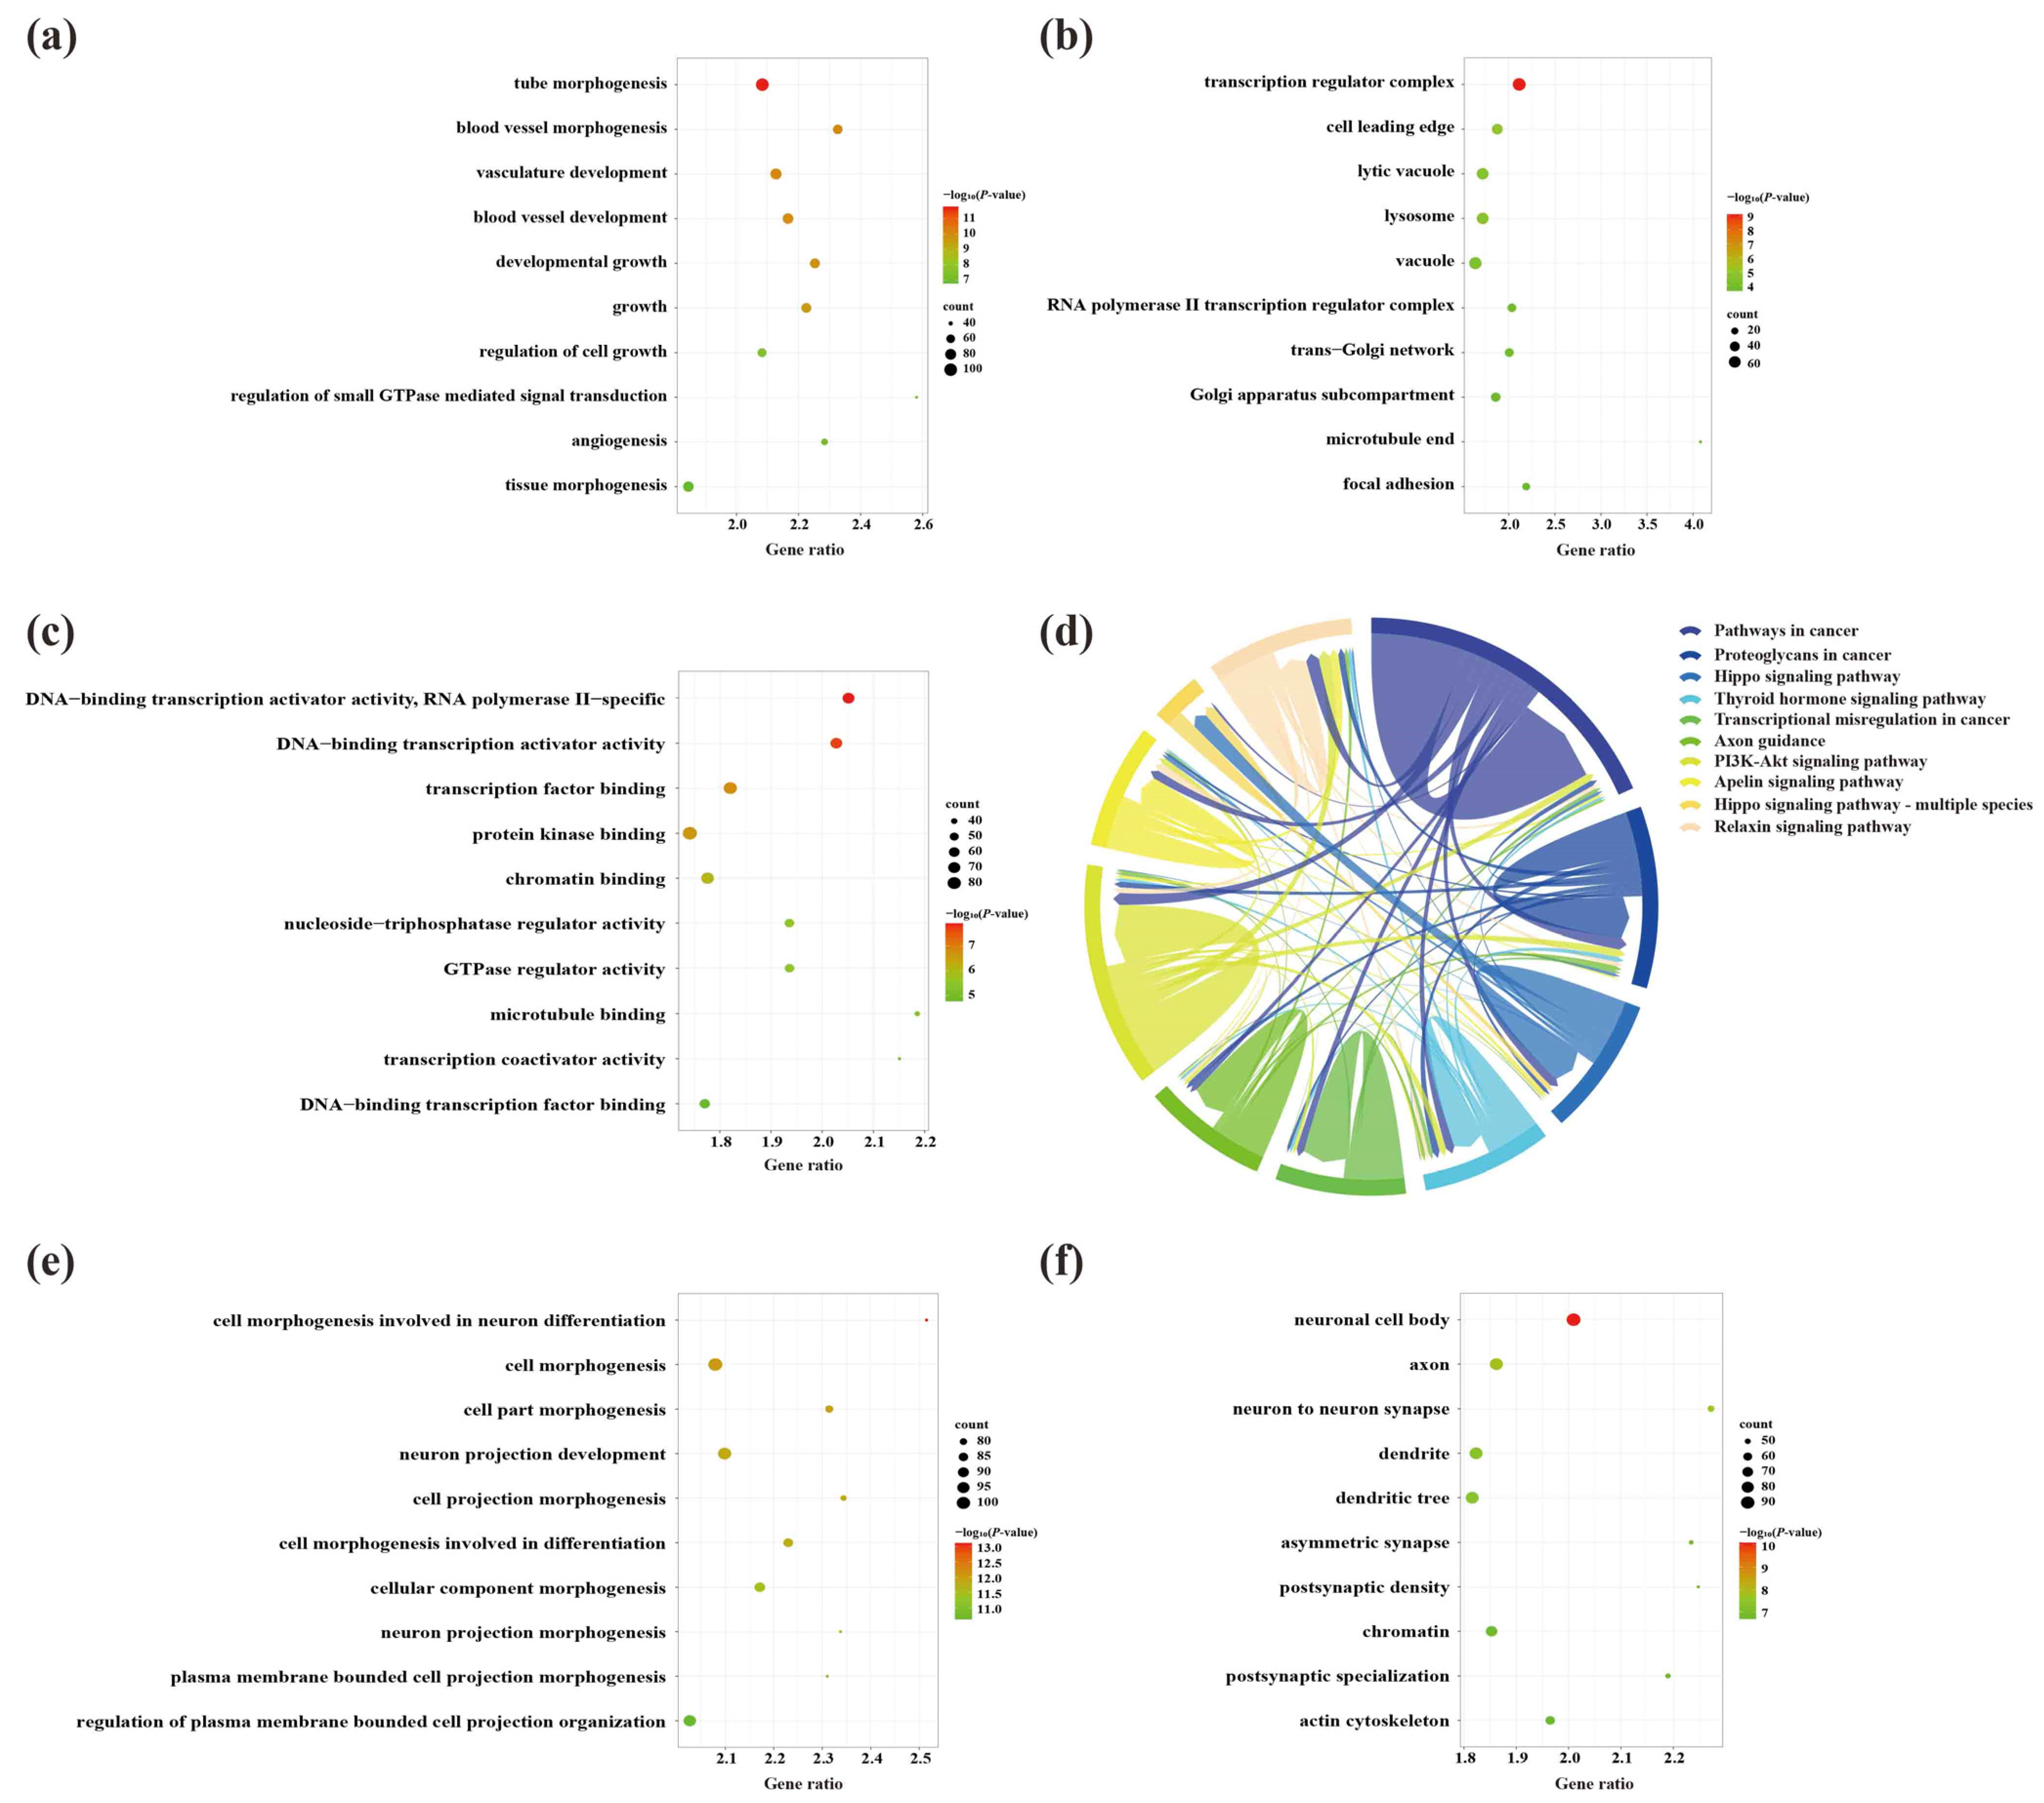
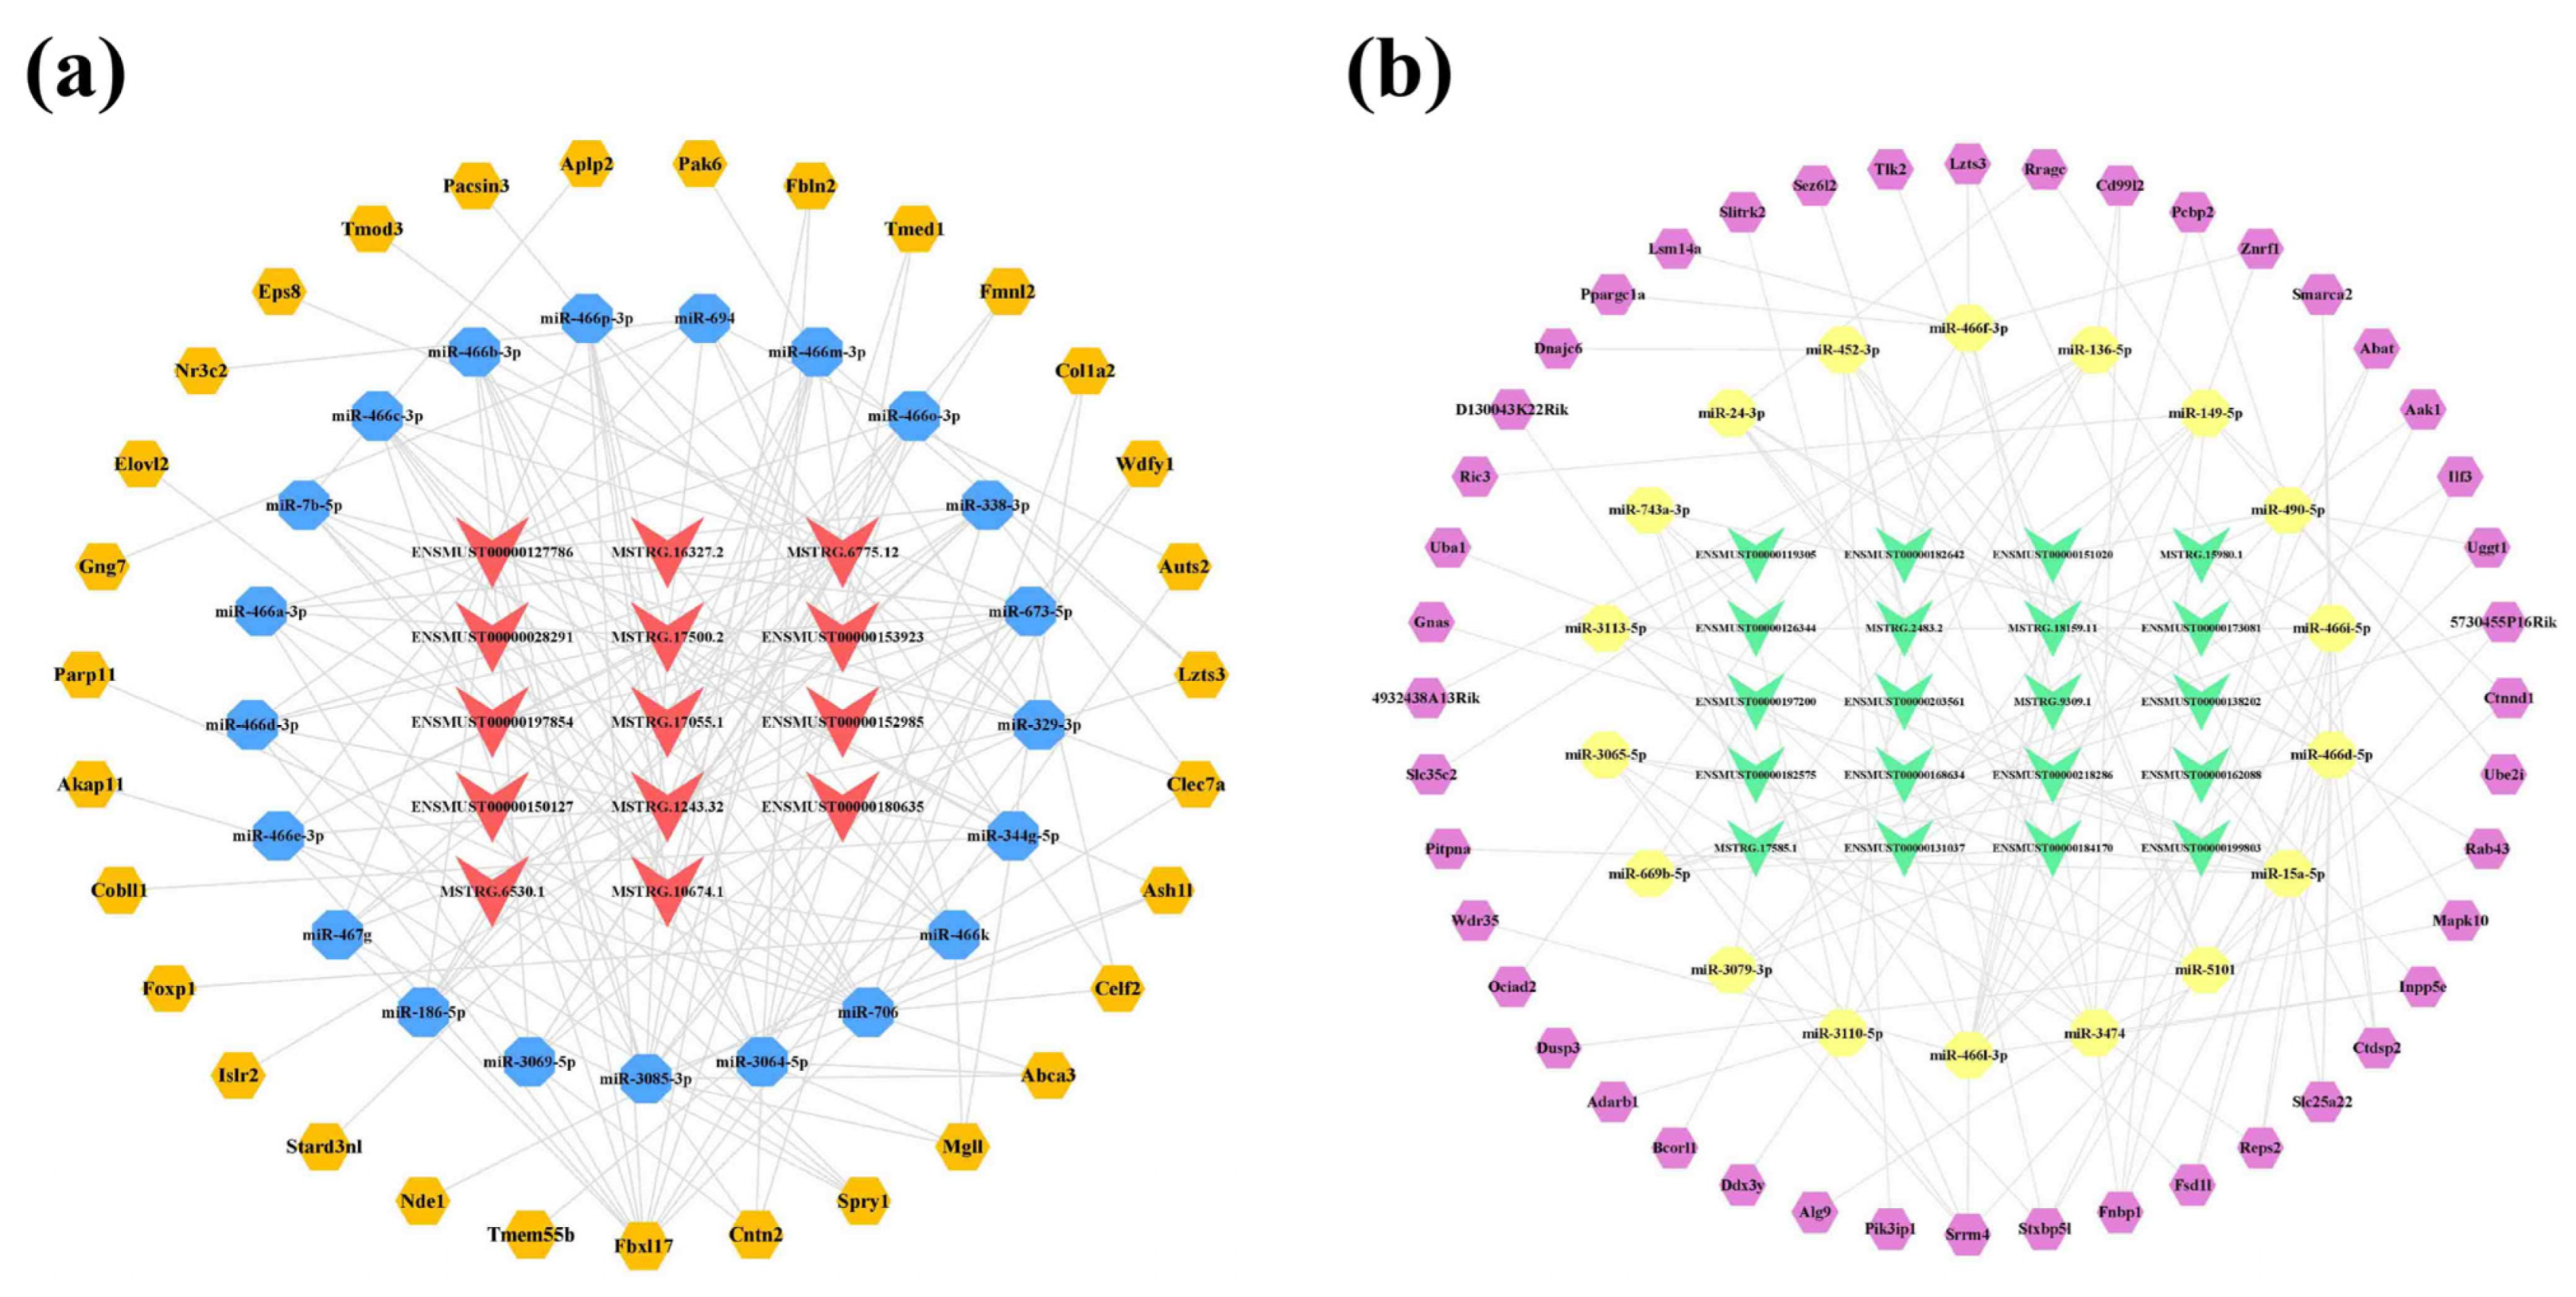
2.5. Biological Role, Signaling Pathway Enrichment, and ceRNA Network Analyses of Key lncRNAs in the Cerebral Cortex of 5×FAD Mice
2.6. Analysis of Key lncRNAs in the Hippocampus of 5×FAD Mice
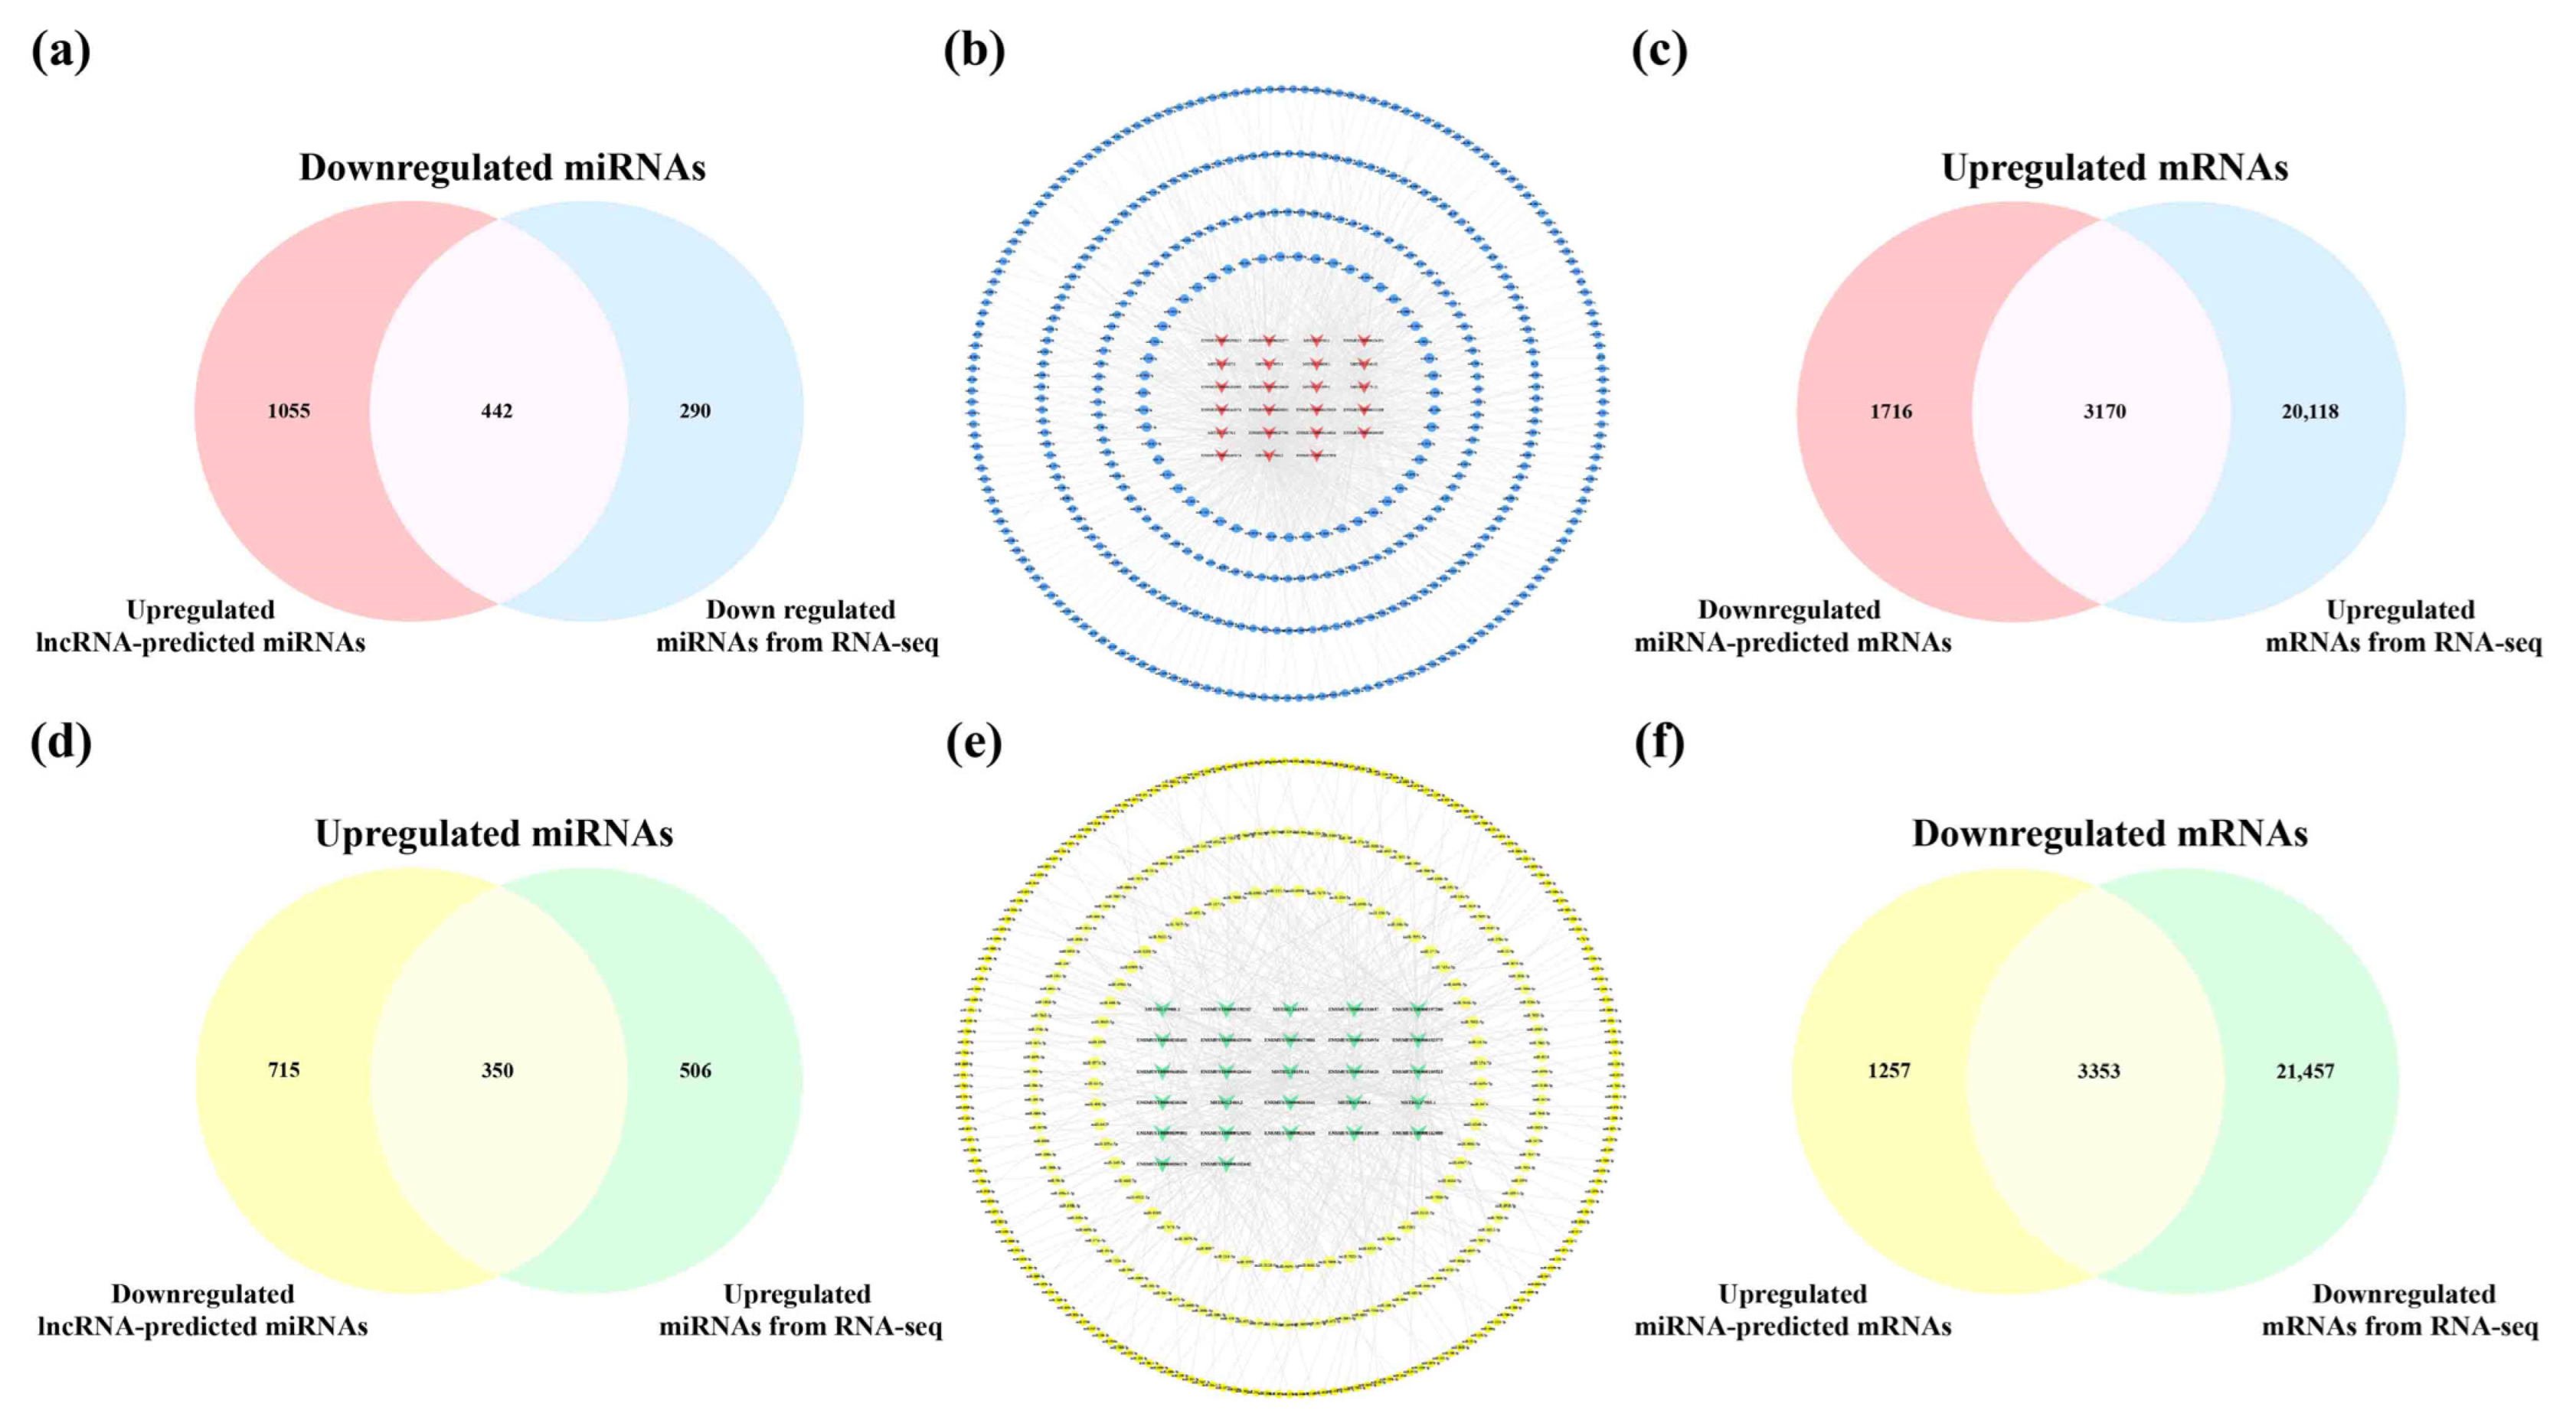
2.7. Biological Role, Signaling Pathway Enrichment, and ceRNA Network Analyses of Key lncRNAs in the Hippocampus of 5×FAD Mice
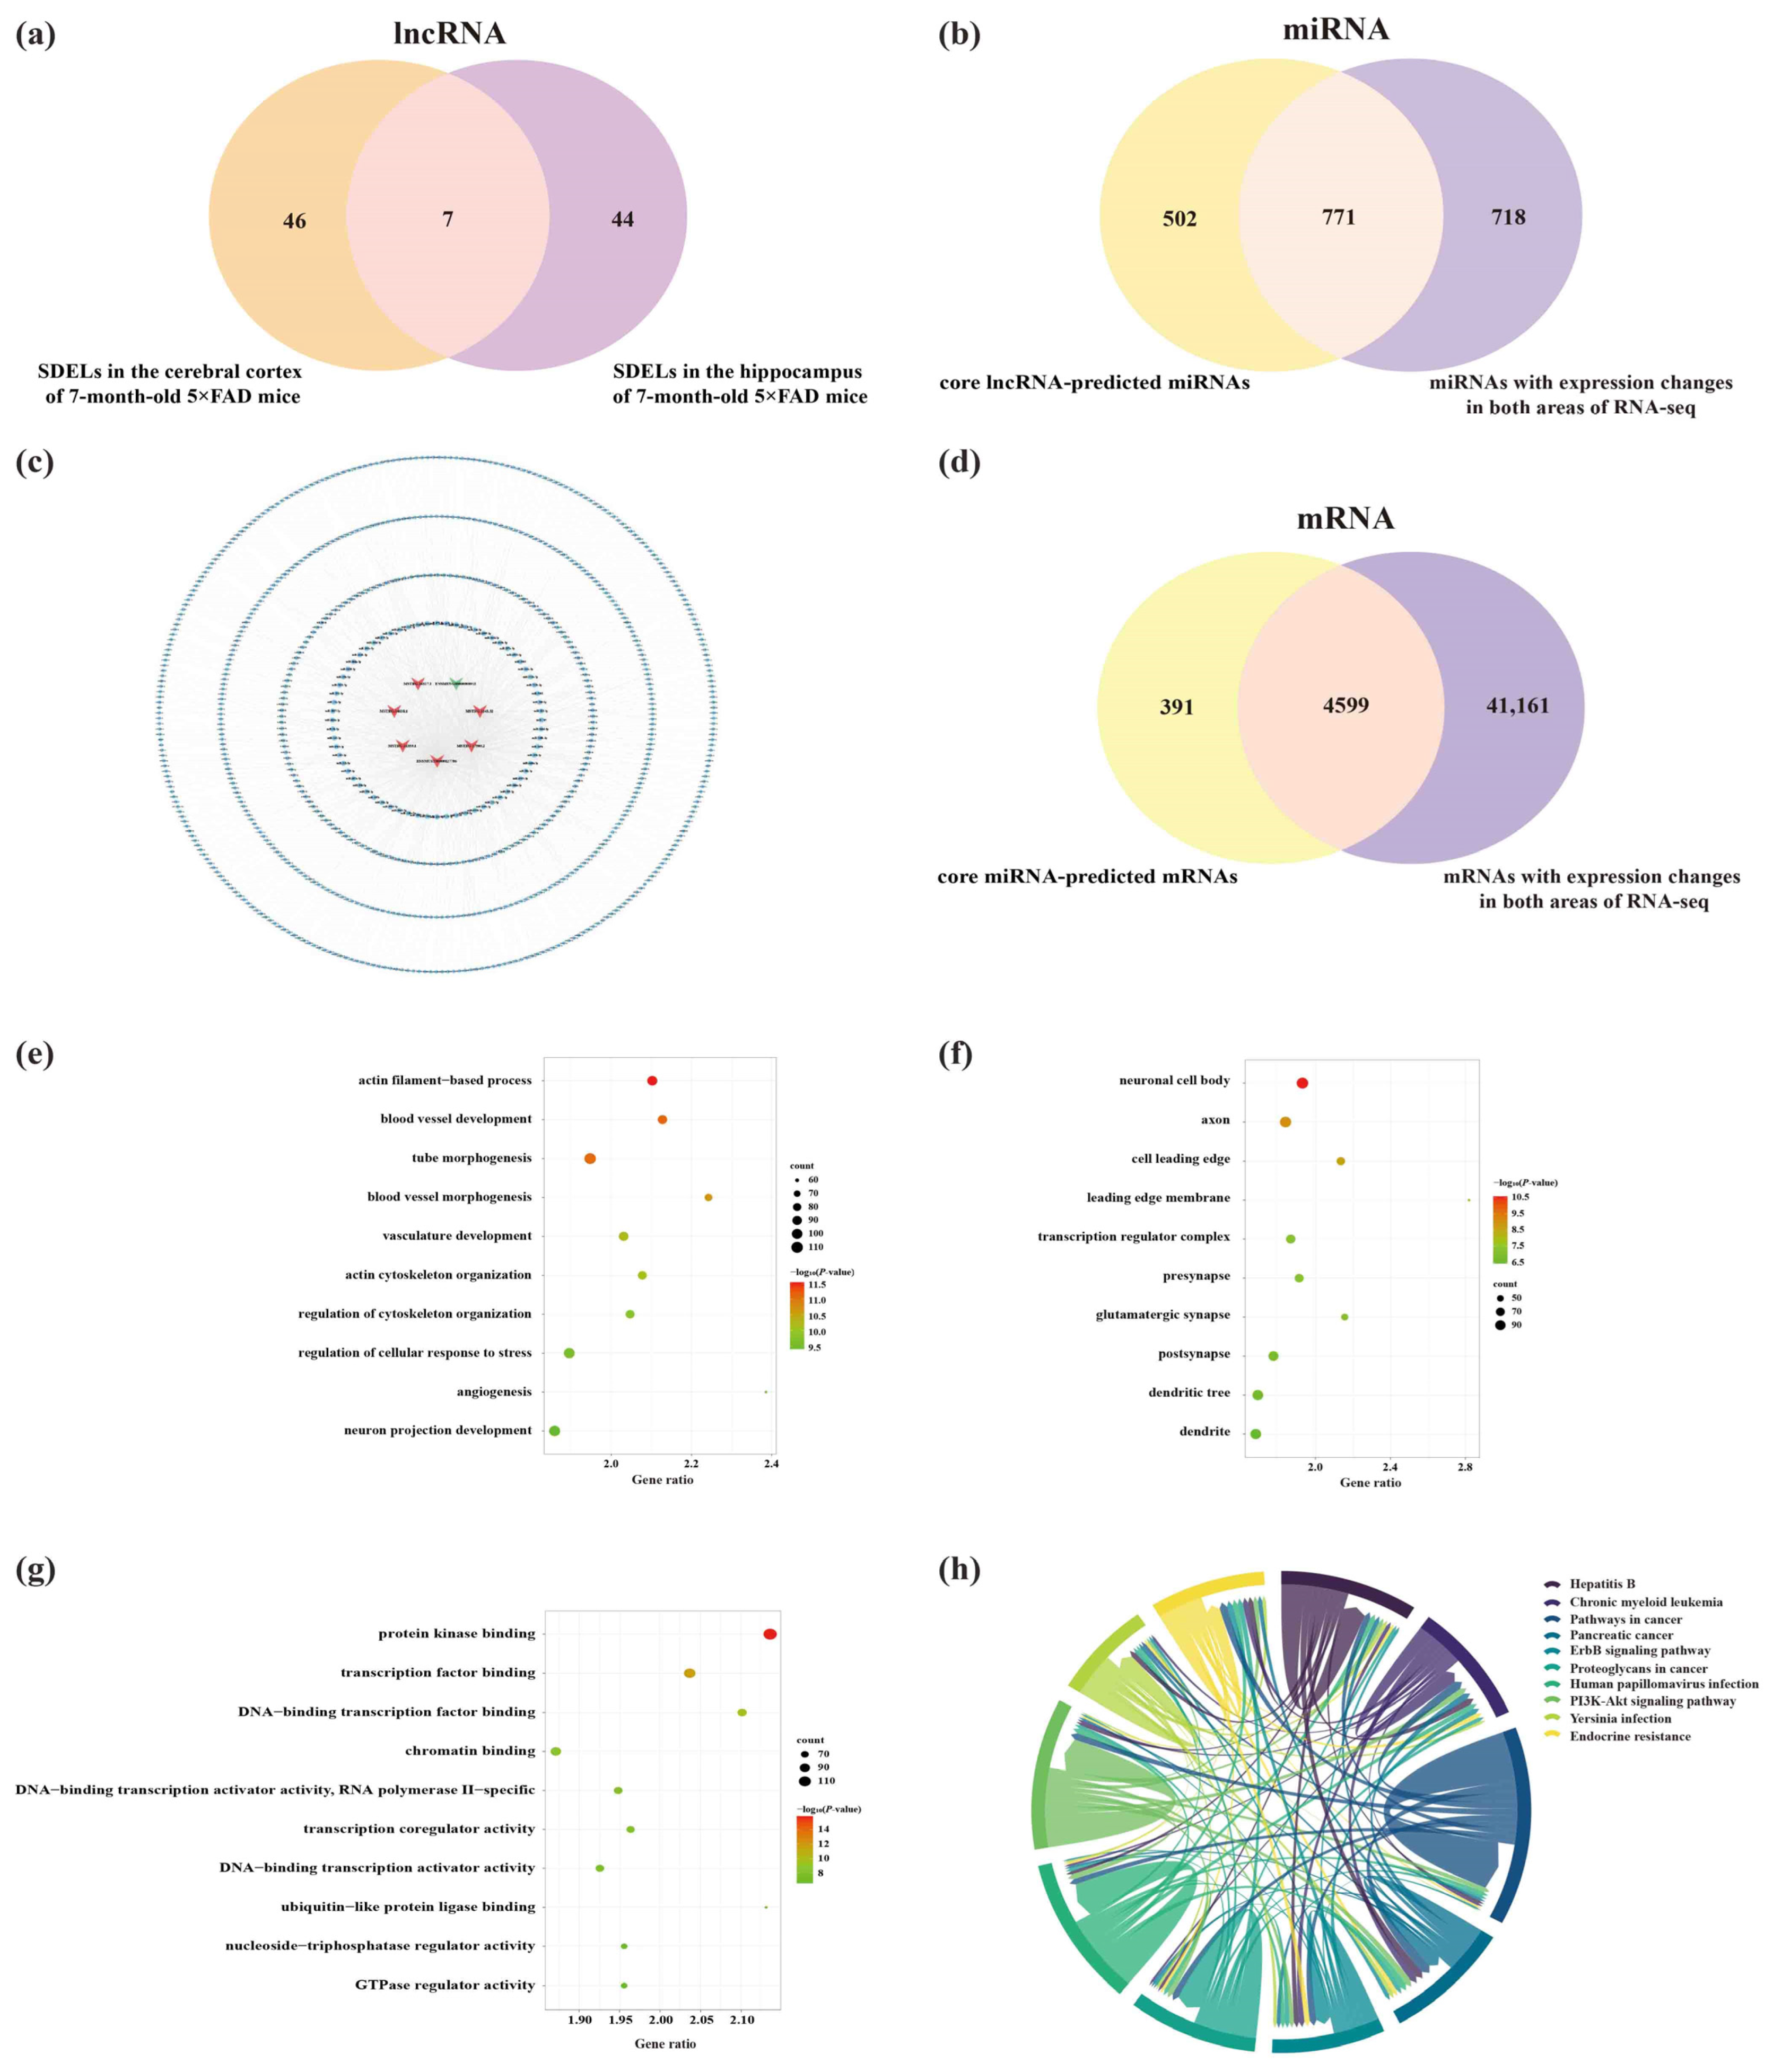
2.8. Analysis of Core lncRNAs in the Cerebral Cortex and Hippocampus of 5×FAD Mice
2.9. Construction of Potential lncRNA-Mediated Regulatory Networks and Expression Validation of RNAs
3. Discussion
4. Materials and Methods
4.1. Animals
4.2. Morris Water Maze (MWM) Test
4.3. Sample Preparation and RNA Extraction
4.4. lncRNA Library Construction and Sequencing
4.5. miRNA Library Construction and Sequencing
4.6. mRNA Library Construction and Sequencing
4.7. Differential Expression and Bioinformatics Analyses
4.8. GO Function Enrichment and KEGG Pathway Analyses
4.9. Construction of the lncRNA-Mediated ceRNA Network and Detection of RNA Expression by qPCR
Supplementary Materials
Author Contributions
Funding
Institutional Review Board Statement
Informed Consent Statement
Data Availability Statement
Conflicts of Interest
References
- Rhodius-Meester, H.; Tijms, B.M.; Lemstra, A.W.; Prins, N.D.; Pijnenburg, Y.; Bouwman, F.; Scheltens, P.; van der Flier, W.M. Survival in memory clinic cohort is short, even in young-onset dementia. J. Neurol. Neurosurg. Psychiatry 2019, 90, 726–728. [Google Scholar] [CrossRef]
- Mullard, A. Landmark Alzheimer’s drug approval confounds research community. Nature 2021, 594, 309–310. [Google Scholar] [CrossRef]
- Lauretti, E.; Dabrowski, K.; Praticò, D. The neurobiology of non-coding RNAs and Alzheimer’s disease pathogenesis: Pathways, mechanisms and translational opportunities. Ageing Res. Rev. 2021, 71, 101425. [Google Scholar] [CrossRef]
- Kuo, M.C.; Liu, S.C.; Hsu, Y.F.; Wu, R.M. The role of noncoding RNAs in Parkinson’s disease: Biomarkers and associations with pathogenic pathways. J. Biomed. Sci. 2021, 28, 78. [Google Scholar] [CrossRef]
- Miceli, V.; Russelli, G.; Iannolo, G.; Gallo, A.; Lo Re, V.; Agnese, V.; Sparacia, G.; Conaldi, P.G.; Bulati, M. Role of non-coding RNAs in age-related vascular cognitive impairment: An overview on diagnostic/prognostic value in Vascular Dementia and Vascular Parkinsonism. Mech. Ageing Dev. 2020, 191, 111332. [Google Scholar] [CrossRef]
- Laneve, P.; Tollis, P.; Caffarelli, E. RNA Deregulation in Amyotrophic Lateral Sclerosis: The Noncoding Perspective. Int. J. Mol. Sci. 2021, 22, 10285. [Google Scholar] [CrossRef]
- Shi, Y.; Liu, H.; Yang, C.; Xu, K.; Cai, Y.; Wang, Z.; Zhao, Z.; Shao, T.; Li, Y. Transcriptomic Analyses for Identification and Prioritization of Genes Associated With Alzheimer’s Disease in Humans. Front. Bioeng. Biotechnol. 2020, 8, 31. [Google Scholar] [CrossRef]
- Silvestro, S.; Bramanti, P.; Mazzon, E. Role of miRNAs in Alzheimer’s Disease and Possible Fields of Application. Int. J. Mol. Sci. 2019, 20, 3979. [Google Scholar] [CrossRef] [Green Version]
- Wang, L.; Cho, K.B.; Li, Y.; Tao, G.; Xie, Z.; Guo, B. Long Noncoding RNA (lncRNA)-Mediated Competing Endogenous RNA Networks Provide Novel Potential Biomarkers and Therapeutic Targets for Colorectal Cancer. Int. J. Mol. Sci. 2019, 20, 5758. [Google Scholar] [CrossRef] [PubMed] [Green Version]
- Zeng, T.; Ni, H.; Yu, Y.; Zhang, M.; Wu, M.; Wang, Q.; Wang, L.; Xu, S.; Xu, Z.; Xu, C.; et al. BACE1-AS prevents BACE1 mRNA degradation through the sequestration of BACE1-targeting miRNAs. J. Chem. Neuroanat. 2019, 98, 87–96. [Google Scholar] [CrossRef]
- Ding, Y.; Luan, W.; Shen, X.; Wang, Z.; Cao, Y. LncRNA BDNF-AS as ceRNA regulates the miR-9-5p/BACE1 pathway affecting neurotoxicity in Alzheimer’s disease. Arch. Gerontol. Geriatr. 2022, 99, 104614. [Google Scholar] [CrossRef]
- Oakley, H.; Cole, S.L.; Logan, S.; Maus, E.; Shao, P.; Craft, J.; Guillozet-Bongaarts, A.; Ohno, M.; Disterhoft, J.; Van Eldik, L.; et al. Intraneuronal beta-amyloid aggregates, neurodegeneration, and neuron loss in transgenic mice with five familial Alzheimer’s disease mutations: Potential factors in amyloid plaque formation. J. Neurosci. 2006, 26, 10129–10140. [Google Scholar] [CrossRef] [PubMed]
- Li, T.; Li, X.; Huang, X.; Yu, H.; Li, S.; Zhang, Z.; Xie, Y.; Song, X.; Liu, J.; Yang, X.; et al. Mitochondriomics reveals the underlying neuroprotective mechanism of TrkB receptor agonist R13 in the 5×FAD mice. Neuropharmacology 2022, 204, 108899. [Google Scholar] [CrossRef] [PubMed]
- Gatt, A.; Whitfield, D.R.; Ballard, C.; Doherty, P.; Williams, G. Alzheimer’s Disease Progression in the 5×FAD Mouse Captured with a Multiplex Gene Expression Array. J. Alzheimers Dis. 2019, 72, 1177–1191. [Google Scholar] [CrossRef]
- Zheng, J.; Xie, Y.; Ren, L.; Qi, L.; Wu, L.; Pan, X.; Zhou, J.; Chen, Z.; Liu, L. GLP-1 improves the supportive ability of astrocytes to neurons by promoting aerobic glycolysis in Alzheimer’s disease. Mol. Metab. 2021, 47, 101180. [Google Scholar] [CrossRef] [PubMed]
- Lazarov, O.; Hollands, C. Hippocampal neurogenesis: Learning to remember. Prog. Neurobiol. 2016, 138–140, 1–18. [Google Scholar] [CrossRef] [PubMed] [Green Version]
- Yang, C.; Jia, X.; Zhang, L.; Li, Y.; Zhang, Z.; Li, L.; Zhang, L. Shenqi Xingnao Granules ameliorates cognitive impairments and Alzheimer’s disease-like pathologies in APP/PS1 mouse model. Chin. Herb. Med. 2020, 12, 421–429. [Google Scholar] [CrossRef]
- Kimura, R.; Ohno, M. Impairments in remote memory stabilization precede hippocampal synaptic and cognitive failures in 5×FAD Alzheimer mouse model. Neurobiol. Dis. 2009, 33, 229–235. [Google Scholar] [CrossRef] [PubMed] [Green Version]
- Cichon, S.; Mühleisen, T.W.; Degenhardt, F.A.; Mattheisen, M.; Miró, X.; Strohmaier, J.; Steffens, M.; Meesters, C.; Herms, S.; Weingarten, M.; et al. Genome-wide association study identifies genetic variation in neurocan as a susceptibility factor for bipolar disorder. Am. J. Hum. Genet. 2011, 88, 372–381. [Google Scholar] [CrossRef] [Green Version]
- Castanza, A.S.; Ramirez, S.; Tripathi, P.P.; Daza, R.; Kalume, F.K.; Ramirez, J.M.; Hevner, R.F. AUTS2 regulates RNA metabolism and dentate gyrus development in mice. Cereb. Cortex. 2021, 31, 4808–4824. [Google Scholar] [CrossRef]
- Sancho-Balsells, A.; Brito, V.; Fernández, B.; Pardo, M.; Straccia, M.; Ginés, S.; Alberch, J.; Hernández, I.; Arranz, B.; Canals, J.M.; et al. Lack of helios during neural development induces adult schizophrenia-like behaviors associated with aberrant levels of the TRIF-recruiter protein WDFY1. Front. Cell Neurosci. 2020, 14, 93. [Google Scholar] [CrossRef] [PubMed]
- Davies, A.K.; Alecu, J.E.; Ziegler, M.; Vasilopoulou, C.G.; Merciai, F.; Jumo, H.; Afshar-Saber, W.; Sahin, M.; Ebrahimi-Fakhari, D.; Borner, G. AP-4-mediated axonal transport controls endocannabinoid production in neurons. Nat. Commun. 2022, 13, 1058. [Google Scholar] [CrossRef]
- Begcevic, I.; Brinc, D.; Brown, M.; Martinez-Morillo, E.; Goldhardt, O.; Grimmer, T.; Magdolen, V.; Batruch, I.; Diamandis, E.P. Brain-related proteins as potential CSF biomarkers of Alzheimer’s disease: A targeted mass spectrometry approach. J. Proteom. 2018, 182, 12–20. [Google Scholar] [CrossRef] [PubMed]
- Li, F.; Xie, X.Y.; Sui, X.F.; Wang, P.; Chen, Z.; Zhang, J.B. Profile of pathogenic proteins and microRNAs in plasma-derived extracellular vesicles in Alzheimer’s disease: A pilot study. Neuroscience 2020, 432, 240–246. [Google Scholar] [CrossRef] [PubMed]
- Kumar, R.; Corbett, M.A.; Smith, N.J.; Jolly, L.A.; Tan, C.; Keating, D.J.; Duffield, M.D.; Utsumi, T.; Moriya, K.; Smith, K.R.; et al. Homozygous mutation of STXBP5L explains an autosomal recessive infantile-onset neurodegenerative disorder. Hum. Mol. Genet. 2015, 24, 2000–2010. [Google Scholar] [CrossRef] [PubMed]
- Yoon, T.; Okada, J.; Jung, M.W.; Kim, J.J. Prefrontal cortex and hippocampus subserve different components of working memory in rats. Learn. Mem. 2008, 15, 97–105. [Google Scholar] [CrossRef] [Green Version]
- Kutlu, M.G.; Gould, T.J. Effects of drugs of abuse on hippocampal plasticity and hippocampus-dependent learning and memory: Contributions to development and maintenance of addiction. Learn. Mem. 2016, 23, 515–533. [Google Scholar] [CrossRef] [Green Version]
- Chanda, K.; Mukhopadhyay, D. LncRNA Xist, X-chromosome instability and Alzheimer’s disease. Curr. Alzheimer Res. 2020, 17, 499–507. [Google Scholar] [CrossRef]
- Yue, D.; Guanqun, G.; Jingxin, L.; Sen, S.; Shuang, L.; Yan, S.; Minxue, Z.; Ping, Y.; Chong, L.; Zhuobo, Z.; et al. Silencing of long noncoding RNA XIST attenuated Alzheimer’s disease-related BACE1 alteration through miR-124. Cell. Biol. Int. 2020, 44, 630–636. [Google Scholar] [CrossRef]
- Brockdorff, N.; Bowness, J.S.; Wei, G. Progress toward understanding chromosome silencing by Xist RNA. Genes. Dev. 2020, 34, 733–744. [Google Scholar] [CrossRef]
- Jarroux, J.; Morillon, A.; Pinskaya, M. History, Discovery, and Classification of lncRNAs. Adv. Exp. Med. Biol. 2017, 1008, 1–46. [Google Scholar] [PubMed]
- Zhou, Y.; Ge, Y.; Liu, Q.; Li, Y.X.; Chao, X.; Guan, J.J.; Diwu, Y.C.; Zhang, Q. LncRNA BACE1-AS Promotes Autophagy-Mediated Neuronal Damage Through The miR-214-3p/ATG5 Signalling Axis In Alzheimer’s Disease. Neuroscience 2021, 455, 52–64. [Google Scholar] [CrossRef] [PubMed]
- Liu, L.; Liu, L.; Lu, Y.; Zhang, T.; Zhao, W. Serum aberrant expression of miR-24-3p and its diagnostic value in Alzheimer’s disease. Biomark. Med. 2021, 15, 1499–1507. [Google Scholar] [CrossRef] [PubMed]
- Wang, Y.P.; Li, H.Q.; Chen, J.X.; Kong, F.G.; Mo, Z.H.; Wang, J.Z.; Huang, K.M.; Li, X.N.; Yan, Y. Overexpression of XIST facilitates cell proliferation, invasion and suppresses cell apoptosis by reducing radio-sensitivity of glioma cells via miR-329-3p/CREB1 axis. Eur. Rev. Med. Pharmacol. Sci. 2020, 24, 3190–3203. [Google Scholar]
- Zhang, Y.; Tang, Y.; Yan, J. LncRNA-XIST Promotes Proliferation and Migration in ox-LDL Stimulated Vascular Smooth Muscle Cells through miR-539-5p/SPP1 Axis. Oxid. Med. Cell Longev. 2022, 2022, 9911982. [Google Scholar] [CrossRef]
- Lee, J.; Kim, D.E.; Griffin, P.; Sheehan, P.W.; Kim, D.H.; Musiek, E.S.; Yoon, S.Y. Inhibition of REV-ERBs stimulates microglial amyloid-beta clearance and reduces amyloid plaque deposition in the 5×FAD mouse model of Alzheimer’s disease. Aging Cell. 2020, 19, e13078. [Google Scholar] [CrossRef] [Green Version]
- Blanco-Luquin, I.; Acha, B.; Urdánoz-Casado, A.; Sánchez-Ruiz De Gordoa, J.; Vicuña-Urriza, J.; Roldán, M.; Labarga, A.; Zelaya, M.V.; Cabello, C.; Méndez-Lópeza, I.; et al. Early epigenetic changes of Alzheimer’s disease in the human hippocampus. Epigenetics 2020, 15, 1083–1092. [Google Scholar] [CrossRef]
- Hammouda, S.; Ghzaiel, I.; Khamlaoui, W.; Hammami, S.; Mhenni, S.Y.; Samet, S.; Hammami, M.; Zarrouk, A. Genetic variants in FADS1 and ELOVL2 increase level of arachidonic acid and the risk of Alzheimer’s disease in the Tunisian population. Prostaglandins Leukot. Essent. Fat. Acids. 2020, 160, 102159. [Google Scholar] [CrossRef]
- Nakamura, R.; Misawa, K.; Tohnai, G.; Nakatochi, M.; Furuhashi, S.; Atsuta, N.; Hayashi, N.; Yokoi, D.; Watanabe, H.; Watanabe, H.; et al. A multi-ethnic meta-analysis identifies novel genes, including ACSL5, associated with amyotrophic lateral sclerosis. Commun. Biol. 2020, 3, 526. [Google Scholar] [CrossRef]
- Sun, T.; Zhao, K.; Liu, M.; Cai, Z.; Zeng, L.; Zhang, J.; Li, Z.; Liu, R. miR-30a-5p induces Aβ production via inhibiting the nonamyloidogenic pathway in Alzheimer’s disease. Pharmacol. Res. 2022, 178, 106153. [Google Scholar] [CrossRef]
- Zeng, L.; Jiang, H.; Ashraf, G.M.; Liu, J.; Wang, L.; Zhao, K.; Liu, M.; Li, Z.; Liu, R. Implications of miR-148a-3p/p35/PTEN signaling in tau hyperphosphorylation and autoregulatory feedforward of Akt/CREB in Alzheimer’s disease. Mol. Ther. Nucleic Acids. 2021, 27, 256–275. [Google Scholar] [CrossRef] [PubMed]
- Shen, Q.; Zhang, D.; Zhang, T.; Xu, Y.; Zhao, D. Comparative transcriptome and co-expression analysis reveal key genes involved in leaf margin serration in perilla frutescens. Chin. Herb. Med. 2020, 12, 265–272. [Google Scholar] [CrossRef]
- Sengupta, S.; Bolin, J.M.; Ruotti, V.; Nguyen, B.K.; Thomson, J.A.; Elwell, A.L.; Stewart, R. Single read and paired end mRNA-Seq Illumina libraries from 10 nanograms total RNA. J. Vis. Exp. 2011, 56, e3340. [Google Scholar] [CrossRef] [PubMed] [Green Version]


| Regulation | lncRNA ID | Mean Transcript per Million (TPM) | log2 Fold Change | p-Value | q-Value | |
|---|---|---|---|---|---|---|
| 5×FAD Mice | WT Mice | |||||
| Upregulated SDELs | ENSMUST00000141677 | 19.5700 | 6.9000 | 1.50 | 2.55 × 10⁻⁵ | 3.46 × 10⁻³ |
| ENSMUST00000131052 | 5.2167 | 0.2933 | 4.15 | 7.73 × 10⁻⁸ | 2.58 × 10⁻⁵ | |
| ENSMUST00000189564 | 7.1500 | 1.5533 | 2.20 | 8.06 × 10⁻⁵ | 8.92 × 10⁻³ | |
| ENSMUST00000155277 | 9.8033 | 4.9000 | 1.00 | 3.88 × 10⁻⁵ | 4.94 × 10⁻³ | |
| ENSMUST00000123670 | 6.5933 | 1.7300 | 1.93 | 9.33 × 10⁻⁶ | 1.49 × 10⁻³ | |
| ENSMUST00000150644 | 5.6833 | 0.0167 | 8.41 | 1.18 × 10⁻⁵ | 1.81 × 10⁻³ | |
| ENSMUST00000156420 | 9.3233 | 0.3333 | 4.81 | 7.75 × 10⁻⁸ | 2.58 × 10⁻⁵ | |
| ENSMUST00000221971 | 17.5367 | 8.4833 | 1.05 | 4.92 × 10⁻⁹ | 2.02 × 10⁻⁶ | |
| ENSMUST00000205311 | 7.7400 | 2.6833 | 1.53 | 2.00 × 10⁻⁵ | 2.83 × 10⁻³ | |
| ENSMUST00000126335 | 8.0900 | 3.2067 | 1.34 | 1.91 × 10⁻⁷ | 5.62 × 10⁻⁵ | |
| ENSMUST00000127786 | 131.1167 | 0.0467 | 11.46 | 3.74 × 10⁻⁹ | 1.57 × 10⁻⁶ | |
| ENSMUST00000182231 | 5.6033 | 0.0001 | 15.77 | 1.17 × 10⁻⁵ | 1.80 × 10⁻³ | |
| ENSMUST00000111019 | 11.4500 | 1.9933 | 2.52 | 1.42 × 10⁻⁶ | 3.14 × 10⁻⁴ | |
| ENSMUST00000160318 | 12.4067 | 1.5533 | 3.00 | 4.29 × 10⁻⁷ | 1.10 × 10⁻⁴ | |
| ENSMUST00000148373 | 9.0667 | 2.2800 | 1.99 | 5.25 × 10⁻⁶ | 9.48 × 10⁻⁴ | |
| ENSMUST00000205779 | 11.2933 | 3.9233 | 1.53 | 1.03 × 10⁻¹⁵ | 1.08 × 10⁻¹² | |
| ENSMUST00000145025 | 12.8433 | 1.2333 | 3.38 | 6.51 × 10⁻¹⁹ | 9.91 × 10⁻¹⁶ | |
| MSTRG.10455.14 | 17.0067 | 7.5200 | 1.18 | 1.62 × 10⁻⁵ | 2.38 × 10⁻³ | |
| MSTRG.11359.1 | 6.9667 | 0.0001 | 16.09 | 2.38 × 10⁻⁹ | 1.04 × 10⁻⁶ | |
| MSTRG.15393.1 | 6.9567 | 0.0001 | 16.09 | 9.26 × 10⁻¹⁸ | 1.19 × 10⁻¹⁴ | |
| MSTRG.17500.2 | 8.6633 | 0.0001 | 16.40 | 1.44 × 10⁻²⁹ | 5.35 × 10⁻²⁶ | |
| MSTRG.12843.10 | 7.8933 | 0.0001 | 16.27 | 4.89 × 10⁻⁵ | 5.94 × 10⁻³ | |
| MSTRG.16327.2 | 8.7600 | 0.0001 | 16.42 | 3.75 × 10⁻⁶ | 7.06 × 10⁻⁴ | |
| MSTRG.3640.2 | 8.8033 | 0.0001 | 16.43 | 5.55 × 10⁻²⁸ | 1.88 × 10⁻²⁴ | |
| MSTRG.3877.7 | 8.7900 | 0.5433 | 4.02 | 1.72 × 10⁻⁹ | 7.76 × 10⁻⁷ | |
| MSTRG.14838.1 | 14.0300 | 0.0001 | 17.10 | 1.45 × 10⁻⁹ | 6.67 × 10⁻⁷ | |
| MSTRG.1243.32 | 10.1600 | 0.0001 | 16.63 | 6.51 × 10⁻²³ | 1.43 × 10⁻¹⁹ | |
| MSTRG.5009.1 | 7.7933 | 0.0001 | 16.25 | 2.35 × 10⁻⁹ | 1.03 × 10⁻⁶ | |
| Downregulated SDELs | ENSMUST00000145774 | 0.6400 | 5.8500 | −3.19 | 1.41 × 10⁻⁵ | 2.11 × 10⁻³ |
| ENSMUST00000132392 | 8.0467 | 23.1867 | −1.53 | 1.13 × 10⁻⁸ | 4.37 × 10⁻⁶ | |
| ENSMUST00000182451 | 3.9300 | 12.9333 | −1.72 | 2.04 × 10⁻⁵ | 2.87 × 10⁻³ | |
| ENSMUST00000161415 | 1.6833 | 9.1633 | −2.44 | 1.14 × 10⁻⁸ | 4.37 × 10⁻⁶ | |
| ENSMUST00000161637 | 0.4733 | 19.3467 | −5.35 | 1.72 × 10⁻⁷ | 5.24 × 10⁻⁵ | |
| ENSMUST00000124691 | 0.3933 | 6.9067 | −4.13 | 1.45 × 10⁻⁵ | 2.15 × 10⁻³ | |
| ENSMUST00000141539 | 3.9967 | 12.0300 | −1.59 | 2.02 × 10⁻⁷ | 5.84 × 10⁻⁵ | |
| ENSMUST00000162401 | 1.7367 | 6.2900 | −1.86 | 2.21 × 10⁻¹⁰ | 1.14 × 10⁻⁷ | |
| ENSMUST00000139277 | 31.3367 | 121.4033 | −1.95 | 4.41 × 10⁻⁵ | 5.46 × 10⁻³ | |
| ENSMUST00000129857 | 1.1600 | 21.8867 | −4.24 | 2.39 × 10⁻⁷ | 6.65 × 10⁻⁵ | |
| ENSMUST00000184170 | 0.0001 | 9.6800 | −16.56 | 6.00 × 10⁻¹² | 3.79 × 10⁻⁹ | |
| ENSMUST00000209301 | 4.8000 | 10.6767 | −1.15 | 1.75 × 10⁻⁶ | 3.74 × 10⁻⁴ | |
| ENSMUST00000199237 | 0.1767 | 8.6533 | −5.61 | 3.10 × 10⁻⁶ | 5.98 × 10⁻⁴ | |
| ENSMUST00000137980 | 8.0300 | 18.9333 | −1.24 | 1.63 × 10⁻⁶ | 3.51 × 10⁻⁴ | |
| ENSMUST00000141357 | 2.9133 | 8.0067 | −1.46 | 9.04 × 10⁻⁵ | 9.80 × 10⁻³ | |
| ENSMUST00000210394 | 1.2167 | 13.6133 | −3.48 | 1.68 × 10⁻⁶ | 3.61 × 10⁻⁴ | |
| ENSMUST00000146588 | 0.9167 | 9.7400 | −3.41 | 4.69 × 10⁻⁹ | 1.93 × 10⁻⁶ | |
| ENSMUST00000144628 | 4.8300 | 30.4733 | −2.66 | 1.13 × 10⁻⁵ | 1.76 × 10⁻³ | |
| ENSMUST00000145741 | 0.5200 | 16.0600 | −4.95 | 7.81 × 10⁻⁶ | 1.29 × 10⁻³ | |
| ENSMUST00000221246 | 0.3400 | 5.2700 | −3.95 | 7.80 × 10⁻⁵ | 8.68 × 10⁻³ | |
| MSTRG.17500.1 | 0.6133 | 8.8667 | −3.85 | 1.23 × 10−43 | 7.04 × 10−40 | |
| MSTRG.18699.11 | 0.0001 | 8.9733 | −16.45 | 2.11 × 10⁻²² | 4.50 × 10⁻¹⁹ | |
| MSTRG.7748.1 | 0.0001 | 12.9100 | −16.98 | 7.52 × 10⁻²⁶ | 2.08 × 10⁻²² | |
| MSTRG.18699.5 | 7.7767 | 32.3900 | −2.06 | 1.40 × 10⁻⁵ | 2.09 × 10⁻³ | |
| MSTRG.8598.3 | 0.0001 | 116.1733 | −20.15 | 1.39 × 10⁻³¹ | 5.44 × 10⁻²⁸ | |
| Regulation | lncRNA ID | Mean TPM | log2 Fold Change | p-Value | q-Value | |
|---|---|---|---|---|---|---|
| 5×FAD Mice | WT Mice | |||||
| Upregulated SDELs | ENSMUST00000144016 | 100.2933 | 37.1633 | 1.43 | 7.69 × 10⁻⁶ | 1.30 × 10⁻³ |
| ENSMUST00000141374 | 11.2500 | 4.4133 | 1.35 | 3.44 × 10⁻⁵ | 4.47 × 10⁻³ | |
| ENSMUST00000028291 | 5.9100 | 0.2167 | 4.77 | 1.06 × 10⁻⁹ | 4.41 × 10⁻⁷ | |
| ENSMUST00000154192 | 8.7400 | 1.7967 | 2.28 | 1.88 × 10⁻¹⁰ | 8.49 × 10⁻⁸ | |
| ENSMUST00000160679 | 6.0767 | 1.8800 | 1.69 | 4.36 × 10⁻⁸ | 1.27 × 10⁻⁵ | |
| ENSMUST00000153923 | 8.1333 | 2.9133 | 1.48 | 5.19 × 10⁻⁵ | 6.30 × 10⁻³ | |
| ENSMUST00000218620 | 16.3267 | 0.7067 | 4.53 | 2.36 × 10⁻⁵ | 3.26 × 10⁻³ | |
| ENSMUST00000211218 | 13.5300 | 5.7400 | 1.24 | 2.18 × 10⁻⁶ | 4.44 × 10⁻⁴ | |
| ENSMUST00000180635 | 10.6967 | 4.5000 | 1.25 | 2.93 × 10⁻⁷ | 7.31 × 10⁻⁵ | |
| ENSMUST00000150127 | 9.7400 | 0.4167 | 4.55 | 8.10 × 10−44 | 1.21 × 10−39 | |
| ENSMUST00000127786 | 124.8767 | 0.0867 | 10.49 | 5.72× 10⁻¹¹ | 2.86 × 10⁻⁸ | |
| ENSMUST00000152985 | 6.0333 | 0.0067 | 9.82 | 1.07 × 10⁻⁵ | 1.72 × 10⁻³ | |
| ENSMUST00000145174 | 19.7200 | 1.2567 | 3.97 | 6.20 × 10⁻⁵ | 7.31 × 10⁻³ | |
| ENSMUST00000132577 | 6.4433 | 2.6667 | 1.27 | 2.52 × 10⁻⁵ | 3.45 × 10⁻³ | |
| ENSMUST00000197854 | 27.5900 | 13.1100 | 1.07 | 2.18 × 10⁻⁵ | 3.08 × 10⁻³ | |
| MSTRG.11359.1 | 11.7967 | 0.0300 | 8.62 | 3.67 × 10⁻⁹ | 1.36 × 10⁻⁶ | |
| MSTRG.17500.2 | 5.7800 | 0.0001 | 15.82 | 1.77 × 10⁻²⁶ | 7.06 × 10⁻²³ | |
| MSTRG.16327.2 | 7.6200 | 0.0001 | 16.22 | 1.56 × 10⁻⁵ | 2.36 × 10⁻³ | |
| MSTRG.6530.1 | 19.1900 | 0.1800 | 6.74 | 8.09 × 10⁻⁵ | 9.10 × 10⁻³ | |
| MSTRG.6775.12 | 10.2333 | 0.0001 | 16.64 | 7.89 × 10⁻¹⁶ | 8.71 × 10⁻¹³ | |
| MSTRG.10674.1 | 5.3633 | 0.0001 | 15.71 | 6.04 × 10⁻²⁴ | 1.80 × 10⁻²⁰ | |
| MSTRG.17055.1 | 5.4067 | 0.0001 | 15.72 | 1.75 × 10⁻¹² | 1.14 × 10⁻⁹ | |
| MSTRG.14838.1 | 13.2767 | 0.0767 | 7.44 | 1.23 × 10⁻⁷ | 3.31 × 10⁻⁵ | |
| MSTRG.1243.32 | 8.8267 | 0.0001 | 16.43 | 4.48 × 10⁻²³ | 1.22 × 10⁻¹⁹ | |
| Downregulated SDELs | ENSMUST00000125930 | 5.2800 | 14.2633 | −1.43 | 2.43 × 10⁻⁵ | 3.35 × 10⁻³ |
| ENSMUST00000182575 | 0.0001 | 20.5667 | −17.65 | 1.47 × 10⁻²⁶ | 6.25 × 10⁻²³ | |
| ENSMUST00000119305 | 2.1933 | 19.1767 | −3.13 | 2.26 × 10⁻⁵ | 3.18 × 10⁻³ | |
| ENSMUST00000218432 | 11.9700 | 31.6733 | −1.40 | 3.01 × 10⁻¹² | 1.85 × 10⁻⁹ | |
| ENSMUST00000138202 | 0.2633 | 5.7567 | −4.45 | 1.06 × 10⁻¹⁵ | 1.13 × 10⁻¹² | |
| ENSMUST00000182642 | 2.0900 | 10.1333 | −2.28 | 2.83 × 10⁻⁷ | 7.14 × 10⁻⁵ | |
| ENSMUST00000162088 | 0.0001 | 10.6933 | −16.71 | 2.94 × 10⁻¹³ | 2.12 × 10⁻¹⁰ | |
| ENSMUST00000184170 | 2.6967 | 8.6433 | −1.68 | 1.49 × 10⁻⁵ | 2.26 × 10⁻³ | |
| ENSMUST00000203561 | 2.6567 | 7.0467 | −1.41 | 8.76 × 10⁻⁶ | 1.45 × 10⁻³ | |
| ENSMUST00000126582 | 1.2467 | 8.1333 | −2.71 | 4.24 × 10⁻⁹ | 1.55 × 10⁻⁶ | |
| ENSMUST00000126344 | 2.8900 | 6.1167 | −1.08 | 3.37 × 10⁻⁵ | 4.40 × 10⁻³ | |
| ENSMUST00000168634 | 5.0733 | 14.7667 | −1.54 | 3.31 × 10⁻⁵ | 4.34 × 10⁻³ | |
| ENSMUST00000151020 | 0.4867 | 5.4433 | −3.48 | 1.13 × 10⁻⁸ | 3.83 × 10⁻⁶ | |
| ENSMUST00000134954 | 2.4700 | 7.9333 | −1.68 | 6.42 × 10⁻⁵ | 7.52 × 10⁻³ | |
| ENSMUST00000218286 | 1.0900 | 6.7000 | −2.62 | 1.75 × 10⁻⁵ | 2.60 × 10⁻³ | |
| ENSMUST00000197200 | 3.1900 | 7.1833 | −1.17 | 3.42 × 10⁻⁵ | 4.45 × 10⁻³ | |
| ENSMUST00000185523 | 3.6467 | 7.9267 | −1.12 | 1.16 × 10⁻⁶ | 2.63 × 10⁻⁴ | |
| ENSMUST00000131037 | 1.3800 | 48.6333 | −5.14 | 2.01 × 10⁻²⁰ | 4.30 × 10⁻¹⁷ | |
| ENSMUST00000173081 | 0.2433 | 6.9100 | −4.83 | 4.30 × 10⁻¹⁴ | 3.52 × 10⁻¹¹ | |
| ENSMUST00000199803 | 0.1133 | 5.4200 | −5.58 | 7.35 × 10⁻⁶ | 1.25 × 10⁻³ | |
| ENSMUST00000220428 | 10.6567 | 30.2200 | −1.50 | 2.87 × 10⁻⁵ | 3.85 × 10⁻³ | |
| MSTRG.2483.2 | 0.2633 | 8.2800 | −4.97 | 2.44 × 10⁻⁶ | 4.84 × 10⁻⁴ | |
| MSTRG.16159.9 | 2.2767 | 26.3967 | −3.54 | 7.92 × 10⁻¹⁰ | 3.31× 10⁻⁷ | |
| MSTRG.17585.1 | 0.0833 | 6.0233 | −6.18 | 7.85 × 10⁻⁶ | 1.32× 10⁻³ | |
| MSTRG.9309.1 | 0.0001 | 8.9167 | −16.44 | 2.67 × 10⁻¹⁴ | 2.35 × 10⁻¹¹ | |
| MSTRG.15980.1 | 3.5233 | 9.9133 | −1.49 | 8.01 × 10⁻⁹ | 2.80 × 10⁻⁶ | |
| MSTRG.18159.11 | 0.2600 | 5.8400 | −4.49 | 2.94 × 10⁻⁷ | 7.31 × 10⁻⁵ | |
| lncRNA ID | Cortex | Hippocampus | ||||||
|---|---|---|---|---|---|---|---|---|
| Log2 Fold Change | p-Value | q-Value | Regulation | Log2 Fold Change | p-Value | q-Value | Regulation | |
| ENSMUST00000127786 | 11.46 | 3.74 × 10⁻⁹ | 1.57 × 10⁻⁶ | up | 10.49 | 5.72 × 10⁻¹¹ | 2.86 × 10⁻⁸ | up |
| ENSMUSG00000098912 | −16.56 | 6.00 × 10⁻¹² | 3.79 × 10⁻⁹ | down | −1.68 | 1.49 × 10⁻⁵ | 2.26 × 10⁻³ | down |
| MSTRG.11359.1 | 16.09 | 2.38 × 10⁻⁹ | 1.04 × 10⁻⁶ | up | 8.62 | 3.67 × 10⁻⁹ | 1.36 × 10⁻⁶ | up |
| MSTRG.17500.2 | 16.40 | 1.44 × 10⁻²⁹ | 5.35 × 10⁻²⁶ | up | 15.82 | 1.77 × 10⁻²⁶ | 7.06 × 10⁻²³ | up |
| MSTRG.16327.2 | 16.42 | 3.75 × 10⁻⁶ | 7.06 × 10⁻⁴ | up | 16.22 | 1.56 × 10⁻⁵ | 2.36 × 10⁻³ | up |
| MSTRG.14838.1 | 17.10 | 1.45 × 10⁻⁹ | 6.67 × 10⁻⁷ | up | 7.44 | 1.23 × 10⁻⁷ | 3.31 × 10⁻⁵ | up |
| MSTRG.1243.32 | 16.63 | 6.51 × 10⁻²³ | 1.43 × 10⁻¹⁹ | up | 16.43 | 4.48 × 10⁻²³ | 1.22 × 10⁻¹⁹ | up |
| lncRNA | miRNA | mRNA |
|---|---|---|
| ENSMUST00000127786 | miR-362-3p, miR-329-3p, miR-466i-3p, miR-669b-5p, miR-3057-5p, miR-5101, miR-15a-5p, miR-466o-3p, miR-466m-3p, miR-539-5p | Clec7a, 5730455P16Rik, Fnbp1, Elovl2 |
| MSTRG.17500.2 | ||
| ENSMUST00000184170 | miR-669b-5p, miR-15a-5p | 5730455P16Rik, Fnbp1 |
| MSTRG.1243.32 | miR-362-3p, miR-329-3p, miR-466i-3p, miR-5101, miR-466o-3p, miR-466m-3p, miR-539-5p | Clec7a, 5730455P16Rik, Fnbp1, Elovl2 |
| MSTRG.16327.2 | miR-3057-5p | 5730455P16Rik |
| Name | Sequence (5′-3′) |
|---|---|
| miR-15a-5p RT | GTCGTATCCAGTGCAGGGTCCGAGGTATTCGCACTGGATACGACCACAAA |
| miR-15a-5p-F | CGCGTAGCAGCACATAATGG |
| miR-329-3p RT | GTCGTATCCAGTGCAGGGTCCGAGGTATTCGCACTGGATACGACAAAAAG |
| miR-329-3p-F | CGCGAACACACCCAGCTAAC |
| miR-466m-3p RT | GTCGTATCCAGTGCAGGGTCCGAGGTATTCGCACTGGATACGACTGCGTG |
| miR-466m-3p-F | CGCGCGTACATACACACATACA |
| miR-466o-3p RT | GTCGTATCCAGTGCAGGGTCCGAGGTATTCGCACTGGATACGACGTCTTA |
| miR-466o-3p-F | GCGCGTACATACATGCACACA |
| miR-539-5p RT | GTCGTATCCAGTGCAGGGTCCGAGGTATTCGCACTGGATACGACACACAC |
| miR-539-5p-F | CGCGGGAGAAATTATCCTTG |
| miR-669b-5p RT | GTCGTATCCAGTGCAGGGTCCGAGGTATTCGCACTGGATACGACACATGC |
| miR-669b-5p-F | CGCGAGTTTTGTGTGCATGT |
| miR-universal R | AGTGCAGGGTCCGAGGTATT |
| ENSMUST00000127786-F | TCACTCCTGCCTTTCGTGAC |
| ENSMUST00000127786-R | AACAAGTGGGGTGAGCACAA |
| ENSMUSG00000098912-F | CAGAACAAGCAGCAAGGCACAAC |
| ENSMUSG00000098912-R | AGTCAGAACCCGTGAAAATCAGTCC |
| Clec7a-F | GTGCAGTAAGCTTTCCTGGG |
| Clec7a-R | TCCCGCAATCAGAGTGAAG |
| Fnbp1-F | AGATGGAGGAGAGGCGGATTGTG |
| Fnbp1-R | TCACTATCCCGTCCAGGCACTTC |
| Elovl2-F | CAACATGTTTGGACCACGAG |
| Elovl2-R | GGATGAAGGTGGGAAGGTAAG |
| 5730455P16Rik-F | GGTGATGATTTCAGCCTCTCCTTGG |
| 5730455P16Rik-R | AACATTACCCAGCCCTTCAAAGACC |
| U6-F | CAAATTCGTGAAGCGTTCCA |
| U6-R | AGTGCAGGGTCCGAGGTATT |
| U6-RT | GTCGTATCCAGTGCAGGGTCCGAGGTA |
| GAPDH-F | TTGATCTGAAGTCAGGAATCCC |
| GAPDH-R | TGTAGACCATGTAGTTGAGGTCA |
Publisher’s Note: MDPI stays neutral with regard to jurisdictional claims in published maps and institutional affiliations. |
© 2022 by the authors. Licensee MDPI, Basel, Switzerland. This article is an open access article distributed under the terms and conditions of the Creative Commons Attribution (CC BY) license (https://creativecommons.org/licenses/by/4.0/).
Share and Cite
Cai, Z.; Zhao, K.; Zeng, L.; Liu, M.; Sun, T.; Li, Z.; Liu, R. The Relationship between the Aberrant Long Non-Coding RNA-Mediated Competitive Endogenous RNA Network and Alzheimer’s Disease Pathogenesis. Int. J. Mol. Sci. 2022, 23, 8497. https://doi.org/10.3390/ijms23158497
Cai Z, Zhao K, Zeng L, Liu M, Sun T, Li Z, Liu R. The Relationship between the Aberrant Long Non-Coding RNA-Mediated Competitive Endogenous RNA Network and Alzheimer’s Disease Pathogenesis. International Journal of Molecular Sciences. 2022; 23(15):8497. https://doi.org/10.3390/ijms23158497
Chicago/Turabian StyleCai, Zhongdi, Kaiyue Zhao, Li Zeng, Mimin Liu, Ting Sun, Zhuorong Li, and Rui Liu. 2022. "The Relationship between the Aberrant Long Non-Coding RNA-Mediated Competitive Endogenous RNA Network and Alzheimer’s Disease Pathogenesis" International Journal of Molecular Sciences 23, no. 15: 8497. https://doi.org/10.3390/ijms23158497
APA StyleCai, Z., Zhao, K., Zeng, L., Liu, M., Sun, T., Li, Z., & Liu, R. (2022). The Relationship between the Aberrant Long Non-Coding RNA-Mediated Competitive Endogenous RNA Network and Alzheimer’s Disease Pathogenesis. International Journal of Molecular Sciences, 23(15), 8497. https://doi.org/10.3390/ijms23158497