Article

Uncovering a Phenomenon of Active Hormone Transcriptional Regulation during Early Somatic Embryogenesis in Medicago sativa

School of Grassland Science, Beijing Forestry University, Beijing 100083, China
*
Authors to whom correspondence should be addressed.
Int. J. Mol. Sci. 2022, 23(15), 8633; https://doi.org/10.3390/ijms23158633
Submission received: 23 June 2022 / Revised: 30 July 2022 / Accepted: 1 August 2022 / Published: 3 August 2022
(This article belongs to the Special Issue Advances in Research for Legume Genomics, Genetics, and Breeding)

Abstract

:
Somatic embryogenesis (SE) is a developmental process in which somatic cells undergo dedifferentiation to become plant stem cells, and redifferentiation to become a whole embryo. SE is a prerequisite for molecular breeding and is an excellent platform to study cell development in the majority of plant species. However, the molecular mechanism involved in M. sativa somatic embryonic induction, embryonic and maturation is unclear. This study was designed to examine the differentially expressed genes (DEGs) and miRNA roles during somatic embryonic induction, embryonic and maturation. The cut cotyledon (ICE), non-embryogenic callus (NEC), embryogenic callus (EC) and cotyledon embryo (CE) were selected for transcriptome and small RNA sequencing. The results showed that 17,251 DEGs, and 177 known and 110 novel miRNAs families were involved in embryonic induction (ICE to NEC), embryonic (NEC to EC), and maturation (EC to CE). Expression patterns and functional classification analysis showed several novel genes and miRNAs involved in SE. Moreover, embryonic induction is an active process of molecular regulation, and hormonal signal transduction related to pathways involved in the whole SE. Finally, a miRNA–target interaction network was proposed during M. sativa SE. This study provides novel perspectives to comprehend the molecular mechanisms in M. sativa SE.

1. Introduction

The process of somatic embryogenesis (SE) consists mainly of dedifferentiation, in which differentiated cells reverse their developmental program during in vitro culture and again during whole-plant development [1,2]. Most plant cells have developmental plasticity, which plays an important role in their reprogramming. The stem cell condition affects the developmental plasticity of plant cells because stem cells are capable of renewing themselves and converting into new somatic embryos that can development into organs or tissues [3]. Chromatin structure is continuously reconstructed throughout plant development, and previous studies showed that chromatin structure plays a crucial role in the pluripotency of plant stem cells [4,5]. In addition, chromatin structure plays important roles in the process of early SE. It is essential, through despiralization of the super-coiled chromatin structure, for the dedifferentiation of somatic cells to produce embryos and induce callus before embryogenesis [4]. On the whole, SE is a powerful tool for research into the processes of plant development and plant stem cell culture conditions [6]. Further investigation of SE will provide opportunities for improving large-scale production of mature somatic embryos and to promote the production of artificial seeds.
Plant growth regulators (PGRs), such as auxin and cytokinins (CKs), are important trigger factors for the culture of plant stem cells for SE [6,7]. For example, 2,4-dichlorophenoxyacetic acid (2,4-D) is an active factor for dedifferentiation in vitro culture, which serves as a “stressor” for the explant [8]. Induction of SE in soybean and potato by 2,4-D is related to increased oxidative stress and expression of defense genes [9,10]. The external PGR supply changes the internal auxin concentration of the explant, which contributes to callus induction [4,9,11].
The process of SE involves various signaling pathways and differential gene expression. Transcription factors (TFs) are also important factors in SE induction. For instance, in Arabidopsis, a marked upregulation of TFs is associated with the embryo induction stage [12]. TFs encoded by genes such as BABY BOOM (BBM) [13], PGA6 [14] and LEAFY COTYLEDON (LEC) [15] also regulate the totipotency of the plant cell, which is critical for SE. BBM, which belongs to the AP2/ERF family, is expressed in immature pollen grains of Brassica napus and is expressed preferentially in developing embryos [13]. The PGA6 gene encodes a homeodomain protein and plays a key role during SE by promoting the vegetative-to-embryogenic transition and maintaining the activity of embryonic stem cells [14]. The LEC1, LEC2 and LEC3 genes are essential for SE induction in Arabidopsis [15].
Small RNAs guide regulatory processes at the DNA or RNA level in plants. Many small RNAs mediate transcriptional silencing of genes to regulate plant development, whereas other small RNAs mediate post-transcriptional silencing of genes to regulate embryonic development [16]. There are few reports of small RNAs involved in SE, but microRNAs (miRNAs) and other small noncoding RNAs regulate gene expression epigenetically, which plays a crucial role in SE [17]. miR159 regulates LaMYB33 during the process of SE in Larix kaempferi (Lamb) Carr [18]. Several miRNAs, including miR397 and miR156, show positive patterns of expression during the process of dedifferentiation to redifferentiation in rice [19]. DCL1 regulates miRNA biogenesis during early SE development in Arabidopsis, and the single mutant of dcl1 causes a loss in miRNA156 expression, which results from derepression of SPL10 and SPL11 genes [20].
Genome-wide profiling has made it possible to understand molecular regulatory mechanisms of SE. Recently, high-throughput sequencing technology has allowed multiple advances in genome-wide screening of quantitative gene expression in plants [21]. Gene chip technology has been used to determine mRNA abundance and to identify characteristic changes during dedifferentiation in soybeans [22]. The results of the studies mentioned imply that new cells of dedifferentiation generation that develop organized structures may rely on gene regulation to balance cell proliferation and cell death [9]. Proteomic analysis suggests the involvement of mechanisms in the transition from morphologically mature to physiologically mature somatic embryos during the partial desiccation treatment process in Picea asperata [23]. These studies help to identify the molecular regulatory mechanisms that are active during SE.
M. sativa is a tetraploid perennial species that is the most important cultivated forage crop due to its high regeneration capacity in vitro. Thus, M. sativa has been used in molecular studies and breeding. The first reported M. sativa regeneration was accomplished via SE [24]. In the past, the study of somatic embryo formation in M. sativa focused mainly on the morphological and physiological levels; the molecular mechanisms related to SE in M. sativa remain unclear. For example, in proteomic analysis of SE in two varieties of M. truncatula, 6-benzylaminopurine (BAP) and 1-naphthaleneacetic were added to the explant culture medium. The results suggested that more than 60% of differentially expressed protein spots exhibited different patterns of gene expression between the two varieties during 8 weeks of culture [25]. This study aimed to identify molecular mechanisms during somatic embryonic induction, embryonic and maturation in M. sativa.
In this study, we used Illumina high-throughput sequencing technology to analyze DEGs and miRNAs expression at the ICE, NEC, EC and CE phases in M. sativa SE. A total of 17,251 DEGs 177 known and 110 novel miRNAs families were obtained. Among these, several novel DEGs and miRNAs were detected during somatic embryonic induction, embryonic and maturation. For example, novel_247 targets the LTP8 gene, which may play an important role in maturation. In addition, the results suggest a potential miRNA–target gene interaction network involved in M. sativa SE, which further complements the molecular mechanisms in SE.

2. Results

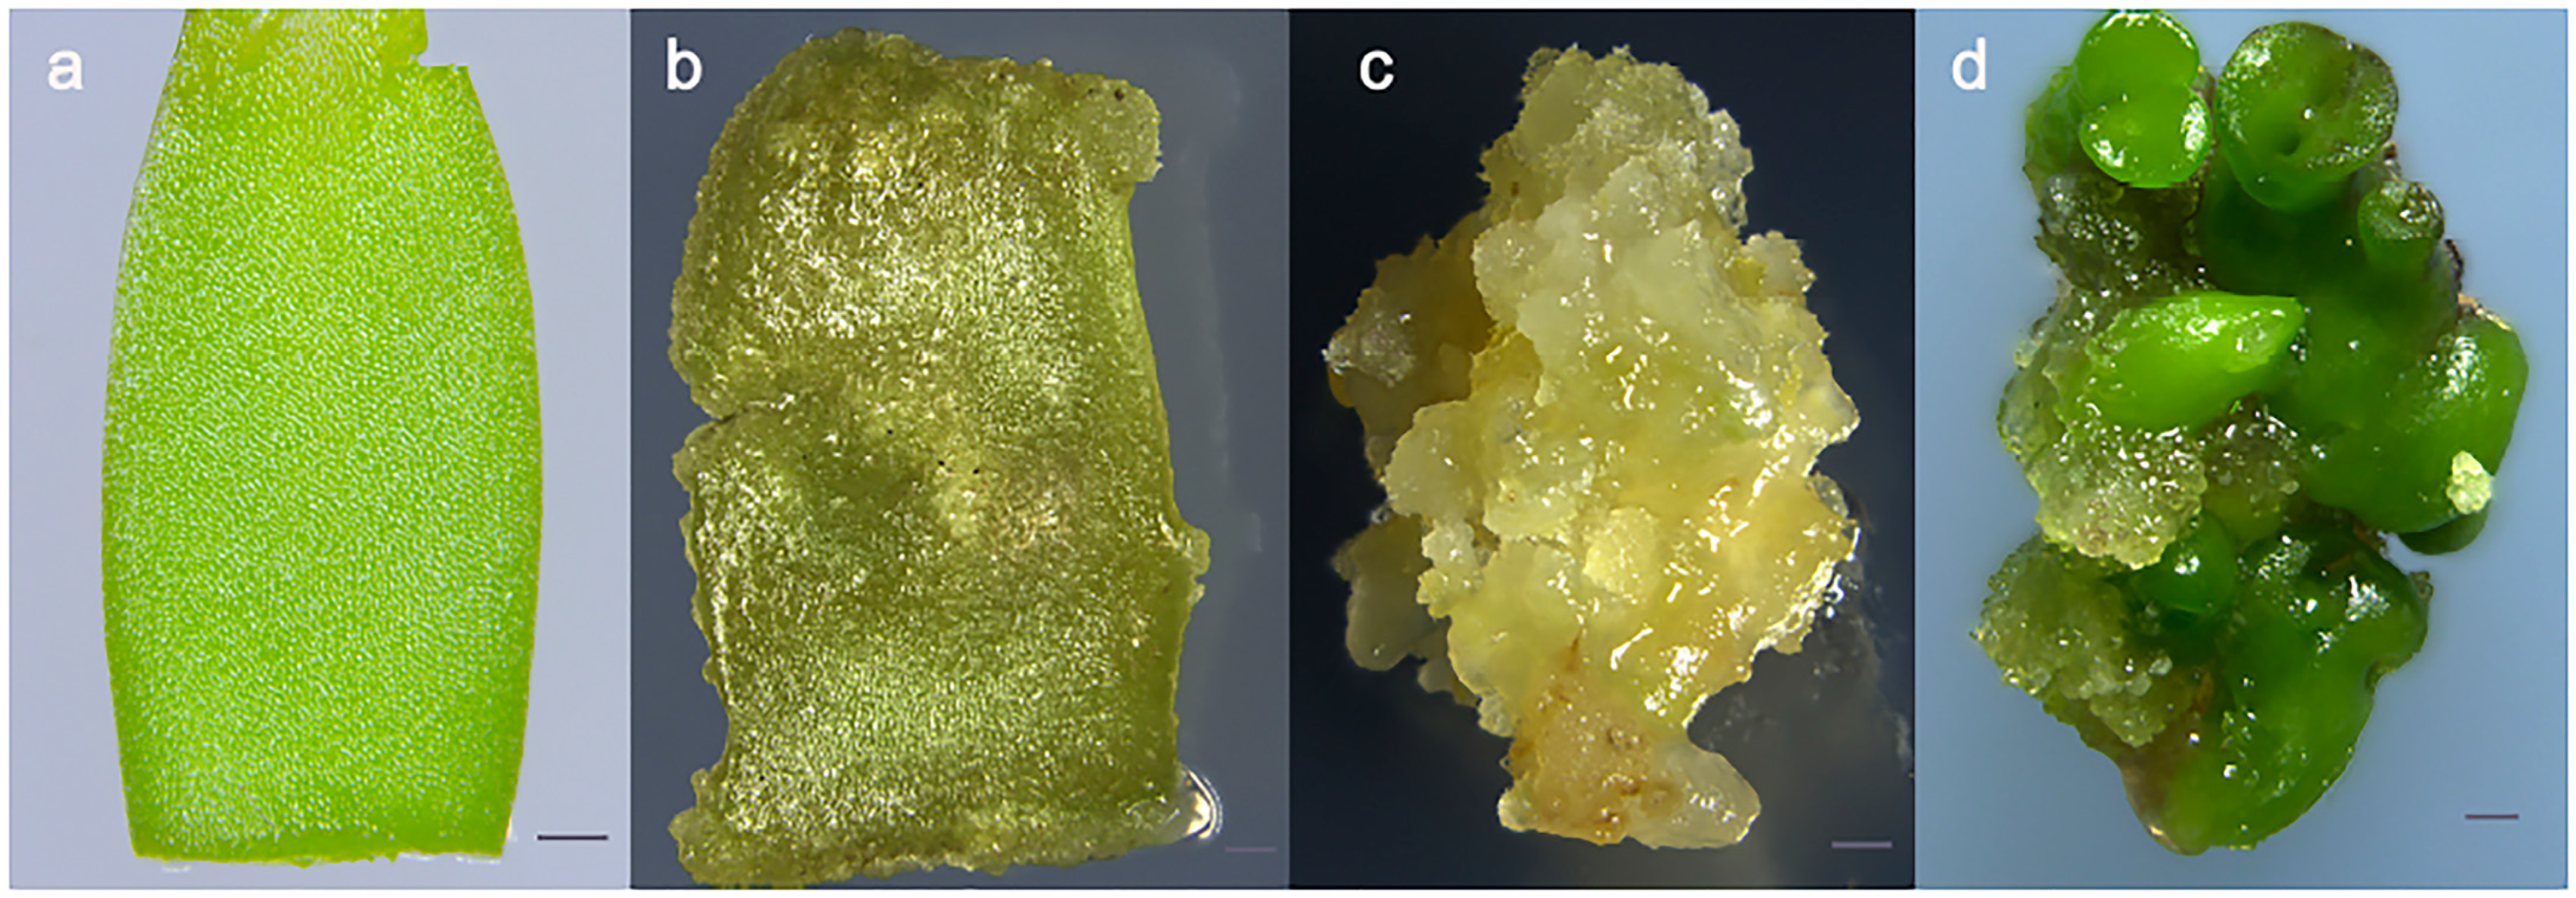
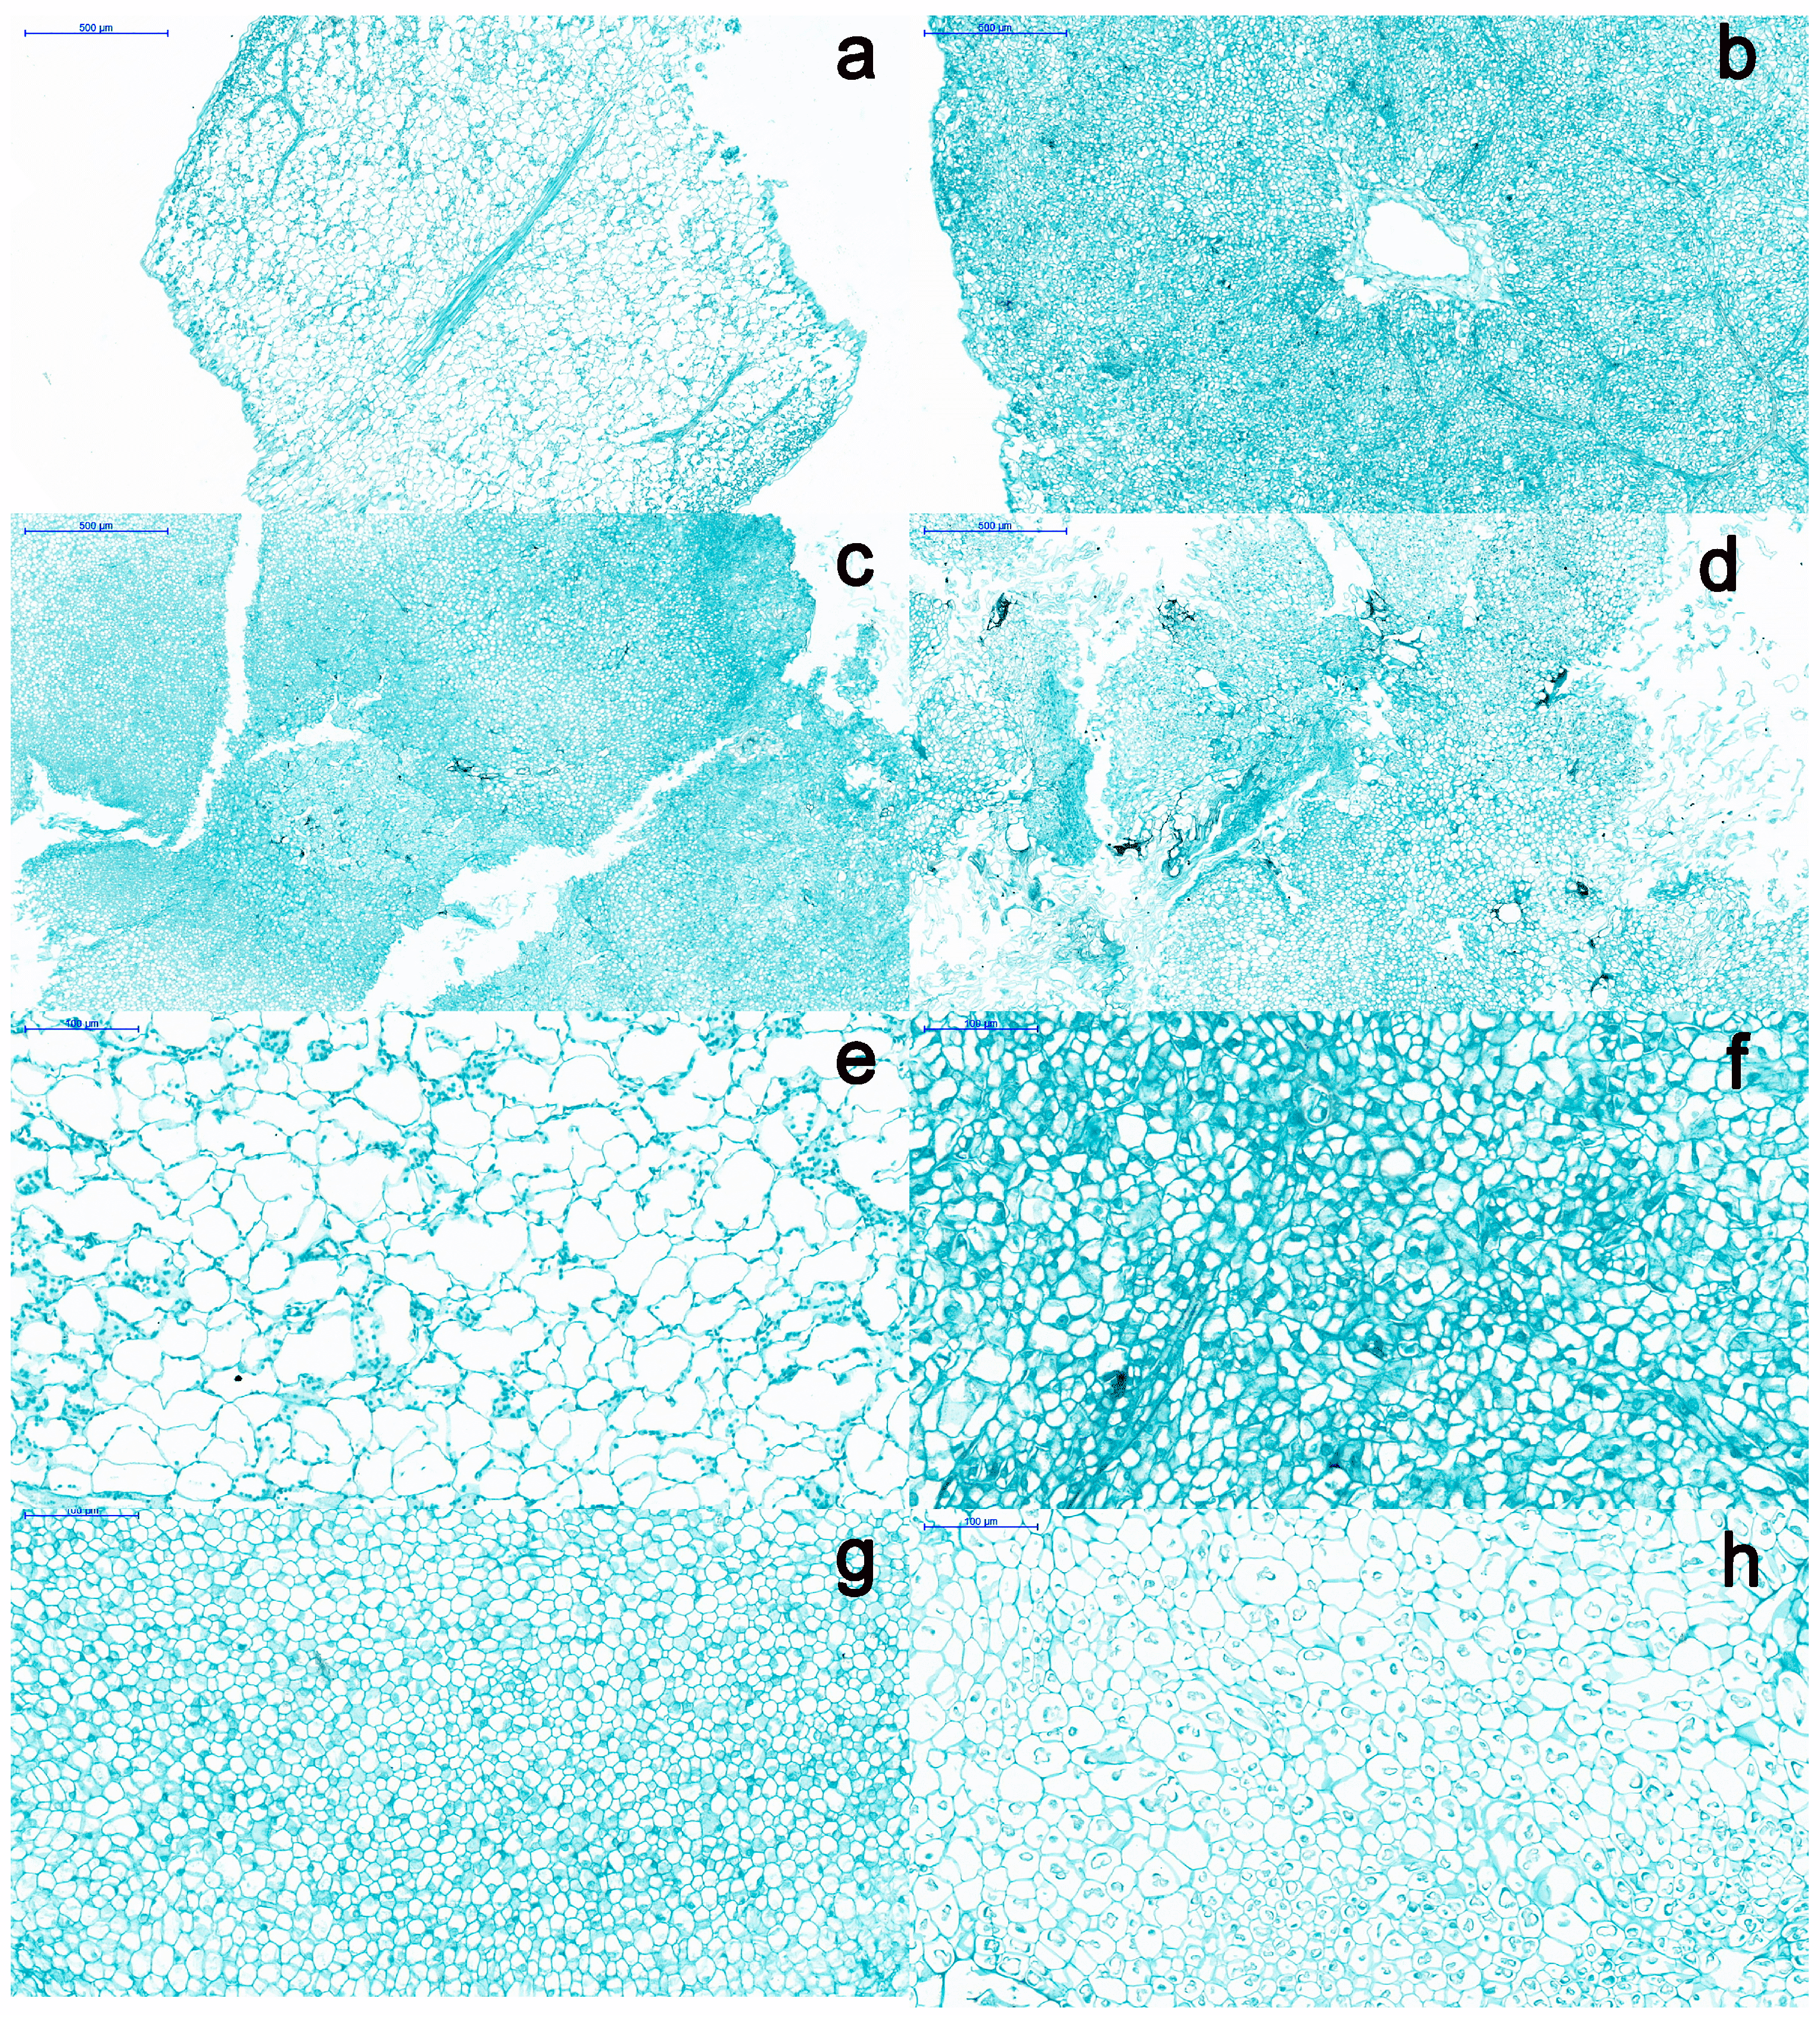
2.1. Morphological Comparison of SE at Different Developmental Stages

SE involves three phases: embryonic induction, embryonic and maturation [26]. To understand the detailed phases of SE, 14 developmental stages were observed using a light microscope (Figure S1). We selected four stages (ICE, NEC, EC and CE) for RNA sequencing (RNA-seq), as the morphological changes observed in these four stages were the most notable. The stages from ICE to NEC represent the embryonic induction process (Figure 1a,b and Figure 2a,b,e,f), NEC to EC represents the embryonic stage (Figure 1b,c and Figure 2b,c,f,g), and EC to CE represents the maturation process (Figure 1c,d and Figure 2c,d,g,h). The cell size during the ICE was larger than during the NEC, EC and CE, whereas the number of cells was larger in the EC than ICE, NEC and CE. The cell shape was more regular in the EC than the ICE, NEC and CE. From ICE through EC, the cell number increased gradually, while the cell size decreased. However, from the EC to the CE phase, the cell size increased gradually, while the cell number decreased gradually. These findings suggest that the changes in tissue morphology differed significantly among the various development stages.

2.2. Transcriptome Sequencing and Assembly

ICE, NEC, EC and CE cells were used as sources for RNA-seq. All data were generated using three biological replicates. The RNA-seq generated an average of 8.15 GB of data for the ICE, NEC, EC and CE databases (Table 1). The false discovery rate was less than or equal to 0.02%. All databases produced a total of 668,180,574 raw reads, including 97.60% Q20 bases with a 41.60% GC content. After 97.53% of the raw reads were selected for filtration, 207, 276, 776 clean reads were selected for further analysis using Trinity. All clean reads were assembled into 267, 977 unigenes. The mean length of the genes was 986 bp, and the maximum length was 16,765 bp. The N50 fragment length was 1392 bp, and the N90 fragment length was 466 bp. The size distributions of the unigenes and transcripts are shown in Figure 3a. Unigenes of 501–1000 bp were the most common in all sample data, accounting for 32.6% of the data. Transcripts of 301 bp or less were the most frequent, accounting for 35.85% of all data.

2.3. Gene Annotation and Functional Classification in M. sativa

After matching the sequences with the KOG/COG database, a total of 43,572 unigenes were classified into 26 categories (Figure S2). The majority of unigenes (5207) were predicted to be associated with post-translational modification, protein turnover and chaperones (11.95%), followed by general functions (11.90%), translation, ribosomal structure and biogenesis (8.18%), signal transduction mechanisms (7.73%) and RNA processing and modification (6.85%). Five unigenes (0.01%) had unknown functions.
A total of 101,969 unigenes were selected for GO classification using Blast2GO v2.5 (BioBam, Valencia, Spain), which classified into biological process, cellular component and molecular function groups (Table S1). The highest category was nucleoside binding (14.03%) of molecular function, followed by intracellular membrane-bounded organelle (12.84%), small molecule metabolic process (10.77%), cytoplasm (8.78%) and cell communication (7.55%). In the cellular component, many of unigenes conducted various functions, which contained nuclear chromatin (0.01%), cell wall (0.04%), plasma membrane (1.07%) and transporter complex (0.35%). In the distribution of molecular function, the nucleoside binding (14.03%), substrate-specific transmembrane transporter activity (4.29%) and hydrolase activity, acting on ester bonds (3.65%) were mainly representation. Interestingly, 83 unigenes were predicted to be involved in embryonic development and 237 in post-embryonic development. The unigenes associated with embryogenesis are summarized in Table S2, which includes 39 GO functional terms. There were embryo development (83), reproductive structure development (34), regulation of cell differentiation (49), post-embryonic morphogenesis (201) and root morphogenesis (3), these GO terms were important developmental processes during SE.
All unigenes were analyzed using KEGG classification to identify the biological functions in M. sativa. After mapping against the KEGG database, 47,092 unigenes were classified into four main categories and 128 pathways (Table S3). The largest category of unigenes was metabolism, accounting for 62.7%, followed by genetic information processing (26.89%), cellular processes (6.41%) and environmental information processing (4%). Interestingly, carbon metabolism was the largest representative in the metabolism category, accounting for 4.66% of unigenes. This finding was consistent with that described in Lilium SE [27], suggesting that carbon metabolism is active in M. sativa. In addition, zeatin biosynthesis pathway (182) components of metabolism and plant hormone signal transduction genes involved in environmental information processing (1046) were predicted to be active in M. sativa SE, suggesting that these pathways play important roles in SE.

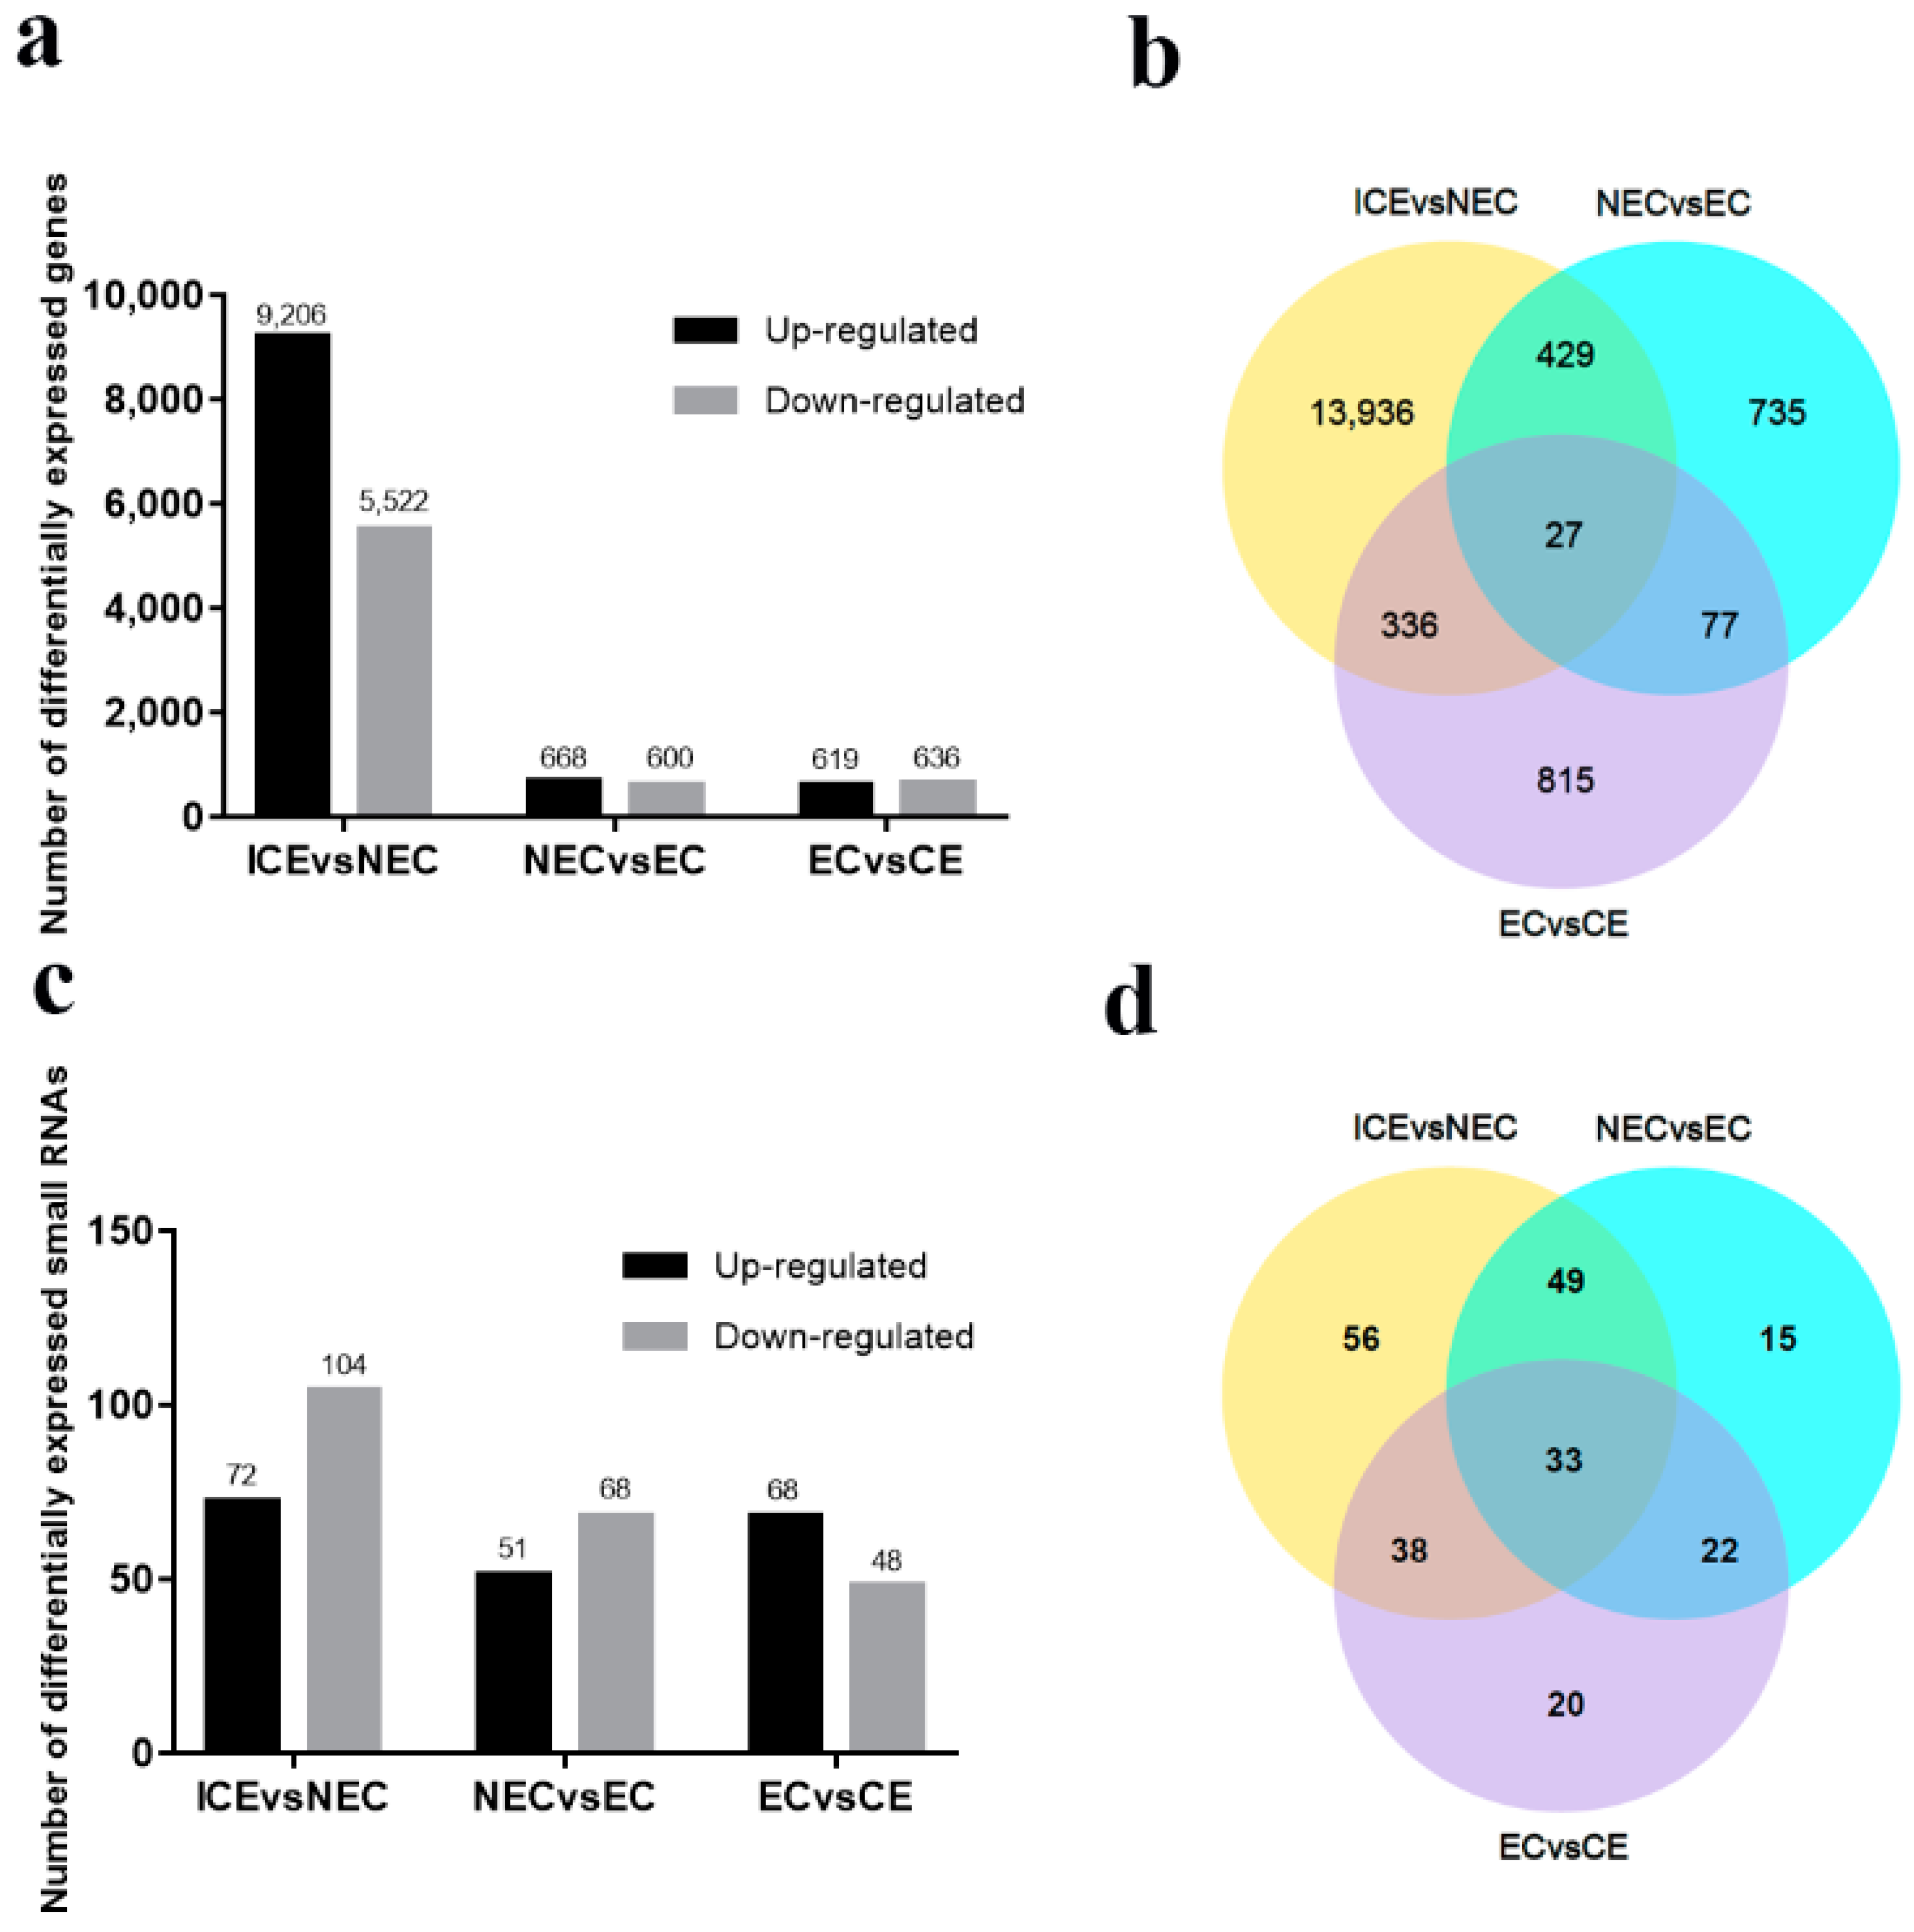
2.4. Identification and Analysis of DEGs in SE

After four unigene libraries were compared with each other to identify DEGs (p-value < 0.05 and |log2 FC| ≥ 1), three DEG groups were then produced (ICE vs. NEC, NEC vs. EC, EC vs. CE) that included 17,251 DEGs (Table S4). A comparative analysis of the 17,251 DEGs at different SE phases is shown in Figure 4a. The number of DEGs was significantly higher in the ICE compared to the NEC, and higher in the NEC compared to the EC, and in the EC compared to the CE. In addition, 9206 genes were upregulated and 5522 genes were downregulated in the ICE compared to the NEC. Only 668 genes were upregulated and 600 genes were down-regulated in the NEC compared to the EC, and 619 genes were upregulated and 636 genes were downregulated in the EC compared to the CE. These results indicate that the early SE is active during the complicated development process.
All DEGs were selected for Venn diagram analysis (Figure 4b). In total, 27 genes were expressed in all the phases of SE, 429 genes were expressed in the ICE to the NEC and the NEC to the EC two development phrases; 77 genes were expressed in the ICE to NEC, and the EC to the CE two development groups; 336 genes were expressed in the ICE to NEC and NEC to EC two development phrases. There were few DEG involved in multiple SE stages.

2.5. Some DEGs Involved in Embryonic Induction, Embryonic and Maturation

To further investigate the function of DEGs, we identified 61 DEGs in 18 families involved in SE (Table S5), including BABY BOOM (BBM), WUSCHEL related homeobox (WOX), PKL (PICKLE) and somatic embryogenesis receptor-like kinase (SERK). Most of the DEGs (80.32%) were involved in embryonic induction, followed by embryonic (14.75%) and maturation (4.91%). In addition, LATERAL ORGAN BOUNDARIES DOMAIN (LBD), argonaute (AGO), glycogen debranching enzyme (AGL) and authentic response regulator (ARR) were observed in embryonic induction and embryonic, and WOX and Pyoluteorin (PLT) were involved in embryonic induction and maturation. Interestingly, no single gene family was observed throughout SE, indicating that stage-specific studies are necessary in the future. Among all DEGs, 14 were upregulated and 35 downregulated in embryonic induction, particularly LBD41, LBD16, flavin monooxygenase5 (YUC5) and YUC9, with |log2 FC| values > 9. 5 genes were upregulated and 3 genes were downregulated in embryonic. Such as PKL and LBD4 were upregulated more than 3-fold. WOX6, PLT1 and PLT2 was upregulated more than 3-folds in maturation.

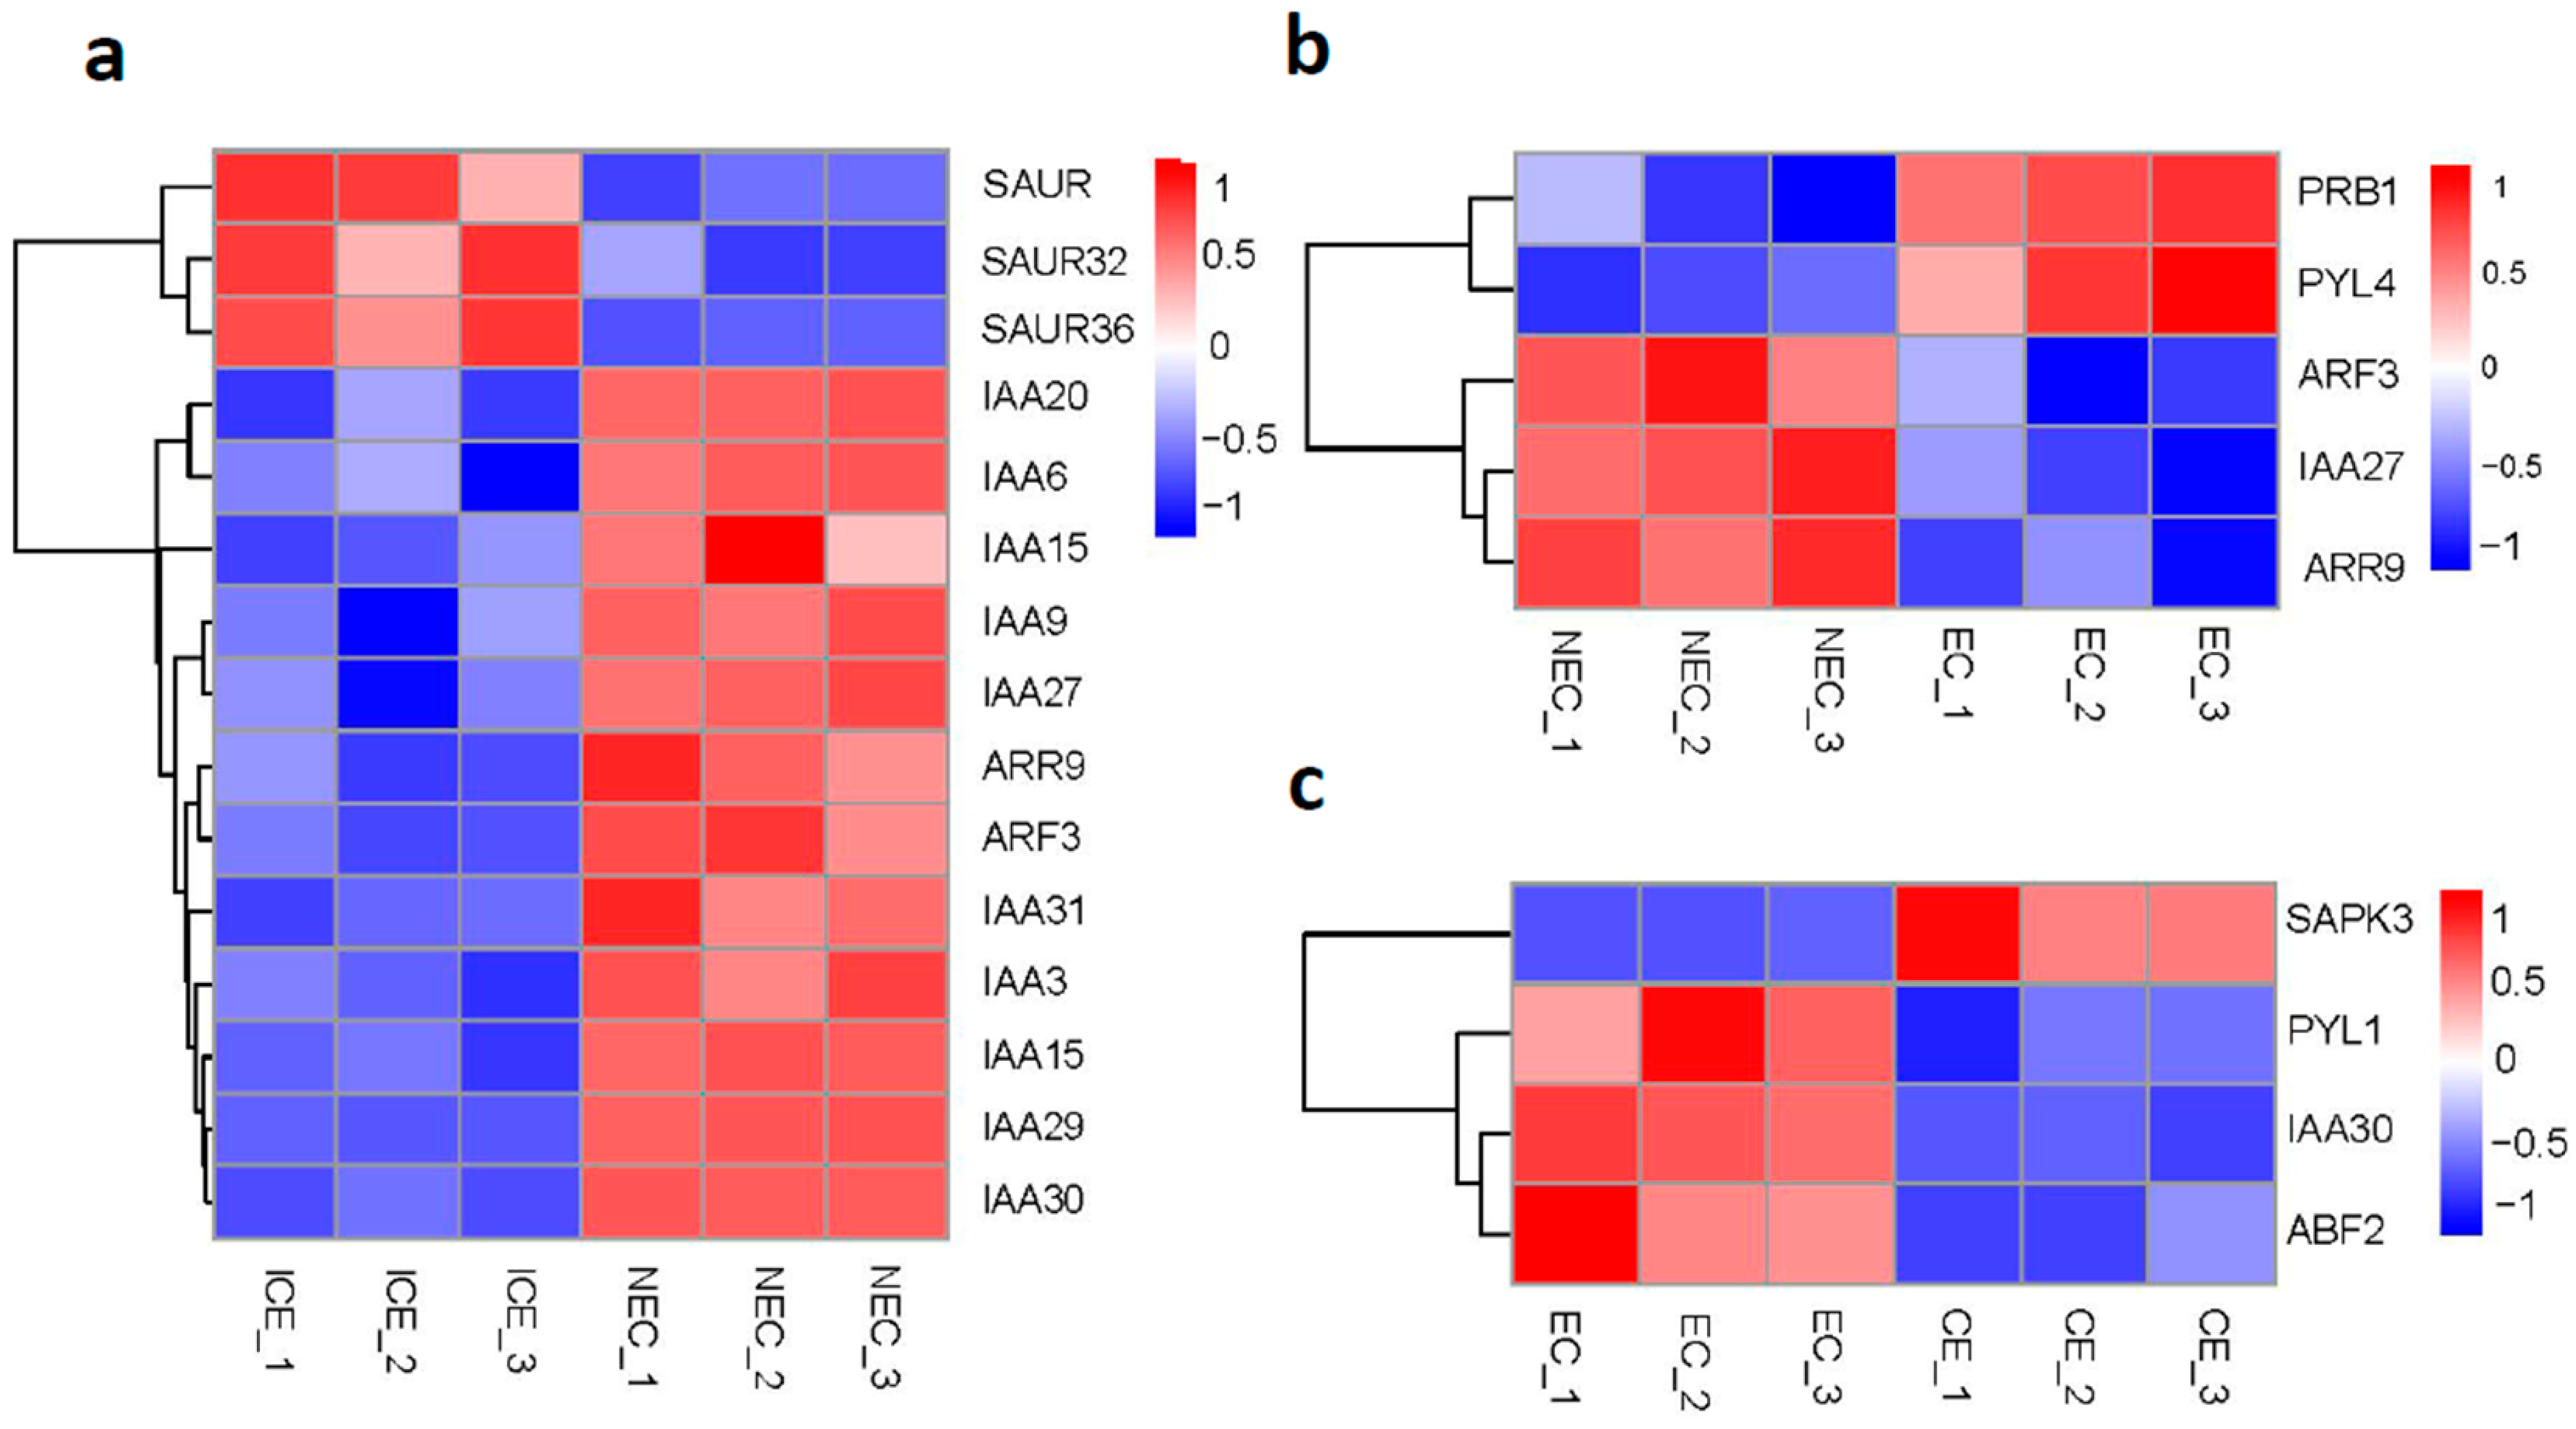
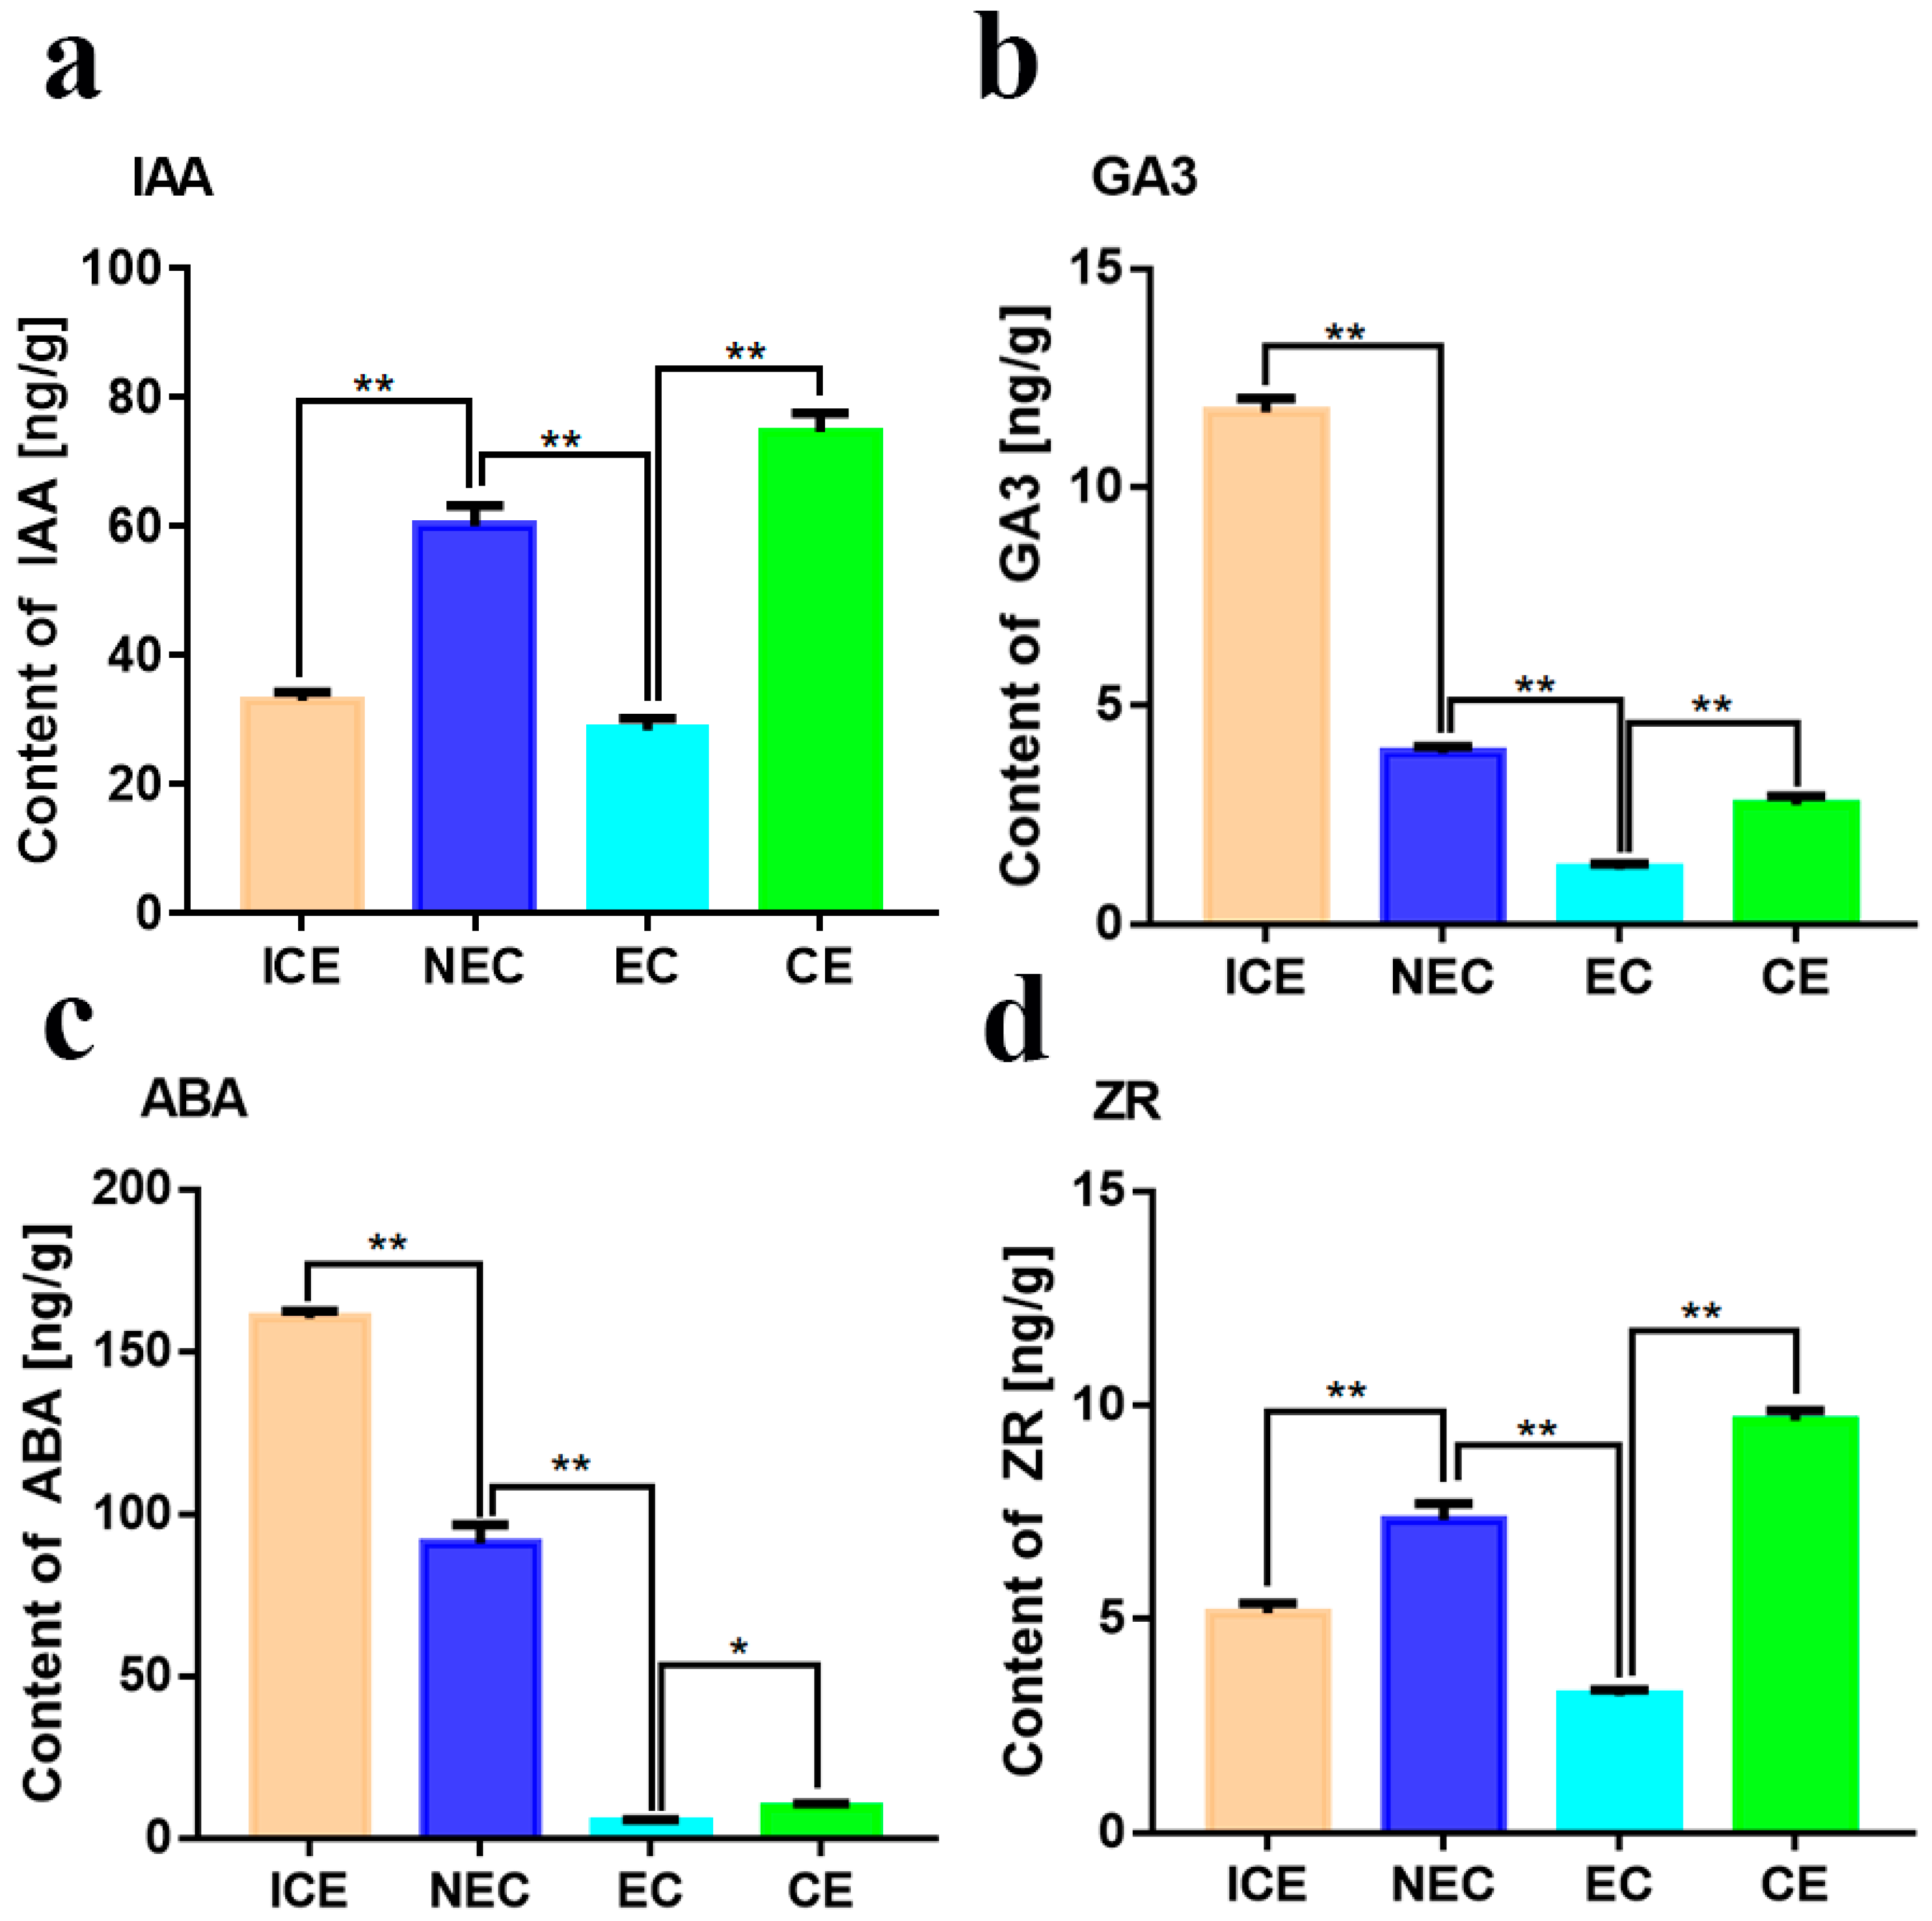
2.6. Expression of Plant Hormone Signal Transduction Genes in SE

We detected ~118 DEGs involved in plant hormone signal transduction pathways (Table S6), including IAA, zeatin, ethylene (ET), ABA and GA pathways; 106 DEGs were involved in the transition from embryonic induction (Table S6), 8 in maturation, and 5 in embryonic (Table S6). Several DEGs exhibited higher expression levels during embryonic induction. IAA, ARR, and Auxin Response Factor (ARF) family genes were upregulated more than 2-fold (|log2 FC| > 2). However, Auxin-induced protein (SAUR), SAUR32 and SAUR36 was downregulated (Figure 5a). KEGG analysis indicated that IAA, ARF and SAUR are involved in auxin pathways during embryonic induction. Endogenous auxin expression increased nearly 2-fold from ICE to NEC (Figure 6a). Elhiti et al. found that expression of LEC gene directly induce AGAMOUS expression during early embryogenesis, which in turn upregulates GA2OX and decreases GA synthesis [26]. In our data, which are GA2OX homologs as DEGs. During the embryonic induction, LEC2 gene expression was upregulated more than 5-fold, and GA2OX1 was downregulated more than 2-fold. However, GA2OX2 was downregulated more than 3-fold. The expression of these genes did not change significantly during other phases. GA3 expression decreased sharply at four sampling sites (Figure 6b). Li et al. found that several MYBs are positive regulators of ABA responses [28]. We also detected genes homologous to MYB among the DEGs, including MYB4 and MYB48. In maturation, MYB4 and MYB48 were downregulated more than 2.03-fold, with no significant changes during the other phases. We detected changes in ABA among the phases (Figure 6c). From ICE to NEC and NEC to EC, the level of ABA decreased sharply. However, from EC to CE, the ABA content increased slightly. We also detected changes in ZR levels among the phases (Figure 6d). From ICE to NEC, the ZR content was slightly upregulated, and from NEC to EC, it was decreased by nearly half. However, from EC to CE, the ZR content more than doubled. In addition, Pathogenesis-related protein 1 (PRB1) and Abscisic acid receptor (PYL4) were upregulated, and IAA27, ARF3 and ARR9 were downregulated in embryonic (Figure 5b). Serine/threonine-protein kinase (SAPK3) was upregulated, and PYL1, IAA30 and ABA response element-binding factor (ABF2) were downregulated in maturation (Figure 5c).

2.7. Annotation of Small RNA-Seq Data

To investigate SE in M. sativa, four small RNA libraries (ICE, NEC, EC and CE) were sequenced. A total of 51,465,356 raw reads were obtained from each library. After filtering, 46,453,585 clean reads were obtained from four libraries (Table 2). The most common small RNAs were 21–24 nucleotides (nt) in length (Figure 3b), with the majority being 24 nt. All unique sequences were annotated and mapped in the Rfam database using BLAST. A total of 19,765,615 small RNAs were annotated in four libraries. ICE was the most abundant, accounting for 30.19% (Table 3). The annotated small RNAs included known miRNAs, novel miRNAs, ribosomal RNAs (rRNAs), tRNAs, snRNAs, small nucleolar RNAs (snoRNAs) and trans-acting small interfering RNAs (TASs) in ICE. The known miRNAs were the most abundant (12.04%), followed by novel rRNAs (7.24%), novel miRNAs (2.23%), TASs (0.32%), snoRNAs (0.16%), snRNAs (0.07%) and tRNAs (0.00%). However, 77.58% of the other small RNAs involved in ICE are unknown. These results indicated that small RNAs are more active in embryonic induction than in other development stages.

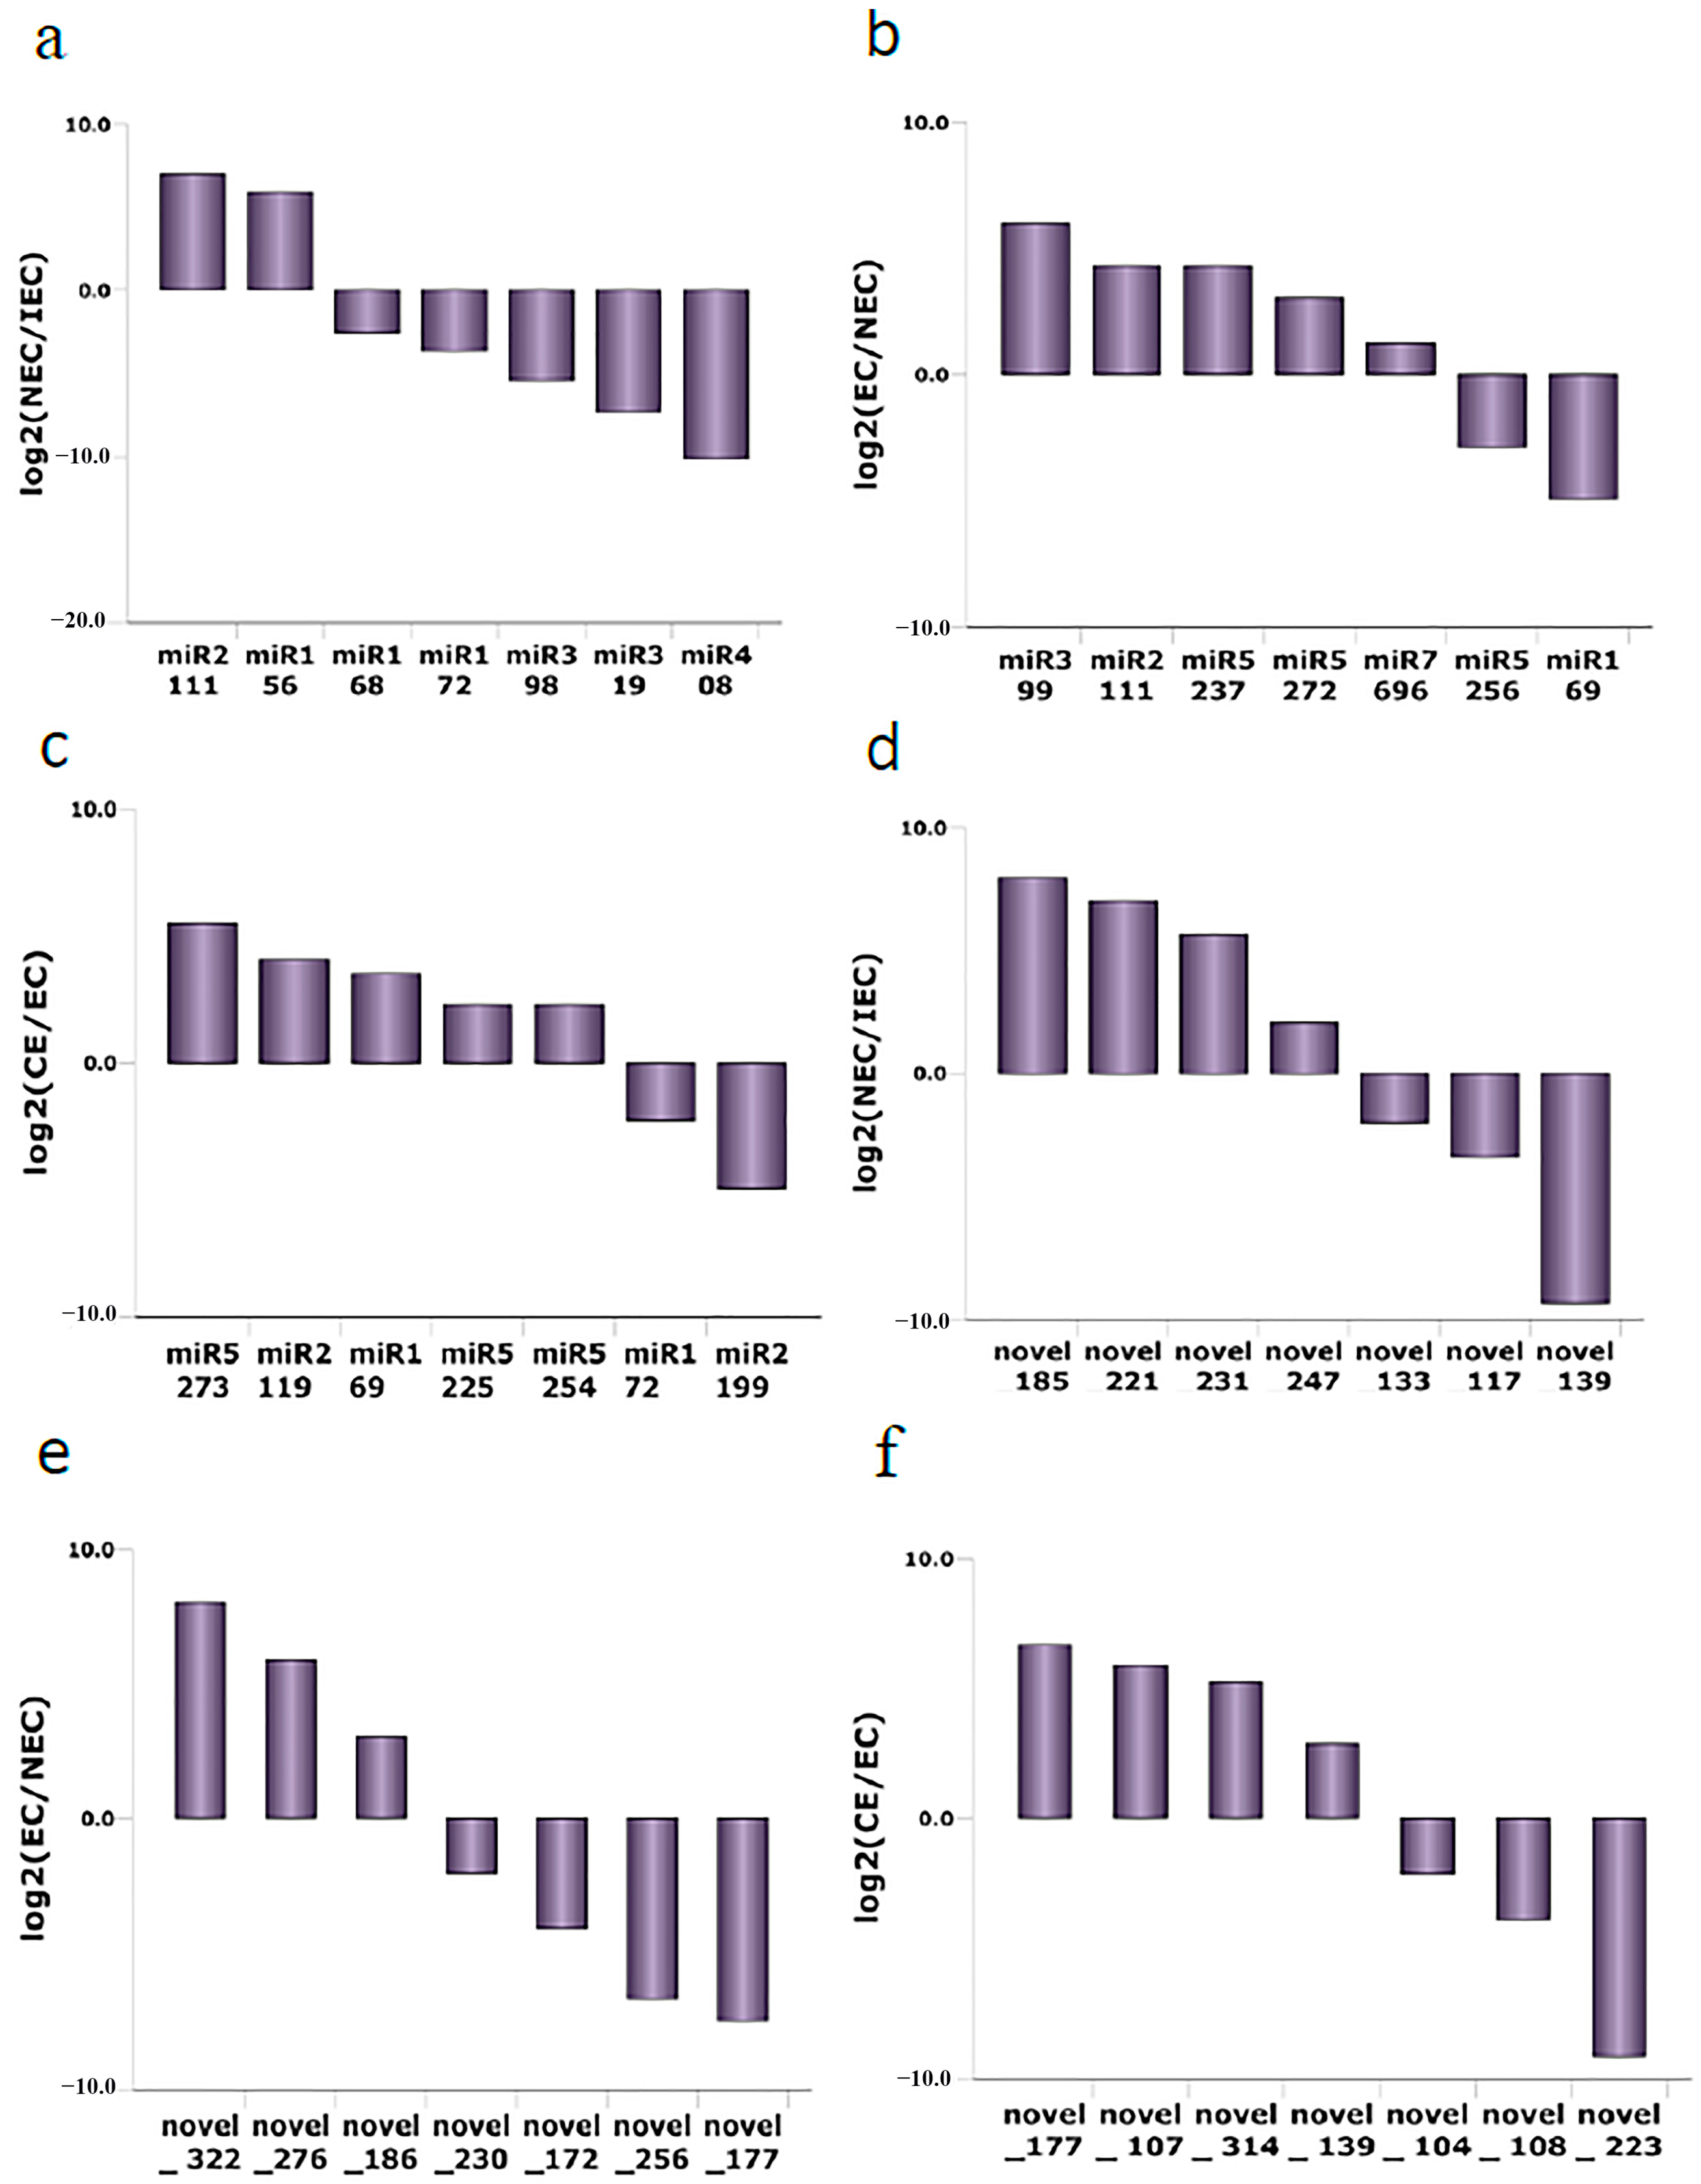
2.8. Identification and Expression Analysis of Known miRNAs in M. sativa

After annotating the small RNAs, ~308 known miRNAs were identified from four libraries. Table S7 shows the number of known miRNAs. All identified known miRNAs belong to 177 miRNA families. Several miRNA families contained more than one member, such as the mi156 (11), miR166 (5), miR169 (7) and miR171 (8) families. Approximately 45 families contained only one member, such as the miR5218, miR5237, miR2625 and miR2605 families. Small RNA-seq data revealed 124 known families with significantly different expression levels ranging from 0 to 1,000,000 transcripts per kilobase million (TPM) among all libraries (Table S8). These 124 families were classified into four groups based on maximum expression levels. The first group contained 13 families, including miR5213, miR159, miR166 and miR167, which expressed more than 10,000 TPM and were detected in at least one sample. Among these 13 families, miR5213 showed the highest expression, exceeding 200,000 TPM in each sample (Figure 7a). The second group contained 11 known families that ranged in expression from 1000 to 10,000 TPM, with miR1510 showing the highest expression of more than 5000 TPM in all samples (Figure 7b). The third group contained 21 families that ranged in expression from 100 to 1000 TPM, with miR5214 exhibiting the highest expression level in this group (Figure 7c). The fourth group contained the remaining 79 families, which ranged in expression from 0 to 100 TPM. As shown in Figure 7d, miR2603 showed the highest level of expression.

2.9. Identification of Potential Novel miRNAs in M. sativa

The miREvo and miRdeep2 software (Berlin, Germany) were used to predict several potential miRNAs due to their unique hairpin structure. This mature sequence is a common trait in potential novel miRNAs in M. sativa, and these novel miRNA candidates might be regarded as a new miRNA family if they originated from different loci. We identified 110 novel families distributed in four samples (Table S9). Interestingly, 10 families were involved throughout SE (novel_322, novel_263, novel_249, novel_70, novel_67, novel_186, novel_94, novel_46, novel_231 and novel_287), which accounting for 9.09%. We detected 21 families that were expressed exclusively during embryonic induction, 12 during maturation and 9 during embryonic. The length of the novel family members expressed during the maturation phase ranged from 19 to 24 nt. Gene expression profiles revealed that 28 families were upregulated and 46 families downregulated in embryonic induction, and 27 families were upregulated and 30 families downregulated in embryonic formation. More families were downregulated than upregulated during the embryonic induction and embryonic formation stages. However, more families were upregulated (32) than downregulated (24) during the maturation stage. These results suggest that several new novel miRNAs play roles in maturation in a manner that differs from those involved in embryonic induction and embryonic.

2.10. Expression of Known and Novel miRNAs during SE in M. sativa

The numbers of miRNAs involved in the three developmental processes are shown in Figure 4c. The miRNA changes from the ICE to the NEC phase were significantly higher than in the NEC to the EC phase and the EC to the CE phase. From the EC to CE stage, more miRNAs were upregulated than downregulated. Venn diagram analysis of 418 miRNAs showed different expression levels among the three developmental processes (Figure 4d). A total of 33 miRNAs were expressed throughout SE; 49 miRNAs overlapped between the ICE to the NEC phase and the NEC to the EC phase, 22 miRNAs overlapped between the ICE to the NEC phase and the EC to the CE phase, and 38 miRNAs overlapped between the ICE to the NEC phase and the EC to the CE phase.
As mentioned previously, SE in M. sativa was classified into three major stages: embryonic induction (ICE to NEC), embryonic (NEC to EC) and maturation (EC to CE). The differentially expressed miRNA families were defined as having an |log2 FC| value ≥ 2. A total of 39 known miRNA families exhibited differential expression during embryonic induction. Among these families, seven were selected for further comparison analysis in embryonic induction; five families showed downregulated expression of varying degrees, and two families were upregulated, including miR156 and miR2111 (Figure 8a). A total of 18 known miRNA families showed differential expression during the embryonic phase. We selected seven of these families for analysis (Figure 8b), of which five were upregulated and two were downregulated (miR5256 and miR169). A total of 17 known miRNA families were differentially expressed during maturation. Five families were upregulated and two downregulated (Figure 8c). In general, these results indicate that each developmental stage relies on major clusters of known miRNAs to regulate SE in M. sativa.
To identify the major miRNA clusters involved in the various stages of SE, we analyzed the differential expression of 110 novel miRNA families. A total of 51 families showed differential expression in embryonic induction, 33 in embryonic formation and 32 in maturation. We selected seven families for analysis in each stage. There was no significant difference in the number of miRNAs that were up- or downregulated (Figure 8d–f). Interestingly, the novel miRNA families showed differential expression in each stage, a phenomenon similar to that observed with known miRNAs. These results indicated that several major novel miRNA clusters showed stage-specific expression.

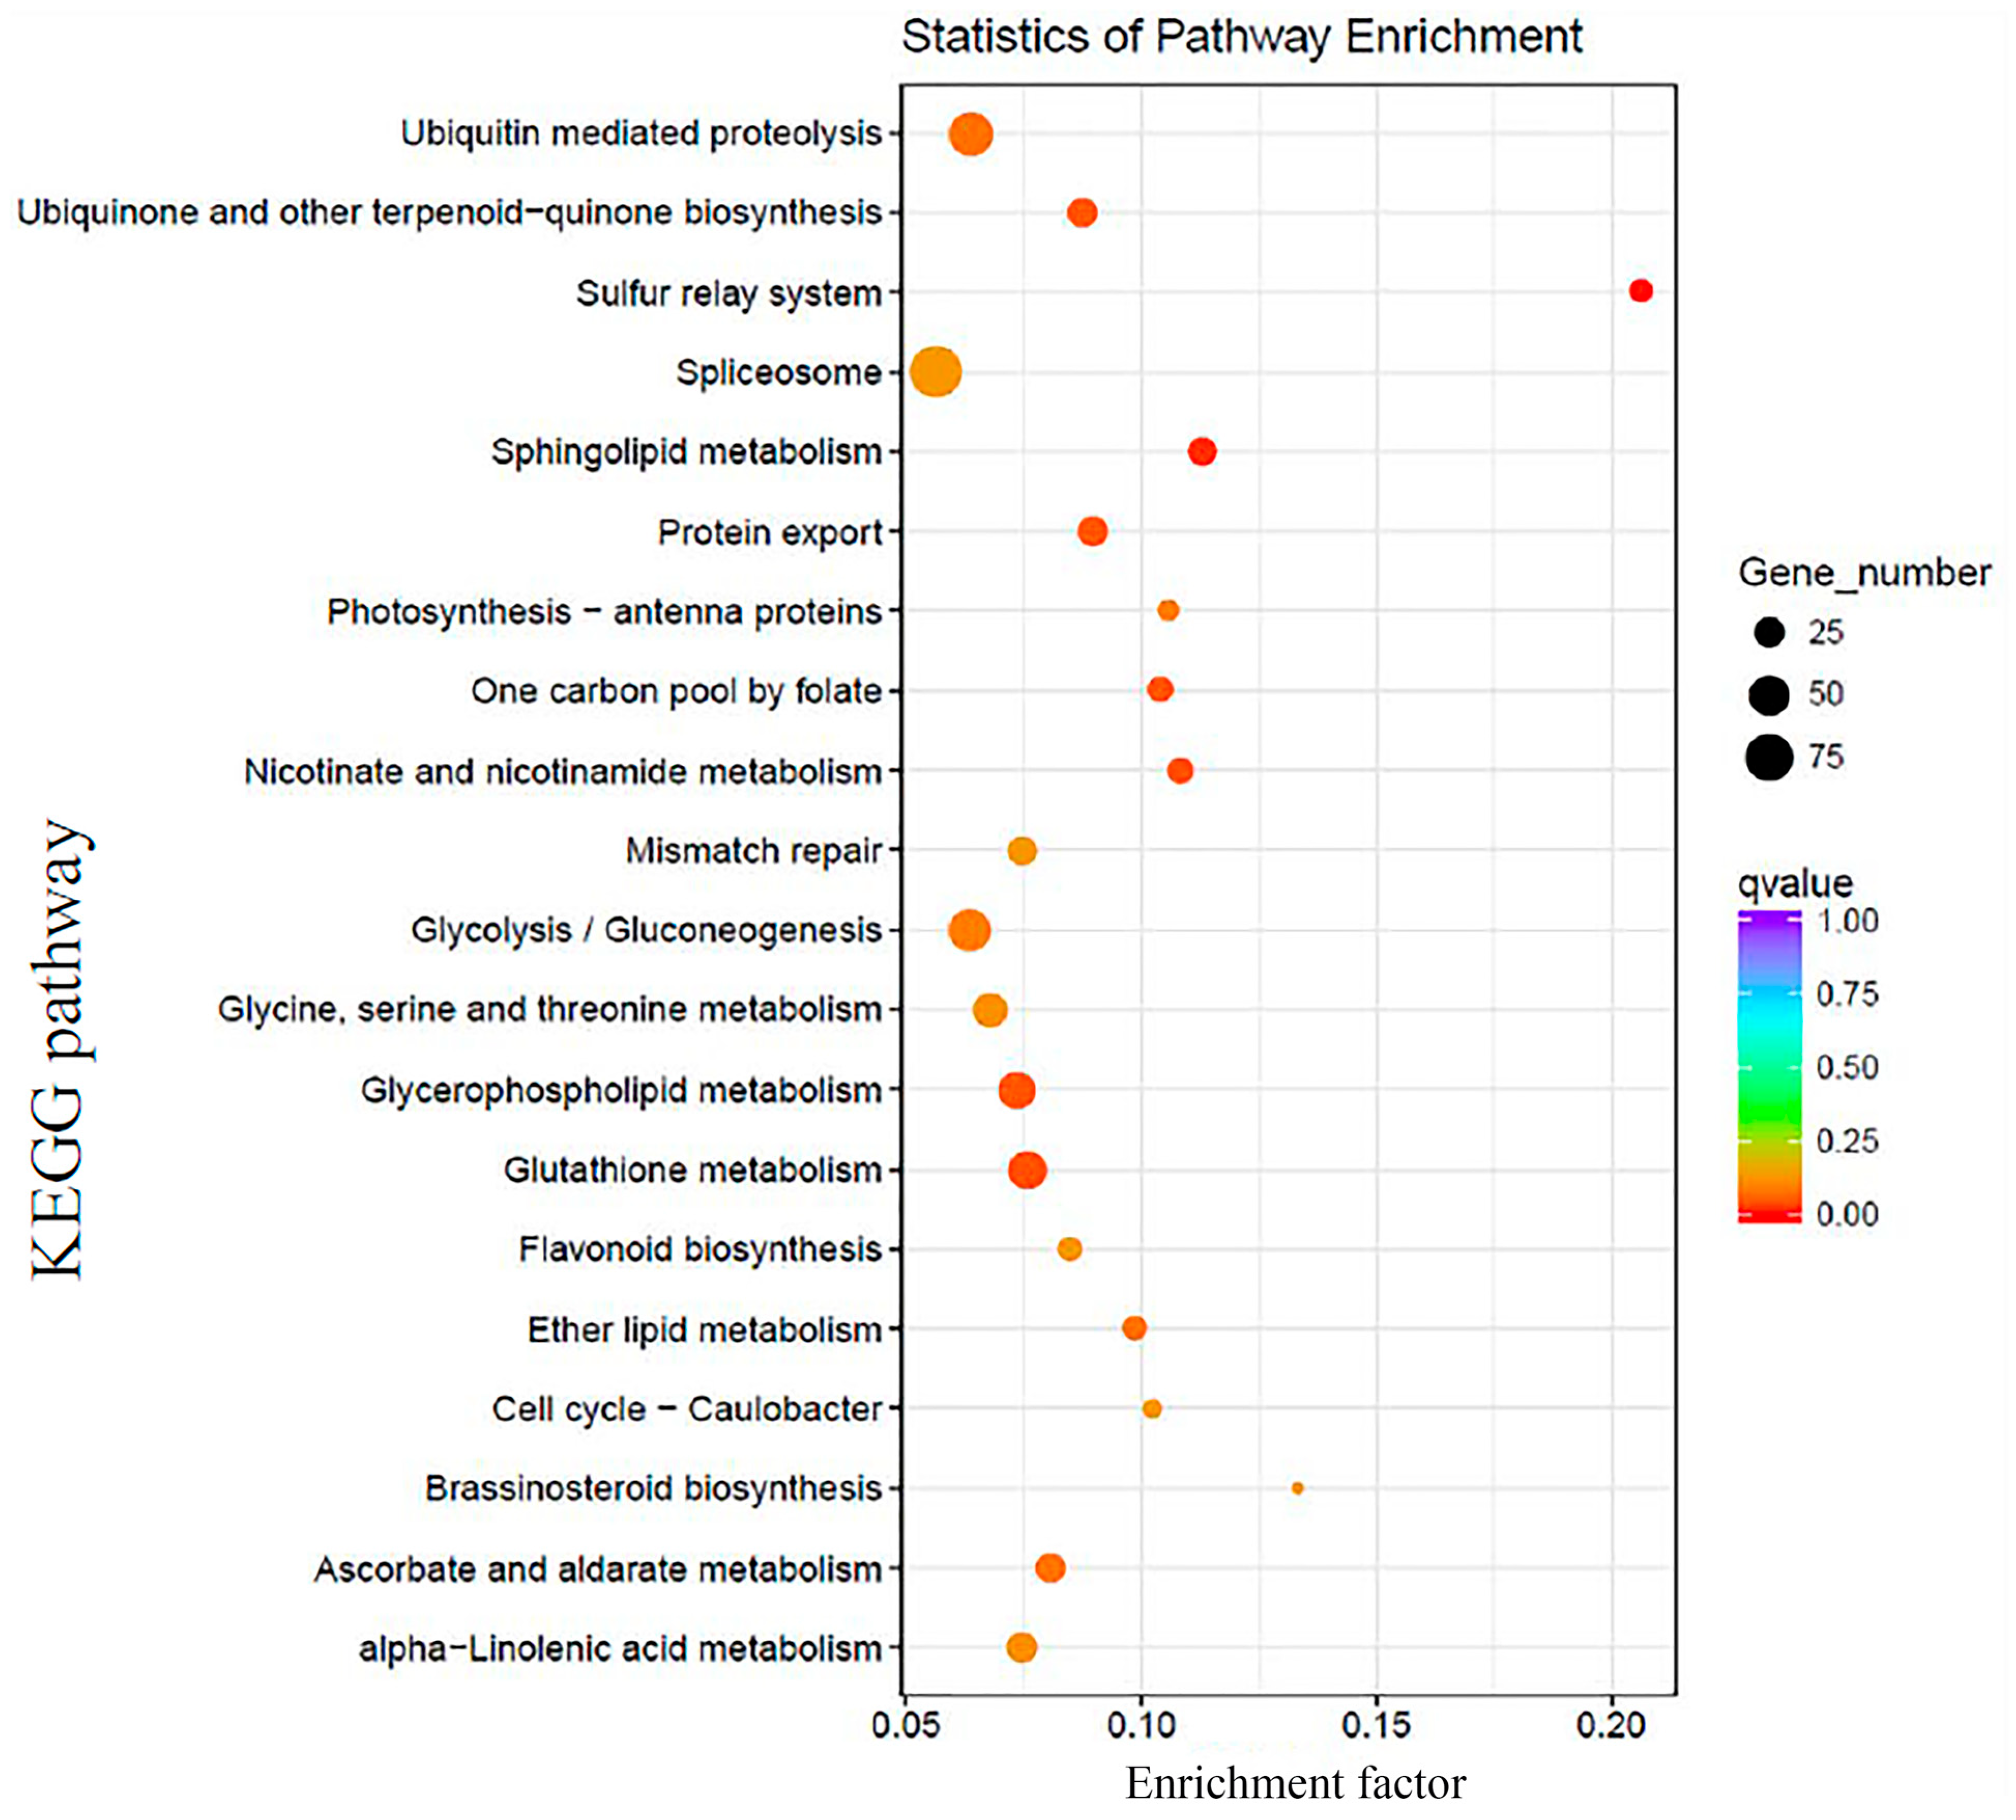
2.11. Analysis of Target Genes of miRNAs

To investigate the miRNA-mediated pathways during different stages of SE, we analyzed 17,253 unigenes with annotations from transcriptome databases and used the psRNATarget website to predict target genes. We identified 5785 potential target genes potentially related to 408 miRNAs (Table S11). More than 92.89% of miRNAs had multiple target unigenes, and only 29 miRNAs (7.11%) had a single unigene or no unigene from all miRNA–target gene pairs. Among the miRNA–target gene pairs, most 43.14% (176) were detected during embryonic induction (Table S10); 29.16% (119) were detected in the embryonic stage and 27.7% (113) in the maturation stage. These results suggest that the embryonic induction stage was the most active period. The prediction of miRNA–target pairs suggests that miRNAs can mediate multiple pathways during the various phases of SE in M. sativa. Most target genes exhibited significant differences in expression, revealing a complex biological regulation process in SE. These target genes included hormone-related genes, such as ARF, LBD, and ARR2, TFs and certain kinases. KEGG analysis showed the involvement of these target genes in plant hormone signal transduction pathways. As ARF is involved in tryptophan metabolism, it may function to promote cell growth in SE. This study showed the involvement of four members of the ARF family in M. sativa SE (Table S11). ARF17, ARF18 and ARF10 were targeted by miR160, whereas ARF8 was targeted by miR156, miR167 and novel_272 in embryonic induction (Table S11). LBD11 was targeted by miR7696 in embryonic. miR2604 targeted ARR2, which is involved in the zeatin biosynthesis pathway that promote cell division in SE. In addition, we detected several TFs related to embryonic development, such as SHORT-ROOT (SHR) and Polyol transporter 5 (PLT5). SHR was targeted by miR156 in embryonic induction, and PLT5 was targeted by novel_299 in embryonic. Several kinase genes were targeted in SE; SERK5, mitogen-activated protein kinase 8 (Mapk8) and cyclin-dependent kinase C-1 (CDKC-1) were targeted by miR5561, miR5559 and miR7701, respectively.
To further investigate the function of miRNAs in SE, 5785 target genes were selected for GO analysis. We identified 1350 GO terms involved in embryonic induction, 416 in maturation and 266 in embryonic (Table S12). The biological (GO: 0008150), metabolic (GO: 0008152), cellular (GO: 0009987), organic substance metabolic (GO: 0071704) and primary metabolic (GO: 0044238) processes were the main biological process categories enriched among the target genes. Among the cellular categories, cellular component (GO: 0005575), cell (GO: 0005623) and cell part (GO: 0044464) accounted for the highest proportion of target genes. Molecular function (GO: 0003674), binding (GO: 0005488) and catalytic activity (GO: 0003824) were the enriched molecular function categories among the target genes. As shown in Table S12, several miRNAs with target genes were involved in biological processes related to SE in M. sativa. For example, novel_249 play a role in post-embryonic development, plant epidermal development, and regulation of multicellular organismal development; novel_211 regulate cell growth and cell differentiation in SE; and miR2673 play an important role in cell development, cell–cell signaling, and cell activation. Interestingly, 22 miRNA families with 44 target genes were involved in cellular developmental processes, representing the most active biological processes in SE. In addition, several miRNAs were involved in programmed cell death, such as miR5207, miR2630 and miR319.
A total of 5785 target genes showed KEGG enrichment using the KOBAS, revealing the involvement of 112 pathways and 1953 target genes in SE (Table S13). The spliceosome pathway showed the highest enrichment (91 target genes), followed by protein processing in the endoplasmic reticulum (62) and ubiquitin-mediated proteolysis (61) (Figure 9). Moreover, several other pathways may play key roles in M. sativa SE, such as plant hormone signal transduction, amino sugar and nucleotide sugar metabolism, and RNA degradation (Table S13).

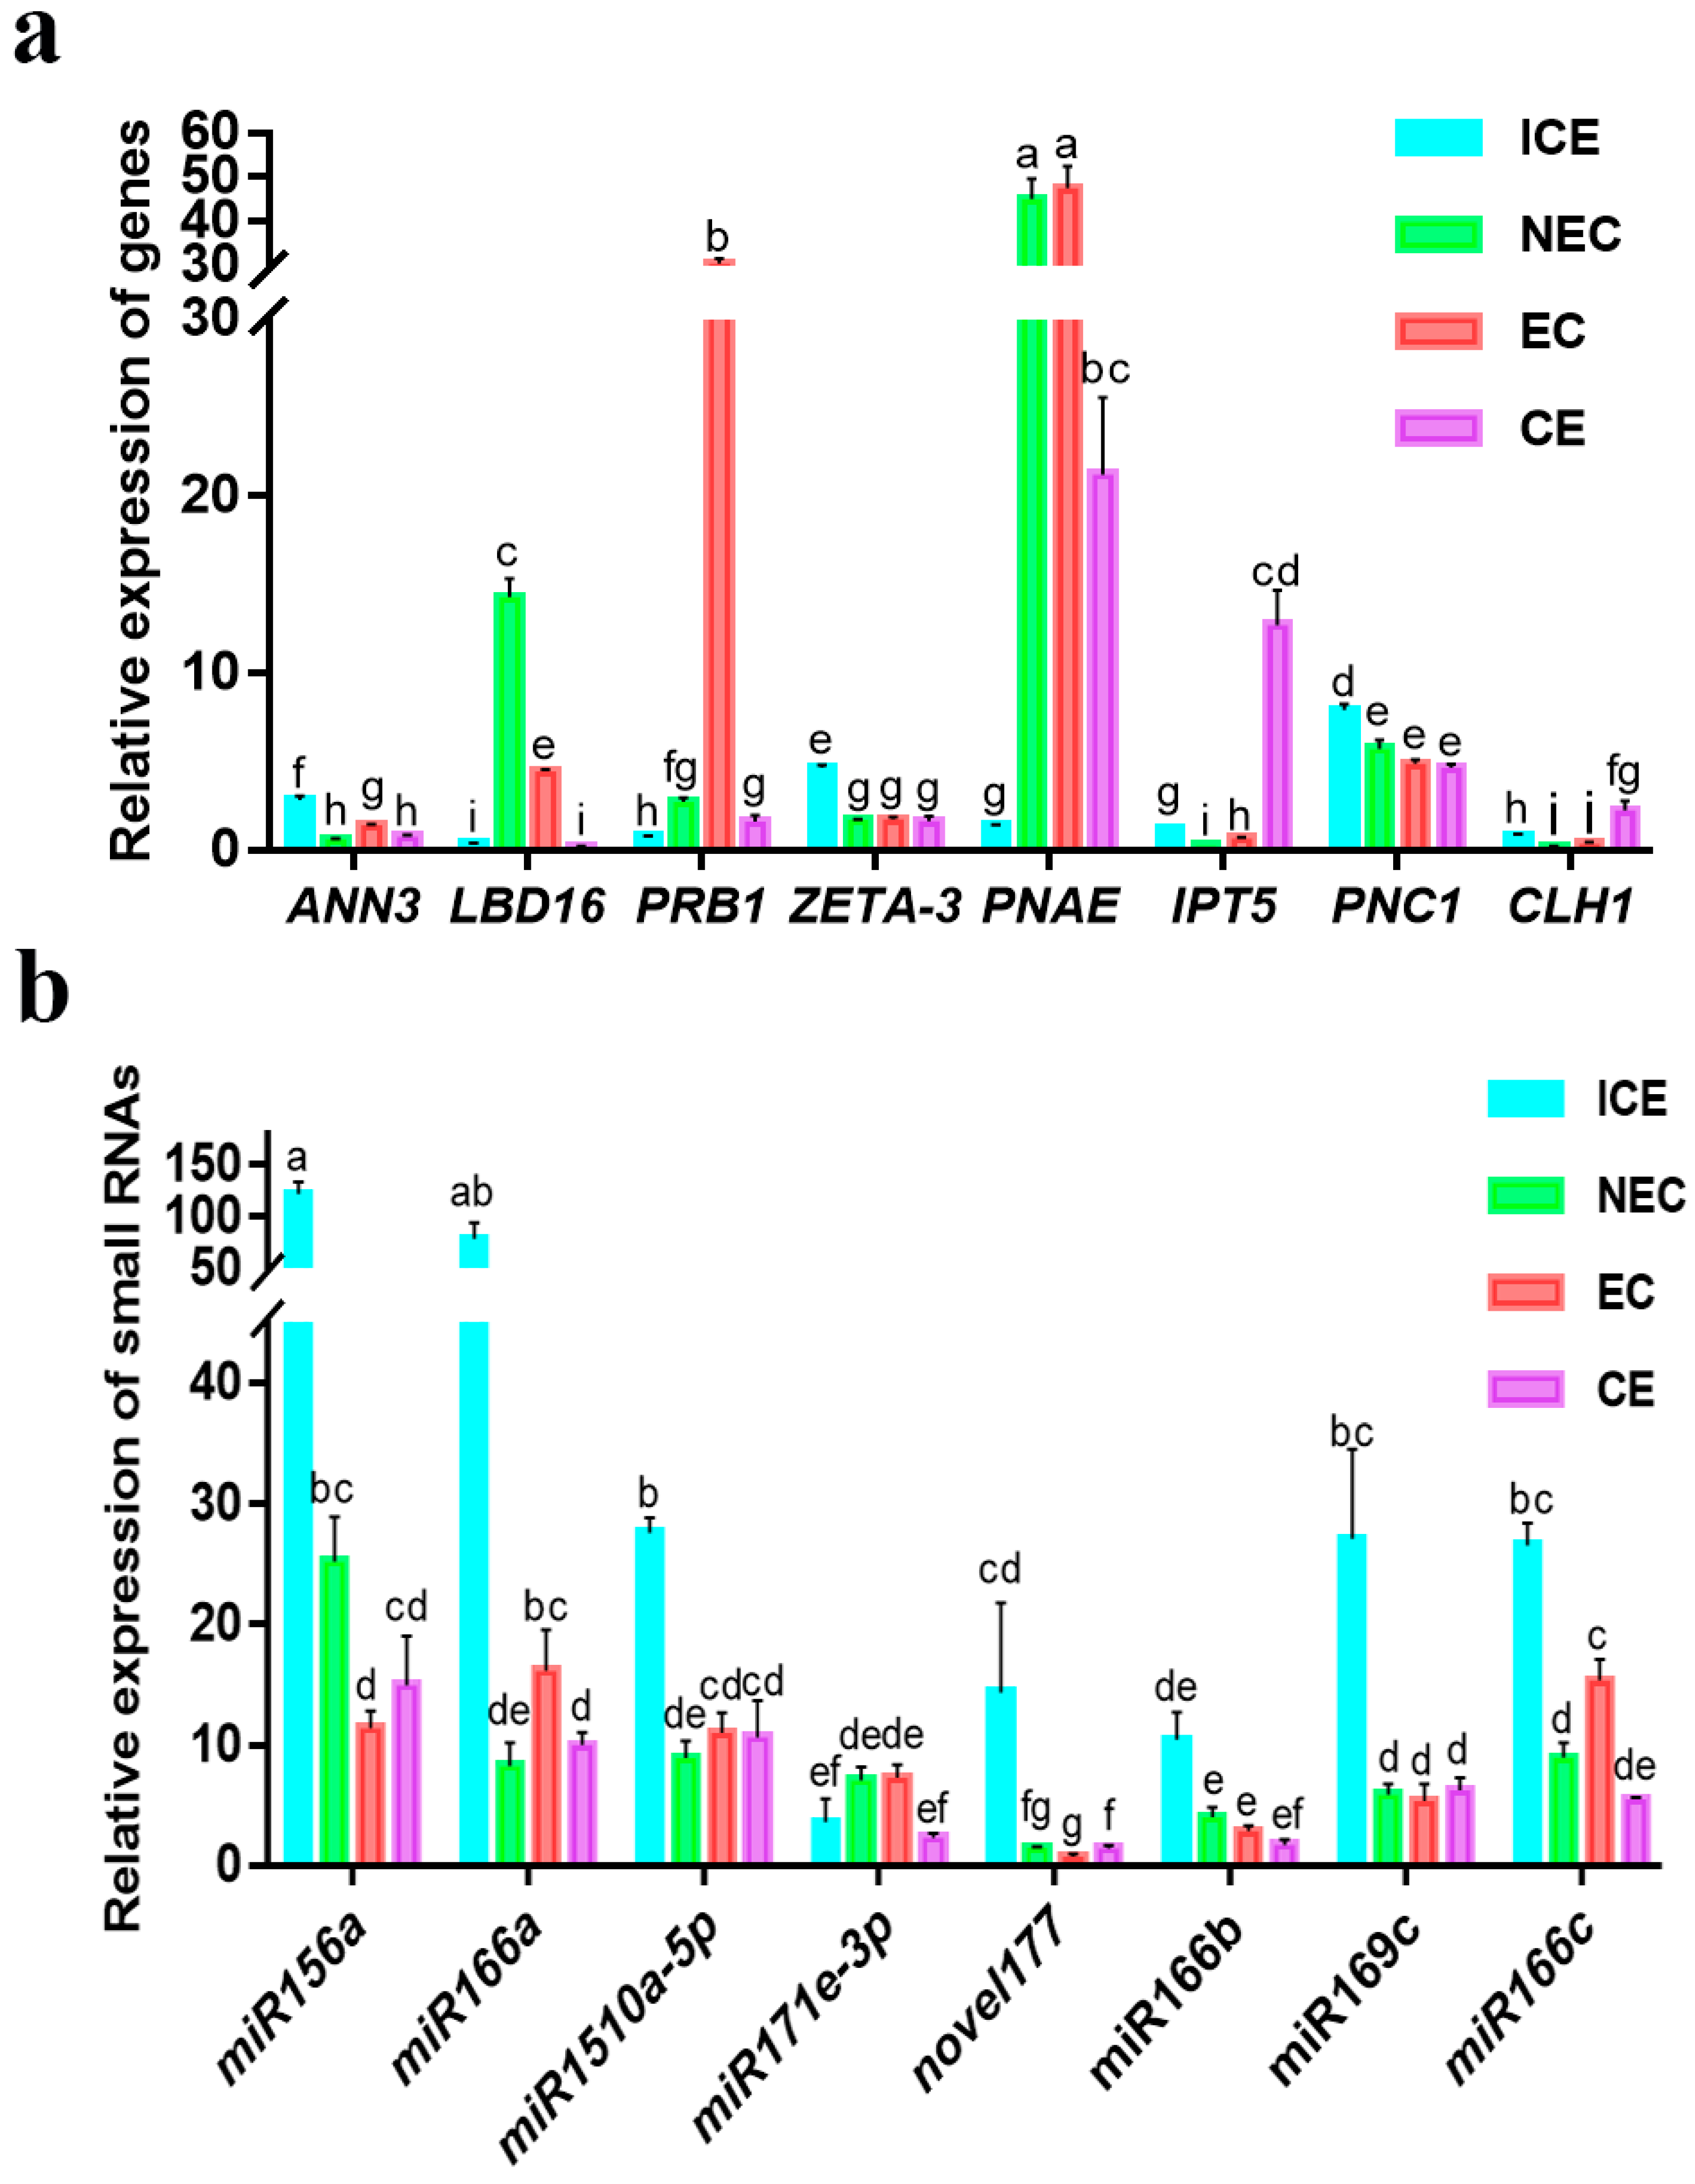
2.12. Validation of Various Expression Patterns of DEGs and miRNAs

To validate the expression patterns of genes and miRNAs during ICE, NEC, EC and CE, we determined the expression levels of several genes and miRNAs by qRT-PCR and transcriptome analysis. qRT-PCR analysis revealed that PNC1 expression was downregulated in SE (Figure 10a); likewise, transcriptome analysis showed that Cationic peroxidase 1 (PNC1) was downregulated more than 4-fold throughout SE. Our results showed that PNC1 was targeted by novel_244, and novel_244 was downregulated slightly from ICE to NEC. The IPT5 expression level did not differ significantly from ICE to EC. However, IPT5 gene expression was significantly upregulated from EC to CE (Figure 10a). Similarly, the transcriptome results showed that IPT5 was upregulated more than 5-fold from EC to CE. However, no obvious changes in IPT5 levels were observed in the other stages. miR156 families play crucial roles during SE. From ICE to NEC, the miR156a expression level was downregulated more than 3-fold (Figure 10b), as revealed by small RNA-seq data. SPL6 was targeted by miR156a, which was upregulated from ICE to NEC. No obvious changes in miR156a levels were observed in the other stages. miR166a expression was downregulated from ICE to NEC and EC to CE and upregulated from NEC to EC. Small RNA-seq and qRT-PCR analysis of miR156a showed consistent results. 2-succinylbenzoate--CoA ligase (AAE) was targeted by miR166a. AAE was upregulated from ICE to NEC but showed no obvious changes in the other stages.

3. Discussion

SE, a complex developmental process involved in completing plant regeneration of somatic cells, was first described in the carrot [29,30]. Previous studies identified single or multiple genes involved in SE using mRNA differential display [31]. However, the more recent technology of RNA-seq has clear advantages, as it can be used to generate millions of clear reads for transcriptome and miRNA analyses. Xu et al. suggested that these analyses can be used to generate a comprehensive view of several gene and miRNA families involved in SE in plants [32]. However, no such studies of DEGs or miRNAs in SE in M. sativa have been reported. This study investigated DEGs and miRNA roles during somatic embryonic induction, embryonic and maturation in M. sativa SE. Four libraries from four SE stages (ICE, NEC, EC and CE) were constructed, and pairwise comparisons of the data resulted in annotation of 101,969 unigenes and 418 miRNAs and prediction of several target genes of miRNAs. Finally, we proposed a potential miRNA–target interaction network involved in M. sativa SE.

3.1. The Early Phase of SE Is an Active Process of Molecular Regulation

Although numerous studies have examined the mechanism of SE in the past decade [4,33], the molecular mechanisms underlying somatic embryonic induction, embryonic and maturation in M. sativa is unclear. The embryonic induction can be used to study early embryonic development. In the embryonic induction phase, which occurs early in SE, 9206 genes were upregulated and 5522 genes downregulated, with greater numbers of DEGs detected than during the other phases of SE. We identified several genes that play a regulatory role in early somatic embryonic development, including polycomb repressive complex (PRC1), WUS, SERK1 and heat shock protein17 (HSP17) (Table S4). PRC1 and PRC2 modify chromatin to repress the expression of genes not required for a specific differentiated state [34]. WUS is a marker of embryonic cells [26], and several studies have shown that WUS is important in totipotent embryogenic stem cells [14,26]. SERK1 encodes a leucine repeat receptor protein kinase, which promotes early embryogenesis [35]. HSP17 shows transient accumulation during embryonic maturation and germination in the oak and increases in level during dedifferentiation in SE [36]. In addition, we identified several new genes that were upregulated 10-fold from the embryonic induction phase, including Phosphoglycolate phosphatase 1B (PGLP1B), Benzyl alcohol O-benzoyltransferase (HSR201) and Probable glucuronoxylan glucuronosyltransferase (IRX7) (Table S4). Therefore, we infer that the early phase of SE in M. sativa involves an active process of molecular regulation.

3.2. Identification of Hormonal Signal Transduction during SE in M. sativa

Plant hormones and PGRs play critical roles during SE. Plant hormones specify the endogenous compounds produced by diverse cells, and PGRs complement synthetic compounds added exogenously [37]. Among all phytohormones, auxin plays important roles in regulating plant development, while IAA has been recognized as the most important auxin [38]. Auxin biosynthesis is regulated by Aux/IAA, TIR1, ARF, CH3 and SAUR [39,40,41,42,43]. Our study suggests that the key genes Aux/IAA, ARF, CH3 and SAUR are involved in auxin biosynthesis. The expression of Aux/IAA and CH3 were significantly upregulated in the embryonic induction and maturation stages. Auxin/IAA (Aux/IAA) proteins are transcriptional regulators of plant responses to auxin during fruit development and leaf morphogenesis. IAA9 belongs to the Aux/IAA gene family and is downregulated in Arabidopsis mutants [44].
Cytokinins play important roles in promoting cell division [6]. Cytokinin biosynthesis is regulated by CRE1, histidine phosphotransfer proteins (AHPs), A-ARRs and B-ARRs [45,46,47,48]. AHPs, A-ARRs and B-ARRs are involved in embryonic induction. A-ARRs are also involved in embryogenic. The genes encoding AHP, A-ARR and B-ARR exhibited significant downregulation during embryonic induction, whereas A-ARR showed upregulation during the embryogenic formation stage. AHP is a phosphorelay carrier between cytokinin receptors and nuclear cytokinin responses. AHP mutants function study exhibited that AHP were positive factors in cytokinin signaling [49,50]. B-ARRs are mediators of cytokinin signaling, while A-ARRs are negative regulators of cytokinin signaling that function via feedback mechanisms to the primary cytokinin signal response [48,51].
GA regulates cell elongation during seedling development [52]. Several TFs are involved in GA biosynthesis during SE in M. sativa, including PHYTOCHROME INTERACTING FACTOR (PIF4), NONEXPRESSOR OF PRGENES1 (NPR1), ABRE-BINDING FACTORS (ABF), SALT-RESPONSIVE ERF1 (ERF1), bHLH transcription factors (MYC2) and Thermal Gravimetric Analysis (TGA). NPR1, ABF and ERF1 showed significant upregulation in embryonic induction. In addition, ABF showed positive upregulation in maturation. ABF is a key factor involved in the transition of embryogenesis to seed germination, playing an intermediate role in the cross-talk between ABA and GA signaling [53]. NPR1 regulates the cross-talk between salicylic acid and jasmonic acid signaling pathways [54]. As a role of NPR1 in GA synthesis has not been reported, further studies are required. ERF1 is involved in not only the ET signaling pathway but also the ABA and GA biosynthetic pathways [55].
ABA supplementation promotes SE during maturation in Podocarpus lambertii [56]. Our study showed that ABA biosynthesis plays important roles in SE in M. sativa; the key molecules regulating ABA biosynthesis during embryonic induction and maturation include PYRABACTIN RESISTANCE 1 (PYR/PYL), 2C protein phosphatase (PP2C), subfamily 2 Snfl-related kinases (SnRK2) and ABF. PYR/PYL, encoding ABA receptors involved in ABA signal transduction [57], showed involvement throughout SE and exhibited significant upregulation. A key component of ABA biosynthesis is PP2C, which interacts with ABA receptors and SnRK2s [58]. In addition, biosyntheses of ET, brassinosteroid, jasmonic acid and salicylic acid are involved in SE in M. sativa, consistent with previous reports. Our transcriptome analysis revealed differential expression patterns of genes involved in hormonal signal transduction in SE in M. sativa. All hormonal signal transduction pathways are shown in Figure S3.

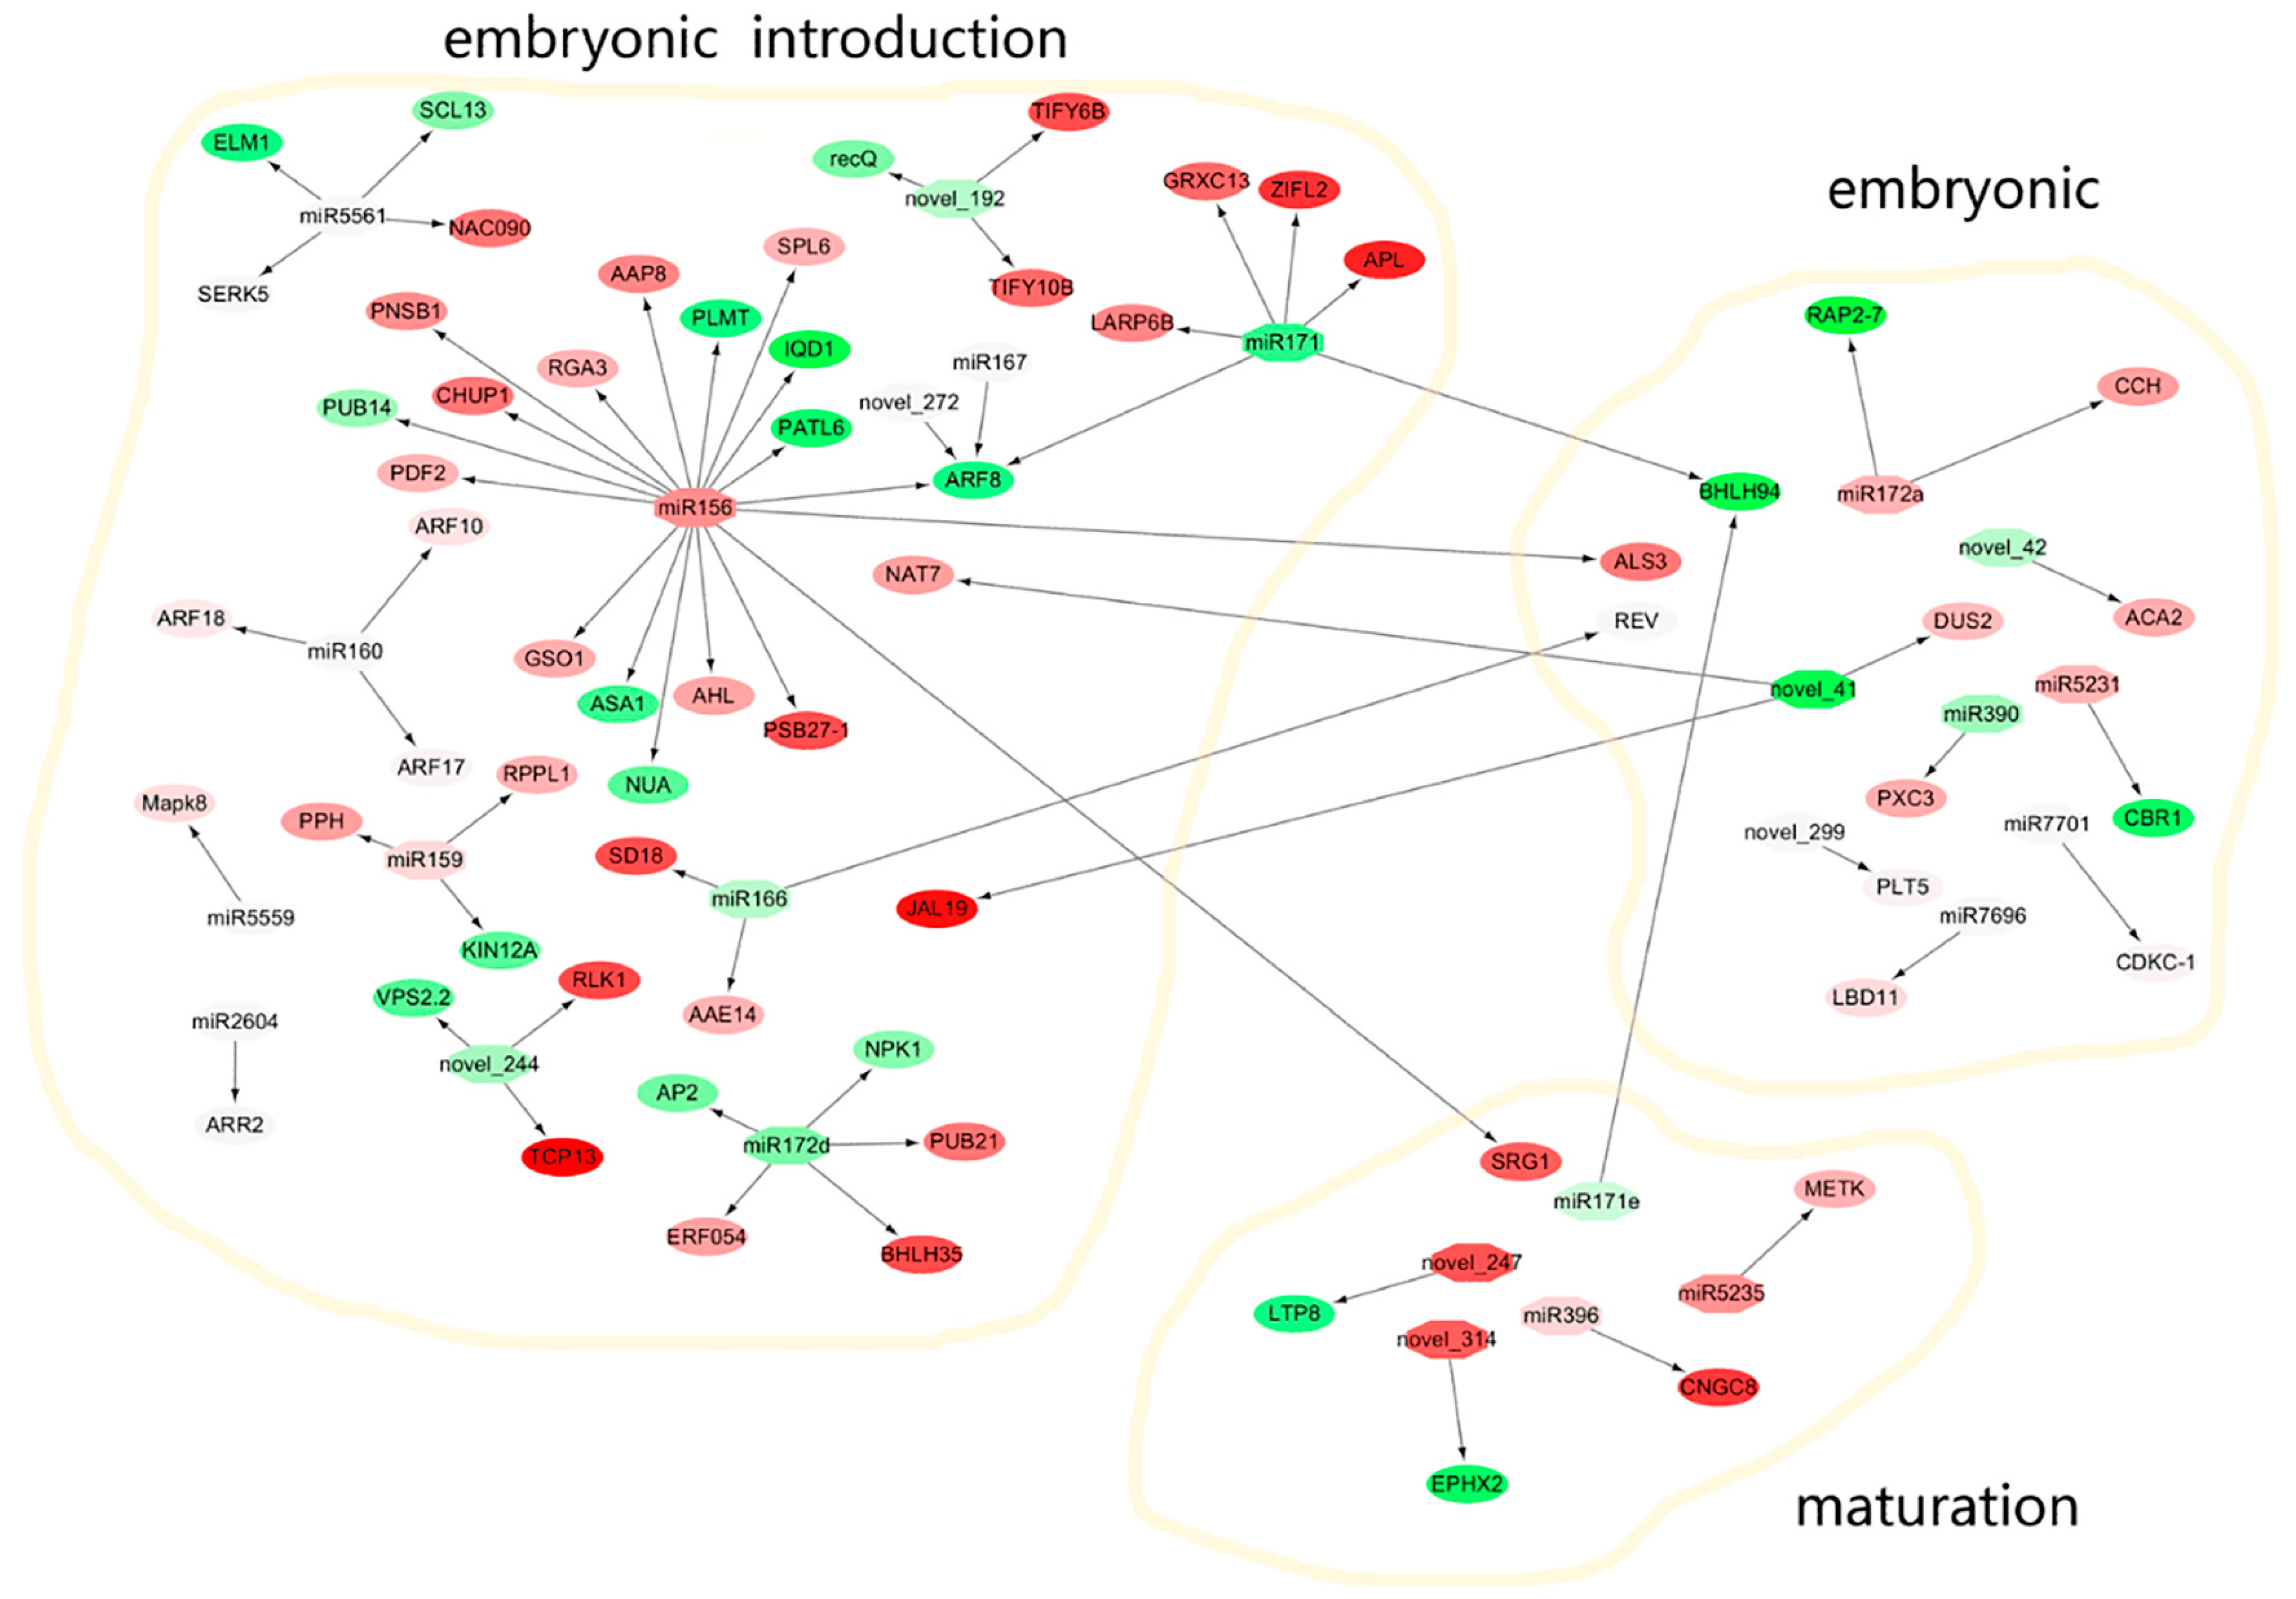
3.3. miRNA and Target Genes Form a Potential Molecular Regulatory Network in SE in M. sativa

The T0 generation cut cotyledon functions as an explant to induce somatic cell, and the addition of plant growth regulators to the medium promotes the formation of embryonic cells. M. sativa SE was divided into the embryonic induction, embryonic and maturation phases. Four types of calli (ICE, NEC, EC and CE) were selected to construct four transcriptome and small RNA libraries. The DEGs and differentially expressed miRNAs among four types of calli were identified. The expression levels of eight DEGs and eight miRNAs were detected by qRT-PCR. The target genes of the miRNAs were predicted and their functions annotated. The DEGs involved in the pathways of SE in M. sativa were predicted using KEGG analysis (Table S3). The miRNAs and target genes in the differentially expressed RNA libraries were compared. Previous reports suggested the existence of a potential molecular regulatory network, and the present study identified several novel genes and miRNAs involved in M. sativa SE (Figure 11).
The miR172 family is involved in a variety of processes including flowering time and floral organ identity [12], developmental timing [59], promotion of vegetative phase changes [60], soybean nodulation [61] and regulation of stem cells [62]. In addition, miR172 regulates AP2 to control embryogenic and non-embryogenic callus development [63]. The miR172 target genes include TOE1, TOE2, SMZ, SNZ and SPL10 [59,64]. In our study, AP2, NPK1, PUB21, ERF054 and BHLH35 genes were found to be targeted by miR172d in embryonic induction, which might promote embryonic callus formation.
The miR156 family is involved in multiple plant developmental processes via targeting of SPL genes, including regulation of flowering [65], plastochrone length and organ size [66] and anthocyanin biosynthesis [20]. miR156 also regulates shoot development by targeting the SPL3 gene [67]. In addition, miR156 plays roles in SE. The SPL10 and SPL11 genes were repressed by miR156, which affects the precocious accumulation of maturation-phase transcripts, in Arabidopsis eight-cell embryos [20]. miR156 is also involved in early SE in the yellow poplar [18] and the regulation of CE formation [27,47]. Our results showed significantly upregulated miR156 expression in embryonic induction (Figure 8a) and identified SPL6, AHL, ALS3, ARF8 and SRG1 as target genes of miR156. However, aside from SPL6, the functions of the other target genes remain unclear.
miR159 regulates LaMYB33 in the embryogenic formation and maturation stages of larix kaempferi SE [18]. In Arabidopsis, miR159 regulates GAMYB-like genes to promote programmed cell death [47]. In the present study, miR159 targeted Pheophytinase (PPH) in embryonic induction in M. sativa, suggesting that miR159 plays important roles in early SE.
In Arabidopsis, miR166 targeted HD-ZIP III TFs to regulate shoot apical meristem development during embryogenesis [68,69]. Moreover, miR166 regulated floral [70] and root development [71]. In M. sativa SE, miR166 targeted AAE14 and REV in embryonic induction and maturation. In this study, miR166 was downregulated in embryonic induction; however, AAE14 was upregulated. Therefore, the miR166–AAE14 interaction may promote the transition from embryonic induction to embryonic formation. miR171 maintained embryogenic potential in Larix kaempferi Carr SE via regulation of its target gene SCL6 [70]. In addition, miR171 targeted SCL6/22/27 to negatively regulate chlorophyll biosynthesis in Arabidopsis [72], and miR171 targeting of GRAS regulated GA and auxin homeostasis in the tomato [73]. In our study, ARF8 was identified as a target gene of miR171 during embryonic induction. However, our results revealed that miR171 was upregulated, whereas ARF8 was downregulated. ARF8 is involved in auxin biosynthesis, which plays a crucial role in SE.
In addition, miR5561, miR390, miR5231, miR5559, novel_41 and novel_247 were differentially expressed during various stages of M. sativa SE (Table S10, Figure 11). According to predictions, miR5561 targeted SERK5, Mitochondrial fission protein (ELM1) and NAC domain-containing protein 90 (NAC090) in embryonic introduction (Figure 11). miR390 was found to target ARF to regulate lateral root growth [74]. In our study, miR390 targeted Leucine-rich repeat receptor-like tyrosine-protein kinase (PXC3) in embryonic. Although we identified several novel miRNAs and target genes, further studies are needed to define their functions.

4. Materials and Methods

4.1. Plant Materials

SE consists of three major phases in M. sativa: embryonic induction (ICE to NEC), embryonic formation (NEC to EC) and maturation (EC to CE). EC was induced in MS medium supplemented with 0.2 mg/L 6-benzylaminopurine and 4 mg/L 2,4-D. Then, the embryos were collected at 0, 10 and 40 d, representing the ICE, NEC and EC stages, respectively. CEs were obtained in MS medium containing 1 mg/L kinetin and 0.5 mg/L 6-benzylaminopurine and collected at 69 d. Calli were induced from cotyledons as explants. All samples included three biological replicates.

4.2. Morphological Analysis

We compared tissue morphology at different periods of SE using a light microscope. An explant showing significant changes was selected for further study. The organization of different morphological features was observed using a stereomicroscope (MZ FLIII; Leica, Wetzlar, Germany). The sample explants at different phases (0, 3, 6, 12, 24, 48 and 72 h, and 5, 7, 10, 15, 25, 40 and 69 d) were fixed in glutaraldehyde. Samples were stained with safranin for 1–2 h and rinsed with water. Then, a 50%, 70% and 80% alcohol gradient was applied for 1 min to decolorize the samples. Paraffin sections of the samples were made for observation under a light microscope (ECLIPSE Ci-L, NIKON, Tokyo, Japan).

4.3. RNA Extraction

Total RNA was extracted from the explants during the ICE, NEC, EC and CE phases using TRIzol reagent (Invitrogen, Burlington, ON, Canada) according to the manufacturer’s protocol. RNA quality was visualized on a 1% agarose gel. RNA purity was measured using a NanoPhotometer spectrophotometer (IMPLEN, Westlake Village, CA, USA). RNA concentrations were measured using the Qubit RNA Assay Kit in a Qubit 2.0 Fluorometer (Life Technologies, Carlsbad, CA, USA). RNA integrity was assessed using the Bioanalyzer 2100 system (Agilent Technologies, Santa Clara, CA, USA).

4.4. Sample Preparation for Sequencing and Data Quality Control

RNA (6 μg per sample) was used as input material for the RNA sample preparations. All four samples had RNA integrity number (RIN) values above 8.0. Transcriptome and small RNA libraries of ICE, NEC, EC and CE were constructed and sequenced using the Illumina system [75,76]. Raw data (raw reads) in fastq format were processed using in-house Perl scripts. In this step, we obtained the clean data (clean reads), and removed reads containing the adapter, reads containing poly-N, and low-quality reads from the raw data. Simultaneously, Q20, Q30, GC content, and the sequence duplication level of the clean data were calculated. All the subsequent analyses were based on clean data.

4.5. Annotation of DEGs and miRNAs

To obtain DEGs from ICE to NEC, NEC to EC and EC to CE, the fold change (FC) in expression was assessed by taking the log2 ratio of Reads Per Kilobase per Million mapped reads (RPKM). Differential expression analysis of two conditions was performed using the DEGSeq R package (1.12.0; TNLIST, Beijing, China). The adjustment of p-values was performed using the Liszkay method [77]. The corrected p-value of 0.005 and log2 of ±1 were set as the threshold for significant differential gene expression. DEGs were annotated using Blast2GO v2.5 (BioBam, Valencia, Spain). The genes and miRNA expression patterns of each phase (ICE, NEC, EC and CE) were clustered according to their log2 value using corset v1.05 software (Melbourne, Australia), and the database used for comparison was union_for_cluster. Heat-maps of cluster data were constructed using Java Tree View (Stanford, CA, USA) [78]. miRNAs were annotated using the Rfam database, and novel miRNAs were predicted using miREvo and miRdeep2 software. miRNA target genes were predicted using the psRNATarget server. The miRNA–target interaction network was drawn using cityscape (San Diego, CA, USA).

4.6. Functional Annotation of DEGs and miRNAs

GO analysis was performed using GOseq [79]. and the GO database (http://www.geneontology.org/, accessed on 5 June 2022). The KOG/COG database can be found at (http://www.ncbi.nlm.nih.gov/COG/, accessed on 5 June 2022), and diamond v0.8.22 was used as the analysis software for the KOG database. KEGG classification was constructed based on the KEGG database (http://www.genome.jp/kegg/, accessed on 5 June 2022). The KOBAS (Beijing, China) was used for the KEGG analysis.

4.7. Indirect Competitive Enzyme-Linked Immunoassay (icELISA) for Detection of Indole-3-Acetic Acid (IAA), Gibberellin (GA3), Zeatin Riboside (ZR) and Abscisic Acid (ABA)

The icELISA protocol was previously described [80]. Reagents purchased from Sigma-Aldrich (St. Louis, MO, USA) included IAA, GA3, ZR, ABA, goat anti-mouse IgG conjugated to horseradish peroxidase (IgG-HRP), o-phenylenediamine, potassium periodate and citric acid monohydrate (C6H8O7·H2O). SE was divided into four phases (ICE, NEC, EC and CE), and each group of M. sativa explants (8.0 g) was prepared for detection using icELISA. IAA, GA3, ZR and ABA were extracted as previously reported [81]. Detected samples were used for icELISA analysis.

4.8. Quantitative RT-PCR

Multiple genes and miRNAs were sorted for validation using reverse transcriptase-polymerase chain reaction (RT-PCR) (Bio-Rad C1000, Hercules, CA, USA). The genes and miRNA primers (Table S14) were designed using primer premier 5.0. The 18S RNA was used as an internal control for gene validation [82]. The small nuclear RNA (snRNA) U6 was used as an internal control for miRNA validation [83]. Quantitative RT-PCR (qRT-PCR) was performed as described by Liu et al. [84].

4.9. Statistical Analyses

Differences in the means for hormone detection were assessed by one-way Student’s t-test at the 0.05 significance level. Differences in the means for gene expression data were assessed by one-way ANOVA at the 0.05 significance level.

5. Conclusions

Analyses of small RNAs and transcriptomes involved in the somatic embryonic induction, embryonic and maturation phases of SE provided information regarding the molecular mechanisms specific to M. sativa. Morphological observations revealed significant changes in tissues in SE, particularly during the stages of ICE, NEC, EC and CE. Several novel DEGs were identified in M. sativa SE, including LBD, AGO and AGL, which play important roles in promoting embryonic formation. Our analysis suggested that many DEGs playing roles in plant hormone signal transduction are involved in regulatory processes, e.g., IAA and ARF regulation of auxin biosynthesis, LEC2 regulation of GA biosynthesis, and MYB4 and MYB48 regulation of ABA biosynthesis. In addition, hormonal signal transduction is regulated by the interactions of target genes with various miRNAs such as miR156, miR160 and miR167. This study predicted 110 novel miRNA families involved in embryonic induction, embryonic and maturation. Further studies are needed to determine whether these novel miRNAs play additional roles in M. sativa. Finally, we analyzed several miRNAs exhibiting significantly different expression patterns in SE and predicted their target genes. A potential miRNA–target gene interaction network is presented in Figure 11, which outlines the molecular mechanisms of SE in M. sativa.

Supplementary Materials

The following supporting information can be downloaded at: https://www.mdpi.com/article/10.3390/ijms23158633/s1.

Author Contributions

J.Y., Y.C. and L.H. wrote the main manuscript text. L.H. prepared Figure 1, Figure 2, Figure 3, Figure 4, Figure 5, Figure 6, Figure 7, Figure 8, Figure 9, Figure 10 and Figure 11 and Tables S1–S14. All authors have read and agreed to the published version of the manuscript.

Funding

This work is supported by the Fundamental Research Funds for the Central Universities (Grant No. 2021ZY84).

Institutional Review Board Statement

Not applicable.

Informed Consent Statement

Not applicable.

Data Availability Statement

The raw assembled data has been uploaded The National Center for Biotechnology Information (NCBI). The accession number is PRJNA474427. The URL is https://www.ncbi.nlm.nih.gov/bioproject/474427, accessed on 5 June 2022.

Conflicts of Interest

The authors declare no conflict of interest.

References

  1. Zimmerman, J.L. Somatic embryogenesis: A model for early development in higher plants. Plant Cell 1993, 5, 1411. [Google Scholar] [CrossRef] [PubMed] [Green Version]
  2. Wu, X.M.; Kou, S.J.; Liu, Y.L.; Fang, Y.N.; Xu, Q.; Guo, W.W. Genomewide analysis of small RNAs in nonembryogenic and embryogenic tissues of citrus: MicroRNA- and siRNA-mediated transcript cleavage involved in somatic embryogenesis. Plant Biotechnol. J. 2015, 13, 383–394. [Google Scholar] [CrossRef]
  3. Altamura, M.M.; Della Rovere, F.; Fattorini, L.; D’Angeli, S.; Falasca, G. Recent Advances on Genetic and Physiological Bases of In Vitro Somatic Embryo Formation. Methods Mol. Biol. 2016, 1359, 47–85. [Google Scholar] [PubMed]
  4. Feher, A.; Pasternak, T.P.; Dudits, D. Transition of somatic plant cells to an embryogenic state. Plant Cell Tissue Organ Cult. 2003, 74, 201–228. [Google Scholar] [CrossRef]
  5. Zhao, X.Y.; Su, Y.H.; Cheng, Z.J.; Zhang, X.S. Cell fate switch during in vitro plant organogenesis. J. Integr Plant Biol. 2008, 50, 816–824. [Google Scholar] [CrossRef]
  6. Mantiri, F.R.; Kurdyukov, S.; Lohar, D.P.; Sharopova, N.; Saeed, N.A.; Wang, X.D.; Vandenbosch, K.A.; Rose, R.J. The transcription factor MtSERF1 of the ERF subfamily identified by transcriptional profiling is required for somatic embryogenesis induced by auxin plus cytokinin in Medicago truncatula. Plant Physiol. 2008, 146, 1622–1636. [Google Scholar] [CrossRef] [PubMed] [Green Version]
  7. Zhao, Z.; Andersen, S.U.; Ljung, K.; Dolezal, K.; Miotk, A.; Schultheiss, S.J.; Lohmann, J.U. Hormonal control of the shoot stem-cell niche. Nature 2010, 465, 1089–1092. [Google Scholar] [CrossRef] [PubMed]
  8. Arnholdt-Schmitt, B. Physiological aspects of genome variability in tissue culture. II. Growth phase-dependent quantitative variability of repetitive BstNI fragments of primary cultures of Daucus carota L. Theor. Appl. Genet. 1995, 91, 816–823. [Google Scholar] [CrossRef]
  9. Thibaud-Nissen, F.; Shealy, R.T.; Khanna, A.; Vodkin, L.O. Clustering of microarray data reveals transcript patterns associated with somatic embryogenesis in soybean. Plant Physiol. 2003, 132, 118–136. [Google Scholar] [CrossRef] [Green Version]
  10. Sharma, S.K.; Millam, S.; Hein, I.; Bryan, G.J. Cloning and molecular characterisation of a potato SERK gene transcriptionally induced during initiation of somatic embryogenesis. Planta 2008, 228, 319–330. [Google Scholar] [CrossRef] [PubMed]
  11. Quiroz-Figueroa, F.R.; Rojas-Herrera, R.; Galaz-Avalos, R.M.; Loyola-Vargas, V.M. Embryo production through somatic embryogenesis can be used to study cell differentiation in plants. Plant Cell Tissue Organ Cult. 2006, 86, 285–301. [Google Scholar] [CrossRef]
  12. Gliwicka, M.; Nowak, K.; Balazadeh, S.; Mueller-Roeber, B.; Gaj, M.D. Extensive modulation of the transcription factor transcriptome during somatic embryogenesis in Arabidopsis thaliana. PLoS ONE 2013, 8, e69261. [Google Scholar] [CrossRef] [Green Version]
  13. Boutilier, K.; Offringa, R.; Sharma, V.K.; Kieft, H.; Ouellet, T.; Zhang, L.; Hattori, J.; Liu, C.M.; van Lammeren, A.A.; Miki, B.L.; et al. Ectopic expression of BABY BOOM triggers a conversion from vegetative to embryonic growth. Plant Cell 2002, 4, 1737–1749. [Google Scholar] [CrossRef] [Green Version]
  14. Zuo, J.; Niu, Q.W.; Frugis, G.; Chua, N.H. The WUSCHEL gene promotes vegetative-to-embryonic transition in Arabidopsis. Plant J. 2002, 30, 349–359. [Google Scholar] [CrossRef] [PubMed]
  15. Gaj, M.D.; Zhang, S.; Harada, J.J.; Lemaux, P.G. Leafy cotyledon genes are essential for induction of somatic embryogenesis of Arabidopsis. Planta 2005, 222, 977–988. [Google Scholar] [CrossRef] [PubMed]
  16. Chen, X. Small RNAs and their roles in plant development. Annu. Rev. Cell Dev. Biol. 2009, 25, 21–44. [Google Scholar] [CrossRef] [Green Version]
  17. Yakovlev, I.A.; Fossdal, C.G.; Johnsen, Ø. MicroRNAs, the epigenetic memory and climatic adaptation in Norway spruce. New Phytol. 2010, 187, 1154–1169. [Google Scholar] [CrossRef] [PubMed]
  18. Li, T.; Chen, J.; Qiu, S.; Zhang, Y.; Wang, P.; Yang, L.; Lu, Y.; Shi, J. Deep sequencing and microarray hybridization identify conserved and species-specific microRNAs during somatic embryogenesis in hybrid yellow poplar. PLoS ONE 2012, 7, e43451. [Google Scholar] [CrossRef] [PubMed]
  19. Luo, Y.C.; Zhou, H.; Li, Y.; Chen, J.Y.; Yang, J.H.; Chen, Y.Q.; Qu, L.H. Rice embryogenic calli express a unique set of microRNAs, suggesting regulatory roles of microRNAs in plant post-embryogenic development. FEBS Lett. 2006, 580, 5111–5116. [Google Scholar] [CrossRef] [PubMed] [Green Version]
  20. Gou, J.Y.; Felippes, F.F.; Liu, C.J.; Weigel, D.; Wang, J.W. Negative regulation of anthocyanin biosynthesis in Arabidopsis by a miR156-targeted SPL transcription factor. Plant Cell 2011, 23, 1512–1522. [Google Scholar] [CrossRef] [Green Version]
  21. Tang, W.; Newton, R.J. Genome-wide expression analysis of genes involved in somatic embryogenesis. Somat. Embryog. 2005, 2, 69–83. [Google Scholar]
  22. Ye, C.Y.; Xu, H.; Shen, E.; Liu, Y.; Wang, Y.; Shen, Y.; Qiu, J.; Zhu, Q.H.; Fan, L. Genome-wide identification of non-coding RNAs interacted with microRNAs in soybean. Front. Plant Sci. 2014, 23, 743. [Google Scholar] [CrossRef]
  23. Jing, D.; Zhang, J.; Xia, Y.; Kong, L.; OuYang, F.; Zhang, S.; Zhang, H.; Wang, J. Proteomic analysis of stress-related proteins and metabolic pathways in Picea asperata somatic embryos during partial desiccation. Plant Biotechnol. J. 2017, 15, 27–38. [Google Scholar] [CrossRef] [PubMed] [Green Version]
  24. Saunders, J.W.; Bingham, E.T. Production of Alfalfa Plants from Callus Tissue 1. Crop Sci. 1972, 12, 804–808. [Google Scholar] [CrossRef]
  25. Imin, N.; Nizamidin, M.; Daniher, D.; Nolan, K.E.; Rose, R.J.; Rolfe, B.G. Proteomic analysis of somatic embryogenesis in Medicago truncatula. Explant cultures grown under 6-benzylaminopurine and 1-naphthaleneacetic acid treatments. Plant Physiol. 2005, 137, 1250–1260. [Google Scholar] [CrossRef] [PubMed] [Green Version]
  26. Elhiti, M.; Stasolla, C.; Wang, A. Molecular regulation of plant somatic embryogenesis. Vitr. Cell. Dev. Biol.-Plant 2013, 49, 631–642. [Google Scholar] [CrossRef]
  27. Zhang, J.; Xue, B.; Gai, M.; Song, S.; Jia, N.; Sun, H. Small RNA and Transcriptome Sequencing Reveal a Potential miRNA-Mediated Interaction Network That Functions during Somatic Embryogenesis in Lilium pumilum DC. Fisch. Front Plant Sci. 2017, 8, 566. [Google Scholar] [CrossRef] [PubMed]
  28. Li, W.F.; Zhang, S.G.; Han, S.Y.; Wu, T.; Zhang, J.H.; Qi, L.W. Regulation of LaMYB33 by miR159 during maintenance of embryogenic potential and somatic embryo maturation in Larix kaempferi (Lamb.) Carr. Plant Cell Tissue Organ Cult. (PCTOC) 2013, 113, 131–136. [Google Scholar] [CrossRef]
  29. Reinert, J. Morphogenese und ihre Kontrolle an Gewebekulturen aus Carotten. Naturwissenschaften 1958, 45, 344–345. [Google Scholar] [CrossRef]
  30. Steward, F.C.; Mapes, M.O.; Smith, J. Growth and organized development of cultured cells. I. Growth and division of freely suspended cells. Am. J. Bot. 1958, 45, 693–703. [Google Scholar] [CrossRef]
  31. Galland, R.; Randoux, B.; Vasseur, J.; Hilbert, J.L. A glutathione S-transferase cDNA identified by mRNA differential display is upregulated during somatic embryogenesis in Cichorium. Biochim. Biophys. Acta 2001, 1522, 212–216. [Google Scholar] [CrossRef]
  32. Xu, H.; Gao, Y.; Wang, J. Transcriptomic analysis of rice (Oryza sativa) developing embryos using the RNA-Seq technique. PLoS ONE 2012, 7, e30646. [Google Scholar] [CrossRef] [PubMed] [Green Version]
  33. Goldberg, R.B.; Barker, S.J.; Perez-Grau, L. Regulation of gene expression during plant embryogenesis. Cell 1989, 56, 149–160. [Google Scholar] [CrossRef]
  34. Bratzel, F.; López-Torrejón, G.; Koch, M.; Del Pozo, J.C.; Calonje, M. Keeping cell identity in Arabidopsis requires PRC1 RING-finger homologs that catalyze H2A monoubiquitination. Curr. Biol. 2010, 20, 1853–1859. [Google Scholar] [CrossRef] [PubMed] [Green Version]
  35. Hecht, V.; Vielle-Calzada, J.P.; Hartog, M.V.; Schmidt, E.D.; Boutilier, K.; Grossniklaus, U.; de Vries, S.C. The Arabidopsis SOMATIC EMBRYOGENESIS RECEPTOR KINASE 1 gene is expressed in developing ovules and embryos and enhances embryogenic competence in culture. Plant Physiol. 2001, 127, 803–816. [Google Scholar] [CrossRef] [PubMed]
  36. Puigderrajols, P.; Jofré, A.; Mir, G.; Pla, M.; Verdaguer, D.; Huguet, G.; Molinas, M. Developmentally and stress-induced small heat shock proteins in cork oak somatic embryos. J. Exp. Bot. 2002, 53, 1445–1452. [Google Scholar]
  37. Jiménez, V.M. Involvement of plant hormones and plant growth regulators on in vitro somatic embryogenesis. Plant Growth Regul. 2005, 47, 91–110. [Google Scholar] [CrossRef]
  38. Mashiguchi, K.; Tanaka, K.; Sakai, T.; Sugawara, S.; Kawaide, H.; Natsume, M.; Hanada, A.; Yaeno, T.; Shirasu, K.; Yao, H.; et al. The main auxin biosynthesis pathway in Arabidopsis. Proc. Natl. Acad. Sci. USA 2011, 108, 18512–18517. [Google Scholar] [CrossRef] [Green Version]
  39. Swarup, R.; Friml, J.; Marchant, A.; Ljung, K.; Sandberg, G.; Palme, K.; Bennett, M. Localization of the auxin permease AUX1 suggests two functionally distinct hormone transport pathways operate in the Arabidopsis root apex. Genes Dev. 2001, 15, 2648–2653. [Google Scholar] [CrossRef] [PubMed] [Green Version]
  40. Dharmasiri, N.; Dharmasiri, S.; Estelle, M. The F-box protein TIR1 is an auxin receptor. Nature 2005, 435, 441–445. [Google Scholar] [CrossRef]
  41. Zenk, M.H.; Müller, G. In vivo destruction of exogenously applied indolyl-3-acetic acid as influenced by naturally occurring phenolic acids. Nature 1963, 200, 761–763. [Google Scholar] [CrossRef]
  42. Hagen, G.; Guilfoyle, T. Auxin-responsive gene expression: Genes, promoters and regulatory factors. Plant Mol. Biol. 2002, 49, 373–385. [Google Scholar] [CrossRef]
  43. Abe, H.; Uchiyama, M.; Sato, R. Isolation and identification of native auxins in marine algae. Agric. Biol. Chem. 1972, 36, 2259–2260. [Google Scholar] [CrossRef]
  44. Wang, H.; Jones, B.; Li, Z.; Frasse, P.; Delalande, C.; Regad, F.; Chaabouni, S.; Latché, A.; Pech, J.C.; Bouzayen, M. The tomato Aux/IAA transcription factor IAA9 is involved in fruit development and leaf morphogenesis. Plant Cell 2005, 17, 2676–2692. [Google Scholar] [CrossRef] [PubMed] [Green Version]
  45. Gonzalez-Rizzo, S.; Crespi, M.; Frugier, F. The Medicago truncatula CRE1 cytokinin receptor regulates lateral root development and early symbiotic interaction with Sinorhizobium meliloti. Plant Cell 2006, 18, 2680–2693. [Google Scholar] [CrossRef] [PubMed] [Green Version]
  46. Tun, N.N.; Livaja, M.; Kieber, J.J.; Scherer, G.F. Zeatin-induced nitric oxide (NO) biosynthesis in Arabidopsis thaliana mutants of NO biosynthesis and of two-component signaling genes. New Phytol. 2008, 178, 515–531. [Google Scholar] [CrossRef] [PubMed]
  47. Argueso, C.T.; Ferreira, F.J.; Kieber, J.J. Environmental perception avenues: The interaction of cytokinin and environmental response pathways. Plant Cell Environ. 2009, 32, 1147–1160. [Google Scholar] [CrossRef] [PubMed]
  48. Hwang, I.; Sheen, J. Two-component circuitry in Arabidopsis cytokinin signal transduction. Nature 2001, 413, 383–389. [Google Scholar] [CrossRef]
  49. Papon, N.; Vansiri, A.; Gantet, P.; Chénieux, J.C.; Rideau, M.; Crèche, J. Histidine-containing phosphotransfer domain extinction by RNA interference turns off a cytokinin signalling circuitry in Catharanthus roseus suspension cells. FEBS Lett. 2004, 558, 85–88. [Google Scholar] [CrossRef] [Green Version]
  50. Ferreira, F.J.; Kieber, J.J. Cytokinin signaling. Curr. Opin. Plant Biol. 2005, 8, 518–525. [Google Scholar] [CrossRef] [PubMed]
  51. To, J.P.; Haberer, G.; Ferreira, F.J.; Deruère, J.; Mason, M.G.; Schaller, G.E.; Alonso, J.M.; Ecker, J.R.; Kieber, J.J. Type-A Arabidopsis response regulators are partially redundant negative regulators of cytokinin signaling. Plant Cell. 2004, 16, 658–671. [Google Scholar] [CrossRef] [PubMed] [Green Version]
  52. de Lucas, M.; Davière, J.M.; Rodríguez-Falcón, M.; Pontin, M.; Iglesias-Pedraz, J.M.; Lorrain, S.; Fankhauser, C.; Blázquez, M.A.; Titarenko, E.; Prat, S. A molecular framework for light and gibberellin control of cell elongation. Nature 2008, 451, 480–484. [Google Scholar] [CrossRef]
  53. Schoonheim, P.J.; Costa Pereira, D.D.; De Boer, A.H. Dual role for 14-3-3 proteins and ABF transcription factors in gibberellic acid and abscisic acid signalling in barley (Hordeum vulgare) aleurone cells. Plant Cell Environ. 2009, 32, 439–447. [Google Scholar] [CrossRef] [PubMed]
  54. Spoel, S.H.; Koornneef, A.; Claessens, S.M.; Korzelius, J.P.; Van Pelt, J.A.; Mueller, M.J.; Buchala, A.J.; Métraux, J.P.; Brown, R.; Kazan, K.; et al. NPR1 modulates cross-talk between salicylate- and jasmonate-dependent defense pathways through a novel function in the cytosol. Plant Cell 2003, 15, 760–770. [Google Scholar] [CrossRef] [Green Version]
  55. Yoong, F.Y.; O’Brien, L.K.; Truco, M.J.; Huo, H.; Sideman, R.; Hayes, R.; Michelmore, R.W.; Bradford, K.J. Genetic Variation for Thermotolerance in Lettuce Seed Germination Is Associated with Temperature-Sensitive Regulation of ETHYLENE RESPONSE FACTOR1 (ERF1). Plant Physiol. 2016, 170, 472–488. [Google Scholar] [CrossRef] [Green Version]
  56. Fraga, H.P.; Vieira, L.D.; Puttkammer, C.C.; Dos Santos, H.P.; Garighan, J.A.; Guerra, M.P. Glutathione and abscisic acid supplementation influences somatic embryo maturation and hormone endogenous levels during somatic embryogenesis in Podocarpus lambertii Klotzsch ex Endl. Plant Sci. 2016, 253, 98–106. [Google Scholar] [CrossRef] [Green Version]
  57. Lee, S.C.; Luan, S. ABA signal transduction at the crossroad of biotic and abiotic stress responses. Plant Cell Environ. 2012, 35, 53–60. [Google Scholar] [CrossRef]
  58. Soon, F.F.; Ng, L.M.; Zhou, X.E.; West, G.M.; Kovach, A.; Tan, M.H.; Suino-Powell, K.M.; He, Y.; Xu, Y.; Chalmers, M.J.; et al. Molecular mimicry regulates ABA signaling by SnRK2 kinases and PP2C phosphatases. Science 2012, 335, 85–88. [Google Scholar] [CrossRef] [PubMed] [Green Version]
  59. Wu, G.; Park, M.Y.; Conway, S.R.; Wang, J.W.; Weigel, D.; Poethig, R.S. The sequential action of miR156 and miR172 regulates developmental timing in Arabidopsis. Cell 2009, 138, 750–759. [Google Scholar] [CrossRef] [PubMed] [Green Version]
  60. Lauter, N.; Kampani, A.; Carlson, S.; Goebel, M.; Moose, S.P. microRNA172 down-regulates glossy15 to promote vegetative phase change in maize. Proc. Natl. Acad. Sci. USA 2005, 102, 9412–9417. [Google Scholar] [CrossRef] [PubMed] [Green Version]
  61. Yan, Z.; Hossain, M.S.; Wang, J.; Valdés-López, O.; Liang, Y.; Libault, M.; Qiu, L.; Stacey, G. miR172 regulates soybean nodulation. Mol. Plant Microbe Interact. 2013, 26, 1371–1377. [Google Scholar] [CrossRef] [PubMed] [Green Version]
  62. Zhao, L.; Kim, Y.; Dinh, T.T.; Chen, X. miR172 regulates stem cell fate and defines the inner boundary of APETALA3 and PISTILLATA expression domain in Arabidopsis floral meristems. Plant J. 2007, 51, 840–849. [Google Scholar] [CrossRef] [Green Version]
  63. Zhang, S.; Zhou, J.; Han, S.; Yang, W.; Li, W.; Wei, H.; Li, X.; Qi, L. Four abiotic stress-induced miRNA families differentially regulated in the embryogenic and non-embryogenic callus tissues of Larix leptolepis. Biochem. Biophys. Res. Commun. 2010, 398, 355–360. [Google Scholar] [CrossRef]
  64. Glazińska, P.; Zienkiewicz, A.; Wojciechowski, W.; Kopcewicz, J. The putative miR172 target gene InAPETALA2-like is involved in the photoperiodic flower induction of Ipomoea nil. J. Plant Physiol. 2009, 166, 1801–1813. [Google Scholar] [CrossRef]
  65. Wang, J.W.; Czech, B.; Weigel, D. miR156-regulated SPL transcription factors define an endogenous flowering pathway in Arabidopsis thaliana. Cell 2009, 138, 738–749. [Google Scholar] [CrossRef] [PubMed] [Green Version]
  66. Wang, J.W.; Schwab, R.; Czech, B.; Mica, E.; Weigel, D. Dual effects of miR156-targeted SPL genes and CYP78A5/KLUH on plastochron length and organ size in Arabidopsis thaliana. Plant Cell 2008, 20, 1231–1243. [Google Scholar] [CrossRef] [Green Version]
  67. Wu, G.; Poethig, R.S. Temporal regulation of shoot development in Arabidopsis thaliana by miR156 and its target SPL3. Development 2006, 133, 3539–3547. [Google Scholar] [CrossRef] [PubMed] [Green Version]
  68. Zhu, H.; Hu, F.; Wang, R.; Zhou, X.; Sze, S.H.; Liou, L.W.; Barefoot, A.; Dickman, M.; Zhang, X. Arabidopsis Argonaute10 specifically sequesters miR166/165 to regulate shoot apical meristem development. Cell 2011, 145, 242–256. [Google Scholar] [CrossRef] [Green Version]
  69. Miyashima, S.; Honda, M.; Hashimoto, K.; Tatematsu, K.; Hashimoto, T.; Sato-Nara, K.; Okada, K.; Nakajima, K. A comprehensive expression analysis of the Arabidopsis MICRORNA165/6 gene family during embryogenesis reveals a conserved role in meristem specification and a non-cell-autonomous function. Plant Cell Physiol. 2013, 54, 375–384. [Google Scholar] [CrossRef] [Green Version]
  70. Jung, J.H.; Park, C.M. MIR166/165 genes exhibit dynamic expression patterns in regulating shoot apical meristem and floral development in Arabidopsis. Planta 2007, 225, 1327–1338. [Google Scholar] [CrossRef]
  71. Li, W.F.; Zhang, S.G.; Han, S.Y.; Wu, T.; Zhang, J.H.; Qi, L.W. The post-transcriptional regulation of LaSCL6 by miR171 during maintenance of embryogenic potential in Larix kaempferi (Lamb.) Carr. Tree Genet. Genomes 2014, 10, 223–229. [Google Scholar] [CrossRef]
  72. Ma, Z.; Hu, X.; Cai, W.; Huang, W.; Zhou, X.; Luo, Q.; Yang, H.; Wang, J.; Huang, J. Arabidopsis miR171-targeted scarecrow-like proteins bind to GT cis-elements and mediate gibberellin-regulated chlorophyll biosynthesis under light conditions. PLoS Genet. 2014, 10, e1004519. [Google Scholar]
  73. Huang, W.; Peng, S.; Xian, Z.; Lin, D.; Hu, G.; Yang, L.; Ren, M.; Li, Z. Overexpression of a tomato miR171 target gene SlGRAS24 impacts multiple agronomical traits via regulating gibberellin and auxin homeostasis. Plant Biotechnol. J. 2017, 15, 472–488. [Google Scholar] [CrossRef] [PubMed]
  74. Marin, E.; Jouannet, V.; Herz, A.; Lokerse, A.S.; Weijers, D.; Vaucheret, H.; Nussaume, L.; Crespi, M.D.; Maizel, A. miR390, Arabidopsis TAS3 tasiRNAs, and their AUXIN RESPONSE FACTOR targets define an autoregulatory network quantitatively regulating lateral root growth. Plant Cell 2010, 22, 1104–1117. [Google Scholar] [PubMed] [Green Version]
  75. Lu, C.; Tej, S.S.; Luo, S.; Haudenschild, C.D.; Meyers, B.C.; Green, P.J. Elucidation of the small RNA component of the transcriptome. Science 2005, 309, 1567–1569. [Google Scholar] [PubMed] [Green Version]
  76. German, M.A.; Pillay, M.; Jeong, D.H.; Hetawal, A.; Luo, S.; Janardhanan, P.; Kannan, V.; Rymarquis, L.A.; Nobuta, K.; German, R.; et al. Global identification of microRNA-target RNA pairs by parallel analysis of RNA ends. Nat. Biotechnol. 2008, 26, 941–946. [Google Scholar]
  77. Liszkay, A.; van der Zalm, E.; Schopfer, P. Production of reactive oxygen intermediates (O(2)(.-), H(2)O(2), and (.)OH) by maize roots and their role in wall loosening and elongation growth. Plant Physiol. 2004, 136, 3114–3123. [Google Scholar] [CrossRef] [Green Version]
  78. Saldanha, A.J. Java Treeview—Extensible visualization of microarray data. Bioinformatics 2004, 20, 3246–3248. [Google Scholar] [PubMed] [Green Version]
  79. Young, M.D.; Wakefield, M.J.; Smyth, G.K.; Oshlack, A. Gene ontology analysis for RNA-seq: Accounting for selection bias. Genome Biol. 2010, 11, R14. [Google Scholar] [CrossRef] [PubMed] [Green Version]
  80. Zhao, J.; Li, G.; Wang, B.M.; Liu, W.; Nan, T.G.; Zhai, Z.X.; Li, Z.H.; Li, Q.X. Development of a monoclonal antibody-based enzyme-linked immunosorbent assay for the analysis of glycyrrhizic acid. Anal. Bioanal. Chem. 2006, 386, 1735–1740. [Google Scholar]
  81. Jin, M.; Ren, Y.; Chen, X. Determination of 6-benzyladenine in bean sprout by LC–ESI-IT-MS–MS. Chromatographia 2007, 66, 407–410. [Google Scholar] [CrossRef]
  82. Goidin, D.; Mamessier, A.; Staquet, M.J.; Schmitt, D.; Berthier-Vergnes, O. Ribosomal 18S RNA prevails over glyceraldehyde-3-phosphate dehydrogenase and beta-actin genes as internal standard for quantitative comparison of mRNA levels in invasive and noninvasive human melanoma cell subpopulations. Anal. Biochem. 2001, 295, 17–21. [Google Scholar] [CrossRef] [Green Version]
  83. Miyagishi, M.; Taira, K. U6 promoter-driven siRNAs with four uridine 3′ overhangs efficiently suppress targeted gene expression in mammalian cells. Nat. Biotechnol. 2002, 20, 497–500. [Google Scholar] [CrossRef] [PubMed]
  84. Liu, Q.; Xu, J.; Liu, Y.; Zhao, X.; Deng, X.; Guo, L.; Gu, J. A novel bud mutation that confers abnormal patterns of lycopene accumulation in sweet orange fruit (Citrus sinensis L. Osbeck). J. Exp. Bot. 2007, 58, 4161–4171. [Google Scholar] [CrossRef] [PubMed]
Figure 1. Somatic embryogenesis in alfalfa at four developmental phases used for RNA-Seq analysis; (a) Cotyledon cutting; (b) Non-embryogenic callus; (c) Embryogenic callus; (d) Cotyledon embryo. Bar = 1 mm.
Ijms 23 08633 g001
Figure 2. Morphology of somatic embryogenesis callus. (a) cut cotyledon; (b) non-embryogenic callus; (c) embryogenic callus; (d) cotyledon embryo; (e) Cut cotyledon; (f) non-embryogenic callus; (g) embryogenic callus, bar = 100 μm; (h) cotyledon embryo.
Ijms 23 08633 g002
Figure 3. Unigene and small RNA length distributions. (a) Unigenes and transcriots; (b) Small RNAs.
Ijms 23 08633 g003
Figure 4. Histograms and Venn diagrams of DEGs for three phrases in SE: embryonic induction (ICE vs. NEC), embryonic induction (NEC vs. EC), and maturation (EC vs. CE). (a) The numbers of DEGs up- or down-regulated during SE; (b) Venn diagram showing similarly or differently regulated genes over the three phreases; (c) The numbers of small RNAs up- or down-regulated during SE; (d) Venn diagram showing similarly or differentially regulated small RNAs during SE.
Ijms 23 08633 g004
Figure 5. Plant hormone signal transduction genes in SE. (a) Expression of gene in ICE to NEC; (b) Expression of gene in NEC to EC; (c) Expression of gene in EC to CE. ∣log2FC∣ > 0.5. ICE_1, ICE_2 and ICE_3 represent three biological replicates.
Ijms 23 08633 g005
Figure 6. Hormone changes during different phases of SE. (a) Auxin changes at cut cotyledon (ICE). non-embyogenic callus (NEC), embyogenic callus (EC), and cotyledon embryo (CE) phases; (b) Gibberellin changes at ICE, NEC, EC and CE phases; (c) Abscisic acid changes At ICE, NEC, EC and CE; (d) Cytokinin changes at ICE, NEC, EC and CE. Indirect competitive enzyme-linked immunoassay (icELISA) for hormone detection. * p < 0.05, ** p < 0.01 (Student’ s t-test).
Ijms 23 08633 g006
Figure 7. Transcripts reads per million reads known miRNAs in Medicago sativa. (a) miRNAs families with TPM value over 10,000; (b) miRNA families TPM value between 1000 and 10,000; (c) miRNA families TPM value between 100 and 1000; (d) miRNA families TPM value between 0 and 100.
Ijms 23 08633 g007
Figure 8. Differentially expressed known and novel miRNAs in M. sativa SE. (ac) comparison of diferentially known miRNA families among ICE to NEC, NEC to EC and EC to CE; (df) comparison of diferentially novel miRNA families among ICE to NEC, NEC to EC and EC to CE. ∣log2FC∣ ≥ 2.
Ijms 23 08633 g008
Figure 9. KEGG enrichment target genes in M. sativa SE.
Ijms 23 08633 g009
Figure 10. Relative expression of genes and miRNAs during cut cotyledon (ICE), non-embyogenic callus (NEC), embryogenic callus (EC), cotyledon embryo (CE) phases. (a) The relative expression of DEGs; (b) The relative expression of miRNAs. genes and miRNAs calculated by the equation = 2−ΔΔCt, The 18sRNA is housekeeping gene for gene expression detection, and the U6 gene is housekeeping gene for miRNA expression detection. The different letters represent significant differences (p < 0.05, (ANOVA)).
Ijms 23 08633 g010
Figure 11. The miRNAs and target genes formed potential miRNA-target gene interaction network during embryonic induction, embyonic and maturation in M.sative SE. Red represents gene upregulation and green represents gene down regulation. The darker the color represent more obvious the difference in expression. Arrows represent the targeting of miRNAs.
Ijms 23 08633 g011
Table 1. Transcriptome data quality profile.
SampleRaw ReadsClean ReadsClean BasesError (%)Q20 (%)Q30 (%)GC (%)
ICE_152,384,25851,607,1487.74G0.0197.7594.0041.28
ICE_258,306,72256,696,6028.5G0.0297.2092.6941.30
ICE_350,810,16850,103,1627.52G0.0197.8694.2141.34
NEC_157,200,88455,844,9048.38G0.0197.8994.3041.60
NEC_260,219,47256,035,4488.41G0.0296.9792.0541.86
NEC_353,763,20052,838,6807.93G0.0197.9794.5041.60
EC_152,977,21651,478,3247.72G0.0197.9794.5141.45
EC_255,361,56254,341,9008.15G0.0198.0294.6341.39
EC_357,268,22255,969,4468.4G0.0197.6493.7641.79
CE_163,997,18662,745,1169.41G0.0297.4793.4741.93
CE_250,846,07649,993,0367.5G0.0297.4993.4941.95
CE_355,045,60854,018,6268.1G0.0297.4493.3941.65
ICE, non-embryogenic callus; NEC, non-embryogenic callus; EC embryogenic callus; CE, cotyledon embryo; Q20 , phred percentage of base greater than 20, pecentage of base population; Q30, phred percentage of base greater than 30, percentage of base population; GC, GC content.
Table 2. Small RNA filter profile.
SampleICENECECCE
total reads14,669,757 (100.00%)14,696,331 (100.00%)11,817,247 (100.00%)10,282,021 (100.00%)
N% > 10%18 (0.00%)25 (0.00%)0 (0.00%)0 (0.00%)
low quality753,071 (5.13%)1,954,044 (13.30%)488,075 (4.13%)225,087 (2.19%)
5 adapter contamine23,386 (0.16%)16,804 (0.11%)9703 (0.08%)11,016 (0.11%)
3 adapter null or insert null649,842 (4.43%)316,352 (2.15%)212,613 (1.80%)189,171 (1.84%)
With ployA/T/G/C39,873 (0.27%)55,440 (0.38%)35,208 (0.30%)32,043 (0.31%)
clean reads13,203,567 (90.01%)12,353,666 (84.06%)11,071,648 (93.69%)9,824,704 (95.55%)
Table 3. Annotation of small RNA.
TypesICENECECCE
known miRNA740,026 (12.40%)302,053 (5.92%)299,136 (6.74%)479,121 (11.25%)
novel miRNA132,783 (2.23%)63,563 (1.25%)34,189 (0.77%)46,934 (1.10%)
rRNA432,250 (7.24%)121,355 (2.38%)252,580 (5.69%)149,802 (3.52%)
tRNA3 (0.00%)01 (0.00%)0
snRNA3988 (0.07%)2290 (0.04%)5984 (0.13%)2902 (0.07%)
snoRNA9607 (0.16%)23,276 (0.46%)22,688 (0.51%)15,722 (0.37%)
TAS19,322 (0.32%)31,369 (0.61%)25,992 (0.59%)132,783 (0.46%)
other4,629,365 (77.58%)4,560,608 (89.34%)25,992 (0.59%)19,645 (0.46%)
total5,967,3445,104,5144,436,6714,257,086
Publisher’s Note: MDPI stays neutral with regard to jurisdictional claims in published maps and institutional affiliations.

