Article

A Single Amino Acid Substitution in MIL1 Leads to Activation of Programmed Cell Death and Defense Responses in Rice

1
Rice Research Institute, Shenyang Agricultural University, Shenyang 110866, China
2
College of Plant Protection, Shenyang Agricultural University, Shenyang 110866, China
*
Author to whom correspondence should be addressed.
These authors contributed equally to this work.
Int. J. Mol. Sci. 2022, 23(16), 8853; https://doi.org/10.3390/ijms23168853
Submission received: 16 June 2022 / Revised: 26 July 2022 / Accepted: 31 July 2022 / Published: 9 August 2022
(This article belongs to the Section Molecular Plant Sciences)

Abstract

:
Lesion mimic mutants are an ideal model system for elucidating the molecular mechanisms of programmed cell death and defense responses in rice. In this study, we identified a lesion mimic mutant termed miner infection like 1-1 (mil1-1). The mil1-1 exhibited lesions on the leaves during development, and the chloroplasts of mil1-1 leaves were disrupted. Reactive oxygen species were found to accumulate in mil1-1 leaves. Cell death and DNA fragmentation were observed in mil1-1 leaves, indicating that the cells in the spots of mil1-1 leaves experienced programmed cell death. Most agronomic traits decreased in mil1-1, suggesting that the growth retardation in mil1-1 caused reduced per-plant grain yield. However, the mutation of MIL1 activated the expression of pathogen response genes and enhanced resistance to bacterial blight. The MIL1 gene was cloned using the positional cloning approach. A missense mutation 751 bp downstream of ATG was found in mil1-1. The defects of mil1-1 were able to be rescued by delivering a wild-type MIL1 gene into mil1-1. MIL1 encoded hydroperoxide lyase 3 (OsHPL3), and the expression of OsHPL3 was induced via hormone and abiotic stresses. Our findings provide insights into the roles of MIL1 in regulating programmed cell death, development, yield, and defense responses in rice.

1. Introduction

Rice is one of the primary food crops globally, feeding more than half of the population of the world. The grain yield of rice is also closely associated with global food security. Disease is one of the most important factors limiting the yield and quality enhancement of rice. In response to pathogen attacks, a hypersensitive response (HR), which induces infected cell death, prevents the spread of pathogens to adjacent cells. The over-accumulation of reactive oxygen species (ROS), including superoxide radical (O2−) and hydrogen peroxide (H2O2), has been confirmed to be closely associated with lesion formation in several lesion mimic mutants [1,2].
In plants, ROS are generated during basal metabolic processes and play important roles in the development and responses to various abiotic and biotic stresses [3]. Most apoplastic ROS are produced via respiratory burst oxidase homologs D (RbohD). Superoxide anion radicals (O2−), hydroxyl radicals (OH), and hydrogen peroxide (H2O2) are the major ROS molecules leading to oxidative damage in plants [4]. Under normal physiologic conditions, cells control ROS levels by balancing the generation of ROS with their elimination using the scavenging system. ROS are regarded as signal molecules that participate in programmed cell death (PCD). Accumulated ROS can directly damage normal cellular structures or act as signal molecules to induce HR, resulting in cell death and necrotic lesions in leaves [5]. When a pathogen invades a plant, HR is generated, leading to PCD and thereby suppressing pathogen infection.
Lesion mimic mutants display HR-like spontaneous lesions in the absence of pathogen attacks, abiotic stresses, and mechanical damage, which are useful to uncover the regulatory mechanisms of defense responses and PCD in rice [6]. Recently, several of the genes involved in defense responses to pathogen infection and PCD have been identified by using lesion mimic mutants in rice [6]. Lesion mimic mutations in rice affect spot-leaf formation, PCD, and resistance to disease via different molecular mechanisms.
Knockout of Spotted Leaf 3 (SPL3) and Lesion Mimic Mutant 24 (LMM24) genes, which encode Mitogen-Activated Protein Kinase Kinase Kinase 1 (OsMAPKKK1) and Receptor-Like Cytoplasmic Kinase 109 (RLCK109), respectively, develop spontaneous lesions on the leaf blades and enhance resistance to bacterial blight [7,8,9,10,11]. Mutations in the genes encoding AAA-type ATPase, such as SPL4 and Lesion Mimic Resembling (LMR), exhibit spontaneous lesions and affect leaf senescence, immune response, and PCD in rice [12,13,14]. Mutations of genes involved in protein synthesis, such as SPL33 and Lesion Mimic Leaf 1 (LML1), encoding translation Elongation Factor 1 alpha (eEF1A) and eukaryotic Release Factor 1 (eRF1), respectively, display spontaneous lesions in leaves [15,16]. Mutations of genes encoding proteins in the poly-ubiquitination mediated 26S proteasome system, such as SPL11 (an E3 ubiquitin ligase), OsCUL3a (a component in SKP1-CUL1-F-box protein E3 ligase complex), and SPL35 (a coupling of ubiquitin binding to endoplasmic reticulum degradation domain protein), present lesion-like leaves [17,18,19]. Mutants of several genes, such as Lesion Like Mutant 1 (LLM1), SPL29, and SPL30, which encode coproporphyrinogen III oxidase (CPOX), uridine diphosphate-N-acetylglucosamine pyrophosphorylase (UAP1), and P450 monooxygenase, respectively, also exhibit different lesion mimic phenotypes in rice [20,21,22,23].
Defense responses of plants against pathogen attacks are complex processes. More questions remain to be uncovered. Cloning and characterization of genes involved in defense responses with lesion mimic mutants can further dissect the mechanisms of ROS generation, PCD, and responses to pathogen attacks in plants. In this study, we obtained a lesion mimic mutant, termed miner infection like 1-1 (mil1-1), using an ethyl methane sulfonate (EMS) mutagenesis approach in rice. The mil1-1 mutant exhibits spontaneous lesions in leaf blades from the early seedling stage to the grain filling stage. The emergence of these spots in mil1-1 is light-intensity dependent. ROS are abnormally accumulated causing PCD in mil1-1 leaves. Additionally, the mil1-1 mutant displays enhanced resistance to bacterial blight, indicating that MIL1 negatively regulates resistance to bacterial blight disease in rice. The MIL1 gene was isolated through the map-based positional cloning approach. A single-base substitution, G to A, in 751 bp downstream of ATG at the Os02g0110200 locus of mil1-1, changing the codon from GGG (glycine, Gly) to AGG (arginine, Arg), confers the phenotype of mil1-1. The MIL1 gene is known to encode Hydroperoxide Lyase 3 (OsHPL3) in rice.

2. Results

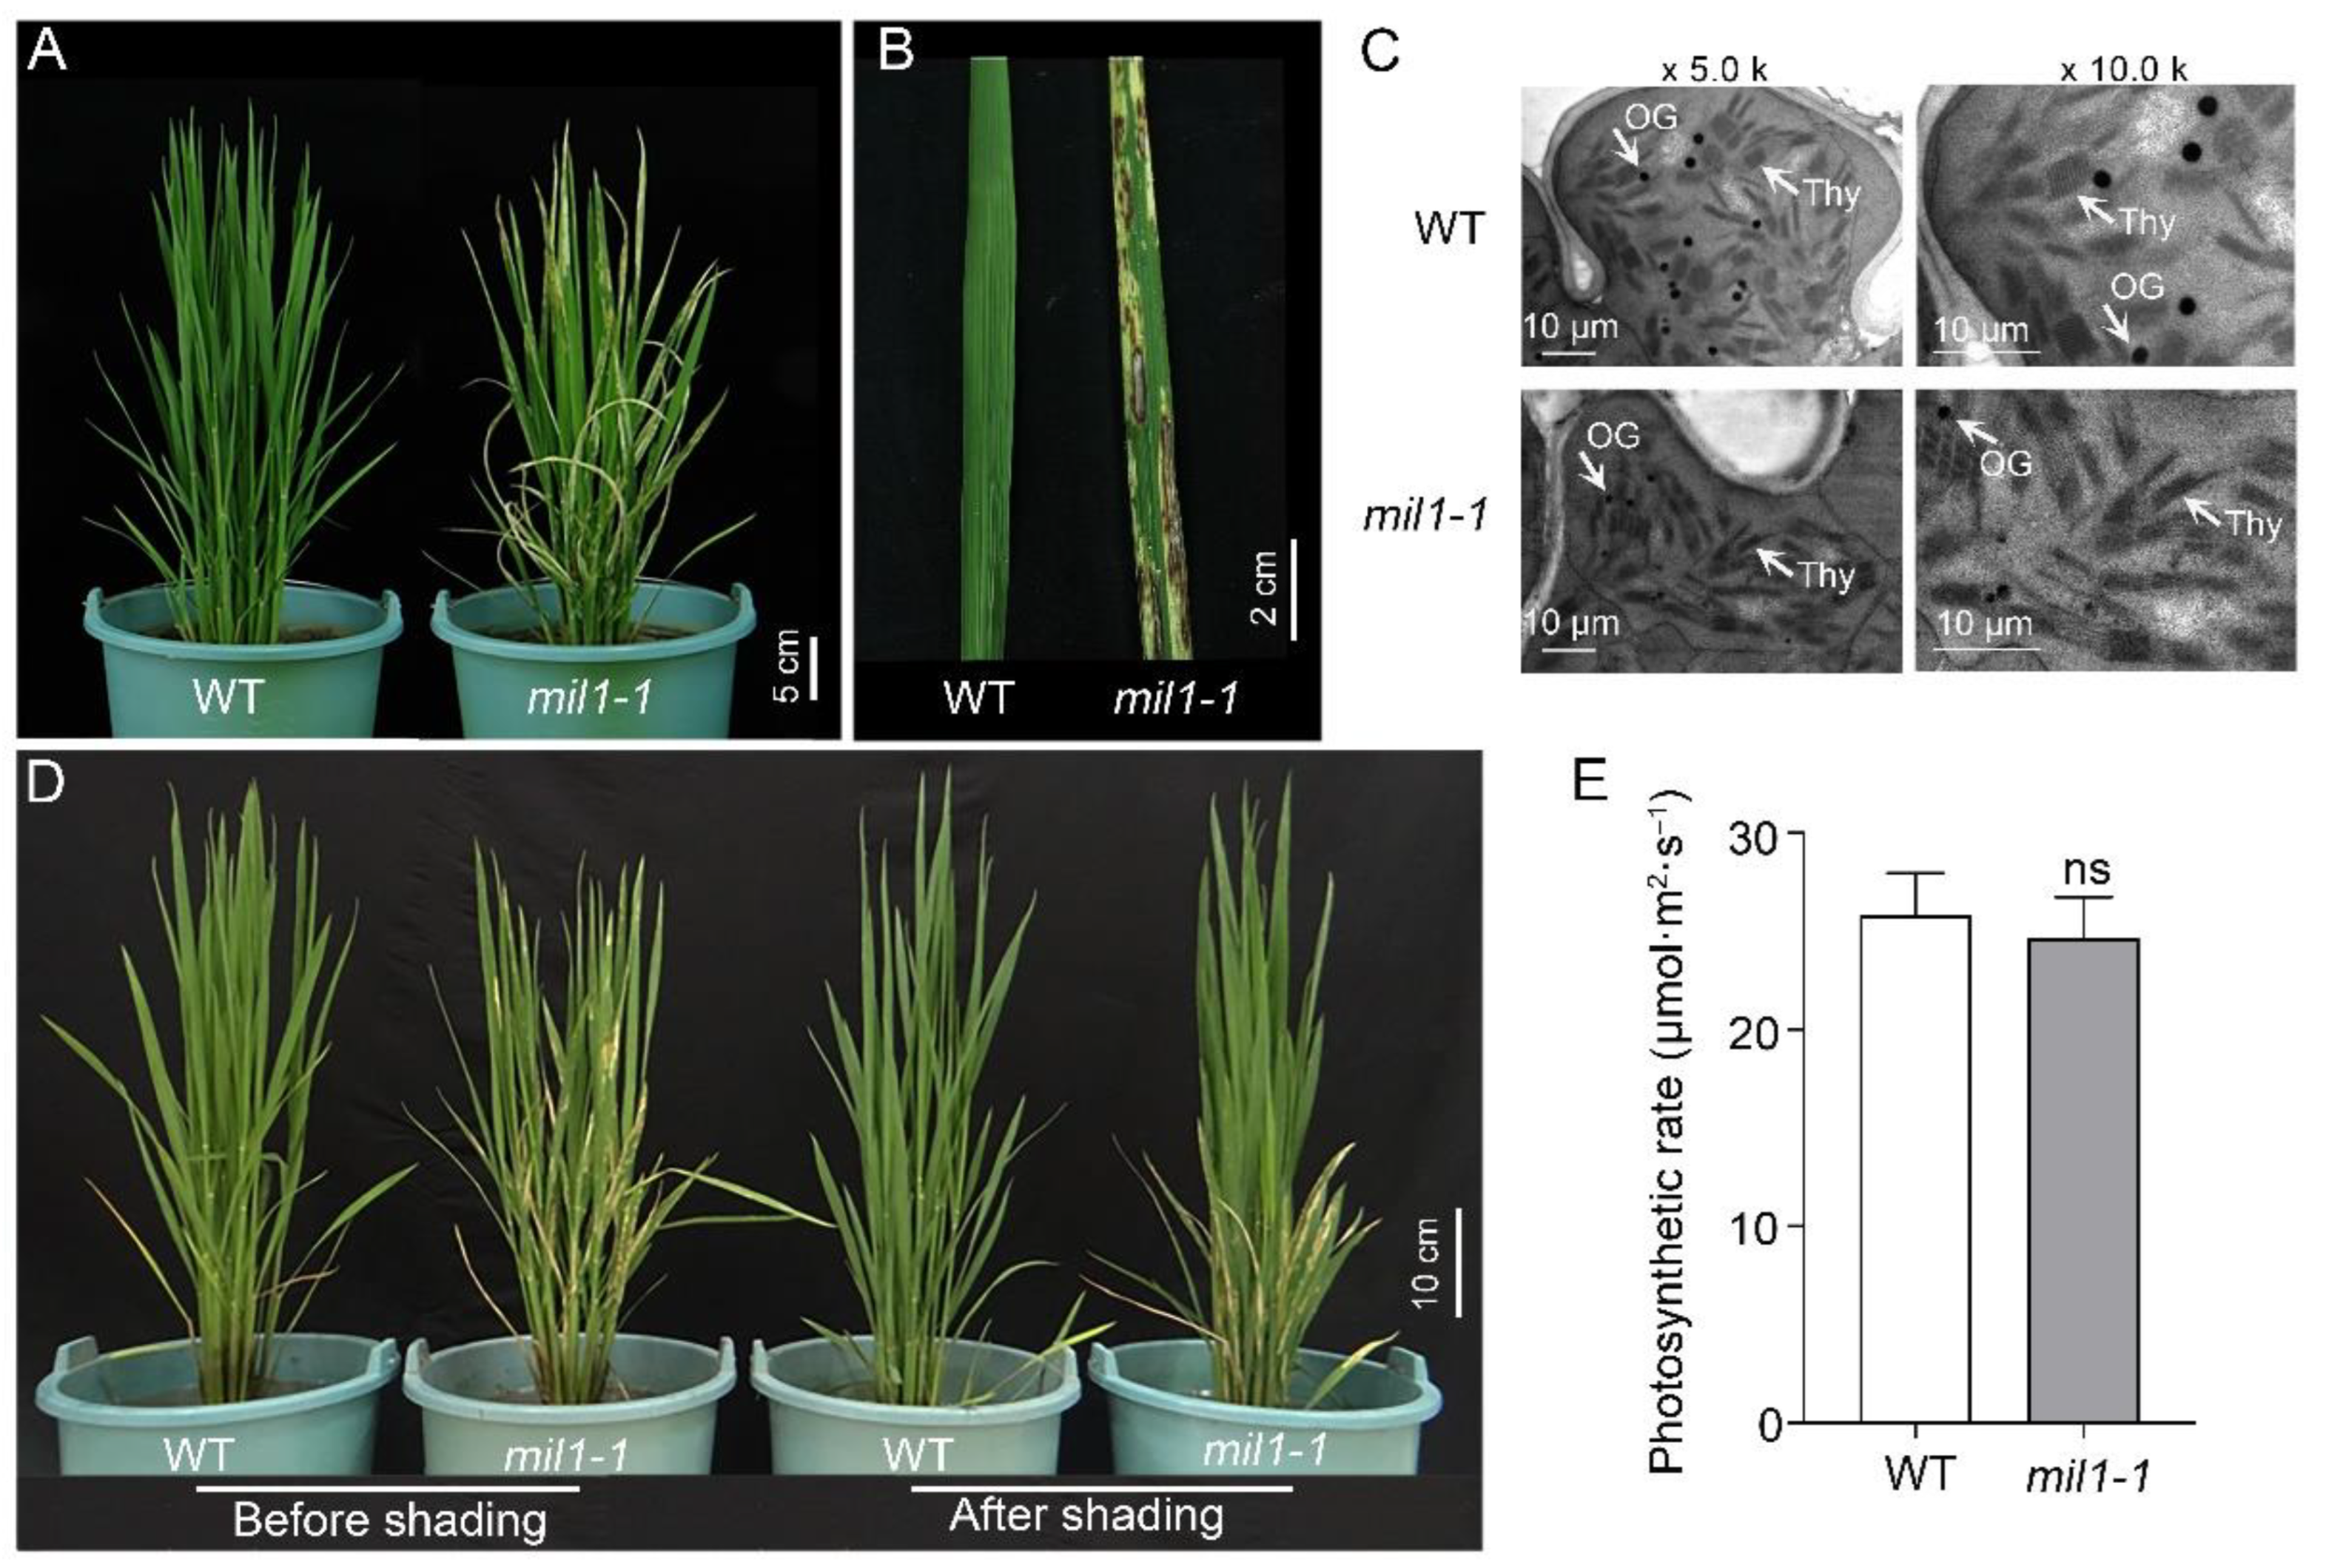
2.1. The Mil1-1 Mutation Confers Spotted Leaf Phenotype in Rice

The spotted leaf mutant of rice, mil1-1, was obtained by EMS mutagenesis. From the early seedling stage to the mature stage, mil1-1 displayed a number of spontaneous lesions in the leaves (Figure 1A,B).
Because chloroplasts are fragile. Color change and lesion formation in leaves will destroy the integrality of chloroplasts, especially the structure of thylakoid lamellae [11]. To determine whether mil1-1 mutation disrupts the leaf microstructure, the ultrastructure of chloroplasts in the mesophyll cells was observed using transmission electron microscopy (TEM). The chloroplasts were found to be well-developed, and the thylakoid lamellae were regular and compact in the WT sample; however, the thylakoid lamellae were loosely arranged in mil1-1, indicating that the chloroplasts in mil1-1 were destroyed by the formation of lesions in the leaf blade (Figure 1C).
Lesion formation of lesion mimic mutants is usually light-intensity dependent [24]. To explore the effects of light intensity on mil1-1 spot production, 70 percent of shade treatments were applied for two weeks at the tillering stage in the paddy field. The results showed that visible spots continued to develop on leaves of mil1-1 mutant under normal conditions (no shade); however, the leaves of mil1-1 mutant no longer developed spots after shade treatment, and the spots on the mil1-1 leaves before shade treatment did not vanish (Figure 1D). These findings suggest that light intensity influences the establishment of spots in the leaves of mil1-1. In addition, the difference in the photosynthetic rate between WT and mil1-1 was investigated. The photosynthetic rate of mil1-1 was found to be slightly lower than that of WT, but the difference was not significant (Figure 1E).

2.2. Abnormal ROS Accumulation and PCD Occur in Mil1-1

To understand the molecular mechanisms driving the formation of HR-like lesions in the leaves of mil1-1, we analyzed the expression of numerous histochemical markers for ROS accumulation and cell death. Excessive buildup of H2O2 in the tissue may generate a reddish-brown precipitate with 3,3′-diaminobenzidine (DAB). Based on this factor, the leaves from 60-day-old plants of WT and mil1-1 were selected for DAB staining. The results showed that H2O2 accumulated in the leaves of mil1-1 but not in the leaves of WT (Figure 2A). Similarly, purple dirty precipitation formed in mil1-1 stained with nitro-blue tetrazolium chloride (NBT), which is an indicator of O2−, but not in any WT leaves (Figure 2B). Consistent with the DAB staining, the H2O2 content in mil1-1 was significantly higher than that in WT, indicating that H2O2 accumulated to a higher level in mil1-1 (Figure 2C).
In addition, the activities of peroxidase (POD) and catalase (CAT) were examined to explore the effects of mil1-1 mutation on the ROS scavenging system. The results revealed that the activities of POD and CAT were lower in mil1-1 than in WT, suggesting that the ROS scavenging system was weakened by mil1-1, causing the accumulation of ROS (Figure 2D,E).
To confirm whether the lesions in the leaf blade of mil1-1 indicated cell death, trypan blue staining was conducted. Cells in the spotted region of the mil1-1 leaves turned dark blue when the leaves were stained with trypan blue, whereas no dark blue spots were observed in WT leaves, indicating irreversible membrane damage or cell death in the spotted leaves of mil1-1 (Figure 2F). By using a terminal deoxynucleotidyl transferase-mediated dUTP nick-end labeling (TUNEL) method, DNA fragmentation, which is a PCD indicator, was detected. TUNEL signals were observed in mil1-1 but not in WT plants (Figure 2G). These results indicated that ROS accumulation was closely related to cell death and the lesion mimic phenotype in mil1-1.

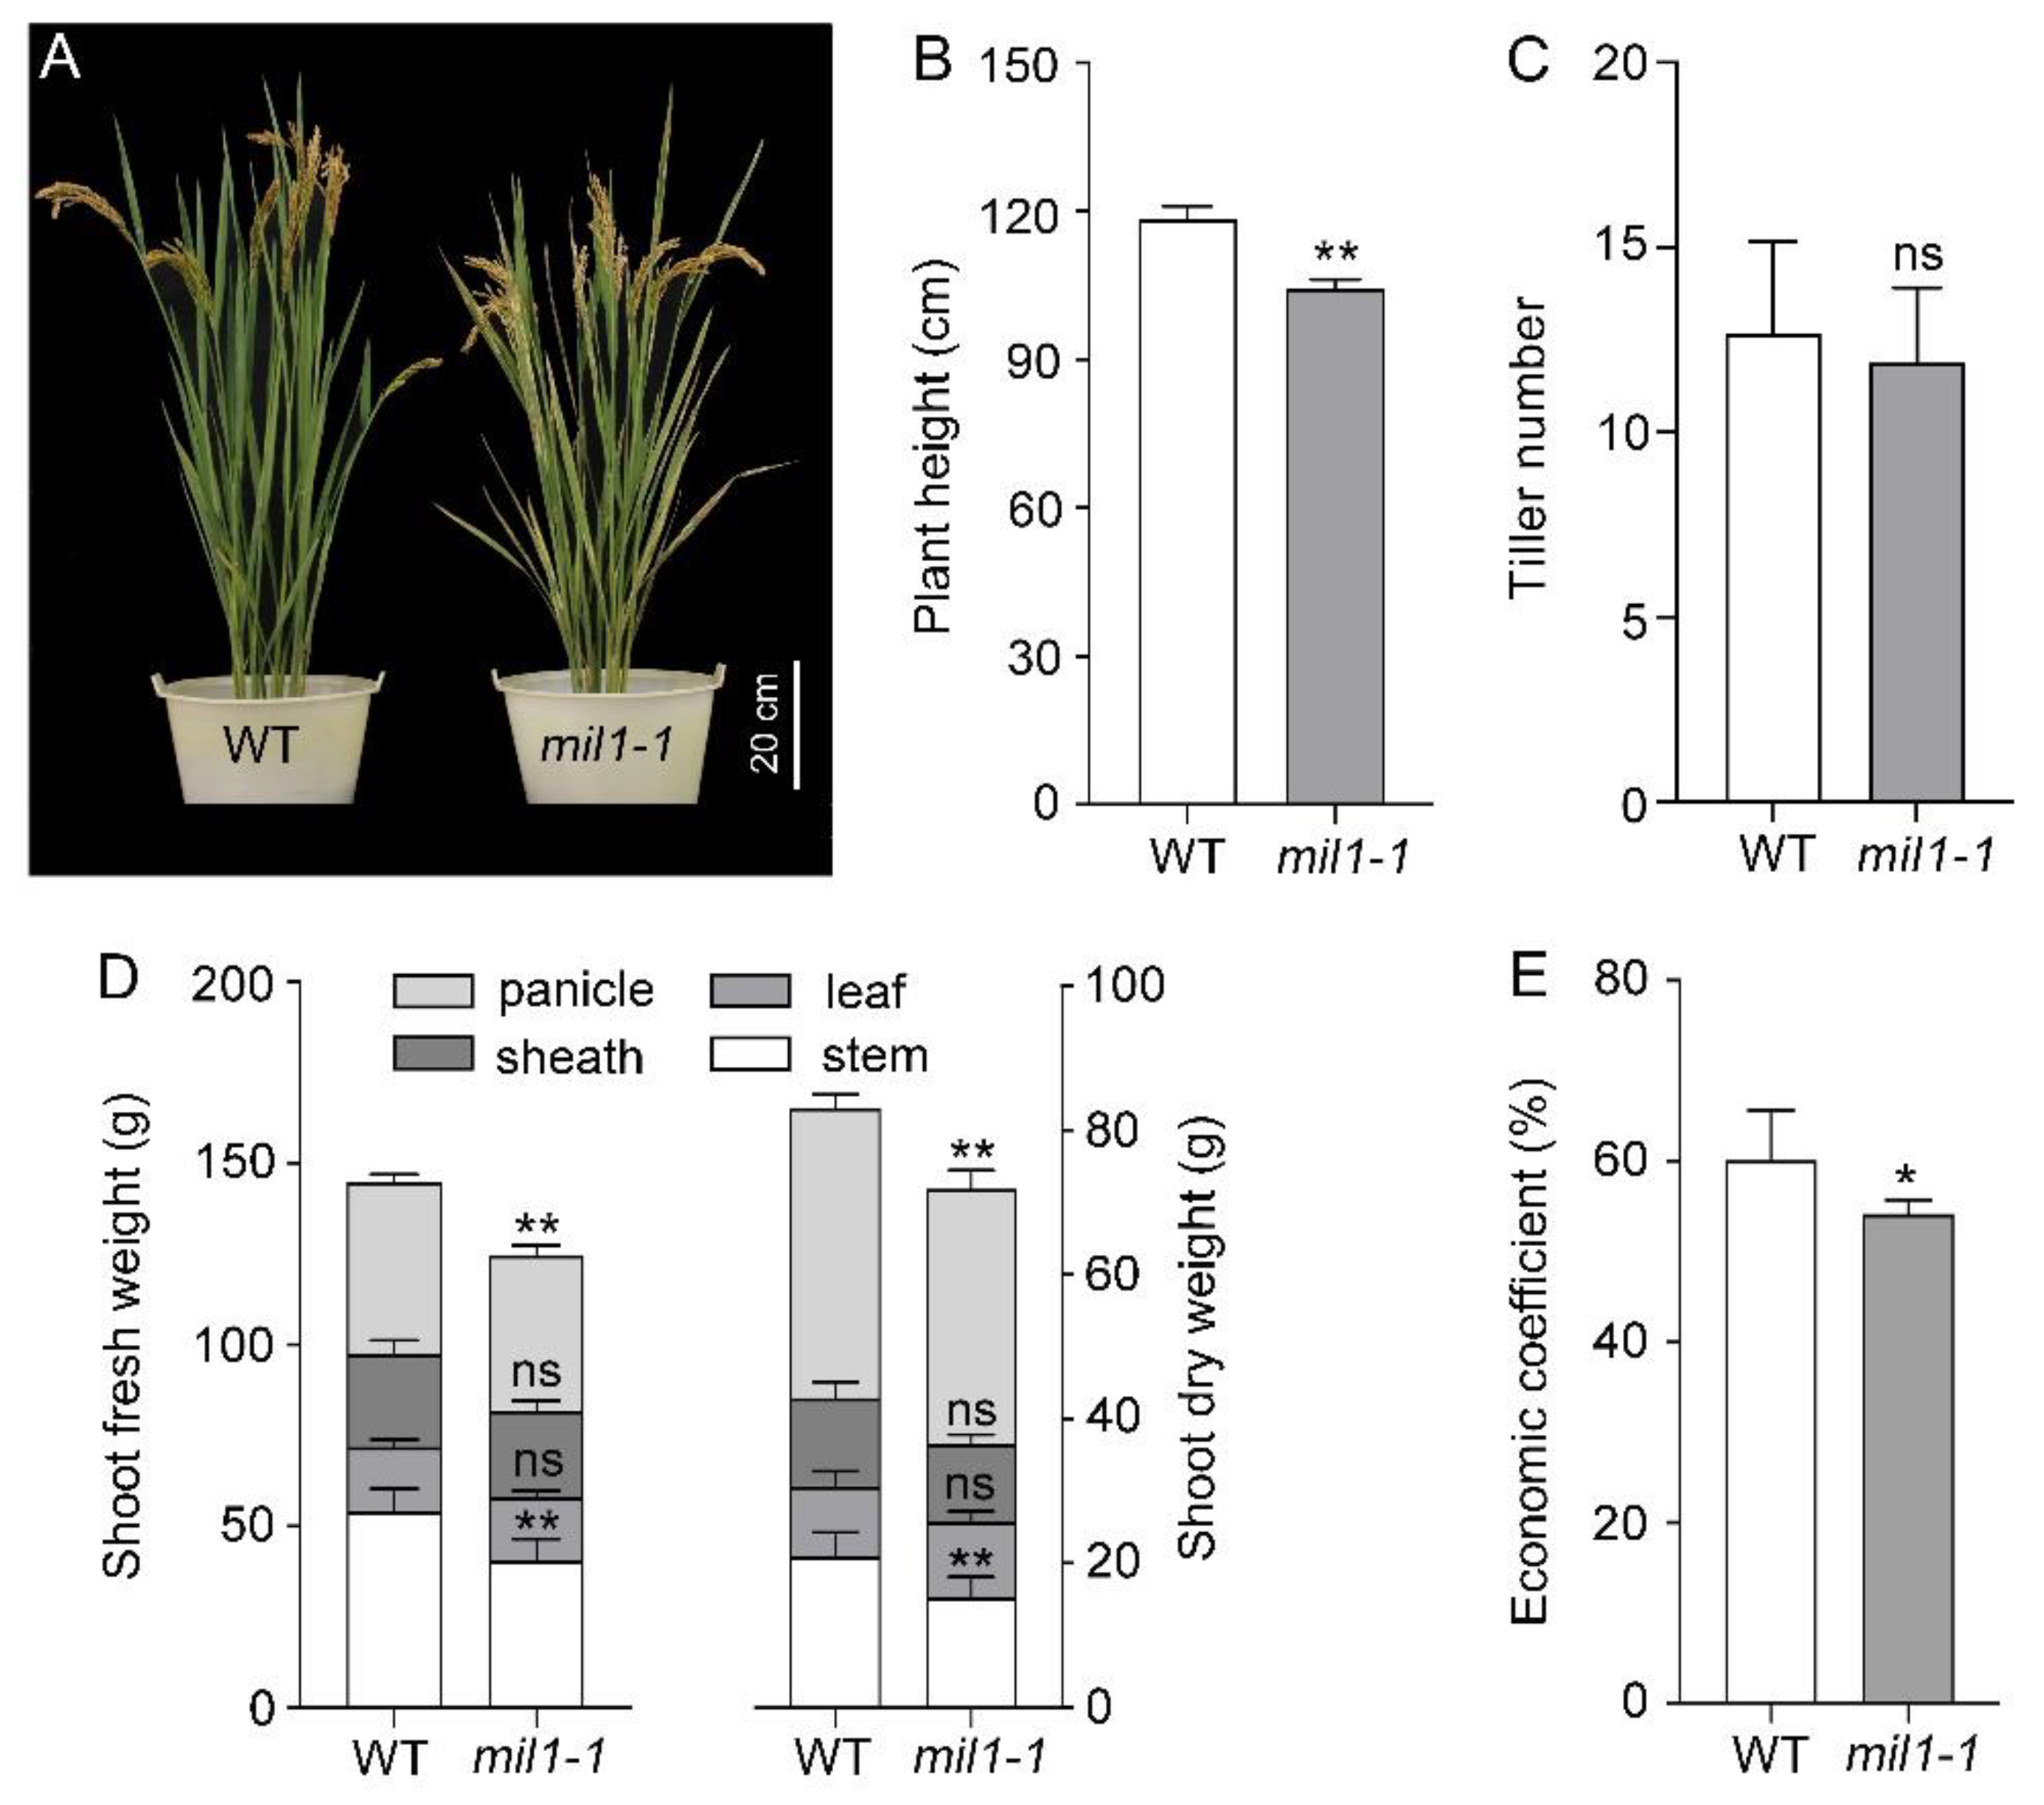
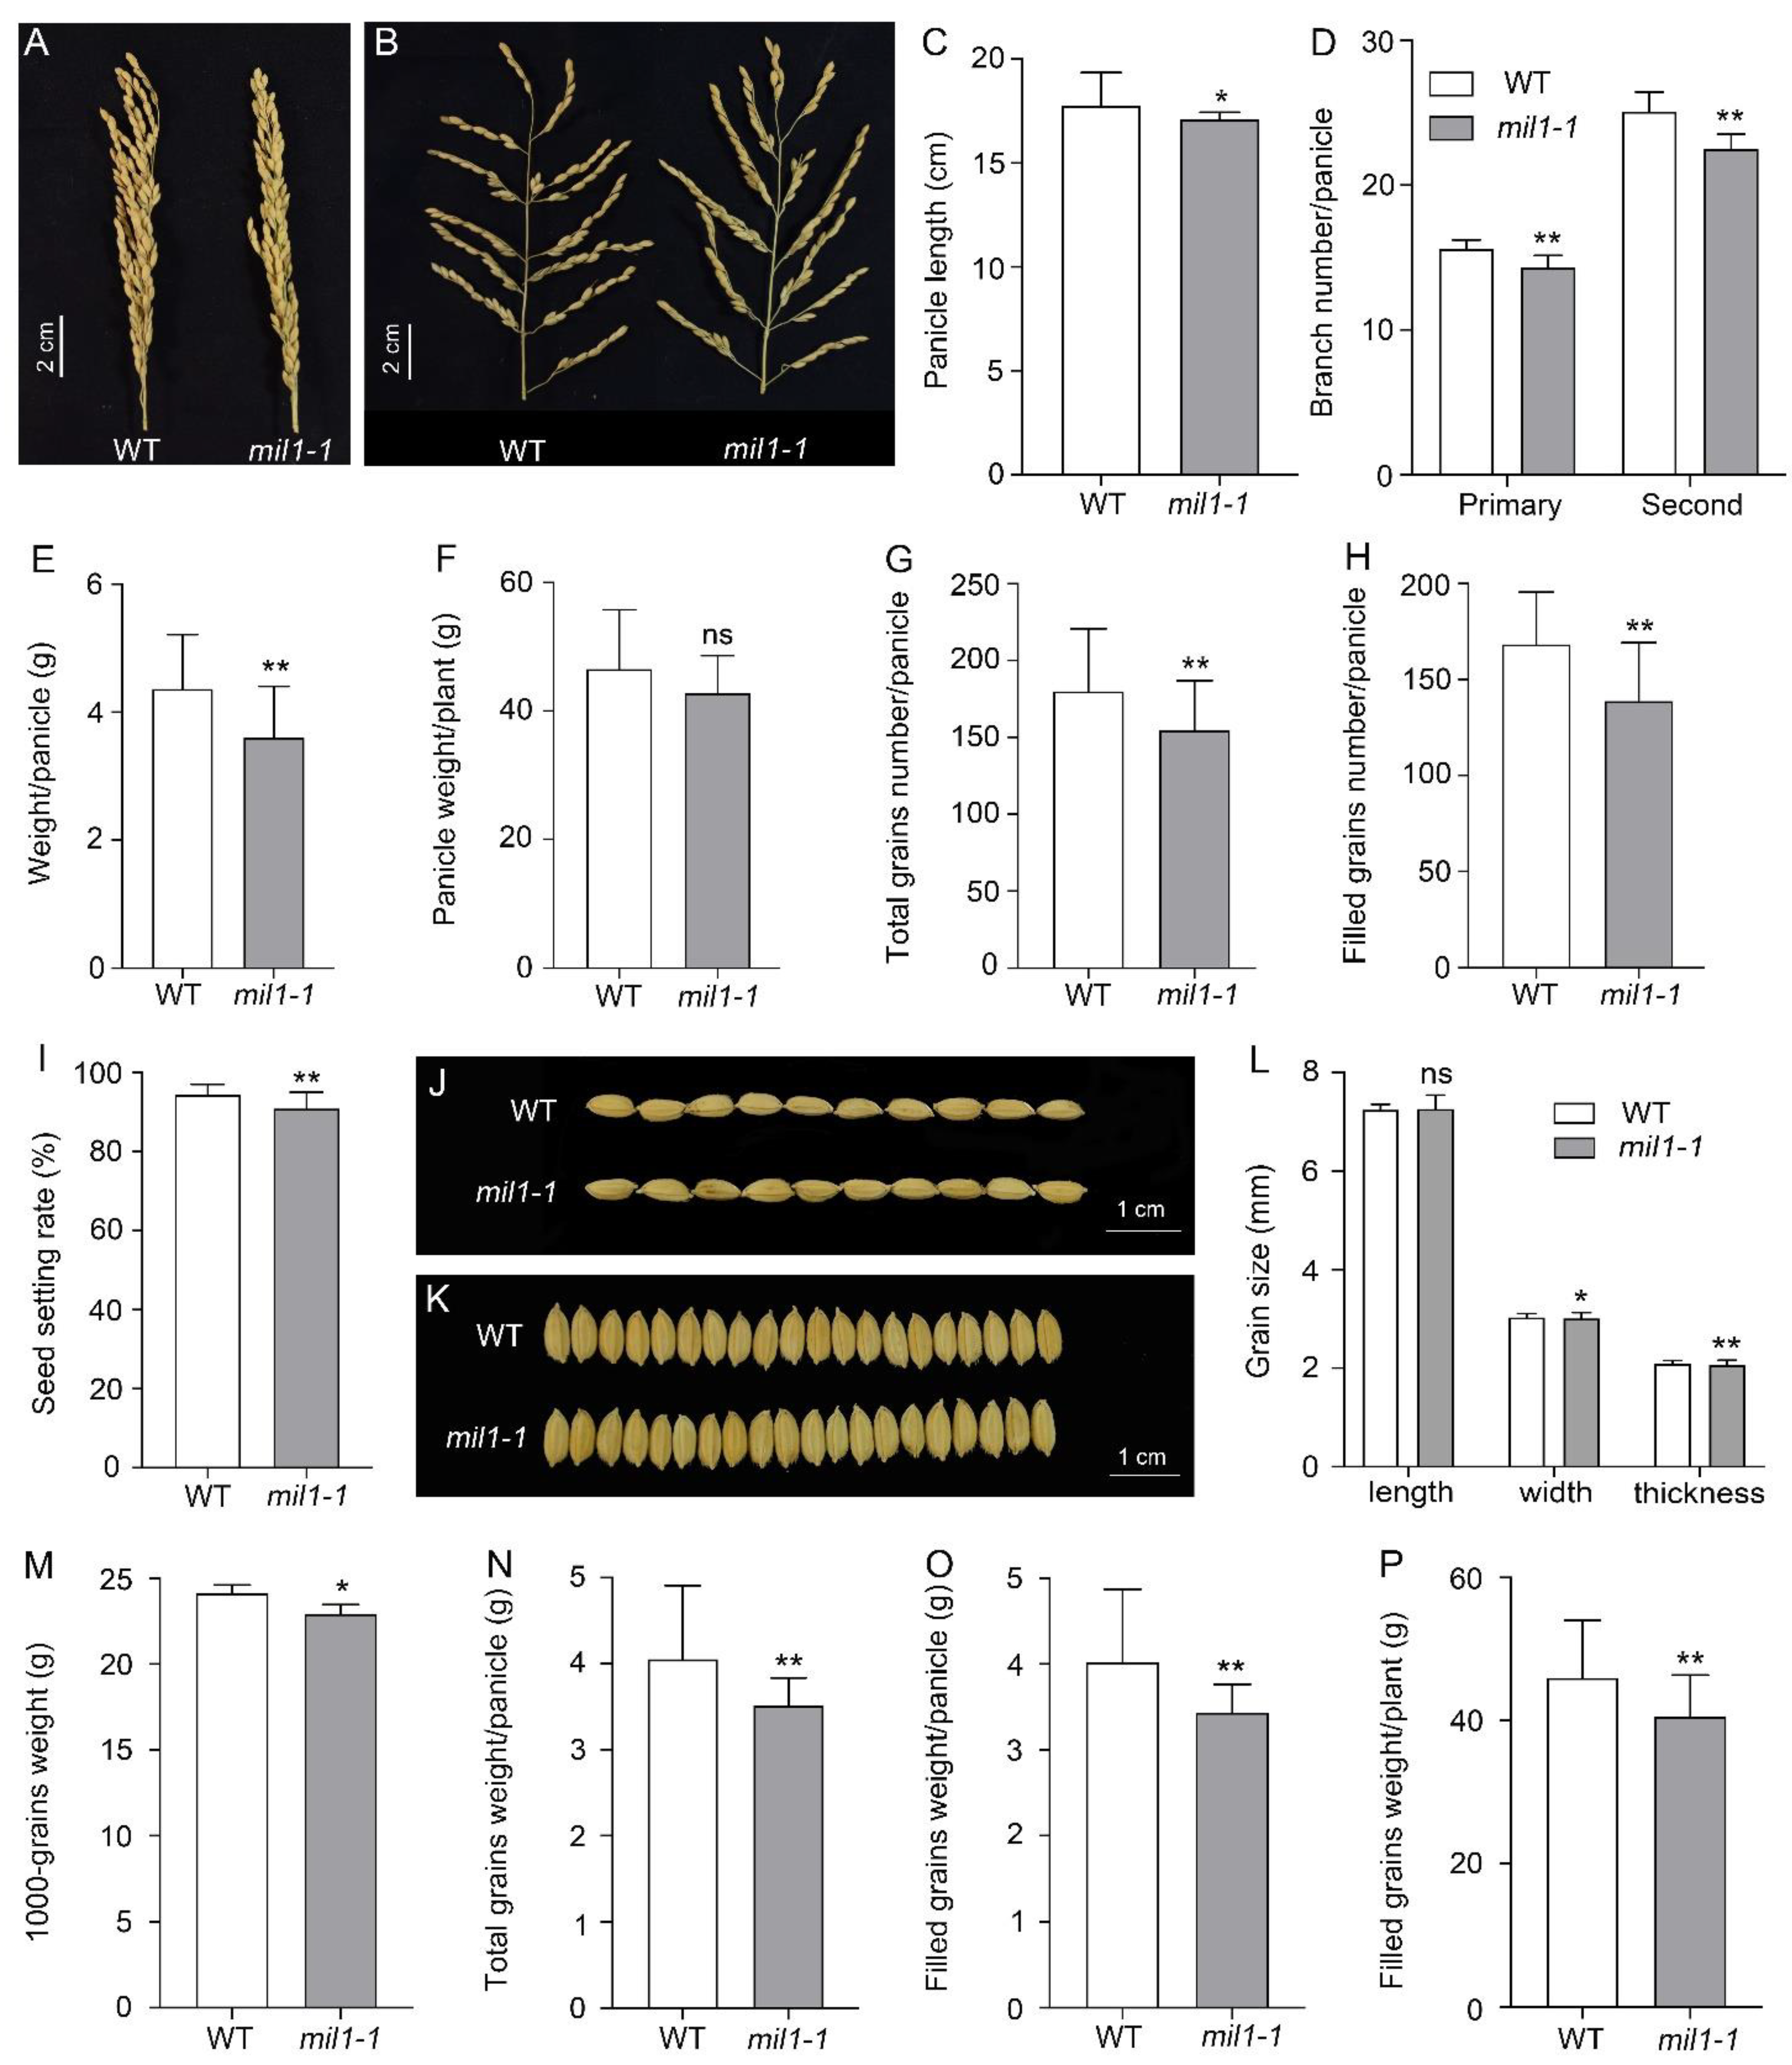
2.3. Mil1-1 Mutation Impacts Pleiotropic Agronomic Traits

To analyze the effects of mil1-1 mutation on rice yield, agronomic traits were investigated. The plant height of mil1-1 was significantly shorter than that of the WT (Figure 3A,B), and the number of tillers was reduced in mil1-1 (Figure 3C). To determine whether mil1-1 affected biomass production, the dry weight and fresh weight of different organs above ground were measured. Compared to WT, dry matter accumulation was significantly reduced in mil1-1, especially the dry weight of the stem and panicle. Similarly, the fresh weight of mil1-1 was significantly lower than that of WT (Figure 3D). The economic coefficient of mil1-1 was lower than that of WT (Figure 3E).
In addition, we examined the panicle and grain traits in this study. The pleiotropic traits of mil1-1, including panicle length, primary and secondary branch number, total grain number, filled grain number, seed-setting rate, 1000-grain weight, grain width, and grain thickness, were significantly decreased compared to those of WT (Figure 4A–O). The grain yield per plant was significantly reduced via mil1-1 mutation (Figure 4P). Taken together, these results suggest that the spontaneous lesion mimic phenotypes of mil1-1 are accompanied by significant decreases in major agronomic traits.

2.4. Mutation of MIL1 Enhances Bacterial Blight Resistance

In some spotted leaf mutants of rice, activation of the immune response and enhanced resistance to pathogen infection were previously reported [15]. To explore whether mil1-1 mutant also exhibits disease resistance phenotypes, we inoculated mil1-1 mutant, WT, and Li Jiang Hei Gu (LJHG, a variety susceptible to a wide variety of pathogens) with the bacterial blight (Xanthomonas oryzae pv. Oryzae, Xoo) isolate Zhe173, which is virulent against WT. The results showed that mil1-1 mutation conferred disease-resistant phenotypes against bacterial blight (Figure 5A). The disease incidence rate and the lesion length in mil1-1 were higher and longer than those in WT (Figure 5B,C).
Activation of defense response genes was previously observed during the development of lesions in some rice lesion mimic materials [2,23,25,26]. To investigate whether defense response genes are activated in mil1-1 mutant, the expression of defense response genes, including three pathogen response (PR) genes (PR1a, PR1b, and PBZ1/PR10) and two pathogen-induced peroxidase genes (POX1/POX22.3 and PO-C1), was examined using RT-qPCR before and after lesion formation in mil1-1. Before lesion formation, expression of the five defense response genes was lower than that of WT (Figure 5D–H); however, after lesion developed on the leaves of mil1-1, expression of the genes was strongly induced by mil1-1, with significantly higher results than those in WT (Figure 5I–M). These results indicate that the mutation of MIL1 activates the expression of defense response genes after lesion formation and enhances disease resistance to bacterial blast.

2.5. Mil1-1 Is a Novel Allelic Mutation at OsHPL3 Locus

In order to clone the mil1-1 mutation, a genetic analysis was performed. The mil1-1 mutant was crossed to WT. All the first filial generation (F1) hybrids showed normal phenotypes (i.e., the mil1-1 phenotype was not observed in F1). In the second generation (F2) segregation population, 210 plants exhibited the mil1-1 phenotype, and 593 plants showed a normal phenotype. The ratio of individuals with a normal phenotype to those with the mil1-1 phenotype was 2.81:1, χ2 = 0.5683 < χ2 (P0.05,1 = 3.84), indicating good agreement with the expected value of 3:1. These results indicate that mil1-1 is a single recessive mutation (Table 1).
Since japonica and indica rice are subspecies of cultivated rice, molecular polymorphisms between their genomes are more abundant. To isolate the MIL1 gene, an F2 segregation population was created by crossing mil1-1 (in japonica background) with the indica variety Habataki to facilitate developing molecular markers for map-based cloning of mil1-1. Bulked Segregant Analysis (BSA) was used to preliminarily locate the mil1-1 mutation. In the F2 segregation population, 41 individuals with the mil1-1 mutant phenotype were selected to create a DNA pool. DNA from the F1 plants (mil1-1 × Habataki hybrid) was used as a control. Polymorphic molecular markers evenly distributed on the genome, such as InDel and SSR markers, were used for preliminary mapping. The results showed that mil1-1 was mapped between G2-1 and B2-3 molecular markers on chromosome 2 (Figure 6A). By using 251 individuals with the mil1-1 mutant phenotype in the F2 population, the MIL1 locus was fine-mapped to a 243 kb region flanked by the GN2-1 and GN2-2 markers, in which there were 18 open reading frames (ORFs). The ORFs in the region were then sequenced. A single base substitution (G to A) at 751 bp downstream of ATG was identified in ORF3 (Os02g0110200), which changed the codon from GGG to AGG, causing a shift of glycine (Gly) to arginine (Arg) (Figure 6A,B).
To verify whether the mutation of MIL1 was responsible for the lesion mimic phenotype of mil1-1, a complementary test was performed by transforming the 35S:MIL1-GFP plasmid into mil1-1. All of the independent transgenic lines exhibited a rescued phenotype; three of them (C-1, C-2, and C-3 complementary transgenic lines) were chosen for further study. The spontaneous lesion mimic phenotype of mil1-1 was rescued in the three complementary transgenic lines, confirming that the missense point mutation in Os02g0110200 locus confers the phenotype of mil1-1 (Figure 6C,D). The Os02g0110200 gene encodes Hydroperoxide Lyase 3 (OsHPL3) protein belonging to the cytochrome P450 superfamily.
Genes regulating tolerance to abiotic stresses are commonly activated by stress conditions. Crosstalk usually exists in tolerance to biotic and abiotic stresses. MIL1 is involved in resistance to bacterial blight, implying that MIL1 may be associated with tolerance to abiotic stresses. To study whether MIL1 is induced under stress conditions, 14-day-old seedlings were sampled to determine the expression of MIL1/OsHPL3 responses to jasmonic acid (JA), salicylic acid (SA), abscisic acid (ABA), salt, and wounding. The results showed that MIL1/OsHPL3 was obviously induced by the treatments, suggesting that MIL1 may be related to tolerance to abiotic stresses (Figure 6E).

3. Discussion

Almost all of the spontaneous spotted leaf mutants or lesion mimic mutants display similar phenotypes without pathogen attack in rice though the color, size, shape of the spots, and functions of mutations differ one from the other. They play important roles in deciphering the mechanisms of ROS accumulation, PCD formation, leaf senescence, and defense response [6]. In this study, a novel allele of lesion mimic mutant, mil1-1, was characterized.

3.1. Mutation of MIL1 Increases the Accumulation of ROS Causing Spontaneous Lesions in Leaves

Lesion mimic mutants have been extensively studied to reveal the principles of ROS burst and PCD in rice [6]. Cells in the region of the spontaneous lesions usually undergo PCD triggered by the accumulation of ROS [27,28]. In this study, abnormal accumulation of ROS was observed in mil1-1 through histochemical staining and a chemical assay (Figure 2A–C). The eruption of ROS destroyed the chloroplasts and leaf cells, causing PCD and lesion formation in the leaves of mil1-1 (Figure 1A–C and Figure 2F,G).
The ROS are formed in organelles during electron transport reactions in photosynthesis and respiration and also as byproducts of enzymatic reactions in photorespiration and other metabolic processes. Plants produce more ROS under light than under shade or dark conditions [29]. If the ROS scavenging system is disrupted or weakened, ROS will accumulate to damage the cells. This phenomenon is consistent with our observation that the spot formation in mil1-1 was light-intensity dependent, as no lesions formed in mil1-1 under shade conditions (Figure 1D). The activities of ROS scavenging enzymes, such as POD and CAT, were reduced in mil1-1, resulting in elevated levels of ROS in mil1-1 leaves (Figure 2D,E).

3.2. Mutation of MIL1 Leads to Auto-Activation of Defense Response in Rice

Like other plants, rice is exposed to diverse pathogens. To counter the challenges of pathogenic infection, rice has developed immune systems to recognize and counteract these pathogens to ensure survival [30]. Two layers of immune systems have evolved in plants and rice. Pattern recognition receptors (PRRs) on the cell surface trigger the primary immune response or pattern-triggered immunity (PTI), whereas intracellular nucleotide-binding oligomerization domain-containing-leucine rich repeat (NLR) proteins act as factors that recognize effectors secreted by pathogens and induce effector-triggered immunity (ETI) [31,32]. Defense responses, including HR, ROS burst, Ca2+ influx, kinase activation, and transcriptional activation of defense response genes, act against pathogen attacks [33].
In this study, we found that the spontaneous lesions in mil1-1 leaves without pathogen infection were HR-like (Figure 2F,G). Moreover, the mil1-1 mutant exhibited resistance to bacterial blight (Figure 5A–C). The expression of defense response genes was significantly activated in mil1-1 after lesions were well-developed (Figure 5I–M). These results suggest that the auto-activation of defense responses in mil1-1, including higher accumulation of ROS and PCD, are responsible for the resistance of mil1-1 to disease, which is consistent with previous reports [16,19].

3.3. Mil1-1 Retards Development and Reduces Grain Yield of Rice

Plant immune systems are accurately regulated by multiple negative regulators to avoid unnecessary defense activation. The immune regulators maintain an inactive status in the absence of pathogens and become activated only upon pathogenic challenges. However, loss-of-function mutations of the negative regulators or gain-of-function mutations of positive regulators, such as NLRs, can trigger defense activation, resulting in autoimmunity. Auto-activation of the defense system is usually accompanied by yield reduction [34,35].
In this study, pleiotropic agronomic traits were affected by mil1-1, and the plant height and biomass production were reduced in mil1-1 (Figure 3A,B,D). Panicle traits, such as the panicle length, panicle weight, and the number of primary and secondary branches, decreased in mil1-1 compared to WT (Figure 4A–E). The total grain number, filled grain number, seed setting rate, and 1000-grain weight in mil1-1 were lower than those in WT, causing a reduced per-plant grain yield of mil1-1 (Figure 4). The retarded development and reduced grain yield in mil1-1 may be related to the auto-activation of defense responses because this process consumes energy [36]. Suppressing the continuous activation of resistant mechanisms adopted by plant species against pathogens is thus a wise option to protect plants from yield penalties.

3.4. Mutation of MIL1 Is a Novel Missense Point Mutation of OsHPL3

Mutation of the MIL1 locus was previously reported as hpl3-1 and cea62 [37,38]. The hpl3-1 mutant, with a transposon insertion in its coding region, showed a lesion-like phenotype in the leaves of 2-week-old seedlings and onwards [38]. The cea62 is another mutation at OsHPL3, in which tyrosine (Tyr) at 382 amino acid is changed to a stop codon [37]. These mutants lack hydroperoxide lyase activity. In this study, the mil1-1 mutation was isolated using the map-based cloning approach. One base pair G to A mutation at 751 bp downstream of ATG was found in MIL1 (Os02g0110200) locus, which resulted in the replacement of Gly at the 295 amino acid with Arg (G295A) (Figure 6). A single amino acid substitution in the MIL1 alters its functions and confers disease-like phenotypes in mil1-1 mutant.
In conclusion, a novel allele of oshpl3 termed mil1-1 was isolated in this study. The auto-activation of defense responses in mil1-1, including the higher accumulation of ROS and PCD, resulted in resistance to disease and tolerance to salt stress. Although lesion mimic mutants of rice have undesirable agronomic traits, the genetic principles of lesion-like phenotypes can be used to obtain high grain yields by deciphering the efficiency of photosynthesis, disease resistance, and environmental stress responses. Disease-like spot mutants are invaluable germplasm resources for disease-resistance breeding in rice.

4. Materials and Methods

4.1. Plant Materials, Growth Conditions, and Agronomic Trait Evaluation

The japonica rice variety Shen Nong 9816 (SN9816), the Japanese indica variety Habataki, and the mil1-1 mutant were used as materials in this study. SN9816 was used as the wild type (WT) to produce a population for genetic analysis. Habataki was used to generate the mapping population. The mil1-1 mutant was obtained by screening the M2 population of EMS mutagenesis [39]. In brief, the seeds of WT were soaked with water. The soaked seeds were then treated using 0.6% EMS. After cleaning with water, the seeds were germinated and sowed on the seedbeds to nurse seedlings. At the four-leaf stage, seedlings were transplanted to a paddy field and labeled as the M1 population. M1 plants were self-pollinated. Seeds from individual M1 plants were harvested to generate the M2 segregation population for mutant screening.
WT and mil1-1 mutant plants were grown on a paddy field in Shenyang, China (Longitude: 123.38° E; Latitude: 41.8° N). Rice seeds used in the experiment were sterilized and germinated under humid conditions at 28–30 °C. After germination, the seeds were sown into seedbeds. Seedlings were then transplanted to the paddy field under natural growth conditions during the four-leaf stage. All materials were grown in the paddy field from April to October.
To measure major agronomic traits, 3 replicates were performed in the paddy field. Twenty plants of WT and mil1-1 were transplanted for each replicate. At the fully mature stage, 5 plants of WT and mil1-1 from each replicate were sampled. A total of 15 plants of WT and mil1-1 were collected. Major agronomic traits, including plant height, number of tillers per plant, panicle length, panicle weight, branch number of panicles, number of filled grains per panicle, seed-setting rate, 1000-grain weight, and seed size, were measured.

4.2. Histochemical Assay

For DAB and NBT staining, leaves of WT and mil1-1 sampled at the same positions during the tillering stage were soaked in 1 mg/mL 3,3′-diaminobenzidine (DAB) and 0.5 mg/mL of nitro-blue tetrazolium chloride (NBT) staining solution. The samples were stained for 12 h at room temperature, washed with water, and decolorized with fresh 95% ethanol. H2O2 and O2− accumulation was observed under a microscope.
For trypan blue staining, leaves of WT and mil1-1 in the same leaf position at the tillering stage were immersed in trypan blue staining solution. The samples were boiled in boiling water for 5 min and then left at room temperature in the dark for 12 h. The leaves were decolorized with 2.5 mg/mL chloral hydrate, blotted dry, and photographed under a stereomicroscope to observe the cell death phenomenon. Three biological replicates were performed during the histochemical assay.

4.3. Apoptosis Assay

To prepare the paraffin sections, the following procedure was used. Five to ten mm leaves from the spotted parts of mil1-1 and the same parts of WT were sampled at the tillering stage. Then the samples were fixed in an FAA fixation solution containing formalin, acetic acid, and ethanol. After 24 h of fixation, the samples were sequentially immersed in 50%, 70%, 85%, 95%, 100%, and 100% ethanol for dehydration. Then, the samples were made transparent with xylene. After making the sample transparent, the samples were soaked in wax. After wax impregnation, the samples were embedded by packing the wax blocks for slicing. Then, the wax-wrapped samples were cut to the required thickness with a slicer. Next, the slices were placed on a slide for further study.
A TUNEL Apoptosis Assay Kit (One Step) (Beyotime, Shanghai, China, Cat. C1086) was used to detect DNA fragmentation. The paraffin sections were processed according to the instructions of the kit. In brief, the tissue sections were deparaffinized with xylene. After deparaffinization, the tissue sections were rehydrated in decreasing concentrations of ethanol (i.e., 100%, 95%, 85%, and 70%). After permeabilization with proteinase K, we washed the slides in a PBS buffer. PI and TUNEL detecting solutions were then added to the slides to label DNA and DNA fragments. Then, the signals of PI and TUNEL were observed under a confocal laser scanning microscope.

4.4. POD, CAT Activity Detection, and H2O2 Determination

Fresh leaves of WT and mil1-1 at the tillering stage (DAS60) were selected for analysis using the protocol provided by the assay kit (Nanjing Jiancheng Institute of Biological Engineering, Nanjing, China). Peroxidase (POD) and catalase (CAT) activities and H2O2 content were measured according to the instructions of the kit (Cat. A007-1-1, A084-3-1, and A064-1-1). Three biological replicates were performed for each measurement. The protocols to examine POD and CAT enzyme activity and H2O2 concentration were as follows.
To analyze POD enzyme activity (Cat. A084-3-1), we weighed 0.2 g of leaves precisely, and a 1.8 mL physiological saline homogenous medium was added. The mixture was then homogenized in an ice water bath, and the homogenate was centrifuged at 3500 rpm for 10 min. We then extracted the supernatant for measurement by adding the proper amount of Reagent I to III provided by the kit. We mixed and incubated the solution in a water bath at 37 °C for 30 min. Then, Reagent IV was added. The mixture was then mixed thoroughly and centrifuged at 3500 rpm for 10 min. The supernatant was extracted, and the optical density (OD) value of each tube was measured at 420 nm with a 1 cm path length. The protein concentration of the samples was measured via the standard curve method. POD enzyme activity was calculated with the following formula:
POD   Enzyme   Activiy U / mg   prot = OD Sample   OD Reference MAC   × Path   Length 1   cm × V total ( 4.0 mL ) V sample ( 0.1 mL )   ÷   t 30   min × 1000   ÷   C Protein mg / mL
Note:
  • MAC represents the milli-molar attenuation coefficient and is 12.0 mM−1·cm−1.
  • One enzyme activity unit is defined as 1 μg substrate catalyzed per minute by enzymes within 1 mg tissue samples at 37 °C.
To analyze CAT enzyme activity (Cat. A007-1-1), we weighed 0.2 g of leaves precisely and added 1.8 mL physiological saline homogenous medium. We then homogenized the mixture in an ice water bath and centrifuged the homogenate at 2500 rpm for 10 min. We extracted the supernatant for measurement by adding the proper amount of Reagent 1 and 2 provided by the kit. The solution was mixed and incubated in a water bath at 37 °C for 1 min. Then, we added Reagents 3 and 4 and mixed the solution sufficiently. Next, the mixture was transferred into cuvettes with a 0.5 cm light path, and the OD values of all tubes were measured at 405 nm. CAT enzyme activity was calculated with the following formula:
CAT   Enzyme   Activiy U / mg   prot = ( OD Reference   OD Sample ) × 271 × 1 60 ×   V sample   ÷   C Protein mg / mL
Note:
  • 271 is reciprocal value of slope.
  • 1 µmol H2O2 decomposing per mg tissue protein per second is considered as 1 activity unit (U).
To analyze H2O2 concentration (Cat. A007-1-1), we weighed 0.2 g leaves precisely and added 1.8 mL physiological saline homogenous medium. The mixture was homogenized in an ice water bath, and the homogenate was centrifuged at 1000 rpm for 10 min. Then, the supernatant was extracted for measurement by adding the proper amount of pre-warmed Reagent I, H2O2 Standard Solution (163 mM H2O2), and Reagent II provided by the kit. The mixture was blended and transferred into cuvettes with a 1 cm light path. Then, the OD values of all tubes were measured at 405 nm. The H2O2 concentration was calculated with the following formula:
H 2 O 2   Content mmol / g   prot = OD Sample   OD Blank OD Standard   OD Blank × C Standard 163   mM   ÷   Protein   Content g / L

4.5. Bacterial Inoculation

At the tillering stage, leaves of WT and mil1-1 were infected with Xanthomonas oryzae pv. oryzae (Xoo)to assess bacterial blight resistance. Xoo isolates of Zhe173, which are virulent to the WT, were used to assess the resistance of mil1-1 plants to blight disease via the scissor-dipping method as described previously [40]. The strains were separately suspended in distilled water and adjusted to 109 viable cells/mL (OD600 = 1) [17]. Inoculation was performed by dipping scissors into the bacterial solution and cutting off about 2 cm of the leaf tips of the WT and mil1-1. Three distinct plants with at least three tillers from each plant were inoculated for each isolate. The disease incidence rate and lesion lengths were measured 2 weeks after inoculation. Three biological replicates were performed.

4.6. Gene Expression Analysis

To determine the expression of PR genes, the WT and mil1-1 leaves were sampled at the seedling stage (14 days after sowing, DAS) before lesion formation and at the tillering stage (56 days after sowing) after lesion formation. Gene expression was examined using the method described previously [41,42]. In brief, total RNA was extracted from 100 mg of 14-day-old seedlings and adult rice plants using Takara RNAiso Plus (Takara Bio Inc., Otsu, Japan, Cat. No. 9108) for real-time RT-PCR. DNA contaminated in the isolated RNA was removed with RQ1 RNase-free DNase I (Promega, Madison, WI, USA, Cat. No. M6101). Three micrograms of RNA were used for first-strand cDNA synthesis with a RevertAid First Strand cDNA Synthesis Kit (Thermo Scientific, Waltham, MA, USA; Cat. No. K1621). Real-time RT-PCR was performed using Takara TB green premix Ex Taq (TB green premix Ex Taq, Takara Bio Inc., Cat. No. RR420A) and an Applied Biosystems QuantStudio 5 Real-Time PCR Instrument (Applied Biosystems, Foster City, CA, USA). For each sample, three technical replicates were created. Primers used in the assay are listed in Table 2. A total of three biological replicates were carried out. OsACT1 (Os03g0718100) was employed as an endogenous control. The 2−delta Ct formula was used to calculate the relative expression levels of genes. Primers used in the assay are listed in Table 2.

4.7. Genetic Analysis of mil1-1 Mutation and Map-Based Positional Cloning of MIL1

To perform the genetic analysis, the mil1-1 mutant was crossed with the WT to produce F1; then, F1 individuals were self-pollinated to create F2. The F2 population was used for the segregation analysis of mil1-1 mutations. The total number of plants and number of plants with mil1-1 phenotypes were counted for the segregation ratio analysis and χ2 test.
To generate the mapping population of mil1-1 (japonica rice background), the mil1-1 mutant was crossed with the Japanese indica rice variety Habataki to produce F1; then, the F1 individuals were self-pollinated to produce F2. The segregated F2 population was utilized to positionally clone the mil1-1 mutation. About 50 individual plants with the mil1-1 mutant phenotype in the F2 population were used for primary mapping via BSA. Fine mapping was conducted by developing markers in the region of the mil1-1 mutation and enlarging the mapping population. After the mapping region was narrowed down, the PCR-sequencing strategy was used to find the mutation locus in mil1-1.

4.8. Complementary Test of MIL1

For the complementary test, a 1464 bp MIL1/OsHPL3 CDS fused to Green Fluorescence Protein (GFP) driven by the Cauliflower Mosaic Virus (CaMV) 35S constitutive promoter was cloned into the pCambia1300 binary vector. Then, the resulting 35S:MIL1c-GFP plasmid was introduced into the mil1-1 mutant via the agrobacterium (Agrobacterium tumefaciens)-mediated transformation of mature rice embryos as described previously [39,43]. In the T2 and T3 generations, we observed the phenotypes of complementary transgenic lines containing the 35S:MIL1c/OsHPL3c-GFP construct.

4.9. Hormone and Stress Treatments

Two-week-old seedlings were treated with SA (100 µmol L−1), JA (100 µmol L−1), ABA (100 µmol L−1), NaCl (250 mmol L−1), and wound treatments for 6 h. Then, the treated seedlings were sampled to extract total RNA and conduct gene expression analysis, as described in 4.6. Three biological replicates were performed.

Author Contributions

X.W. designed the study. X.W. screened the mil1-1 mutant. J.S., J.W., F.L. and X.W. developed molecular markers. Y.S., H.Z. and B.Y. cloned the MIL1 gene, performed the histochemical analysis, agronomic traits observation, plasmid construction, transformation, and pathogen inoculation. Y.W. prepared the pathogen and perform inoculation. B.Y. performed the total RNA extraction and quantitative RT-PCR analysis. B.Y. and X.W. analyzed the results and prepared the figures and tables. B.Y. and X.W. wrote the paper. All authors discussed the results and commented on the manuscript. All authors have read and agreed to the published version of the manuscript.

Funding

This research was funded by National Natural Science Foundation of China, grant number 32070642.

Institutional Review Board Statement

Not applicable.

Informed Consent Statement

Not applicable.

Data Availability Statement

All data generated or analyzed during this study are included in this published article.

Acknowledgments

We thank Hongqi Chen at China National Rice Research Institute for kindly providing us with three strains of bacterial blight. We are grateful for the support from the National Natural Science Foundation of China (grant number: 32070642). We thank all the editors and reviewers for their invaluable comment.

Conflicts of Interest

The authors declare no conflict of interest.

References

  1. Qiao, Y.; Jiang, W.; Lee, J.; Park, B.; Choi, M.S.; Piao, R.; Woo, M.O.; Roh, J.H.; Han, L.; Paek, N.C.; et al. SPL28 encodes a clathrin-associated adaptor protein complex 1, medium subunit micro 1 (AP1M1) and is responsible for spotted leaf and early senescence in rice (Oryza sativa). New Phytol. 2010, 185, 258–274. [Google Scholar] [CrossRef] [PubMed]
  2. Shirsekar, G.S.; Vega-Sanchez, M.E.; Bordeos, A.; Baraoidan, M.; Swisshelm, A.; Fan, J.; Park, C.H.; Leung, H.; Wang, G.L. Identification and characterization of suppressor mutants of spl11- mediated cell death in rice. Mol. Plant-Microbe Interact. 2014, 27, 528–536. [Google Scholar] [CrossRef] [PubMed] [Green Version]
  3. Marino, D.; Dunand, C.; Puppo, A.; Pauly, N. A burst of plant NADPH oxidases. Trends Plant Sci. 2012, 17, 9–15. [Google Scholar] [CrossRef] [PubMed]
  4. Hoang, T.V.; Vo, K.T.X.; Rahman, M.M.; Choi, S.H.; Jeon, J.S. Heat stress transcription factor OsSPL7 plays a critical role in reactive oxygen species balance and stress responses in rice. Plant Sci. 2019, 289, 110273. [Google Scholar] [CrossRef] [PubMed]
  5. Danon, A.; Miersch, O.; Felix, G.; Camp, R.G.; Apel, K. Concurrent activation of cell death-regulating signaling pathways by singlet oxygen in Arabidopsis thaliana. Plant J. 2005, 41, 68–80. [Google Scholar] [CrossRef]
  6. Kang, S.G.; Lee, K.E.; Singh, M.; Kumar, P.; Matin, M.N. Rice Lesion Mimic Mutants (LMM): The Current Understanding of Genetic Mutations in the Failure of ROS Scavenging during Lesion Formation. Plants 2021, 10, 1598. [Google Scholar] [CrossRef] [PubMed]
  7. Shen, X.; Liu, H.; Yuan, B.; Li, X.; Xu, C.; Wang, S. OsEDR1 negatively regulates rice bacterial resistance via activation of ethylene biosynthesis. Plant Cell Environ. 2011, 34, 179–191. [Google Scholar] [CrossRef]
  8. Ma, H.; Li, J.; Ma, L.; Wang, P.; Xue, Y.; Yin, P.; Xiao, J.; Wang, S. Pathogen-inducible OsMPKK10.2-OsMPK6 cascade phosphorylates the Raf-like kinase OsEDR1 and inhibits its scaffold function to promote rice disease resistance. Mol. Plant 2021, 14, 620–632. [Google Scholar] [CrossRef]
  9. Kim, J.A.; Cho, K.; Singh, R.; Jung, Y.H.; Jeong, S.H.; Kim, S.H.; Lee, J.E.; Cho, Y.S.; Agrawal, G.K.; Rakwal, R.; et al. Rice OsACDR1 (Oryza sativa accelerated cell death and resistance 1) is a potential positive regulator of fungal disease resistance. Mol. Cells 2009, 28, 431–439. [Google Scholar] [CrossRef] [PubMed]
  10. Wang, S.H.; Lim, J.H.; Kim, S.S.; Cho, S.H.; Yoo, S.C.; Koh, H.J.; Sakuraba, Y.; Paek, N.C. Mutation of SPOTTED LEAF3 (SPL3) impairs abscisic acid-responsive signalling and delays leaf senescence in rice. J. Exp. Bot. 2015, 66, 7045–7059. [Google Scholar] [CrossRef] [Green Version]
  11. Zhang, Y.; Liu, Q.; Chen, Y.; Yu, N.; Cao, Y.; Zhan, X.; Cheng, S.; Cao, L. LMM24 Encodes Receptor-Like Cytoplasmic Kinase 109, Which Regulates Cell Death and Defense Responses in Rice. Int. J. Mol. Sci. 2019, 20, 3243. [Google Scholar] [CrossRef] [Green Version]
  12. Song, G.; Kwon, C.T.; Kim, S.H.; Shim, Y.; Lim, C.; Koh, H.J.; An, G.; Kang, K.; Paek, N.C. The Rice SPOTTED LEAF4 (SPL4) Encodes a Plant Spastin That Inhibits ROS Accumulation in Leaf Development and Functions in Leaf Senescence. Front. Plant Sci. 2018, 9, 1925. [Google Scholar] [CrossRef] [PubMed]
  13. Zhu, X.; Yin, J.; Liang, S.; Liang, R.; Zhou, X.; Chen, Z.; Zhao, W.; Wang, J.; Li, W.; He, M.; et al. The Multivesicular Bodies (MVBs)-Localized AAA ATPase LRD6-6 Inhibits Immunity and Cell Death Likely through Regulating MVBs-Mediated Vesicular Trafficking in Rice. PLoS Genet. 2016, 12, e1006311. [Google Scholar] [CrossRef] [PubMed] [Green Version]
  14. Fekih, R.; Tamiru, M.; Kanzaki, H.; Abe, A.; Yoshida, K.; Kanzaki, E.; Saitoh, H.; Takagi, H.; Natsume, S.; Undan, J.R.; et al. The rice (Oryza sativa L.) LESION MIMIC RESEMBLING, which encodes an AAA-type ATPase, is implicated in defense response. Mol. Genet. Genom. 2015, 290, 611–622. [Google Scholar] [CrossRef]
  15. Wang, S.; Lei, C.; Wang, J.; Ma, J.; Tang, S.; Wang, C.; Zhao, K.; Tian, P.; Zhang, H.; Qi, C.; et al. SPL33, encoding an eEF1A-like protein, negatively regulates cell death and defense responses in rice. J. Exp. Bot. 2017, 68, 899–913. [Google Scholar] [CrossRef] [PubMed]
  16. Qin, P.; Fan, S.; Deng, L.; Zhong, G.; Zhang, S.; Li, M.; Chen, W.; Wang, G.; Tu, B.; Wang, Y.; et al. LML1, Encoding a Conserved Eukaryotic Release Factor 1 Protein, Regulates Cell Death and Pathogen Resistance by Forming a Conserved Complex with SPL33 in Rice. Plant Cell Physiol. 2018, 59, 887–902. [Google Scholar] [CrossRef] [Green Version]
  17. Liu, Q.; Ning, Y.; Zhang, Y.; Yu, N.; Zhao, C.; Zhan, X.; Wu, W.; Chen, D.; Wei, X.; Wang, G.L.; et al. OsCUL3a Negatively Regulates Cell Death and Immunity by Degrading OsNPR1 in Rice. Plant Cell 2017, 29, 345–359. [Google Scholar] [CrossRef] [PubMed] [Green Version]
  18. Zeng, L.R.; Qu, S.; Bordeos, A.; Yang, C.; Baraoidan, M.; Yan, H.; Xie, Q.; Nahm, B.H.; Leung, H.; Wang, G.L. Spotted leaf11, a negative regulator of plant cell death and defense, encodes a U-box/armadillo repeat protein endowed with E3 ubiquitin ligase activity. Plant Cell 2004, 16, 2795–2808. [Google Scholar] [CrossRef] [PubMed] [Green Version]
  19. Ma, J.; Wang, Y.; Ma, X.; Meng, L.; Jing, R.; Wang, F.; Wang, S.; Cheng, Z.; Zhang, X.; Jiang, L.; et al. Disruption of gene SPL35, encoding a novel CUE domain-containing protein, leads to cell death and enhanced disease response in rice. Plant Biotechnol. J. 2019, 17, 1679–1693. [Google Scholar] [CrossRef] [PubMed] [Green Version]
  20. Wang, J.; Ye, B.; Yin, J.; Yuan, C.; Zhou, X.; Li, W.; He, M.; Wang, J.; Chen, W.; Qin, P.; et al. Characterization and fine mapping of a light-dependent leaf lesion mimic mutant 1 in rice. Plant Physiol. Biochem. 2015, 97, 44–51. [Google Scholar] [CrossRef]
  21. Sun, C.; Liu, L.; Tang, J.; Lin, A.; Zhang, F.; Fang, J.; Zhang, G.; Chu, C. RLIN1, encoding a putative coproporphyrinogen III oxidase, is involved in lesion initiation in rice. J. Genet. Genom. 2011, 38, 29–37. [Google Scholar] [CrossRef] [PubMed]
  22. Ruan, B.; Hua, Z.; Zhao, J.; Zhang, B.; Ren, D.; Liu, C.; Yang, S.; Zhang, A.; Jiang, H.; Yu, H.; et al. OsACL-A2 negatively regulates cell death and disease resistance in rice. Plant Biotechnol. J. 2019, 17, 1344–1356. [Google Scholar] [CrossRef] [PubMed]
  23. Wang, Z.; Wang, Y.; Hong, X.; Hu, D.; Liu, C.; Yang, J.; Li, Y.; Huang, Y.; Feng, Y.; Gong, H.; et al. Functional inactivation of UDP-N-acetylglucosamine pyrophosphorylase 1 (UAP1) induces early leaf senescence and defence responses in rice. J. Exp. Bot. 2015, 66, 973–987. [Google Scholar] [CrossRef] [PubMed] [Green Version]
  24. Chen, Z.; Chen, T.; Sathe, A.P.; He, Y.; Zhang, X.B.; Wu, J.L. Identification of a Novel Semi-Dominant Spotted-Leaf Mutant with Enhanced Resistance to Xanthomonas oryzae pv. oryzae in Rice. Int. J. Mol. Sci. 2018, 19, 3766. [Google Scholar] [CrossRef] [PubMed] [Green Version]
  25. Manosalva, P.M.; Bruce, M.; Leach, J.E. Rice 14-3-3 protein (GF14e) negatively affects cell death and disease resistance. Plant J. 2011, 68, 777–787. [Google Scholar] [CrossRef] [PubMed]
  26. Zhao, J.; Liu, P.; Li, C.; Wang, Y.; Guo, L.; Jiang, G.; Zhai, W. LMM5.1 and LMM5.4, two eukaryotic translation elongation factor 1A-like gene family members, negatively affect cell death and disease resistance in rice. J. Genet. Genom. 2017, 44, 107–118. [Google Scholar] [CrossRef] [PubMed]
  27. Van Breusegem, F.; Dat, J.F. Reactive oxygen species in plant cell death. Plant Physiol. 2006, 141, 384–390. [Google Scholar] [CrossRef] [PubMed] [Green Version]
  28. Kabbage, M.; Kessens, R.; Bartholomay, L.C.; Williams, B. The Life and Death of a Plant Cell. Annu. Rev. Plant Biol. 2017, 68, 375–404. [Google Scholar] [CrossRef] [Green Version]
  29. Mignolet-Spruyt, L.; Xu, E.; Idanheimo, N.; Hoeberichts, F.A.; Muhlenbock, P.; Brosche, M.; Van Breusegem, F.; Kangasjarvi, J. Spreading the news: Subcellular and organellar reactive oxygen species production and signalling. J. Exp. Bot. 2016, 67, 3831–3844. [Google Scholar] [CrossRef] [Green Version]
  30. Lolle, S.; Stevens, D.; Coaker, G. Plant NLR-triggered immunity: From receptor activation to downstream signaling. Curr. Opin. Immunol. 2020, 62, 99–105. [Google Scholar] [CrossRef] [PubMed]
  31. Jones, J.D.; Dangl, J.L. The plant immune system. Nature 2006, 444, 323–329. [Google Scholar] [CrossRef] [PubMed] [Green Version]
  32. Jones, J.D.; Vance, R.E.; Dangl, J.L. Intracellular innate immune surveillance devices in plants and animals. Science 2016, 354, 6395. [Google Scholar] [CrossRef] [PubMed] [Green Version]
  33. Couto, D.; Zipfel, C. Regulation of pattern recognition receptor signalling in plants. Nat. Rev. Immunol. 2016, 16, 537–552. [Google Scholar] [CrossRef]
  34. Rodriguez, E.; El Ghoul, H.; Mundy, J.; Petersen, M. Making sense of plant autoimmunity and ‘negative regulators’. FEBS J. 2016, 283, 1385–1391. [Google Scholar] [CrossRef] [PubMed]
  35. Bruggeman, Q.; Raynaud, C.; Benhamed, M.; Delarue, M. To die or not to die? Lessons from lesion mimic mutants. Front. Plant Sci. 2015, 6, 24. [Google Scholar] [CrossRef] [Green Version]
  36. Chakraborty, J.; Ghosh, P.; Das, S. Autoimmunity in plants. Planta 2018, 248, 751–767. [Google Scholar] [CrossRef]
  37. Liu, X.; Li, F.; Tang, J.; Wang, W.; Zhang, F.; Wang, G.; Chu, J.; Yan, C.; Wang, T.; Chu, C.; et al. Activation of the jasmonic acid pathway by depletion of the hydroperoxide lyase OsHPL3 reveals crosstalk between the HPL and AOS branches of the oxylipin pathway in rice. PLoS ONE 2012, 7, e50089. [Google Scholar] [CrossRef]
  38. Tong, X.; Qi, J.; Zhu, X.; Mao, B.; Zeng, L.; Wang, B.; Li, Q.; Zhou, G.; Xu, X.; Lou, Y.; et al. The rice hydroperoxide lyase OsHPL3 functions in defense responses by modulating the oxylipin pathway. Plant J. 2012, 71, 763–775. [Google Scholar] [CrossRef] [PubMed]
  39. Zhu, M.; Hu, Y.; Tong, A.; Yan, B.; Lv, Y.; Wang, S.; Ma, W.; Cui, Z.; Wang, X. LAZY1 Controls Tiller Angle and Shoot Gravitropism by Regulating the Expression of Auxin Transporters and Signaling Factors in Rice. Plant Cell Physiol. 2021, 61, 2111–2125. [Google Scholar] [CrossRef] [PubMed]
  40. Song, W.Y.; Wang, G.L.; Chen, L.L.; Kim, H.S.; Pi, L.Y.; Holsten, T.; Gardner, J.; Wang, B.; Zhai, W.X.; Zhu, L.H.; et al. A receptor kinase-like protein encoded by the rice disease resistance gene, Xa21. Science 1995, 270, 1804–1806. [Google Scholar] [CrossRef] [PubMed] [Green Version]
  41. Wang, X.; Wu, F.; Xie, Q.; Wang, H.; Wang, Y.; Yue, Y.; Gahura, O.; Ma, S.; Liu, L.; Cao, Y.; et al. SKIP is a component of the spliceosome linking alternative splicing and the circadian clock in Arabidopsis. Plant Cell 2012, 24, 3278–3295. [Google Scholar] [CrossRef] [Green Version]
  42. Cui, Z.; Tong, A.; Huo, Y.; Yan, Z.; Yang, W.; Yang, X.; Wang, X.X. SKIP controls flowering time via the alternative splicing of SEF pre-mRNA in Arabidopsis. BMC Biol. 2017, 15, 80. [Google Scholar] [CrossRef] [PubMed] [Green Version]
  43. Li, D.; Xu, H.; Sun, X.X.; Cui, Z.B.; Zhang, Y.; Bai, Y.G.; Wang, X.X.; Chen, W.F. Differential transformation efficiency of Japonica rice varieties developed in northern China. Crop Breed. Appl. Biotechnol. 2015, 15, 162–168. [Google Scholar] [CrossRef] [Green Version]
Figure 1. The mil1-1 mutation confers lesion mimic leaf phenotype in rice. (A) Photos of WT and mil1-1 plants at tillering stage, showing the spotted leaves of mil1-1. Scale bar is 20 cm. (B) Lesion mimic leaf of mil1-1 compared to WT. Scale bar is 2 cm. (C) Transmission electron microscopy observation of chloroplasts in WT and mil1-1 leaves. OG: osmiophilic plastoglobuli; Thy: Thylakoid lamellae. Scale bar is 10 μm. The left and right columns are different magnifications as indicated. (D) Effects of shading on lesion formation of WT and mil1-1 leaves. Scale bar is 10 cm. (E) The photosynthetic rate of WT and mil1-1. Data in E are mean ± SD. A two-tailed unpaired t-test with Welch’s correction is used for statistical analysis. ns indicates no significant difference.
Ijms 23 08853 g001
Figure 2. Histochemical analysis of ROS accumulation and cell death in WT and mil1-1. (A) DAB staining of leave in WT and mil1-1. (B) NBT staining of leave in WT and mil1-1. (C) H2O2 concentration in WT and mil1-1. (D,E) Enzyme activities of CAT (D) and POD (E) in WT and mil1-1. Data in (CE) are means ± SD. prot: protein. U: unit. Three biological replicates were performed in the measurement (n = 3). A two-tailed unpaired t-test with Welch’s correction is used for statistical analysis. Asterisks indicate significant differences between treatments and respective controls at each time point (* p < 0.05, ** p < 0.01; Student’s t test). (F) Trypan blue staining of WT and mil1-1 leaves. (G) DNA fragments detected by TUNEL assay. Scale bar is 50 μm. ROS: reactive oxygen species; DAB: diaminobenzidine; NBT: nitro-blue tetrazolium chloride; CAT: catalase; POD: peroxidase; TUNEL: terminal deoxynucleotidyl transferase-mediated dUTP nick-end labeling; PI: Propidium Iodide.
Ijms 23 08853 g002
Figure 3. Biomass production in WT and mil1-1. (A) Morphological feature of WT and mil1-1 at mature stage. (BE) Agronomic traits, including plant height (B), tiller number (C), shoot fresh and dry weight (D), and economic coefficient (E), in WT and mil1-1. A two-tailed unpaired t-test with Welch’s correction is used for statistical analysis. Asterisks indicate significant differences between treatments and respective controls at each time point (* p < 0.05, ** p < 0.01; Student’s t test).
Ijms 23 08853 g003
Figure 4. Agronomic traits related to yield formation in WT and mil1-1. (AF) Panicle traits, including panicle length (AC), branch number/panicle (D), weight/panicle (E), and panicle weight/plant (F) in WT and mil1-1; (GO) Grain features, such as total grains number/panicle (G), filled grains number/panicle (H), seed setting rate (I), grain size (JL), 1000-grains-weight (M), total grains weight/panicle (N), and filled grain weight/panicle (O). (P) Filled grain weight/plant. Data in (CI) and (LP) are means ± SD. A two-tailed unpaired t-test with Welch’s correction is used for statistical analysis. Asterisks indicate significant differences between treatments and respective controls at each time point (* p < 0.05, ** p < 0.01; Student’s t test).
Ijms 23 08853 g004
Figure 5. Mutation of MIL1 enhances the resistance to bacterial blight in rice. (A) Phenotypes of WT and mil1-1 inoculated with isolate of bacterial blight Zhe173. (B) Leaf disease rate of WT and mil1-1 after inoculation. (C) Lesion length of WT and mil1-1 after inoculation. (DH) The expression of defense response genes detected by RT-qPCR before lesion formation, including PR1a (D), PR1b (E), PBZ1/PR10 (F), PO-C1 (G), and POX1 (H). (IM) The expression of defense response genes detected by RT-qPCR after lesion formation, including PR1a (I), PR1b (J), PBZ1/PR10 (K), PO-C1 (L), and POX1 (M). Rice ACTIN1 (OsACT1) was used as an internal control. Data in (BM) are means ± SD. A two-tailed unpaired t-test with Welch’s correction is used for statistical analysis. Asterisks indicate significant differences between treatments and respective controls at each time point (* p < 0.05, ** p < 0.01; Student’s t test).
Ijms 23 08853 g005
Figure 6. Positional cloning of mil1-1 mutation and complementary test. (A) Map-based cloning of MIL1. Number under the horizontal chromosome bars transverse are recombinants and predicated 18 ORFs in the 243 kb region flanking by GN2-1 and GN2-2 markers. (B) Sequence alignment and the trace file of the mutation identified by sequencing in mil1-1. (C) Photos of WT, mil1-1 and three complementary transgenic lines. Scale bar is 20 cm. (D) Leave comparison of WT, mil1-1 and three complementary transgenic lines. Scale bar is 2 cm. (E) Expression of MIL1/OsHPL3 detected by RT-qPCR in WT plants in different treatments. Rice ACTIN 1 (OsACT1) was used as an internal control. Data in (E) are means ± SD. Asterisks indicate significant differences between treatments and respective controls at each time point (* p < 0.05, ** p < 0.01; Student’s t test).
Ijms 23 08853 g006
Table 1. Genetic analysis of mil1-1 mutation.
Cross CombinationPlants with WT PhenotypePlants with mil1-1 PhenotypeTotal PlantsPlants with WT Phenotype: Plants with mil1-1 Phenotypeχ2
mil1-1 × WT5932108032.82:1 ≈ 3:10.5683
χ2 = 3.84, p = 0.05, df = 1χ2 = 6.64, p = 0.01, df = 1χ2 < χ2 (p = 0.05, df = 1)
Table 2. Primers used in the study.
NameSequencesNote
OsACT1ReFCTATGTTCCCTGGCATTGCTOsACT1, RT-qPCR
OsACT1ReRGGCGATAACAGCTCCTCTTG
PR1AReFAGGTTATCCTGCTGCTTGCTPR1A, RT-qPCR
PR1AReRAGTCCGAGTGCTCCAGCTT
PR1BReFAGAACTACGCCAGCCAGAGAPR1B, RT-qPCR
PR1BReRGTAGTGCCCGCACACCTT
PBZ1ReFATGAAGCTTAACCCTGCCGCPBZ1, RT-qPCR
PBZ1ReRTCGAGCTCGTACTCCACCTT
POC1ReFGCTCTCTCAGGCGCGCACAPOC1, RT-qPCR
POC1ReRTTCGACAGCAGGTTGGTGTA
POX1ReFGCTCTCTCAGGAGCACACACPOX1, RT-qPCR
POX1ReRCAGCAGGTTGCTGTAGTAGGC
MIL1ReFAAGGAGGAGGCCATCAACAAMIL1, RT-qPCR
MIL1ReRCATCCGGAGCACCTCGTAC
MIL1cFtctagaATGGTGCCGTCGTTCCCG *35S:MIL1-GFP vector
MIL1cRggatccGCTGGGAGTGAGCTCCCGC
* Letters in lower case indicate cutting sites used.
Publisher’s Note: MDPI stays neutral with regard to jurisdictional claims in published maps and institutional affiliations.

