Article

GcvB Regulon Revealed by Transcriptomic and Proteomic Analysis in Vibrio alginolyticus

1
CAS Key Laboratory of Tropical Marine Bio-Resources and Ecology (LMB), Guangdong Provincial Key Laboratory of Applied Marine Biology (LAMB), South China Sea Institute of Oceanology, Chinese Academy of Sciences, Guangzhou 510301, China
2
College of Earth and Planetary Sciences, University of Chinese Academy of Sciences, Beijing 101408, China
3
School of Environment, South China Normal University, Guangzhou 510000, China
4
College of Marine Sciences, South China Agricultural University, Guangzhou 510642, China
5
Xisha Marine Environmental National Observation and Research Station, Sansha 573199, China
*
Author to whom correspondence should be addressed.
These authors contributed equally to this work.
Int. J. Mol. Sci. 2022, 23(16), 9399; https://doi.org/10.3390/ijms23169399
Submission received: 18 July 2022 / Revised: 18 August 2022 / Accepted: 18 August 2022 / Published: 20 August 2022
(This article belongs to the Special Issue Molecular Biology of RNA: Recent Progress)

Abstract

:
Vibrio alginolyticus is a widely distributed marine bacterium that is a threat to the aquaculture industry as well as human health. Evidence has revealed critical roles for small RNAs (sRNAs) in bacterial physiology and cellular processes by modulating gene expression post-transcriptionally. GcvB is one of the most conserved sRNAs that is regarded as the master regulator of amino acid uptake and metabolism in a wide range of Gram-negative bacteria. However, little information about GcvB-mediated regulation in V. alginolyticus is available. Here we first characterized GcvB in V. alginolyticus ZJ-T and determined its regulon by integrated transcriptome and quantitative proteome analysis. Transcriptome analysis revealed 40 genes differentially expressed (DEGs) between wild-type ZJ-T and gcvB mutant ZJ-T-ΔgcvB, while proteome analysis identified 50 differentially expressed proteins (DEPs) between them, but only 4 of them displayed transcriptional differences, indicating that most DEPs are the result of post-transcriptional regulation of gcvB. Among the differently expressed proteins, 21 are supposed to be involved in amino acid biosynthesis and transport, and 11 are associated with type three secretion system (T3SS), suggesting that GcvB may play a role in the virulence besides amino acid metabolism. RNA-EMSA showed that Hfq binds to GcvB, which promotes its stability.

1. Introduction

GcvB, originally identified in E. coli as part of the glycine cleavage system [1], is one of the most conserved small RNA (sRNA) in a wide spectrum of Gram-negative bacteria such as Enterobacteriaceae, Actinobacillus, Pasteurella, Photorhabdus, and Vibrio [2,3,4,5]. It is considered as the master sRNA regulator of amino acid metabolism. Miyakoshi et al. (2021) summarized that GcvB directly regulates more than 50 direct target genes in E. coli and Salmonella, which includes amino acid metabolism, ABC transporter and permease, antiporter, carbon metabolism, membrane integrity, RNA metabolism, and transcriptional regulator [6]. In addition, GcvB modulates critical cellular processes such as growth ability [7], biofilm formation [8], two-component system [9], acid resistance [10], and oxidative stress response [11], sensitivity to aminoglycoside antibiotics [12] in gamma-proteobacteria.
Previous studies revealed that GcvB utilizes three conserved seed sequences, namely R1, R2, and R3 to regulate multiple target genes. The G/U-rich R1 region is capable of base-pairing interactions with vast majority of previously known targets [2,13,14,15,16,17]. The R3 seed sequence regulates several mRNAs including phoP and lrp, which encode global transcriptional regulators [9,18,19], as well as sRNA SroC [20]. Although the R2 sequence is highly conserved, it may only be utilized to repress cycA mRNA in E. coli and Salmonella [16,21]. Upon technical developments, new methodologies such as RNA-seq [3,7,11], RIL-seq (RNA interaction by ligation and sequencing) [22,23], CLASH (UV cross-linking, ligation, and sequencing of hybrids) [24], and MAPS (MS2-affinity purification coupled with RNA sequencing) [19] were performed to explore GcvB regulon, leading to quick expansion of GcvB sRNA–mRNA interactome data sets [6,19].
Vibrio alginolyticus is a common Gram-negative opportunistic pathogen widely distributed in the marine and estuarine environments where a variety of carbon and nitrogen sources are supplied, and poses a potential threat to marine animals and human [25,26,27,28,29,30,31,32,33]. The RNA binding proteins, Hfq and CsrA that play central roles in sRNA functioning, have been shown to be critical for the fast growth and highly effective metabolism of carbohydrates and amino acids of V. alginolyticus previously [34,35], indicating that sRNAs may be the key elements in the regulation of metabolism in response to the changing environments.
GcvB function has primarily been evaluated in the family of Enterobacteriaceae, which leaves a question of what role it may play in other bacteria that live in habitats different from those of Enterobacteriaceae. Recently, a study on Pasteurella multocida has shown that GcvB functions as an amino acid metabolism controller as in other bacteria, while its regulatory targets are very different [3]. Previously, Silveira et al. [5] have reported that GcvB homolog is widely distributed in species of the Vibrionacea family. However, its physiological role and regulatory targets remain unknown. To address this issue, we characterized gcvB and identified its regulon by integrating the high-resolution RNA-seq and DIA assays in V. alginolyticus ZJ-T. It is the first report to reveal the regulatory role of GcvB in the Vibrionacea family, which may also shed light on the functional and evolutionary diversity of this conserved sRNA in different bacteria.

2. Results

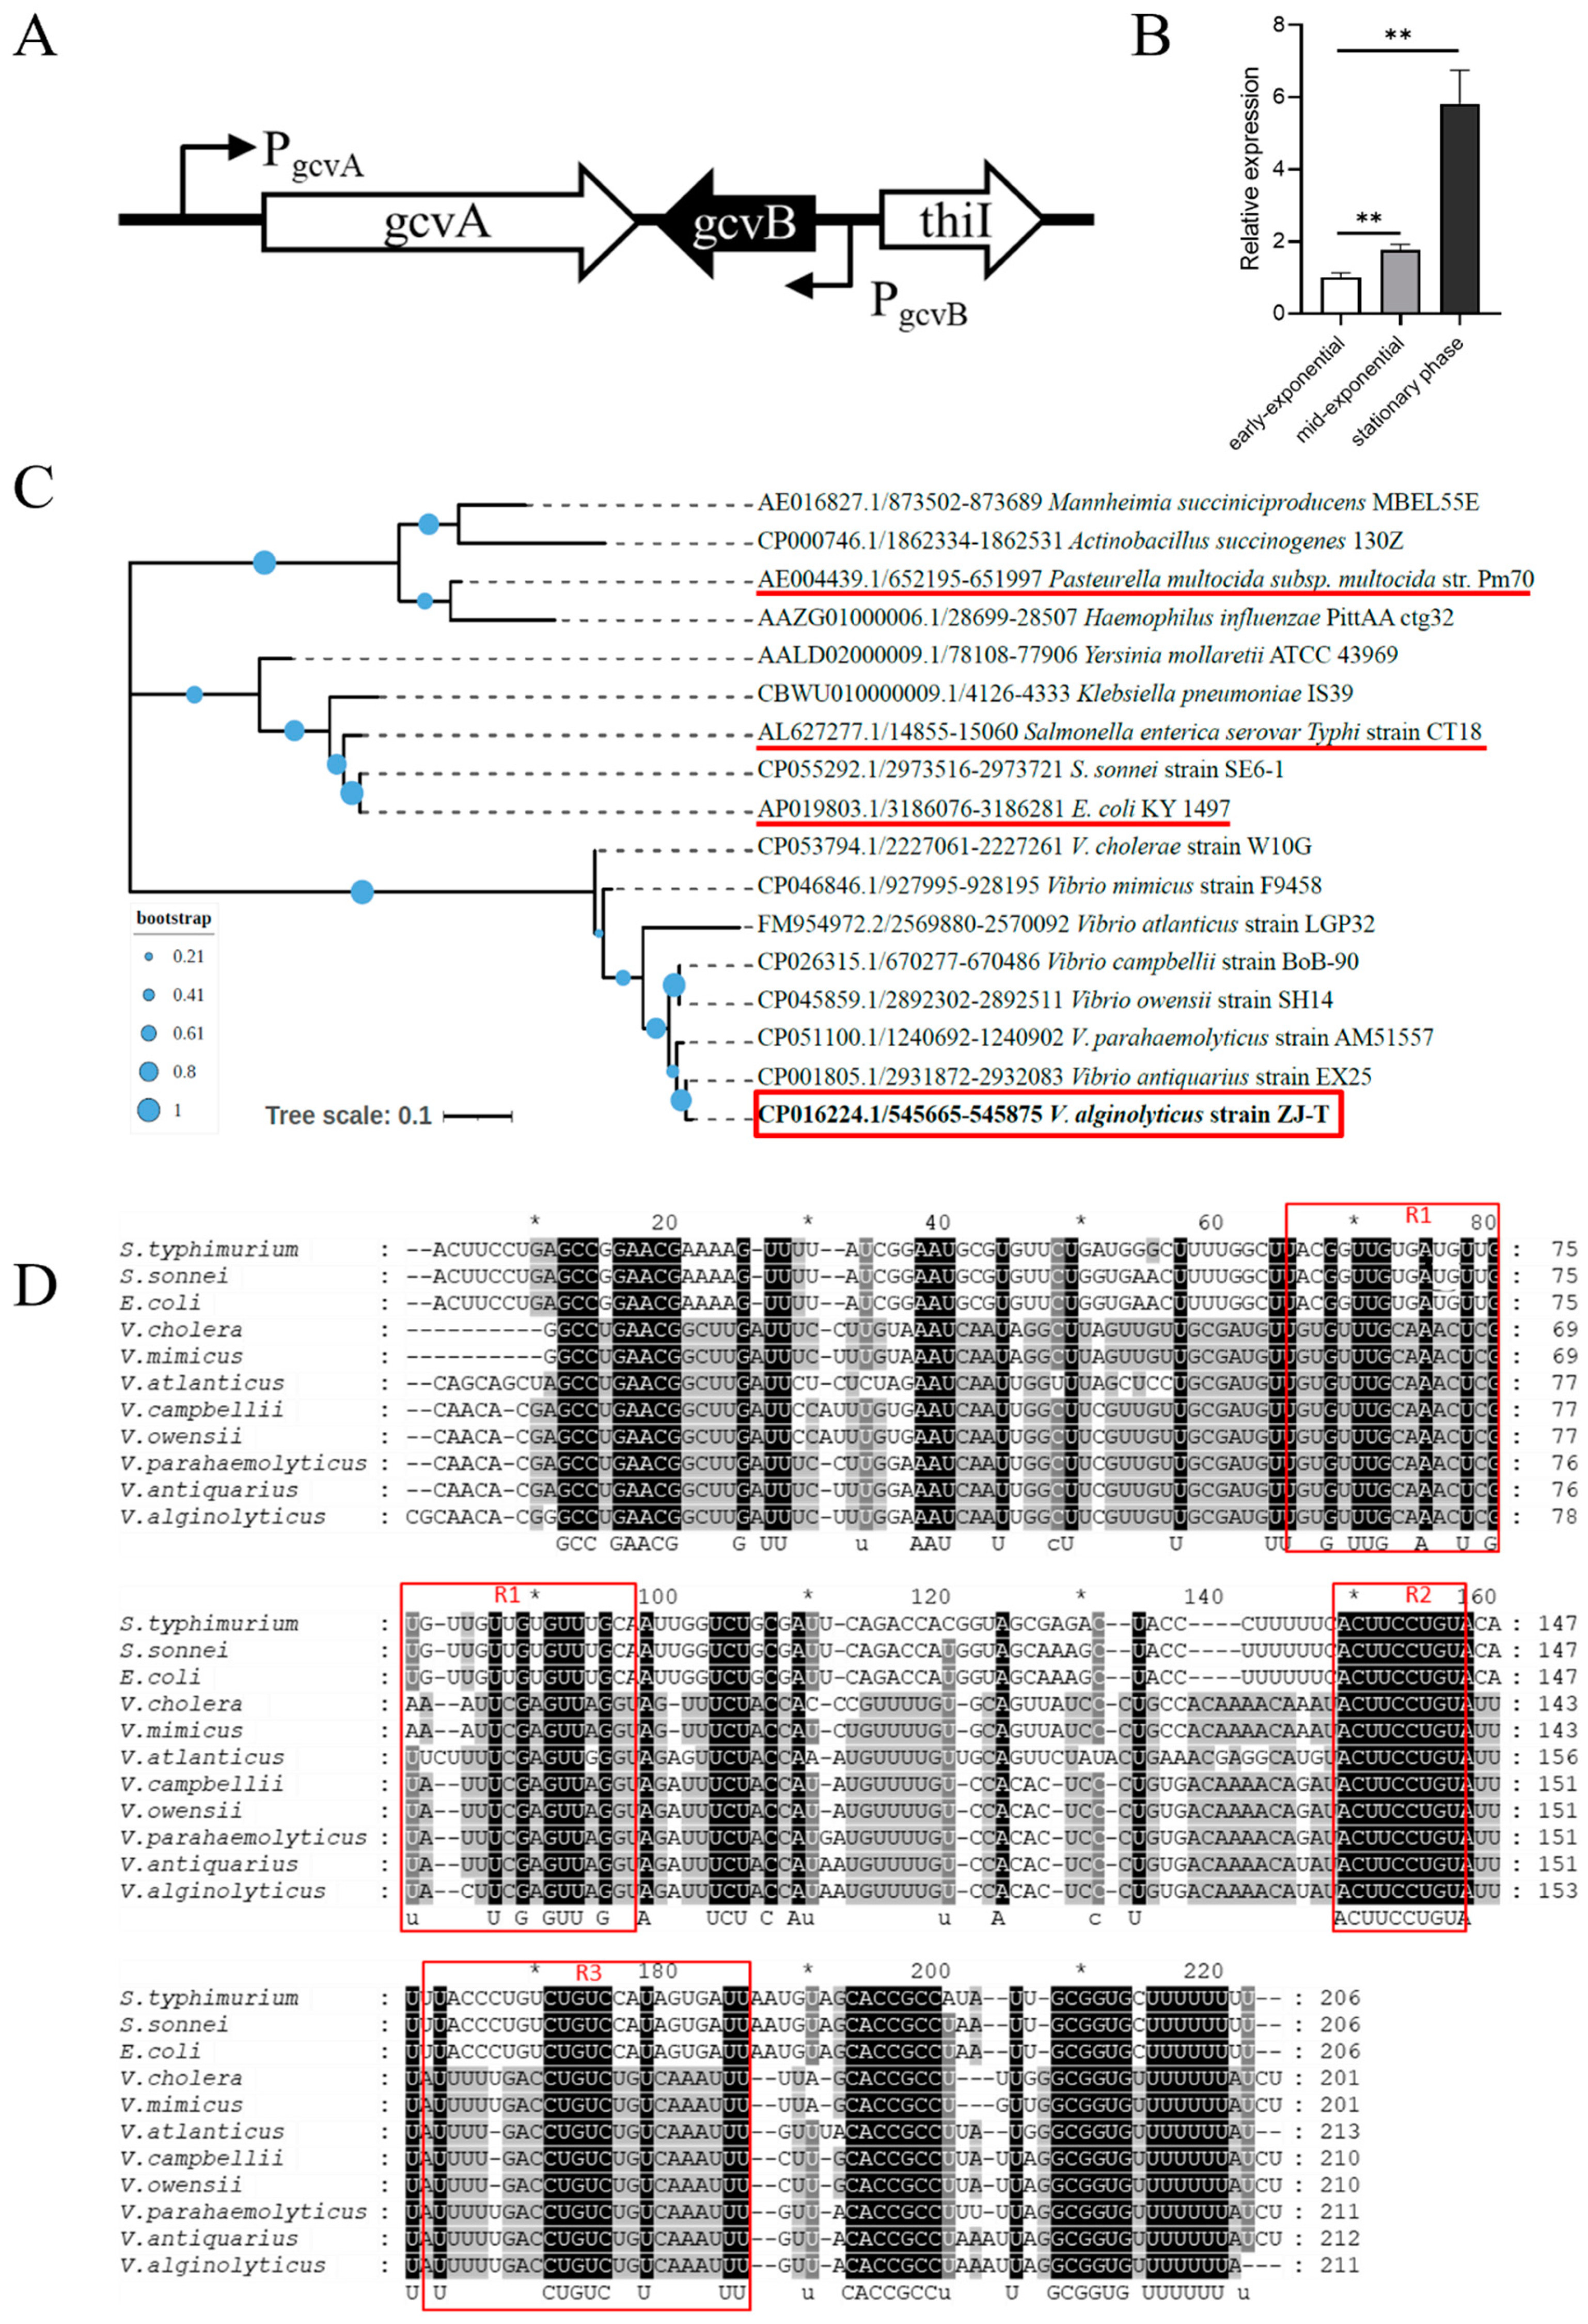
2.1. Bioinformatic Analysis of GcvB Sequence of V. alginolyticus and Its Expression in LBS

In a previous study, trans-encoded regulatory sRNAs were identified in the genome of Vibrio alginolyticus ZJ-T [36]. GcvB locates in the intergenic region of chromosome II, between BAU10_02485 (encoding tRNA 4-thiouridine (8) synthase ThiI) and BAU10_02490 (encoding transcriptional regulator GcvA) (Figure 1A). In other bacteria, gcvB and gcvA are always oriented together and transcribed divergently, but the downstream genes are variable. The gcvB gene contains a non-coding sequence of 211 nucleotides, which shows high similarity to the GcvB ortholog of the organisms from the families of Enterobacteriaceae, Vibrionaceae, and Pasteurellaceae (Figure 1C). However, except R1 and R2 sequences that are common to all GcvB sRNAs, the conserved R3 sequence in Enterobacteriaceae is not present across those of Vibrionaceae (Figure 1D).
To determine how GcvB is expressed in V. alginolyticus, we analyzed the transcriptome (RNA-seq) data generated from the RNA isolated from the cells at the early exponential phase (OD600nm = 0.5). The average reads per kilobase per million mapped reads (RPKM) is 7697, indicating a strong expression of gcvB. Quantitative RT-PCR showed that gcvB expression increased with growth: at stationary phase (OD600nm = 5.0), the abundance of gcvB transcripts increased by six-fold compared to early exponential phase (Figure 1B), which is in contrary with the reports of other bacteria [2,13,19].

2.2. Construction of the Mutant and Complementary Strains and Measurement of Their Growth Ability under Different Conditions

In order to examine the role of GcvB in V. alginolyticus, we constructed an in-frame deletion of gcvB in the ZJ-T, named ZJ-T-△gcvB, and accordingly a complementary strain ZJ_T-△gcvB+ that harbored a pMMB207 plasmid carrying the fragment of gcvB driven by the promoter of Ptet in the plasmid. The gcvB expression in the strains were examined by qRT-PCR. The result confirmed the mutant totally lost its transcription, but the complementary strain has only partially restored the expression of gcvB (50% compared to the wild type) (Figure 2), which may be due to the difference in promoters.
The growth of ZJ-T, ZJ-T-ΔgcvB, and ZJ-T-ΔgcvB+ were measured under several conditions. As shown in Figure 3, there is no significant difference among them when the cells were grown in rich medium LBS (Figure 3A) and minimum media M63 supplemented with NH4+((NH4)2SO4) plus D-glucose, indicating that deletion of gcvB did not affect the uptake and metabolism of carbon and nitrogen sources, nor the amino acid biosynthesis processes from de novo. To investigate the impact of GcvB on the uptake and catabolism of specific amino acids, bacterial growth was measured in M63 supplemented with L-alanine, branched-chain amino acids (L-isoleucine, L-leucine and L-valine), L-aspartic acid, L-arginine, L-threonine, and L-serine. As shown in Figure 3, all of the three strains showed similar growth curves except that when they were grown in M63 plus L-alanine or M63 plus L-alanine plus D-glucose, ZJ-T-ΔgcvB had a much longer lag phase (>8 h) compared to ZJ-T and ZJ-T-ΔgcvB+ partially restored this phenotype. This suggests that gcvB may be involved in alanine uptake and/or catabolism.

2.3. Integrative Transcriptome and Proteome Analysis of the Wild Type Strain and GcvB Mutant

To identify the regulon of gcvB of V. alginolyticus, whole-transcriptome RNA sequencing (RNA-seq) and DIA (data-independent acquisition) quantitative proteomics were performed to analyze the transcriptome and proteome of ZJ-T and ZJ-T-△gcvB. The RNA and protein samples were prepared from cells harvested at early exponential phase (OD600 = 0.5).
According to the data of transcriptome, on average, 21.2 and 21.4 million high-quality 150 bp paired-end clean reads of ZJ-T and ZJ-T-ΔgcvB group respectively were mapped to the genome of V. alginolyticus ZJ-T. Quality analysis of the transcriptome showed an average Q20 of 98.43% and 98.46% and Q30 of 95.03% and 95.10% for ZJ-T and ZJ-T-ΔgcvB, respectively. The average map rates were 95.99% for ZJ-T and 96.29% for ZJ-T-△gcvB, respectively (Table S1). The differentially expressed genes (DEGs) were identified with the absolute value of fold changes of ZJ-T/ZJ-T-ΔgcvB |FC| ≥ 2 and a false discovery rate-adjusted p (q value) < 0.05. Protein identification and quantification were done by nano-HPLC-MS/MS. A total of 37,861 peptides that are matched with 3276 proteins were detected, accounting for 72.8% of the entire encoded proteins in the genome of ZJ-T, of which 606 proteins matched with less than three peptides. The differentially expressed proteins (DEPs) were identified with FDR< 0.05 and |FC| ≥ 1.5.
A total of 40 DEGs (differentially expressed genes) were identified (Table S3). Compared to the wild-type strain, ZJ-T-△gcvB showed 27 up-regulated and 13 down-regulated genes, respectively (Figure 4A,B). However, qRT-PCR confirmed that only 18 of them showed similar expression differences (Data not shown). The DEGs were enriched in 2 KEGG pathways, namely “histidine metabolism” and “arginine biosynthesis” with the Q value < 0.05 (Figure 4C). For proteome analysis, 50 proteins displayed significant differences after inactivation of gcvB, 36 of which showed increased production and 14 of which were down-regulated (Figure 5A,B). The DEPs were enriched in three primary KEGG pathways, namely “sulfur metabolism”, “branched chain amino acid biosynthesis”, and “type three secretion system” (Figure 5C).
Integrative analysis of transcriptome and proteome data showed only four genes are presented both in DEGs and DEPs (Figure 6A), namely mtlA (encoding PTS mannitol transporter subunit II), mtlD (encoding mannitol-1-phosphate 5-dehydrogenase), HI_1246 (encoding LTA synthase family protein), and cysM (encoding cysteine synthase) (Table S3.). All of them were up-regulated similarly in gcvB mutant at both mRNA and protein levels. As many as 46 out of 50 DEPs (92%) showed no difference in transcription, indicating the majority of different expression of DEPs is the consequence of post-transcriptional regulation by gcvB. However, there are 36 DEGs not presented in the DEPs dataset too. Additionally, the 20 DEPs, with a reliable STRING score (>700), were shown to be involved in a PPI network based on the STRING database (Figure 6B), indicating they interacted with each other.

2.4. Identification of GcvB Regulon and Its Possible Physiological Role in V. alginolyticus ZJ-T

Based on the primary KEGG pathways they are involved in, the DEGs and DEPs are categorized, which may help to understand the physiological role of GcvB in V. alginolyticus.

2.4.1. Valine/Leucine/Isoleucine Biosynthetic Pathway

Like E. coli, the genome of V. alginolyticus ZJ-T contains a whole set of genes for BCAAs biosynthesis from de novo, which consists of four operons, namely ilvGMEDA, ilvBN, ilvIH, and leuABCD. They are located in different regions of the genome, where ilvGM, ilvBN, and ilvIH encode three isozymes of acetolactate synthase (AHAS), a key enzyme for branched-chain amino acid synthesis, respectively, but ilvGM plays a dominant role in most conditions [37]. Proteomic analysis showed that GcvB inhibited the expression of ilvA, ilvG and leuB, leuC, leuD, as well as brnQ that encodes BCAAs transporter. Although they did not display significant difference in the transcriptome analysis, qRT-PCR showed about slight but significant increases of ilvC, ilvE, and ilvD expression in ZJ-T-△gcvB compared to ZJ-T (Figure 7A). To verify whether GcvB regulates these candidates at the post-transcriptional level, translational fusion of ilvG to gfp gene was carried out and determined by Western blot. As shown in the Figure 7B, it was not expressed in the early log phase of both wild-type and gcvB mutant, but its expression increased with growth from the mid-log phase onward. Compared with ZJ-T, IlvG showed a significant up-regulation during mid-log phase growth in ZJ-T-ΔgcvB, but the expression was the same when the cells reached to the stationary phase, indicating that the repression of ilvG by GcvB occurs during exponential growth.

2.4.2. Sulfur and Cysteine Biosynthesis Metabolism

Sulfur is an essential element for life and the metabolism of organic sulfur compounds plays an important role in the global sulfur cycle. The Vibrio family can efficiently uptake sulfate from seawater and convert it into cysteine and methionine, a process catalyzed by proteins encoded by 19 genes on the genome [38]. Proteomic data showed an over-representing of genes (cysI, cysJ, cysH, cysN, cysD, and cysK) in sulfur metabolism and cysteine synthesis pathway (p = 0.00019). They are located on three different operons, namely cysGDN, cysZK, and cysJIH. In the gcvB mutant, the quantity of their proteins was reduced by 2–5-fold compared to the wild type, but the abundance of their transcripts quantified by RNA-seq and qRT-PCR did not differ (Figure 8A, Table S3), indicating a positive regulation of their expression by GcvB from post-transcription, contrary to the common pattern of regulation of GcvB reported so far. To verify this regulation, we constructed the translational fusion of cysK and cysN to gfp, and measured their expression in LBS along the growth. As shown in the Figure 8, both of them are not expressed in the early log phase, but are strongly expressed from the mid-log phase and remain high in the stationary phase. Compared to ZJ-T, cysN is not expressed in ZJ-T-ΔgcvB during the growth and cysK is significantly down-regulated.
However, in the transcriptome data of ZJ-T-ΔgcvB, cysM encoding cysteine synthase was up-regulated by 5.56-fold compared to that of ZJ-T, which was verified by qRT-PCR (Figure 8A). Meanwhile, its protein was increased approximately five-fold, despite an FDR value of more than 0.05. It suggests that gcvB may indirectly regulate the expression of cysM by repressing an unknown transcriptional factor that is required for cysM transcription (Figure 8B). These data refer that GcvB is likely to be involved in the regulation of sulfur metabolism and cysteine biosynthesis pathway by at least two different mechanisms in V. alginolyticus.
In addition, transcriptomic data showed that the hutI, hutG, and hutU genes encoding proteins that catalyze the conversion of histidine to glutamate were more than two-fold upregulated in the gcvB mutant (Figure 9).

2.4.3. ABC Transporters

Previous work in E. coli and Salmonella revealed that GcvB represses multiple target mRNAs, most of which encode amino acid uptake systems relevant for the utilization of external nitrogen sources. In this study, the artP (encoding arginine ABC transporter ATP-binding protein) was upregulated by 5.52-fold in mRNA level while aapJ (encoding amino acid ABC transporter, periplasmic amino acid-binding protein) and metN (encoding methionine ABC transporter ATP-binding protein) were upregulated by 2.69 and 1.57-fold respectively in their protein levels. It is noteworthy of the general L-amino acid permease (Aap) that is encoded by an operon containing four genes aapJQMP. AapJ is a periplasmic binding protein that has a broad ligand specificity which is required for transport of all solutes [39,40]. It indicated that GcvB negatively regulates the uptake of amino acids in V. alginolyticus.

2.4.4. Bacterial Secretion Systems

Bacterial secretion systems are widespread in bacteria allowing them to infect eukaryotic cells or compete with non-akin bacteria [41]. Many Gram-negative pathogens employ T3SS to translocate effector proteins into eukaryotic host cells, which is important for bacterial survival and virulence [42,43] while T6SS is important for bacterial competition through contact-dependent killing of competitors [44,45,46].
In this study, the proteomic data showed T3SS-associated genes including yscB (encoding T3SS chaperone), BAU10_07880 (encoding T3SS chaperone), yscP (encoding T3SS needle length determinant), yscF (encoding T3SS export protein), exsE2(encoding T3SS regulator), yscV (encoding T3SS protein V) were up-regulated by approximately two-fold in gcvB mutant compared to the wild type, although no difference in their transcripts. However, T6SS-associated genes including tssC (type VI secretion system contractile sheath large subunit), tssB (type VI secretion system contractile sheath small subunit), tagH (type VI secretion system-associated FHA domain protein) showed significant down-regulated expression in their mRNA abundance, but no significant difference in their proteins. Therefore, it may suggest that gcvB represses T3SS but activates T6SS of V. alginolyticus.

2.5. Effects of Hfq on GcvB

Hfq is an RNA chaperone that assists interactions between sRNA and its targets and or enhances stabilities of many sRNAs [47]. To investigate the involvement of Hfq in GcvB regulation, qRT-PCR was used to quantify its expression in LBS medium between the wild type ZJ-T and an hfq mutant ZJ-T-Δhfq. As shown in Figure 10A. GcvB was down-regulated in early exponential and stationary phase in ZJ-T-Δhfq but no significant difference in mid-exponential period compared to the wildtype was observed, indicating that Hfq positively regulates the expression of GcvB. The stability of GcvB RNA was determined by measuring its half-life (Figure 10B). The result showed that it was beyond 15 min in the wild-type strain but less than 4 min in the hfq deletion strain, indicating that Hfq promotes GcvB RNA stability. To examine if Hfq binds directly to GcvB, we performed an RNA electrophoretic mobility shift assay (REMSA) with purified Hfq protein and a biotinylated GcvB RNA oligonucleotide that contains 211 nucleotides of the entire transcript. The result showed Hfq binds to GcvB from 0.15 μg (Hfq = 1.40318 × 10⁻¹¹ mol; GcvB = 2.9567 × 10⁻¹³ mol) to 1.05 μg and there was no change in the mobility of Hfq at a concentration over 1.05 μg (Hfq = 9.82226 × 10⁻¹¹ mol; GcvB = 2.9567 × 10⁻¹³ mol) (Figure 10C), indicating that the concentration at which Hfq protein binds to GcvB reaches saturation at 1.05 μg. To verify that Hfq binds to GcvB specifically, after the non-biotinylated GcvB probes were added to the last three groups (groups 12, 13, 14), the labeled GcvB was competitively eluted and the band reappeared below, indicating the binding of GcvB is specific.

3. Discussion

In this study, we characterized the physiological role of GcvB of V. alginolyticus ZJ-T, and identified its regulon. Deletion of gcvB has been reported to reduce generation time of Yersinia pestis [4], but no effect was seen on the growth rate of E. coli [1]. The gcvB gene encodes a small untranslated RNA, involved in the expression of dipeptide and oligopeptide transport systems in Escherichia coli. In V. alginolyticus, deletion of gcvB resulted in no difference in growth rate with the wild type when the cells grew either in rich medium (LBS) or defined media, except when alanine was used as the sole carbon/nitrogen source. It suggests that GcvB is likely to affect the uptake and/or the initiation degradation of alanine, but which target genes are affected and their mechanisms need to be determined by further experiments.
By comparing the transcriptome and proteome data between the gcvB knockout strain and its wild-type parental strain that grows at early exponential phase, we found that GcvB affects the expression of <1% (0.86%) of the V. alginolyticus transcriptome and 1.52% proteome. The regulatory roles of GcvB identified in this analysis are summarized in Figure 11. Transcriptomics-based studies in Enterobacteriaceae, such as E. coli and Salmonella, have shown that GcvB directly or indirectly regulates the expression of about 1–2% of total genes, or about 50–100 genes [20] of the genome. The number of experimentally confirmed target genes has exceeded 50. Among them, more than 30 genes encode proteins for amino acid transport and metabolism. In this study, of the genes that showed either increased (36) or decreased (14) protein levels in the GcvB-deficient strains compared to the wild type, 18 were predicted to be involved in amino acid biosynthesis and transport, suggesting that GcvB acts primarily to repress the biosynthesis and transport of amino acids during the early growth stages in V. alginolyticus, likely as a means to conserve energy when nutrients are abundant [3]. In E. coli and S. Typhimurium, the majority of GcvB regulon is associated with amino acid transporters (>60% of GcvB targets) [16]. But in V. alginolyticus, only 3 out of 50 genes are responsible for amino acid transport, while 30% of the regulon is involved in the biosynthesis of amino acids. Interestingly, only three DEPs in V. alginolyticus are also presented in the gcvB regulon of E. coli and S. Typhimurium. Gulliver et al. recently identified the GcvB regulon in Pasteurella multocida by quantitative proteome analysis, showing that most part of the regulon is not shared with those in Enterobacteriaceae, although its major role is similar [3]. It may suggest that the function of gcvB is conserved across families to most extend, but its targets are diverse, which may result from the co-evolution consequences required for different bacteria surviving strategies.
Sulfur is an element essential for microbial life [48]. Seawater contains 27.7 mM of sulfate, which can be assimilated by various marine microorganisms, of which Vibrio is typical [49,50]. It was reported that CysB, an LysR family transcriptional regulator, is required for the transcription initiation of the multiple cys operons, but little was known about the regulatory mechanisms of sulfur metabolism in Vibrio. In this study, the amount of proteins such as CsyI, CsyJ, CsyN, CsyK, CsyH, and CsyD was decreased in gcvB mutant, while the abundances of their transcripts are not altered, referring that GcvB positively regulates their expression post-transcriptionally. This is in contrast to the most cases except that GcvB was reported to positively regulate RNase BN/Z by stabilizing its mRNA [51]. How gcvB positively regulates the expression of cys genes remains to be elucidated.
In addition to metabolism, we here first found that GcvB may be also involved in the virulence of V. alginolyticus by modulating a large part of T3SS gene expression post-transcriptionally. T3SS is an important virulence factor of V. alginolyticus, which induces apoptosis and autophagy of the host cells, so the virulence is greatly reduced in the absence of T3SS [52,53]. In Pseudomonas aeruginosa, sRNA 179 was reported to negatively regulate T3SS by repressing the Gac/Rsm signal transduction system that is required for the expression of T3SS regulon [54], but so far no study hints the link between GcvB and T3SS.
This study first identified and characterized the GcvB regulon in V. alginolyticus strain ZJ-T. Compared to previous studies in other bacteria, the sequences and primary roles of GcvB are well conserved, but its targets are different among the bacteria. Furthermore, we first found it may be also involved in cysteine biosynthesis and virulence, but the targets and mechanism need to be further revealed.

4. Materials and Methods

4.1. Bacterial Strains, Plasmids, and Media

All bacterial strains and plasmids used in this study are listed in Table 1. All strains were maintained at −80 °C in tryptic soy broth (TSB) (BD, New Jersey, USA) plus 25% glycerol. V. alginolyticus and derivatives were routinely cultured in TSB or lysogeny broth (LB) (VWR International, Radnor, PA, USA) plus 2.5% NaCl at 30 °C. Escherichia coli strains were cultured in LB medium supplemented with appropriate antibiotics at 37 °C. For the selection of transconjugants, TCBS medium (HuanKai, Guangzhou, China) was used with 5 μg/mL chloramphenicol (Cm) and 0.2% D-glucose. To select transconjugants that had undergone plasmid excision and allelic exchange, TCBS medium plus 0.2% arabinose plus 5 μg/mL chloramphenicol (Cm) or TCBS medium plus 0.2% arabinose alone was used to induce the ccdB gene and to select bacteria that had lost the inserted plasmid. Antibiotics were used at the following concentrations: chloramphenicol (Cm) at 5 μg/mL for V. alginolyticus and 20 μg/mL for E. coli; ampicillin (Amp) at 100 mg/mL for E. coli. When necessary, diaminopimelate (DAP) was added to the growth media at a final concentration of 0.3 mM.

4.2. Phylogenetic Tree and Sequence Analysis

The sequences were obtained from GenBank. The phylogenetic tree and sequence analysis were constructed based on the DNA difference with the ML (maximum likelihood) method with 300 bootstrap replicates using MEGA X (downloaded from http://www.megasoftware.net/, accessed on 6 April 2022). The tree was visualized via iTOL (iTOL: Interactive Tree of Life (https://itol.embl.de/), accessed on 6 April 2022)

4.3. Mutant and Complementary Strains Construction

The gcvB gene was deleted from V. alginolyticus ZJ-T as previously described [35] with slight modifications. In brief, upstream and downstream of the target gene gcvB were PCR-amplified with the primer pairs annotated gcvB-UP-F/R and gcvB-DOWN-F/R (Table S2), and the vector fragment pSW7848 was PCR-amplified with the primer pair pSW7848-F/R (Table S2). The recombinant suicide plasmid pSW7848-ΔgcvB was obtained by isothermal assembly and transformed into GEB883 cells (Table 1), which was then confirmed using the primers annotated Del-check-pSW7848-F/R. Conjugations and selection of mutants were carried out as previously described [35]. PCR and sequencing were used to check for the presence or absence of the target genes with the primer pair ΔgcvB-check-F/R.
The pMMB207 vector fragment and intact gcvB fragment were PCR-amplified with the primer pair pMMB207-F/R and gcvB-F/R (Table S2), respectively, connected, and transformed into E. coli GEB883 cells. PCR and sequencing were used on colonies to check for the presence or absence of the target genes with the primer pair annotated com-pMMB207-F/R. The recombinant plasmid pMMB207-gcvB was transformed into V. alginolyticus mutant ZJ-T-ΔgcvB cells, resulting in the ZJ-T-△gcvB+ strain (Table 1). All amplified DNA samples were sequenced to ensure no errors had occurred during amplification.

4.4. Growth Measurement

Growth measurements in rich medium LBS and different modified minimal medium M63 were carried out as previously described [35] with slight modification. To investigate the effect of amino acid(s) on growth, D-glucose and (NH4)2SO4 in M63 were left out and replaced by the amino acids L-alanine (150 mM), ILV (L-isoleucine, L-leucine and L-valine, 20 mM respectively), L-aspartic acid (50 mM), L-arginine (50 mM), L-threonine (50 mM), and L-serine (50 mM) as carbon and nitrogen sources. M63 medium plus 0.4% (w/v) D-glucose plus L-alanine (150 mM) was also used to investigate whether GcvB was involved in alanine metabolism. Minimal medium assays were carried out as previously described [35]. More than three replicates in each case and three repetitions of the experiment were carried out in these measurements.

4.5. RNA Extraction and Whole-Genome RNA-Sequencing

The experimental design comprised two groups: the wildtype strain ZJ-T and mutant syrain ZJ-T-ΔgcvB (n = 3 per group). LBS cultures from single colonies were grown overnight and then diluted 1:1000 in LBS medium and grown to the mid-log phase (OD600nm ≈ 0.6), and 100 mL LBS cultures were collected. Total RNA was extracted by TRIzol-based method (Life Technologies, California, USA). RNA quality control was assessed on an Agilent 2100 Bioanalyzer (Agilent Technologies, Palo Alto, California, USA) and checked using RNase free agarose gel electrophoresis. The purified RNA was sent to Genedenovo Biotechnology Co., Ltd. (Guangzhou, China), where the RNA sample was assembled into a single ended RNA-Seq library and sequenced by Illumina Novaseq 6000 platform with pair-end 150 base reads. Raw data were filtered by the following standards and quality trimmed reads were mapped to the reference genome using Bowtie2 [60] (version 2.2.8) allowing no mismatches, and reads mapped to ribosome RNA were removed. Retained reads were aligned with the reference genome using Bowtie2 to identify known genes and calculated gene expression by RSEM [61].
The gene expression level was further normalized by using the fragments per kilobase of transcript per million (FPKM) mapped reads method to eliminate the influence of different gene lengths and amount of sequencing data on the calculation of gene expression. The edge R package (http://www.r-project.org/, accessed on 26 July 2021) was used to identify differentially expressed genes (DEGs) across samples with fold changes ≥2 and a false discovery rate-adjusted p (q value) < 0.05. DEGs were then subjected to an enrichment analysis of GO function and KEGG pathways, and q values < 0.05 were using as threshold.

4.6. Protein Extraction and Protein Digestion

Samples were collected as done in RNA-seq method, then were transferred into lysis buffer (2% SDS, 7 M urea, 1 mg/mL protease inhibitor cocktail), and homogenized for 5 min in ice using an ultrasonic homogenizer. The homogenate was centrifuged at 15,000 rpm for 15 min at 4 °C, and the supernatant was collected. BCA Protein Assay Kit was used to determine the protein concentration of the supernatant. About 50 μg proteins extracted from cells were suspended in 50 μL solution, reduced by adding 1 μL 1 M dithiothreitol at 55 °C for 1 h, alkylated by adding 5 μL 20 mM iodoacetamide in the dark at 37 °C for 1 h. Then the sample was precipitated using 300 μL prechilled acetone at −20 °C overnight. The precipitate was washed twice with cold acetone and then resuspended in 50 mM ammonium bicarbonate. Finally, the proteins were digested with sequence-grade modified trypsin (Promega, Madison, Wisconsin, USA) at a substrate/enzyme ratio of 50:1 (w/w) at 37 °C for 16 h.

4.7. High PH Reverse Phase Separation and DIA(Nano-HPLC-MS/MS Analysis)

The peptide mixture was re-dissolved in buffer A (buffer A: 20 mM ammonium format in water, pH10.0, adjusted with ammonium hydroxide), and then fractionated by high pH separation using Ultimate 3000 system (Thermo Fisher scientific, MA, USA) connected to a reverse phase column (XBridge C18 column, 4.6 mm × 250 mm, 5μm, (Waters Corporation, MA, USA). High pH separation was performed using a linear gradient, starting from 5% B to 45% B in 40 min (B: 20 mM ammonium format in 80% ACN, pH 10.0, adjusted with ammonium hydroxide). Ten fractions were collected; each fraction was dried in a vacuum concentrator for the next step.
The peptides were re-dissolved in 30 μL solvent A (A: 0.1% formic acid in water) and analyzed by on-line nanospray LC-MS/MS on an Orbitrap Fusion Lumos coupled to EASY-nLC 1200 system (Thermo Fisher Scientific, MA, USA). About 3 μL peptide sample was loaded onto the analytical column (Acclaim PepMap C18, 75 μm × 25 cm) with a 120-min gradient, from 5% to 35% B (B: 0.1% formic acid in ACN). The mass spectrometer was run under data independent acquisition mode, and automatically switched between MS and MS/MS mode. DIA was performed with variable Isolation window, and each window overlapped 1 m/z, and the window number was 60.

4.8. Protein Functional Annotation, Enrichment Analysis, and PPI Network Construction and Analysis

Raw data of DIA were processed and analyzed by Spectronaut X (Biognosys AG, Schlieren, Switzerland) with default parameters. Retention time prediction type was set to dynamic iRT. Data extraction was determined by Spectronaut X based on the extensive mass calibration. Spectronaut Pulsar X determined the ideal extraction window dynamically depending on iRT calibration and gradient stability. Qvalue (FDR) cutoff on precursor and protein level was applied 1%. Decoy generation was set to mutated, which was similar to scrambled but only applies a random number of AA position swamps (min = 2, max = length/2). All selected precursors passing the filters were used for quantification. The average top three filtered peptides which passed the 1% Qvalue cutoff were used to calculate the major group quantities. After Student’s t-Test, different expressed proteins were filtered if their Qvalue was 0.58.
Proteins were annotated against GO, KEGG, and COG/KOG database to obtain their functions. Significant GO functions and pathways were examined within differentially expressed proteins with q value ≤ 0.05. For PPI network construction and analysis, STRING (https://string-db.org/, accessed on 26 July 2021) database was utilized to create the PPI networks [62]. Further information on the possible function of differentially expressed proteins was predicted on potential PPIs using Cytoscape software [63] to identify and visualize potential PPIs.

4.9. Quantitative Reverse Transcription PCR (qRT-PCR) Analysis

qRT-PCR analysis were carried out to verified gene expression as previously described [35]. The relative expression of genes was detected by qPCR using gene-specific primers (Table S3), and 16s rDNA was used as an internal reference. Relative levels were calculated using the threshold cycle (ΔΔCT) method [64] and normalized to the wild type ZJ-T value. Measurements were done in triplicate. Statistical significance was determined by the Student’s t-Test (ns p > 0.05, * p < 0.05, ** p < 0.01).

4.10. Translational Fusion

To create the translational fusion of target genes, PCR fragment containing the target genes and their flanking regions (including its native promoter and start codon) was amplified using the primers listed in Table S1. The relaxed plasmid pSCT32-gfp (containing reporter gene gfp coding green fluorescent protein) was amplified with linearized primer pairs pSCT32-gfp-TL_F and pSCT32-gfp-TL_R (Table S3), and the fragments were then inserted into plasmid pSCT32-gfp using a ClonExpress® II One Step Cloning Kit (Vazyme Biotech Co., Ltd., Nanjing, China) to obtain a recombinant plasmid, which was transformed into GEB883-competent cells. The recombinant plasmids pSCT32-gfp with target regions were transferred into V. alginolyticus ZJ-T and ZJ-T-△gcvB by conjugation. The resulting strains were confirmed by PCR analysis and sequencing.
After fusions have been engineered on plasmids, Western-blotting was used for the quantification of these target protein fusions. For Western blotting, samples were harvested at OD600 of 0.3~0.4, 1.0~1.5, and 3.0~4.0 from LBS plus 5 μg/mL Cm (Chloramphenicol). Cells from three biological replicates were mixed together, then were centrifuged and resuspended in 100μL/OD600 of 2 × SDS loading buffer (Sangon Biotech, Shanghai, China), followed by incubation at 100 °C for 10 min. The proteins were separated by SDS-PAGE, and transferred to 0.2 μm polyvinylidene difluoride (PVDF) membranes (Millipore, MA, USA). The fused protein was detected using monoclonal anti-GFP (Sangon Biotech, Shanghai, China) with Dnak detected by polyclonal anti-Dnak (Abcam, Cambridge, UK) as loading control. SuperSignal™ West Pico PLUS (Thermo Fisher scientific, MA, USA) was used for visualization. The data presented are the most representative results of the three technical repetitions.

4.11. Hfq Recombinant Protein Construction and Purification

The full-length encoding sequence of hfq gene were amplified by PCR with the primer sets hfq-ORF_F / hfq-ORF_R (Table S3). The plasmid pET28b was amplified with linearized primer pairs pET28b_F/R, and the fragments were then inserted into plasmid pET28b with a ClonExpress® II One Step Cloning Kit (Vazyme Biotech Co., Ltd., Nanjing, China) to obtain a recombinant plasmid, which was transformed into E. coli BL21 (DE3)-competent cells. Strain pET28b-Hfq/BL21 (DE3) was grown to an OD600 of approximately 0.6 at 37 °C with shaking. Hfq production induction and purification were carried out according to reference [65]. Purified Hfq was concentrated using an Amicon Ultra centrifuge tube (Millipore, MA, USA) and stored in PBS buffer.

4.12. RNA Electrophoretic Mobility Shift Assays (RNA-EMSA)

The RNA oligonucleotides for T7 in vitro transcription template, listed in Table S3, were produced by Sangon Biotech (Shanghai, China). RiboTM RNAmax-T7 Biotinylated Transcription Kit (Guangzhou, China) was used for T7 in vitro transcription which was designed to have a single biotin molecule at the 5′ end. T7 high yield RNA transcription kit (Vazyme Biotech Co., Ltd., Nanjing, China) was used for T7 in vitro transcription which was designed to have a non-biotinylated molecule at the 5′ end. The Hfq-GcvB RNA EMSA samples were prepared using an RNA-EMSA kit (BersinBio, Guangzhou, China) according to the instructions of the manufacturer. Hfq-RNA complexes were resolved by electrophoresis through a 6.5% nondenaturing polyacrylamide gel, transferred to a positively charged nylon membrane (Beyotime, Shanghai, China), and subjected to UV cross-linking (150 mJ). The chemiluminescent RNA-EMSA kit was used to visualize the biotinylated RNA.

4.13. RNA Stability

RNA stability measurement of gcvB gene was performed in V. alginolyticus wild-type strain ZJ-T, hfq knockout strain ZJ-T-Δhfq, as previously described [35]. Overnight cultures from a single colony were diluted 1:1000 into LB medium plus 2.5%NaCl (LBS). Cultures were grown to early log phase (OD600 = 0.5~0.6), and 200 μg/mL of rifampin was added to the culture to stop transcription. Cells were harvested immediately (t = 0) and at 4, 8, 16, and 64 min following the rifampin addition and RNA was then purified from the samples as described above and used to generate cDNA. The gcvB gene, along with control 16S rRNA, were detected by qRT-PCR. The percentage of each of the RNAs remaining at each time point was calculated relative to t = 0 (100%).

Supplementary Materials

The following supporting information can be downloaded at: https://www.mdpi.com/article/10.3390/ijms23169399/s1.

Author Contributions

C.C. contributed reagents, materials; conceived and designed the experiments. B.L., J.F., H.C., Y.S., S.Y. and Q.G. performed the experiments; B.L. and J.F. analyzed the data and Y.Z. performed the data visualization. B.L. prepared the original draft and C.C. reviewed and edited the manuscript. All authors have read and agreed to the published version of the manuscript.

Funding

This study was funded by the National Natural Science Foundation of China (31872605), the National Key Research and Development Program of China (2020YFD0901100) and the Special Fund for Strategic Pilot Technology of Chinese Academy of Sciences (XDA13020302).

Institutional Review Board Statement

Not applicable.

Informed Consent Statement

Not applicable.

Data Availability Statement

All RNA sequencing data are deposited in the GenBank (wildtype biosample: SAMN29675353, SRA: SRR20124473-SRR20124475; gcvB mutant strain biosample: SAMN29675354, SRA: SRR20124470-SRR20124472) (accessed on 14 July 2022). All proteome data are deposited in iProX (Integrated Proteome Resources) database (https://www.iprox.cn/page/home.html, accessed on 19 July 2022), the accession ID is IPX0004724001. The other data presented in this study are available in the article.

Acknowledgments

We are grateful to Guangzhou Genedenovo Biotechnology Co., Ltd. for assisting in sequencing and bioinformatics analysis. We thank the data archive support from South China Sea Ocean Data Center (http://data.scsio.ac.cn, accessed on 16 July 2022), National science & Technology infrastructure of China (http://www.geodata.cn, accessed on 16 July 2022).

Conflicts of Interest

The authors declare no conflict of interest.

References

  1. Urbanowski, M.L.; Stauffer, L.T.; Stauffer, G.V. The gcvB gene encodes a small untranslated RNA involved in expression of the dipeptide and oligopeptide transport systems in Escherichia coli. Mol. Microbiol. 2000, 37, 856–868. [Google Scholar] [CrossRef] [PubMed]
  2. Sharma, C.M.; Darfeuille, F.; Plantinga, T.H.; Vogel, J. Small RNA regulates multiple ABC transporter mRNAs by targeting C/A-rich elements inside and upstream of ribosome-binding sites. Genes Dev. 2007, 21, 2804–2817. [Google Scholar] [CrossRef] [Green Version]
  3. Gulliver, E.L.; Wright, A.; Lucas, D.D.; Megroz, M.; Kleifeld, O.; Schittenhelm, R.B.; Powell, D.R.; Seemann, T.; Bulitta, J.B.; Harper, M.; et al. Determination of the small RNA GcvB regulon in the Gram-negative bacterial pathogen Pasteurella multocida and identification of the GcvB seed binding region. Rna 2018, 24, 704–720. [Google Scholar] [CrossRef] [Green Version]
  4. McArthur, S.D.; Pulvermacher, S.C.; Stauffer, G.V. The Yersinia pestis gcvB gene encodes two small regulatory RNA molecules. BMC Microbiol. 2006, 6, 52. [Google Scholar] [CrossRef] [PubMed] [Green Version]
  5. Silveira, A.C.G.; Robertson, K.L.; Lin, B.C.; Wang, Z.; Vora, G.J.; Vasconcelos, A.T.R.; Thompson, F.L. Identification of non-coding RNAs in environmental vibrios. Microbiol. -Sgm 2010, 156, 2452–2458. [Google Scholar] [CrossRef] [PubMed] [Green Version]
  6. Miyakoshi, M.; Okayama, H.; Lejars, M.; Kanda, T.; Tanaka, Y.; Itaya, K.; Okuno, M.; Itoh, T.; Iwai, N.; Wachi, M. Mining RNA-seq data reveals the massive regulon of GcvB small RNA and its physiological significance in maintaining amino acid homeostasis in Escherichia coli. Mol. Microbiol. 2021, 117, 160–178. [Google Scholar] [CrossRef]
  7. Liu, L.J.; Dong, R.R.; Wang, K.G.; Cheng, Z.T.; Wen, M.; Wen, G.L.; Li, C.; Yang, Q.; Zhou, B.J. mRNA-Seq whole transcriptome analysis of sRNA gcvB deletion background in Salmonella. Acta Veter. Zootech. Sin. 2019, 50, 840–850. [Google Scholar]
  8. Jorgensen, M.G.; Nielsen, J.S.; Boysen, A.; Franch, T.; Moller-Jensen, J.; Valentin-Hansen, P. Small regulatory RNAs control the multi-cellular adhesive lifestyle of Escherichia coli. Mol. Microbiol. 2012, 84, 36–50. [Google Scholar] [CrossRef] [Green Version]
  9. Coornaert, A.; Chiaruttini, C.; Springer, M.; Guillier, M. Post-Transcriptional Control of the Escherichia coli PhoQ-PhoP Two-Component System by Multiple sRNAs Involves a Novel Pairing Region of GcvB. PLoS Genet. 2013, 9, e1003156. [Google Scholar] [CrossRef] [Green Version]
  10. Jin, Y.; Watt, R.M.; Danchin, A.; Huang, J.D. Small noncoding RNA GcvB is a novel regulator of acid resistance in Escherichia coli. BMC Genom. 2009, 10, 165. [Google Scholar] [CrossRef] [Green Version]
  11. Ju, X.; Fang, X.X.; Xiao, Y.Z.; Li, B.Y.; Shi, R.P.; Wei, C.L.; You, C.H. Small RNA GcvB Regulates Oxidative Stress Response of Escherichia coli. Antioxidants 2021, 10, 1774. [Google Scholar] [CrossRef] [PubMed]
  12. Muto, A.; Goto, S.; Kurita, D.; Ushida, C.; Himeno, H. Involvement of GcvB small RNA in intrinsic resistance to multiple aminoglycoside antibiotics in Escherichia coli. J. Biochem. 2021, 169, 485–489. [Google Scholar] [CrossRef] [PubMed]
  13. Pulvermacher, S.C.; Stauffer, L.T.; Stauffer, G.V. The role of the small regulatory RNA GcvB in GcvB/mRNA posttranscriptional regulation of oppA and dppA in Escherichia coli. Fems Microbiol. Lett. 2008, 281, 42–50. [Google Scholar] [CrossRef] [PubMed] [Green Version]
  14. Pulvermacher, S.C.; Stauffer, L.T.; Stauffer, G.V. The Small RNA GcvB Regulates sstT mRNA Expression in Escherichia coli. J. Bacteriol. 2009, 191, 238–248. [Google Scholar] [CrossRef] [PubMed] [Green Version]
  15. Pulvermacher, S.C.; Stauffer, L.T.; Stauffer, G.V. Role of the Escherichia coli Hfq protein in GcvB regulation of oppA and dppA mRNAs. Microbiol. -Sgm 2009, 155, 115–123. [Google Scholar] [CrossRef]
  16. Sharma, C.M.; Papenfort, K.; Pernitzsch, S.R.; Mollenkopf, H.-J.; Hinton, J.C.D.; Vogel, J. Pervasive post-transcriptional control of genes involved in amino acid metabolism by the Hfq-dependent GcvB small RNA. Mol. Microbiol. 2011, 81, 1144–1165. [Google Scholar] [CrossRef]
  17. Yang, Q.; Figueroa-Bossi, N.; Bossi, L. Translation Enhancing ACA Motifs and Their Silencing by a Bacterial Small Regulatory RNA. PLoS Genet. 2014, 10, e1004026. [Google Scholar] [CrossRef] [Green Version]
  18. Lee, H.-J.; Gottesman, S. sRNA roles in regulating transcriptional regulators: Lrp and SoxS regulation by sRNAs. Nucleic Acids Res. 2016, 44, 6907–6923. [Google Scholar] [CrossRef] [Green Version]
  19. Lalaouna, D.; Eyraud, A.; Devinck, A.; Prevost, K.; Masse, E. GcvB small RNA uses two distinct seed regions to regulate an extensive targetome. Mol. Microbiol. 2019, 111, 473–486. [Google Scholar] [CrossRef]
  20. Miyakoshi, M.; Chao, Y.; Vogel, J. Cross talk between ABC transporter mRNAs via a target mRNA-derived sponge of the GcvB small RNA. Embo J. 2015, 34, 1478–1492. [Google Scholar] [CrossRef]
  21. Pulvermacher, S.C.; Stauffer, L.T.; Stauffer, G.V. Role of the sRNA GcvB in regulation of cycA in Escherichia coli. Microbiol. -Sgm 2009, 155, 106–114. [Google Scholar] [CrossRef] [PubMed] [Green Version]
  22. Melamed, S.; Peer, A.; Faigenbaum-Romm, R.; Gatt, Y.E.; Reiss, N.; Bar, A.; Altuvia, Y.; Argaman, L.; Margalit, H. Global Mapping of Small RNA-Target Interactions in Bacteria. Mol. Cell 2016, 63, 884–897. [Google Scholar] [CrossRef] [PubMed] [Green Version]
  23. Melamed, S.; Adams, P.P.; Zhang, A.X.; Zhang, H.G.; Storz, G. RNA-RNA Interactomes of ProQ and Hfq Reveal Overlapping and Competing Roles. Mol. Cell 2020, 77, 411. [Google Scholar] [CrossRef] [PubMed]
  24. Iosub, I.A.; van Nues, R.W.; McKellar, S.W.; Nieken, K.J.; Marchioretto, M.; Sy, B.; Tree, J.J.; Viero, G.; Granneman, S. Hfq CLASH uncovers sRNA-target interaction networks linked to nutrient availability adaptation. eLife 2020, 9, e54655. [Google Scholar] [CrossRef]
  25. Xie, J.; Bu, L.; Jin, S.; Wang, X.; Zhao, Q.; Zhou, S.; Xu, Y. Outbreak of vibriosis caused by Vibrio harveyi and Vibrio alginolyticus in farmed seahorse Hippocampus kuda in China. Aquaculture 2020, 523, 735168. [Google Scholar] [CrossRef]
  26. Xie, Z.; Ke, S.; Hu, C.; Zhu, Z.; Wang, S.; Zhou, Y. First Characterization of Bacterial Pathogen, Vibrio alginolyticus, for Porites andrewsi White Syndrome in the South China Sea. PLoS ONE 2013, 8, e75425. [Google Scholar]
  27. Taylor, R.; Mcdonald, M.; Russ, G.; Carson, M.; Lukaczynski, E. Vibrio alginolyticus peritonitis associated with ambulatory peritoneal dialysis. Br. Med. J. 1981, 283, 275. [Google Scholar] [CrossRef] [Green Version]
  28. Opal, S.M.; Saxon, J.R.; Opal, S.M.; Saxon, J.R. Intracranial infection by Vibrio alginolyticus following injury in salt water. J. Clin. Microbiol. 1986, 23, 373. [Google Scholar] [CrossRef] [Green Version]
  29. Barbarossa, V.; Kucisec-Tepes, N.; Aldova, E.; Matek, D.; Stipoljev, F. Ilizarov technique in the treatment of chronic osteomyelitis caused by Vibrio alginolyticus. Croat. Med. J. 2002, 43, 346–349. [Google Scholar]
  30. Chien, J.; Shih, J.; Hsueh, P.; Yang, P.; Luh, K.J.E.J.C.M.I.D. Vibrio alginolyticus as the cause of pleural empyema and bacteremia in an immunocompromised patient. Eur. J. Clin. Microbiol. Infect. Dis. 2002, 21, 401–403. [Google Scholar]
  31. Feingold, M.H.; Kumar, M.L. Otitis media associated with Vibrio alginolyticus in a child with pressure-equalizing tubes. Pediatric Infect. Dis. J. 2004, 23, 475–476. [Google Scholar] [CrossRef] [PubMed]
  32. Li, X.C.; Xiang, Z.Y.; Xu, X.M.; Yan, W.H.; Ma, J.M. Endophthalmitis Caused by Vibrio alginolyticus. J. Clin. Microbiol. 2009, 47, 3379–3381. [Google Scholar] [CrossRef] [PubMed] [Green Version]
  33. Hong, G.L.; Dai, X.Q.; Lu, C.J.; Liu, J.M.; Zhao, G.J.; Wu, B.; Li, M.F.; Lu, Z.Q. Temporizing surgical management improves outcome in patients with Vibrio necrotizing fasciitis complicated with septic shock on admission. Burns 2014, 40, 446–454. [Google Scholar] [CrossRef] [PubMed]
  34. Deng, Y.; Chen, C.; Zhao, Z.; Zhao, J.; Annick, J.; Huang, X.; Yang, Y.; Mikael, S. The RNA Chaperone Hfq Is Involved in Colony Morphology, Nutrient Utilization and Oxidative and Envelope Stress Response in Vibrio alginolyticus. PLoS ONE 2016, 11, e0163689. [Google Scholar] [CrossRef]
  35. Liu, B.; Gao, Q.; Zhang, X.; Chen, H.; Zhang, Y.; Sun, Y.; Yang, S.; Chen, C. CsrA Regulates Swarming Motility and Carbohydrate and Amino Acid Metabolism in Vibrio alginolyticus. Microorganisms 2021, 9, 2383. [Google Scholar] [CrossRef]
  36. Deng, Y.; Chen, C.; Zhao, Z.; Huang, X.; Yang, Y.; Ding, X. Complete Genome Sequence of Vibrio alginolyticus ZJ-T. Genome Announc. 2016, 4, e00912-16. [Google Scholar] [CrossRef] [Green Version]
  37. Deng, Y.Q.; Luo, X.; Xie, M.; Bouloc, P.; Chen, C.; Jacq, A. The ilvGMEDA Operon Is Regulated by Transcription Attenuation in Vibrio alginolyticus ZJ-T. Appl. Environ. Microbiol. 2019, 85, e00880-19. [Google Scholar] [CrossRef] [Green Version]
  38. Zhou, Y.H.; Yu, F.; Chen, M.; Zhang, Y.F.; Qu, Q.W.; Wei, Y.R.; Xie, C.M.; Wu, T.; Liu, Y.Y.; Zhang, Z.Y.; et al. Tylosin Inhibits Streptococcus suis Biofilm Formation by Interacting With the O-acetylserine (thiol)-lyase B CysM. Front. Vet. Sci. 2022, 8, 829899. [Google Scholar] [CrossRef]
  39. Poole, P.S.; Franklin, M.; Glenn, A.R.; Dilworth, M.J. The transport of L-glutamate by Rhizobium-Leguminosarum involves a common amino-acid carrier. J. Gen. Microbiol. 1985, 131, 1441–1448. [Google Scholar] [CrossRef] [Green Version]
  40. Walshaw, D.L.; Poole, P.S. The general L-amino acid permease of Rhizobium leguminosarum is an ABC uptake system that also influences efflux of solutes. Mol. Microbiol. 1996, 21, 1239–1252. [Google Scholar] [CrossRef]
  41. Cascales, E. The type VI secretion toolkit. Embo Rep. 2008, 9, 735–741. [Google Scholar] [CrossRef] [Green Version]
  42. Costa, T.R.D.; Felisberto-Rodrigues, C.; Meir, A.; Prevost, M.S.; Redzej, A.; Trokter, M.; Waksman, G. Secretion systems in Gram-negative bacteria: Structural and mechanistic insights. Nat. Rev. Microbiol. 2015, 13, 343–359. [Google Scholar] [CrossRef] [PubMed]
  43. Diepold, A.; Kudryashev, M.; Delalez, N.J.; Berry, R.M.; Armitage, J.P. Composition, Formation, and Regulation of the Cytosolic C-ring, a Dynamic Component of the Type III Secretion Injectisome. PLoS Biol. 2015, 13, e1002039. [Google Scholar] [CrossRef] [PubMed] [Green Version]
  44. Hood, R.D.; Singh, P.; Hsu, F.S.; Guvener, T.; Carl, M.A.; Trinidad, R.R.S.; Silverman, J.M.; Ohlson, B.B.; Hicks, K.G.; Plemel, R.L.; et al. A Type VI Secretion System of Pseudomonas aeruginosa Targets, a Toxin to Bacteria. Cell Host Microbe 2010, 7, 25–37. [Google Scholar] [CrossRef] [PubMed] [Green Version]
  45. Brooks, T.M.; Unterweger, D.; Bachmann, V.; Kostiuk, B.; Pukatzki, S. Lytic Activity of the Vibrio cholerae Type VI Secretion Toxin VgrG-3 Is Inhibited by the Antitoxin TsaB. J. Biol. Chem. 2013, 288, 7618–7625. [Google Scholar] [CrossRef] [Green Version]
  46. Dong, T.G.; Ho, B.T.; Yoder-Himes, D.R.; Mekalanos, J.J. Identification of T6SS-dependent effector and immunity proteins by Tn-seq in Vibrio cholerae. Proc. Natl. Acad. Sci. USA 2013, 110, 2623–2628. [Google Scholar] [CrossRef] [Green Version]
  47. Vogel, J.; Luisi, B.F. Hfq and its constellation of RNA. Nat. Rev. Microbiol. 2011, 9, 578–589. [Google Scholar] [CrossRef] [Green Version]
  48. Lensmire, J.M.; Hammer, N.D. Nutrient sulfur acquisition strategies employed by bacterial pathogens. Curr. Opin. Microbiol. 2019, 47, 52–58. [Google Scholar] [CrossRef]
  49. Singh, P.; Brooks, J.F.; Ray, V.A.; Mandel, M.J.; Visick, K.L. CysK Plays a Role in Biofilm Formation and Colonization by Vibrio fischeri. Appl. Environ. Microbiol. 2015, 81, 5223–5234. [Google Scholar] [CrossRef] [Green Version]
  50. Wasilko, N.P.; Larios-Valencia, J.; Steingard, C.H.; Nunez, B.M.; Verma, S.C.; Miyashiro, T. Sulfur availability for Vibrio fischeri growth during symbiosis establishment depends on biogeography within the squid light organ. Mol. Microbiol. 2019, 111, 621–636. [Google Scholar] [CrossRef]
  51. Chen, H.; Previero, A.; Deutscher, M.P. A novel mechanism of ribonuclease regulation: GcvB and Hfq stabilize the mRNA that encodes RNase BN/Z during exponential phase. J. Biol. Chem. 2019, 294, 19997–20008. [Google Scholar] [CrossRef] [PubMed]
  52. Zhao, Z.; Chen, C.; Hu, C.-Q.; Ren, C.-H.; Zhao, J.-J.; Zhang, L.-P.; Jiang, X.; Luo, P.; Wang, Q.-B. The type III secretion system of Vibrio alginolyticus induces rapid apoptosis, cell rounding and osmotic lysis of fish cells. Microbiol. -Sgm 2010, 156, 2864–2872. [Google Scholar] [CrossRef] [PubMed] [Green Version]
  53. Zhao, Z.; Liu, J.X.; Deng, Y.Q.; Huang, W.; Ren, C.H.; Call, D.R.; Hu, C.Q. The Vibrio alginolyticus T3SS effectors, Val1686 and Val1680, induce cell rounding, apoptosis and lysis of fish epithelial cells. Virulence 2018, 9, 318–330. [Google Scholar] [CrossRef] [PubMed] [Green Version]
  54. Janssen, K.H.; Corley, J.M.; Djapgne, L.; Cribbs, J.T.; Voelker, D.; Slusher, Z.; Nordell, R.; Regulski, E.E.; Kazmierczak, B.I.; McMackin, E.W.; et al. Hfq and sRNA 179 Inhibit Expression of the Pseudomonas aeruginosa CAMP-Vfr and Type III Secretion Regulons. mBio 2020, 11, e00363-20. [Google Scholar] [CrossRef]
  55. Chang, C.; Jin, X.; Hu, C. Phenotypic and genetic differences between opaque and translucent colonies of Vibrio alginolyticus. Biofouling 2009, 25, 525–531. [Google Scholar] [CrossRef]
  56. Nguyen, A.N.; Disconzi, E.; Charriere, G.M.; Destoumieux-Garzon, D.; Bouloc, P.; Le Roux, F.; Jacq, A. csrB Gene Duplication Drives the Evolution of Redundant Regulatory Pathways Controlling Expression of the Major Toxic Secreted Metalloproteases in Vibrio tasmaniensis LGP32. Msphere 2018, 3, e00582-18. [Google Scholar] [CrossRef] [Green Version]
  57. Val, M.E.; Skovgaard, O.; Ducos-Galand, M.; Bland, M.J.; Mazel, D. Genome engineering in Vibrio cholerae: A feasible approach to address biological issues. PLoS Genet. 2012, 8, e1002472. [Google Scholar] [CrossRef] [Green Version]
  58. Morales, V.M.; Backman, A.; Bagdasarian, M. A series of wide-host-range low-copy-number vectors that allow direct screening for recombinants. Gene 1991, 97, 39–47. [Google Scholar] [CrossRef]
  59. Zhang, Y.-J.; Chen, G.; Lin, H.; Wang, P.; Kuang, B.; Liu, J.; Chen, S. Development of a regulatable expression system for the functional study of Vibrio vulnificus essential genes. Antonie Van Leeuwenhoek 2017, 110, 607–614. [Google Scholar] [CrossRef]
  60. Langmead, B.; Salzberg, S.L. Fast gapped-read alignment with Bowtie 2. Nat. Methods 2012, 9, 357-U54. [Google Scholar] [CrossRef] [Green Version]
  61. Li, B.; Dewey, C.N. RSEM: Accurate transcript quantification from RNA-Seq data with or without a reference genome. BMC Bioinform. 2011, 12, 323. [Google Scholar] [CrossRef] [PubMed] [Green Version]
  62. Szklarczyk, D.; Gable, A.L.; Lyon, D.; Junge, A.; Wyder, S.; Huerta-Cepas, J.; Simonovic, M.; Doncheva, N.T.; Morris, J.H.; Bork, P.; et al. STRING v11: Protein-protein association networks with increased coverage, supporting functional discovery in genome-wide experimental datasets. Nucleic Acids Res. 2019, 47, D607–D613. [Google Scholar] [CrossRef] [PubMed] [Green Version]
  63. Kohl, M.; Wiese, S.; Warscheid, B. Cytoscape: Software for visualization and analysis of biological networks. Methods Mol. Biol. 2011, 696, 291–303. [Google Scholar] [PubMed]
  64. Livak, K.J.; Schmittgen, T.D. Analysis of relative gene expression data using real-time quantitative PCR and the 2(T)(-Delta Delta C) method. Methods 2001, 25, 402–408. [Google Scholar] [CrossRef]
  65. Butz, H.A.; Mey, A.R.; Ciosek, A.L.; Payne, S.M. Vibrio cholerae CsrA Directly Regulates varA To Increase Expression of the Three Nonredundant Csr Small RNAs. mBio 2019, 10, e01042-19. [Google Scholar] [CrossRef] [Green Version]
Figure 1. Bioinformatic analysis of gcvB sequence of V. alginolyticus and its expression in LBS. (A) Schematic diagram of small RNA GcvB encoding locations. PgcvA and PgcvB indicate gene gcvA and gcvB promoter, and arrows indicate transcription direction and coding direction; (B) phylogenetic analysis of gcvB among various species using the Maximum likelihood-method with a bootstrap value of 300; (C) conservation analysis of GcvB sequences among various species; (D) relative expression of GcvB in different phase (Student ’s t-test, p value: *, <0.05, **, <0.01). The levels of gcvB were normalized to the internal control 16S rRNA level. Error bars indicate standard deviations.
Ijms 23 09399 g001
Figure 2. The relative expression of gcvB in wildtype, gcvB mutant and complementary strains (Student ’s t-test, p value: **, <0.01, ****, <0.0001). The levels of gcvB were normalized to the internal control 16S rRNA level. Error bars indicate standard deviations.
Ijms 23 09399 g002
Figure 3. Growth curves of wildtype, gcvB knockout and complementary strains under different nutrient conditions. Growth curves of the wild type, gcvB knockout and complementary strains grown in LB + 2.5% NaCl rich medium(A), minimal medium M63 which D-glucose and (NH4)2SO4 were left out and replaced by the amino acids: branched chain amino acids (20 mM isoleucine, 20 mM leucine and 20 mM valine), (B) 30 mM L-Aspartic acid, (C) 50 mM L-Arginine, (D) 50 mM L-threonine, (E) 50 mM L-serine, (F) and 150 mM L-Alanine (G) as the sole carbon and nitrogen sources. Growth curves of M63 containing (NH4)2SO4 and 150 mM L-Alanine, (H) M63 plus (NH4)2SO4 plus D-glucose (I). For growth curves, three biological replicates are shown as points with their average values connected by lines. Error bars indicate the standard deviations (SD).
Ijms 23 09399 g003
Figure 4. Overview of RNA transcriptomic profiles of wildtype and gcvB mutant strains. (A) Volcanic map of differential genes in transcriptome (FDR < 0.05, |log2(fold change)| ≥ 1). The red dot represents significantly up-regulated difference; the yellow dot represents significantly down-regulated difference; the blue dot represents no difference; (B) Statistical column chart of differential expressed genes. WT: wild-type strain Vibrio alginolyticus ZJ-T; gcvB: gcvB knockout strain ZJ-T-△gcvB; (C) histogram of top 20 of KEGG pathway enrichment in transcriptomics after inactivation of gcvB.
Ijms 23 09399 g004
Figure 5. Overview of proteomic profiles of wildtype and gcvB mutant strains. (A) Volcanic map of differential genes in proteomics (FDR < 0.05, |fold change| ≥ 1.5). The red dot represents significantly up-regulated difference; the blue dot represents significantly down-regulated difference; the black dot represents no difference; (B) statistical column chart of differential expressed proteins. WT: wild-type strain Vibrio alginolyticus ZJ-T; gcvB: gcvB knockout strain ZJ-T-△gcvB; (C) histogram of top 20 of KEGG pathway enrichment in proteomics when gcvB was knockout.
Ijms 23 09399 g005
Figure 6. (A) Venn diagram of differentially expressed genes (DEGs) and differentially expressed proteins (DEPs) between wildtype and gcvB knockout strains; (B) PPI network of the identified DEPs (STRING score >  700). These genes showed consistent changes in gene expression with the shape of the lactation curve. The genes located at key nodes were also listed in supplementary Table S4.
Ijms 23 09399 g006
Figure 7. Effects of GcvB on valine/leucine/isoleucine biosynthetic pathway. (A) Relative expression of genes (ilvC, ilvD, ilvE) involved in the valine/leucine/isoleucine biosynthetic pathway by qRT-PCR (Student ’s t-test, p value: **, <0.01). The levels of gcvB were normalized to the internal control 16S rRNA level. Error bars indicate standard deviations; (B) Western blot detection of IlvG translational fusion. For Western blotting, samples were harvested at OD600nm of 0.3~0.4 (early-log), 1.0~1.5 (mid-log), and 3.0~4.0 (stationary) from LBS plus 5 μg/mL Cm (chloramphenicol). Polyclonal anti-Dnak was used as loading control.
Ijms 23 09399 g007
Figure 8. Effects of GcvB on sulfur and cysteine biosynthesis metabolism pathway. (A) Relative expression of genes involved in the sulfur and cysteine biosynthesis metabolism pathway by qRT-PCR (Student ’s t-test, p value: ns, >0.05, **, <0.01). The levels of gcvB were normalized to the internal control 16S rRNA level. Error bars indicate standard deviations; (B) Western blot detection of CysN and CysK translational fusion. For Western blotting, samples were harvested at OD600 of 0.3~0.4 (early-log), 1.0~1.5 (mid-log) and 3.0~4.0 (stationary) from LBS plus 5 μg/mL Cm (chloramphenicol). Polyclonal anti-Dnak was used as loading control.
Ijms 23 09399 g008
Figure 9. Relative expression of genes involved in the histidine metabolism pathway by qRT-PCR (Student ’s t-test, p value: **, <0.01). The levels of gcvB were normalized to the internal control 16S rRNA level. Error bars indicate standard deviations.
Ijms 23 09399 g009
Figure 10. Effects of Hfq on GcvB. (A) Relative expression of GcvB at different periods of wildtype and hfq deletion strains. (B) Stability measurements of GcvB in hfq mutant strains. The half-life of GcvB is about 15 min in wild strain ZJ-T, but it is shortened to no more than 4 min in hfq deletion strain. (C) The Hfq protein binds specifically to GcvB. The picture shows the binding of GcvB to protein Hfq detected by RNA-EMSA. The Hfq protein was continuously added from 0 μg (group 1) to 1.5 μg (group 11). When the concentration of Hfq protein reached 1.05 μg (group 8), the binding of GcvB had reached saturation. After the addition of the non-biotinylated GcvB probe (groups 12, 13, 14), the biotinylated GcvB* was competitively eluted.
Ijms 23 09399 g010
Figure 11. V. alginolyticus GcvB regulon. Boxes indicate major pathways regulated by GcvB. Solid arrows and bars indicate those that have been confirmed by EMSA. Dotted lines and bars show processes that have been confirmed by genetic or phenotypic analysis.
Ijms 23 09399 g011
Table 1. Strains and plasmids used in this study.
Strains or PlasmidsRelevant CharacteristicsSource
Vibrio alginolyticus
ZJ-TApr, translucent/smooth variant of wild strain ZJ51; isolated from diseased Epinephelus coioides off the Southern China coast[55]
ZJ-T-ΔgcvBApr; ZJ-T carrying a deletion of gcvBThis study
ZJ-T-△gcvB+Cmr; ZJ-T carrying a GcvB complementation plasmid pMMB207-gcvBThis study
ZJ-T-ΔhfqApr; ZJ-T carrying a deletion of hfq[34]
ZJ-T/pSCT32-gfp-ilvG-TLCmr; ZJ-T carrying a cysK translational fusion plasmid pSCT32-gfp-ilvG-TLThis study
ZJ-T-△gcvB/pSCT32-gfp-ilvG-TLCmr; ZJ-T-△gcvB carrying a cysK translational fusion plasmid pSCT32-gfp-ilvG-TLThis study
ZJ-T/pSCT32-gfp-cysK-TLCmr; ZJ-T carrying a cysK translational fusion plasmid pSCT32-gfp-cysK-TLThis study
ZJ-T-△gcvB/pSCT32-gfp-cysK-TLCmr; ZJ-T-△gcvB carrying a cysK translational fusion plasmid pSCT32-gfp-cysK-TLThis study
ZJ-T/pSCT32-gfp-cysN -TLCmr; ZJ-T carrying a cysN translational fusion plasmid pSCT32-gfp-cysD-TLThis study
ZJ-T-△gcvB/SCT32-gfp-cysN-TLCmr; ZJ-T-△gcvB carrying a cysN translational fusion plasmid pSCT32-gfp-cysD-TLThis study
E. coli
GEB883WT; E. coli K12 ΔdapA::ermpir RP4-2 ΔrecA gyrA462, zei298::Tn10; donor strain for conjugation[56]
pET28b-Hfq/BL21(DE3)Kanr; E. coli BL21(DE3) carrying the fusion expression plasmid pET28b-Hfq::His tagThis study
Plasmids
pSW7848Cmr; suicide vector with an R6K origin, requiring the Pir protein for its replication, and the ccdB toxin gene[57]
pSW7848-ΔgcvBCmr; pSW7848 containing the mutant allele of ΔgcvBThis study
pMMB207Cmr; RSF1010 derivative, IncQ lacIq Ptac oriT[58]
pMMB207-gcvBCmr; pMMB207 containing the wild-type allele of gcvBThis study
pSCT32Cmr; expression plasmid with a pBR322 and a f1 origin at the same time and a tac promoter[59]
pSCT32-gfpCmr; pSCT32 containing reporter gene gfp coding green fluorescent proteinThis study
pSCT32-gfp-ilvG-TLCmr; ilvG sequences (including its promotor and start codon) are translationally fused to pSCT32-gfpThis study
pSCT32-gfp-cysK-TLCmr; cysK sequences (including its promotor and start codon) are translationally fused to pSCT32-gfpThis study
pSCT32-gfp-cysN-TLCmr; cysN sequences (including its promotor and start codon) are translationally fused to pSCT32-gfpThis study
pET28bKanr; expression plasmid with a pBR322 origin, T7 promoter and 6×histag.Xiaoxue Wang
Note: Cmr and Apr indicate chloramphenicol and ampicillin resistance, respectively.
Publisher’s Note: MDPI stays neutral with regard to jurisdictional claims in published maps and institutional affiliations.

