Article

Genome-Wide Identification and Expression Patterns of the SWEET Gene Family in Bletilla striata and its Responses to Low Temperature and Oxidative Stress

National Engineering Laboratory for Resource Development of Endangered Crude Drugs in Northwest China, Key Laboratory of the Ministry of Education for Medicinal Resources and Natural Pharmaceutical Chemistry, College of Life Sciences, Shaanxi Normal University, Xi’an 710119, China
*
Authors to whom correspondence should be addressed.
Int. J. Mol. Sci. 2022, 23(17), 10057; https://doi.org/10.3390/ijms231710057
Submission received: 2 August 2022 / Revised: 28 August 2022 / Accepted: 30 August 2022 / Published: 2 September 2022
(This article belongs to the Special Issue Orchid Biochemistry)

Abstract

:
SWEETs (sugars will eventually be exported transporters), a well-known class of sugar transporters, are involved in plant growth and development, sugar transport, biotic and abiotic stresses, etc. However, to date, there have been few investigations of SWEETs in Orchidaceae. In this study, 23 SWEET genes were identified in Bletilla striata for the first time, with an MtN3/saliva conserved domain, and were divided into four subgroups by phylogenetic tree. The same subfamily members had similar gene structures and motifs. Multiple cis-elements related to sugar and environmental stresses were found in the promoter region. Further, 21 genes were localized on 11 chromosomes and 2 paralogous pairs were found via intraspecific collinearity analysis. Expression profiling results showed that BsSWEETs were tissue-specific. It also revealed that BsSWEET10 and BsSWEET18 were responsive to low temperature and oxidative stresses. In addition, subcellular localization study indicated that BsSWEET15 and BsSWEET16 were localized in the cell membrane. This study provided important clues for the in-depth elucidation of the sugar transport mechanism of BsSWEET genes and their functional roles in response to abiotic stresses.

1. Introduction

Sugar is an essential organic substance and important source of energy for plants [1], in which glucose, sucrose, etc., are soluble sugars, whereas starch and cellulose are insoluble sugars [2]. These sugars have a variety of functions, such as providing carbon sources for other substances, regulating osmotic pressure, and providing energy for vital cellular activities [3,4,5,6,7].
Plants use photosynthesis to convert atmospheric CO2 to sources of sugar that they can use [8]. Mesophyll tissues that synthesize sugars in plants are called source tissues, whereas others that cannot are referred to as sink tissues. The sugars synthesized in source tissues are transported and assigned to sink tissues to ensure normal plant growth and development [9]. In higher plants, sucrose is synthesized via photosynthesis in mesophyll cells (source tissues), and transported over long distances by sugar transporters to plant organs (sink tissues), such as roots, stems, flowers, and seeds, providing nutrients for the growth and development of new cells [10,11,12]. Since sugar compounds, (e.g., sucrose, glucose, and fructose) cannot be transported to sedimentary tissues through plant biofilm systems they require the assistance of corresponding sugar transporters, which are key to their distribution [13,14]. SWEET (sugars will eventually be exported transporter) comprises a notable class of sugar transporter that was discovered in plants in recent years [15], which, independently of the environmental pH, could promote the diffusion of sucrose to the plasmodesmata along the concentration gradient during efflux. Further, it can regulate the uptake of glucose through the cell membrane in the form of glucose transporters, with the function of bidirectional sugar transporters [16]. A typical SWEET protein consists of seven transmembrane domains (TMs), of which three are more conserved TMs that form the MtN3/saliva structural domain, and the middle is connected by a less conserved TM [17]. Studies have shown that SWEET proteins can homo- and heterooligomerize to create functional pores; thus, providing transport channels and driving their functions [18].
SWEET proteins have been shown to affect important physiological processes during plant growth and development by regulating the transport, distribution, and storage of sugar compounds [19]. SWEET proteins were observed to be involved in phloem loading during plant sugar metabolism, where AtSWEET11 and AtSWEET12 were not only localized in the cytoplasmic membrane, but also highly expressed in the cytoplasms of thin-walled phloem tissues, which could sequester the sucrose of leaves into vascular bundles [20]. SWEET proteins were also associated with the development of flowers, fruits, and seeds, where AtSWEET8 primarily affected fertility during the early development of inflorescence, and AtSWEET13 mainly influenced fertility in later inflorescence development [21,22]. Meanwhile, the SWEET gene family is involved in plant–pathogen interactions, such as the sugars produced by OsSWEET11/14, which provide nutrients for Xoo (Xanthomonas oryzae pv. oryzae) and stimulate its growth and development [23,24]. Further, the involvement of SWEET warrants special attention in the development of root and stem shoots. Previous studies indicated that the formation of potato tubers depended on the relationship between the photoperiod and sugar transport. StSP6A interacts with StSWEET11 to prevent sucrose leakage and promote symbiotic sucrose transport to regulate potato tuber formation [25], which also opens the possibility of source–sink interactions.
Bletilla striata (Thunb.) Reichb. f. is a perennial herb of the Orchidaceae family, which is not only an ornamental plant in Europe and America but also a significant astringent medicinal plant that is native to East Asia, where its dried pseudobulb is used as medicine [26,27,28]. Polysaccharides and stilbenes are the main bioactive chemical components of the genus Bletilla, and modern pharmacological studies show that there are hemostatic, anti-inflammatory, anti-ulcer, anti-bacterial, and anti-tumor pharmacological activities [29]. It is well-known that metals such as Cu have the potential to generate •OH and induce oxidative stress [30]. BsPP2C, BsSnPK2.6, and BsPYL6 responded to various stresses, including low temperature and oxidative stress [31]. The PSII photosynthetic system of B. striata is disrupted by low temperature treatment, which further affects plant growth [32]. Due to its important medicinal value and significantly reduced wild natural resources, researchers have begun to cultivate it artificially [33], being mindful that polysaccharides play a crucial role in its tuber quality. Although SWEET genes have been functionally characterized in Arabidopsis thaliana and other plants, their functions in most species remain unclear. This is particularly the case for B. striata, for which the SWEET gene family remains poorly understood.
Since gene functional analysis is the core pursuit of plant molecular biology, this study aimed to conduct a genome-wide analysis of the SWEET gene family in B. striata, with a specific focus on physicochemical properties, phylogenetic relationship, chromosomal location, conserved motifs, gene structures, cis-acting elements in the promoter region, and synteny analysis. We also investigated the expression patterns of BsSWEET genes in different tissues under low temperature and oxidative stress. Additionally, we performed subcellular localization study to further explore whether BsSWEETs were involved in sugar transport. This study will provide insights for future investigations into plant stress response. Further, it will lay the foundation for research into the regulation of SWEET genes toward optimizing the accumulation and distribution of sugar.
The SWEET gene family has not been systematically and completely analyzed in medicinal Orchidaceae. This is the first time we performed a comprehensive analysis of the SWEET gene family in B. striata, expression patterns under different treatments, and the subcellular localization of BsSWEET15/16. Finally, we will discuss the possibility that BsSWEET15/16 may form homodimers or heterodimers, and speculate that BsSWEET15 and CTG2800.4 may interact in sucrose transport in B. striata. New insights will be provided for the study of SWEET genes related to growth and development and sugar transport in medicinal Orchidaceae.

2. Results

2.1. Identification and Characterization of BsSWEET Genes

A total of 23 BsSWEET genes were identified based on gene annotation data from NR and KEGG databases and a comparison of conserved domains. SMART, InterPro, and NCBI-CDD revealed that all BsSWEETs contained one or two MtN3/saliva conserved domains (PF03083). We designated them BsSWEET1~BsSWEET23 according to chromosomal location (Table S1).
The physicochemical characteristics of the BsSWEET genes (e.g., name, protein length, molecular weight, and isoelectric point) are shown in Table S1. The number of amino acids contained in BsSWEET proteins ranged from 112 (BsSWEET9) to 299 aa (BsSWEET16), whereas the molecular weights ranged from 12.5 kD to 33.4 kD. Except for BsSWEET5 and BsSWEET9, the isoelectric points of other BsSWEET proteins were greater than seven; thus, it was presumed that most BsSWEET proteins were basic proteins. Moreover, all BsSWEET proteins were hydrophobic and had no signal peptides (Figures S1 and S2). The subcellular localization prediction indicated that all SWEET proteins were located in the plasma membrane. Most BsSWEET proteins typically contained six to seven transmembrane domains, and the transmembrane domain structure was dominated by α-helix (Figures S3 and S4 and Table S2). It was speculated that SWEET proteins provided sugar transport channels in the plasma membrane. The abundance of phosphorylation sites in the BsSWEET proteins indicated that they were regulated by kinases that induced functions through phosphorylation and dephosphorylation, or might have been co-regulated by other regulatory modes (Figure S5 and Table S3).

2.2. Multiple Sequence Alignment and Phylogenetic Relationship of BsSWEET Genes

To obtain an in-depth understanding of the characteristics of the conserved BsSWEET domains, we conducted multiple sequence alignments and found that most BsSWEET gene family members had at least one complete MtN3/saliva domain, among which BsSWEET2/5/9/12/13/19 contained only one MtN3/saliva conserved domain, whereas the other BsSWEET genes had two (Figure 1 and Figure S6).
To explore the phylogenetic relationships of the BsSWEET gene family, we constructed a phylogenetic tree with 71 genes from B. striata, A. thaliana, Oryza sativa, and Vitis vinifera. The results revealed a more intimate relationship between B. striata and V. vinifera (Figure 2). In accordance with previous studies, SWEET members in the abovementioned four species were divided into four subfamilies. The distribution of BsSWEET members in clades II and III was the largest, with nine (39.1%) and eight (34.8%), respectively. There were four and two BsSWEET genes in clades I and II, respectively. Based on the distribution and corresponding functions of the SWEET subfamily in A. thaliana and O. sativa, the potential functions of each BsSWEET gene member could be predicted. Plant phylogenetic analysis indicated that clade I primarily transported glucose, clade II transported hexose, clade III mainly transported sucrose, and clade IV transported fructose. It was speculated that BsSWEET6/15/16 and other genes might be involved in the transport of sucrose in the plastid extracellular pathway [34].

2.3. Gene Structures and Conserved Motifs of BsSWEET Genes

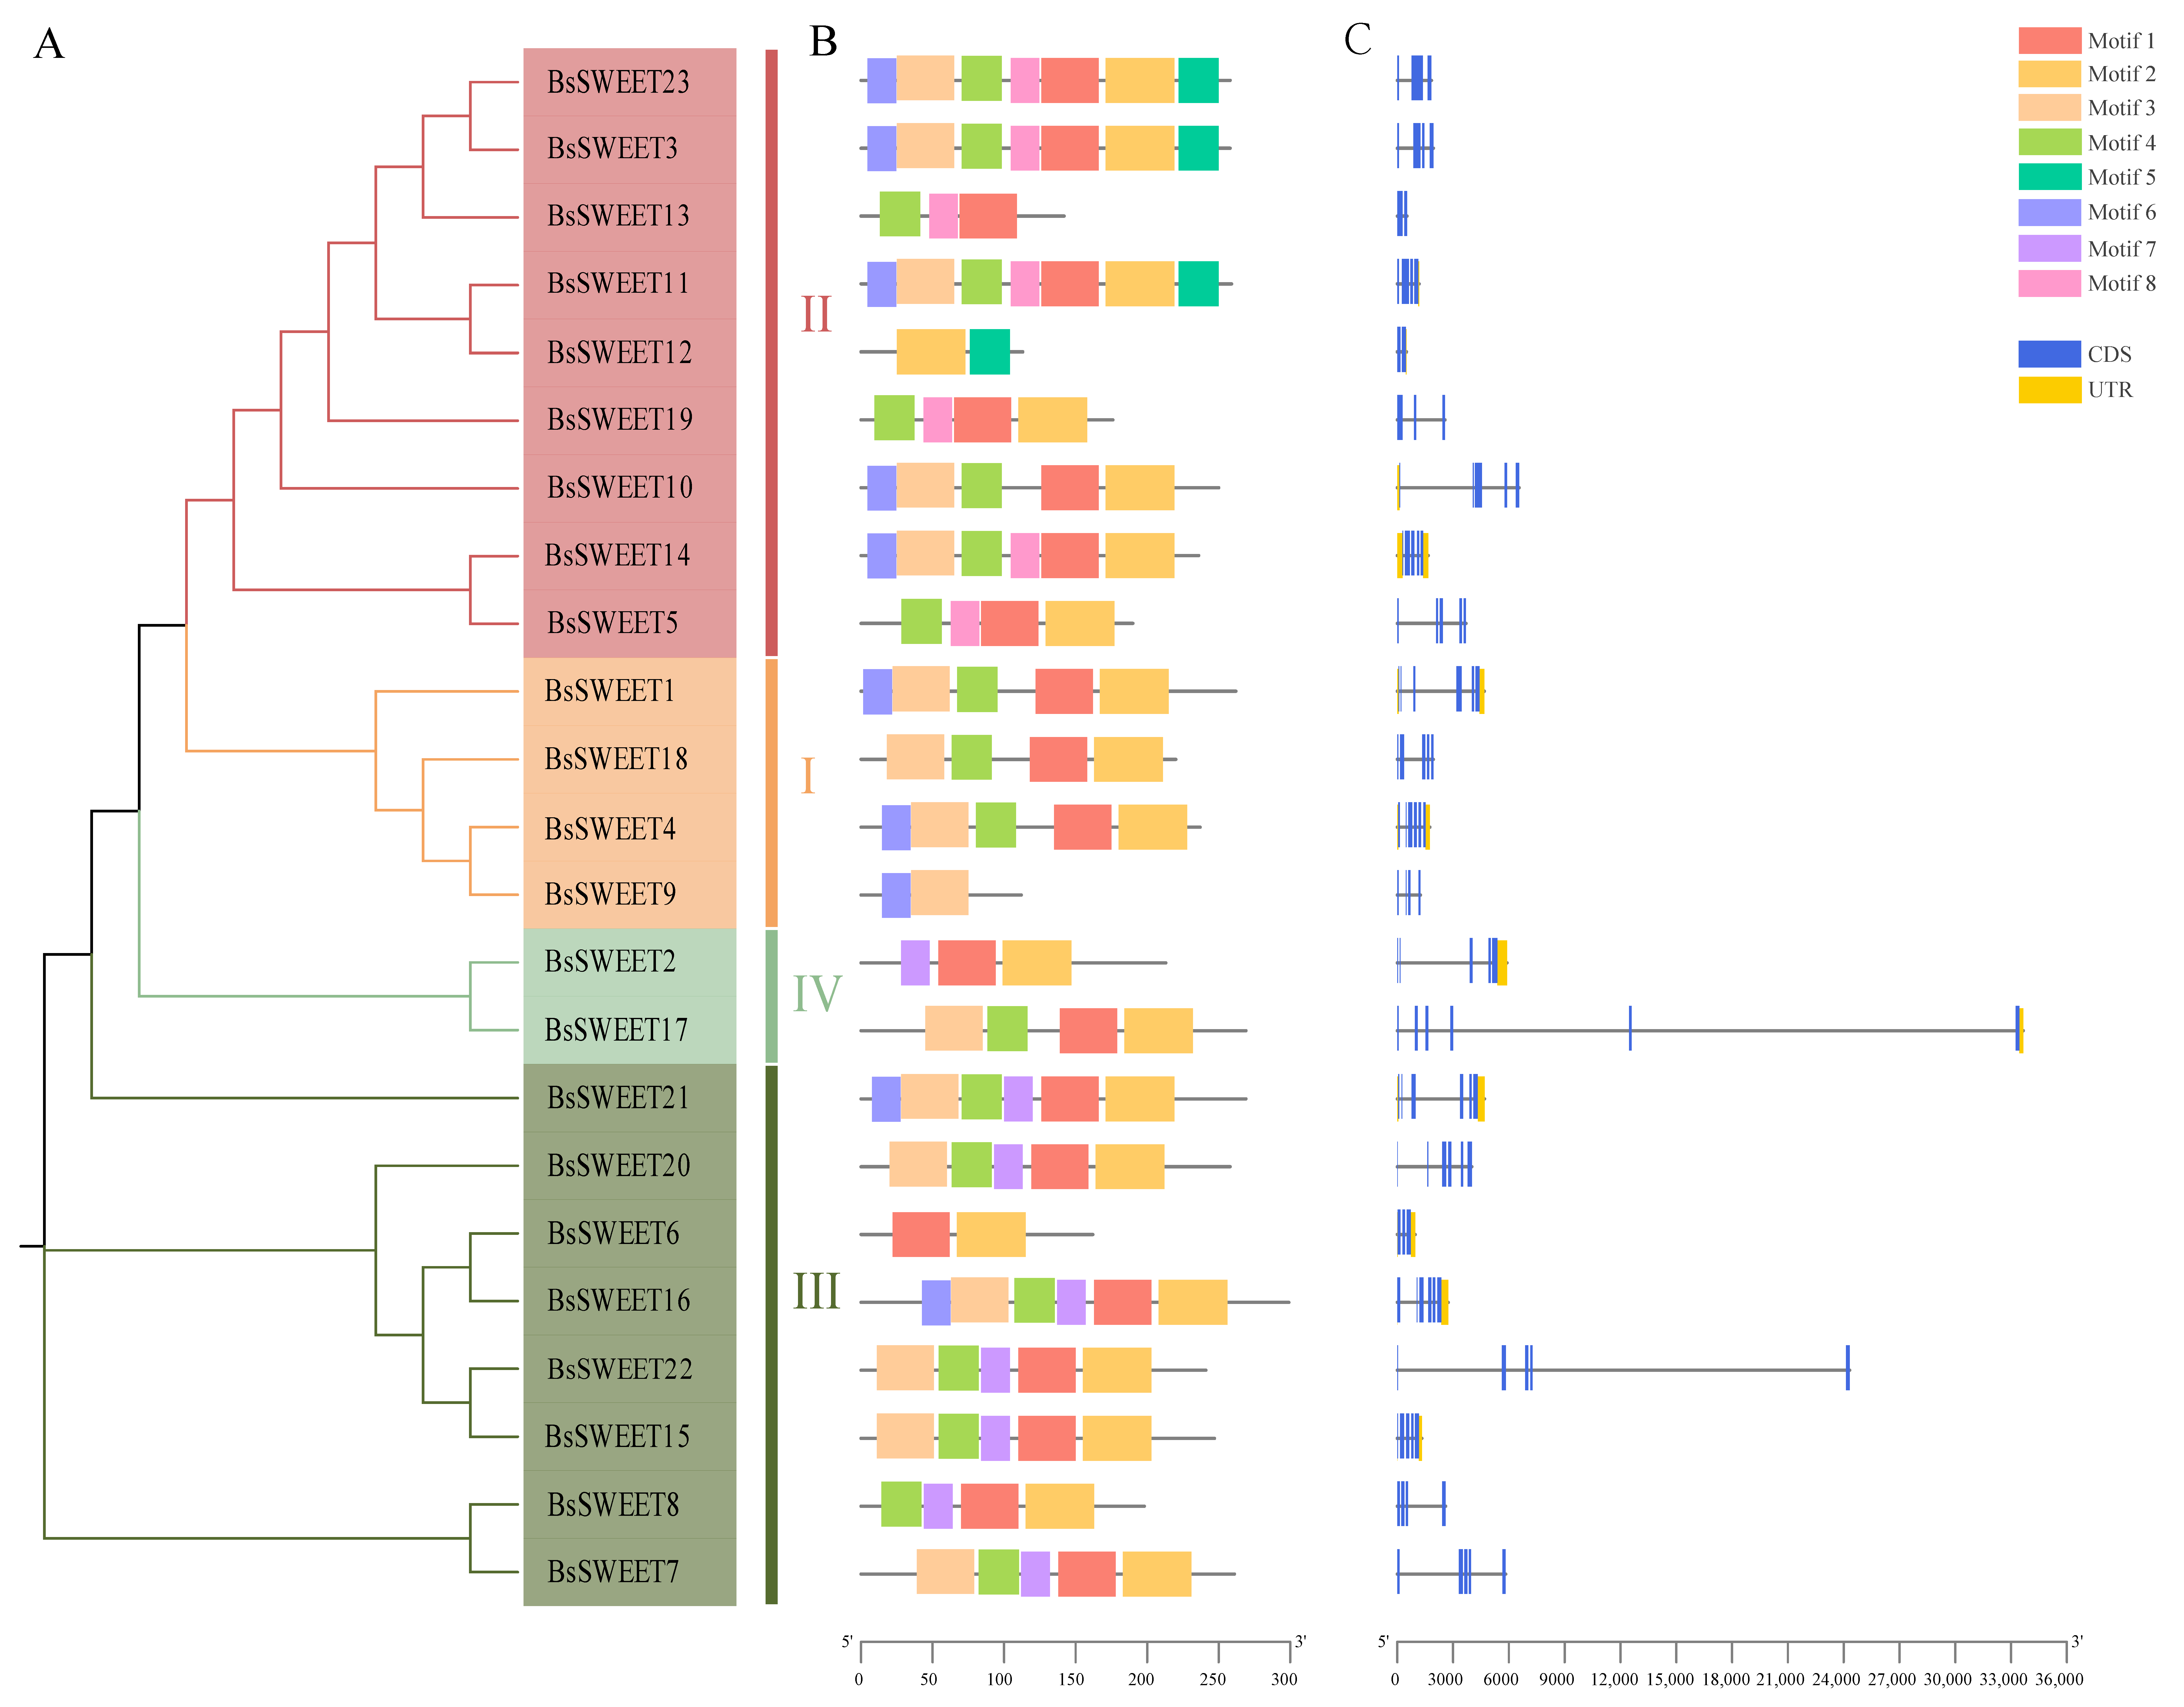
The structural composition of genes can reflect their complexity and diversity of corresponding functions. To further understand the structural features of BsSWEETs, we analyzed the introns and exons of each member (Figure 3). The exon number of the entire BsSWEET gene family ranged from two to six, and within the same subfamily, the gene lengths and exon numbers were similar. For example, the BsSWEET genes were the shortest in clade II, with three to four exons, whereas the genes of clade IV were longer with five exons. A factor that may have been related to gene duplication and random insertion is the similar gene structures of the same subfamily, and the different gene structures of different subfamilies. Furthermore, we analyzed the motif distribution patterns of BsSWEETs and found that there were eight conserved motifs in BsSWEET proteins (Figure S7 and Table S4), among which motif1 and motif2 were the most widely distributed and belonged to the conserved MtN3/saliva domain. Moreover, members of the same subfamily shared similar motifs in number and composition, which also demonstrated the reliability of the phylogeny.

2.4. Cis-Element Analysis in Promoters of BsSWEET Genes

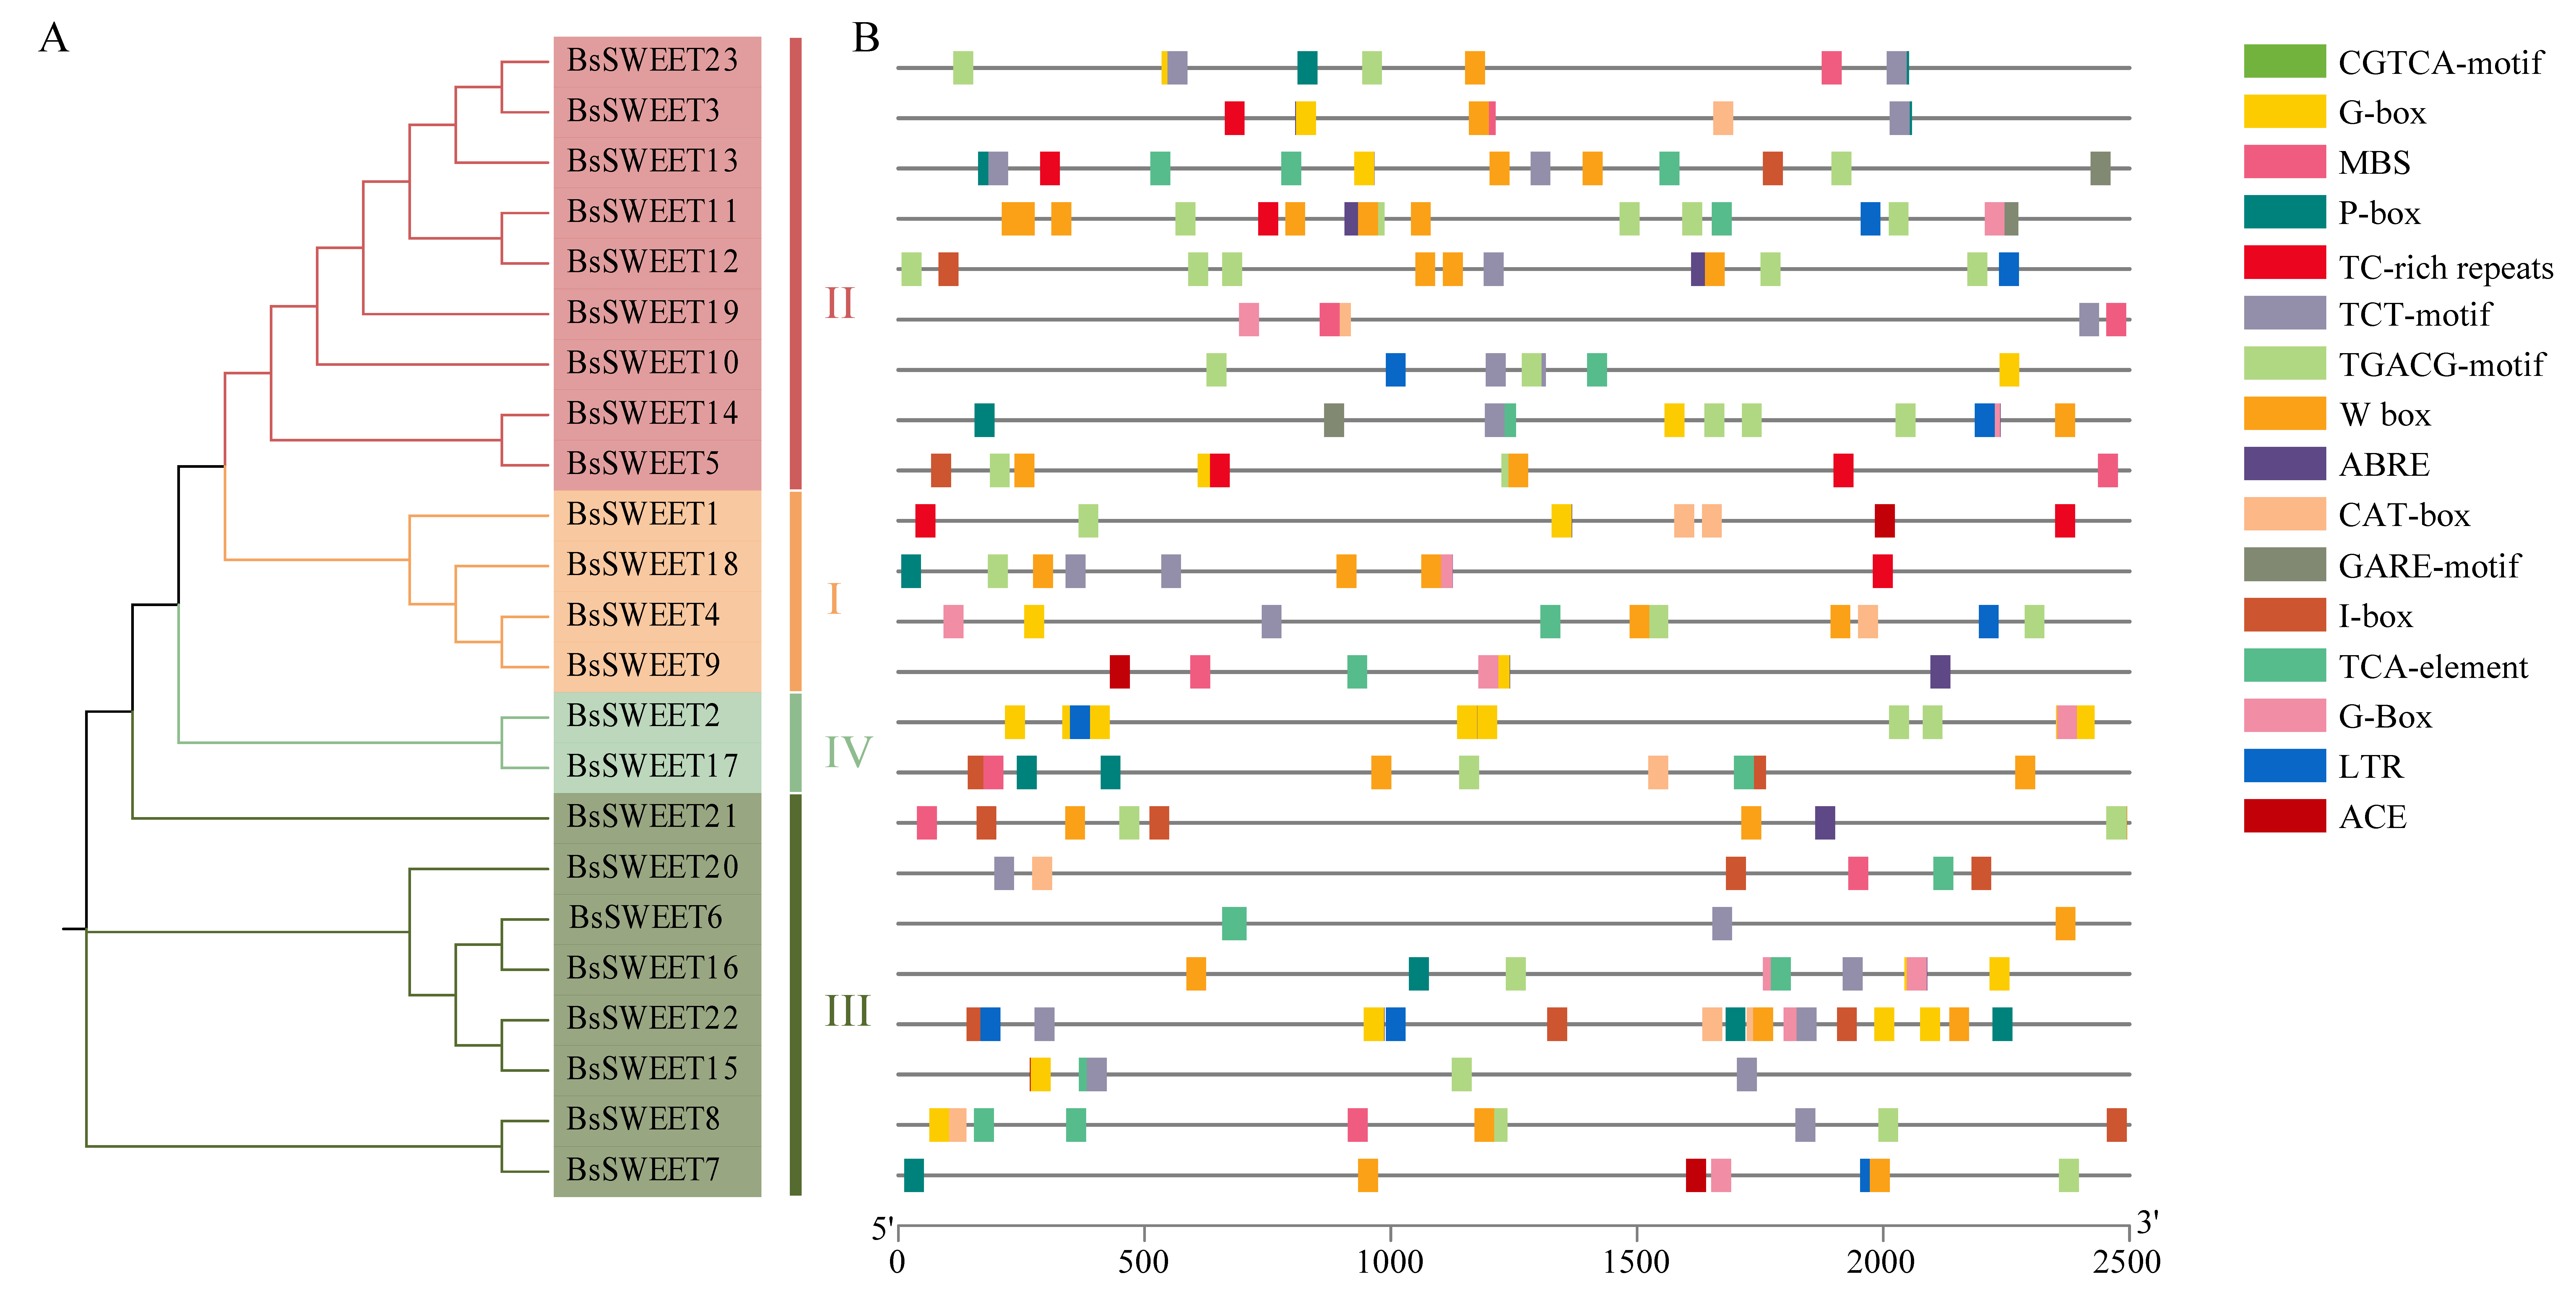
To investigate the potential functions of the 23 BsSWEET genes, we performed cis-acting element analysis in the promoter regions of BsSWEETs, focusing on the response elements related to sugar and stress responses (Figure 4 and Table S5). There were 16 major cis-elements in BsSWEETs including: six sugar-response elements (e.g., G-box, I-box, and W box) [35,36,37]; five phytohormone-response elements (e.g., ABRE (Abscisic acid responsiveness), P-box (Gibberellin responsiveness), and TCA-Element (Salicylic acid responsiveness)); two light-response elements (e.g., ACE and TCT-Motif); two stress-response elements (e.g., LTR (low temperature responsiveness) and TC-rich repeats (defense and stress responsiveness)); and one development-related cis-acting element, the CAT-box (related to Meristem expression). BsSWEET11 and BsSWEET22 contained the most sugar-response elements, which also reflected that these two members might play essential roles in sugar regulation. The above results also indicated that the SWEET genes were functionally diverse and involved in different biological processes, including sugar transport, plant hormone responses, multiple abiotic stress responses, and growth and development.

2.5. Synteny and ω Analysis of BsSWEET Genes

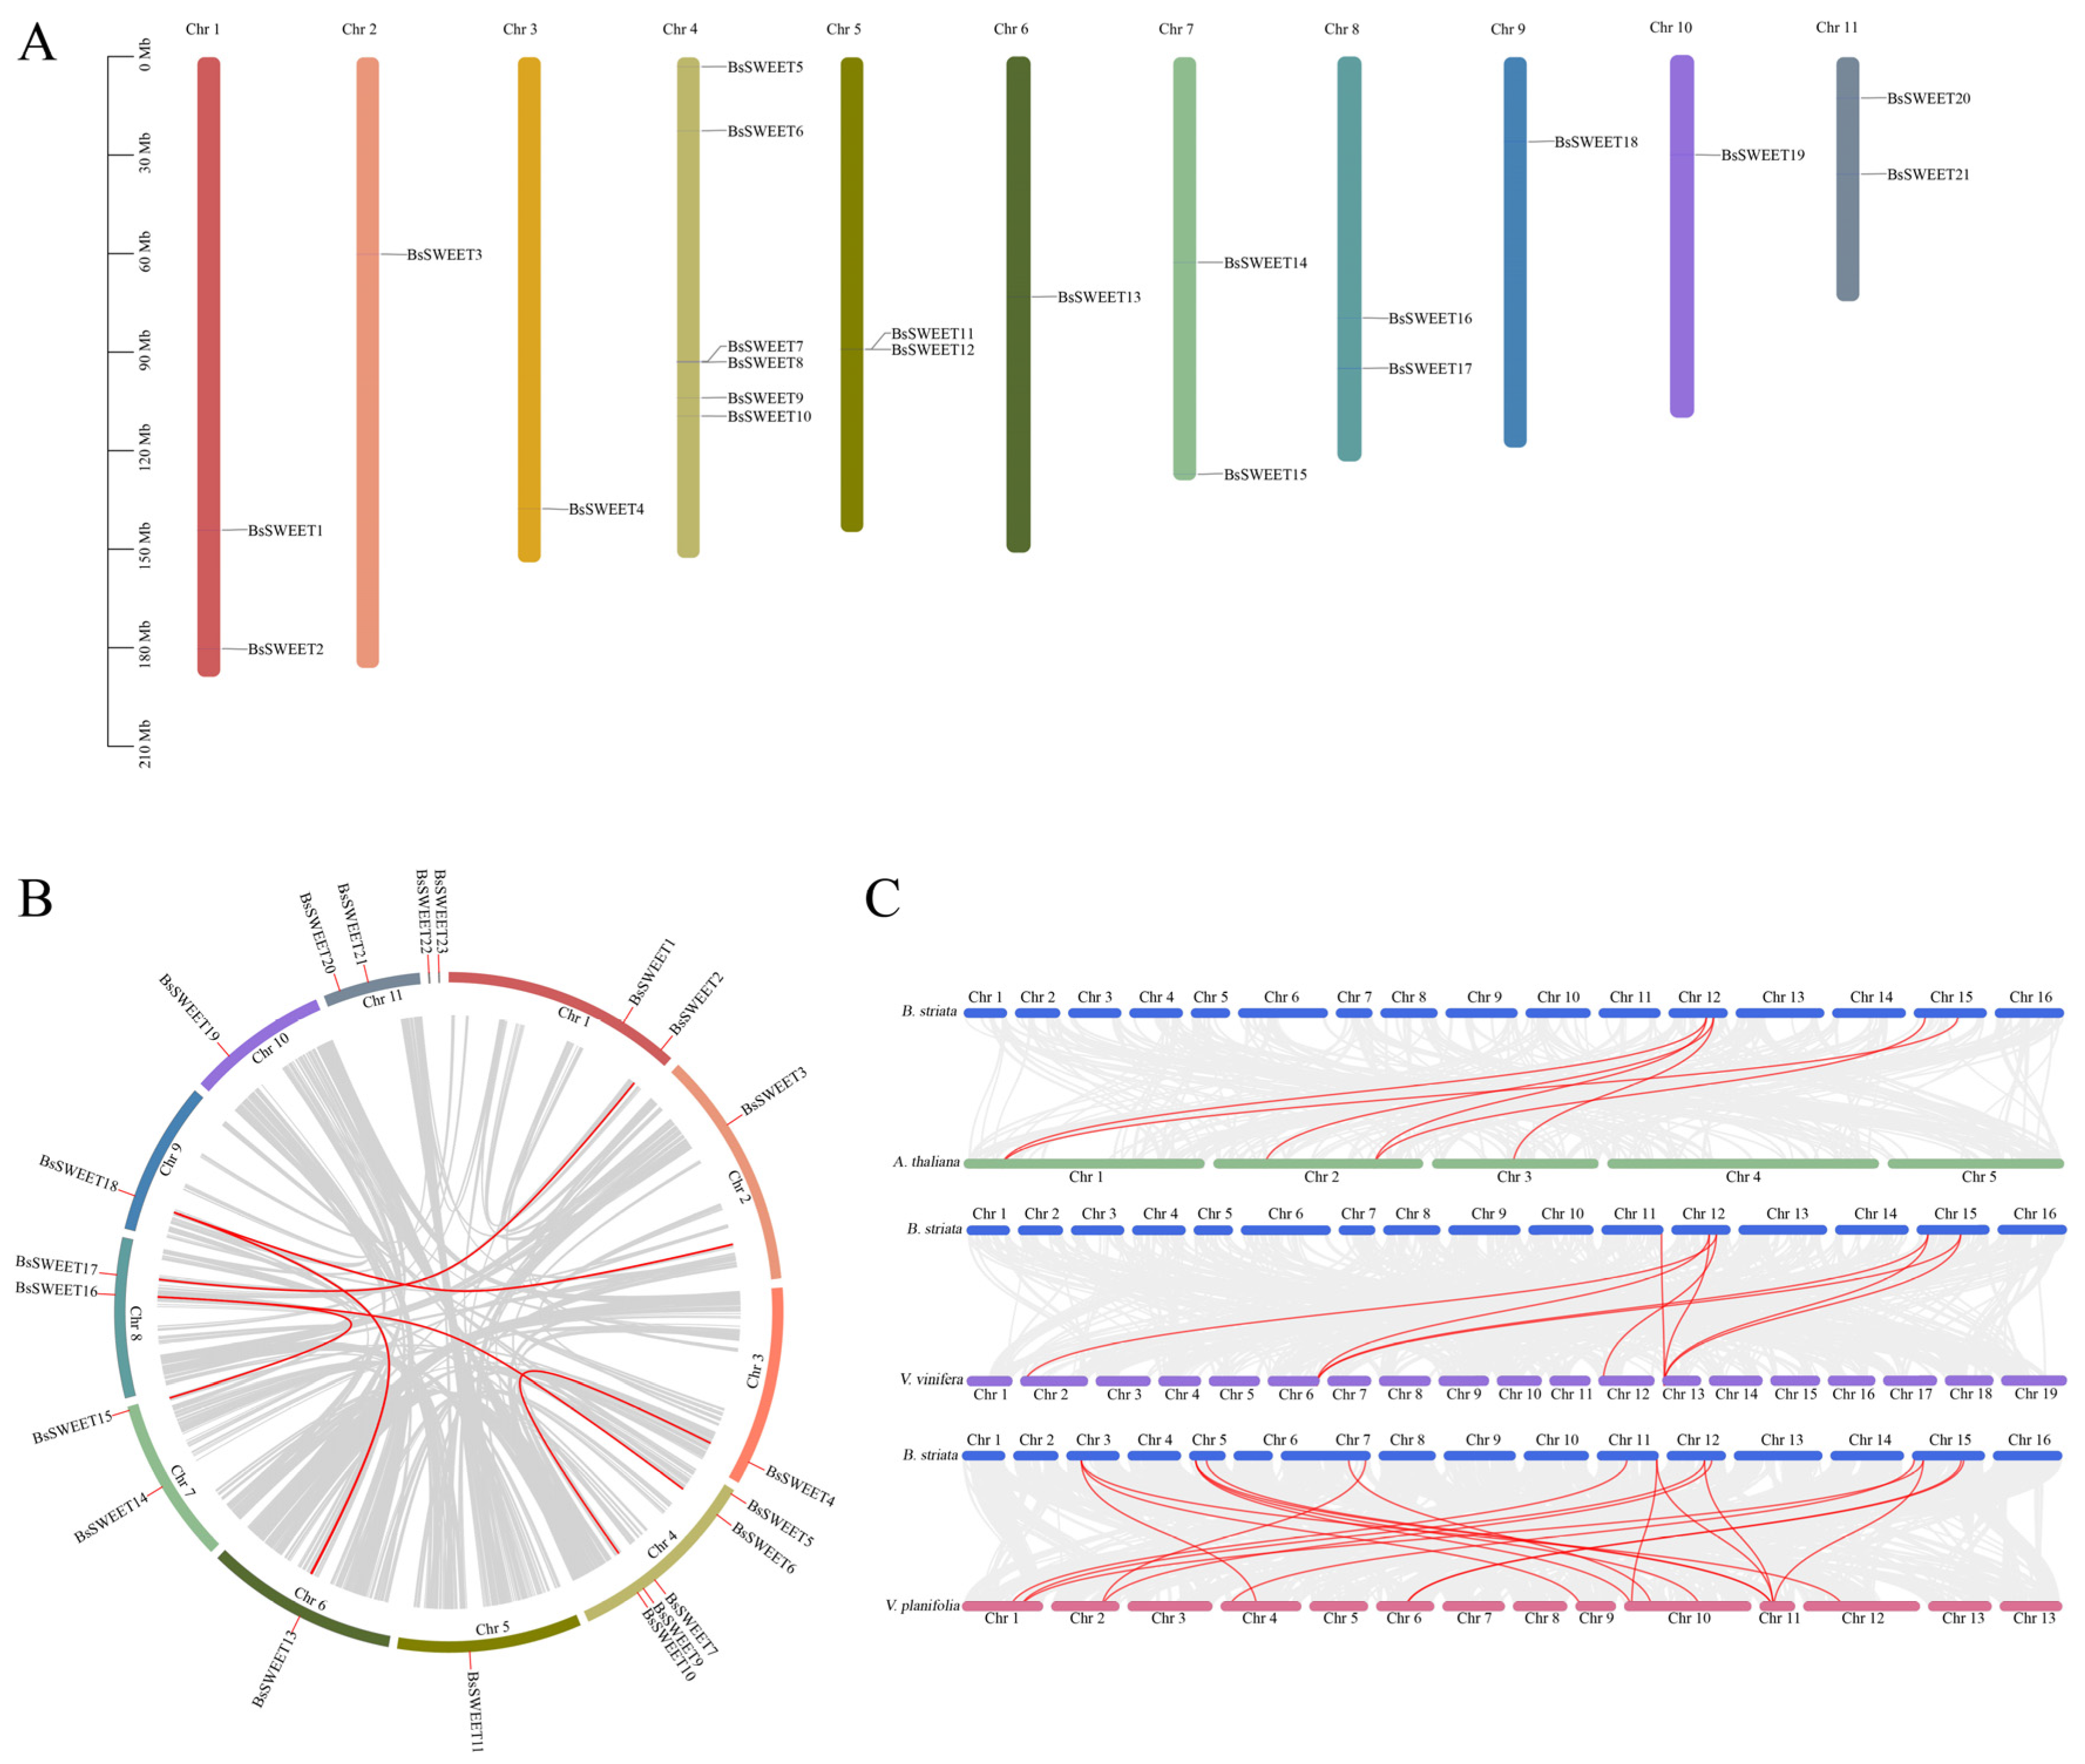
A total of 21 BsSWEETs were unevenly distributed on 11 chromosomes, and 2 genes were not anchored on chromosomes (Figure 5A). Among them, Chr4 contained the most BsSWEET genes (six genes, accounting for 26.1%), Chr1, Chr5, Chr7, Chr8, and Chr11 contained two BsSWEET genes, while Chr2, Chr3, Chr6, Chr9, and Chr10 contained only one BsSWEET gene.
A total of 23 BsSWEETs genes were involved in six fragment replication events (BsSWEET2/17, BsSWEET3/18, BsSWEET4/9, BsSWEET6/16, BsSWEET13/18, and BsSWEET15/16) and two tandem replication events (BsSWEET7/8 and BsSWEET12/13) (Figure 5B). These results revealed that gene duplication was the main driver of the SWEET gene family expansion in B. striata.
To explore the evolutionary relationships of BsSWEETs between species and the retention and loss of homologous genes, we developed a collinearity map between B. striata, A. thaliana, V. vinifera, and Vanilla planifolia (Figure 5C). There were 6, 10, and 20 pairs of homologous genes between B. striata and A. thaliana, V. vinifera, and V. planifolia, respectively. The results indicated that B. striata and V. planifolia had higher homology and were more closely related to the phylogeny and evolution of monocotyledonous species.
Further, to understand the evolutionary constraints acting on SWEET gene members, we calculated the nonsynonymous nucleotide substitutions ω ratio in B. striata, and estimated the variable ratio between codons in BsSWEET genes (Table S6). The SWEET genes were evolved in a neutral (ω = 1) manner or under purifying selection (ω < 1), which suggested that they may have undergone strong purifying selection during evolution and were not affected by the external environment; thus, they were more functionally conserved.

2.6. Tissue-Specific Expression Patterns of BsSWEETs

The expression results indicated that BsSWEETs were differentially expressed in various tissues (Figure 6). Among them, nine BsSWEET genes were highly expressed in roots and 14 BsSWEET genes were highly expressed in flowers, which suggested that these genes may play a critical role in reproductive development. Further, two BsSWEET genes were highly expressed in stems. The BsSWEET genes were all negligibly expressed in leaves, which indicated that they may be involved in the growth and development of source organs in B. striata and mediate the unloading of sucrose in the extracellular pathway.

2.7. Expression Patterns of BsSWEETs in Responses to Low Temperature and Oxidative Stress

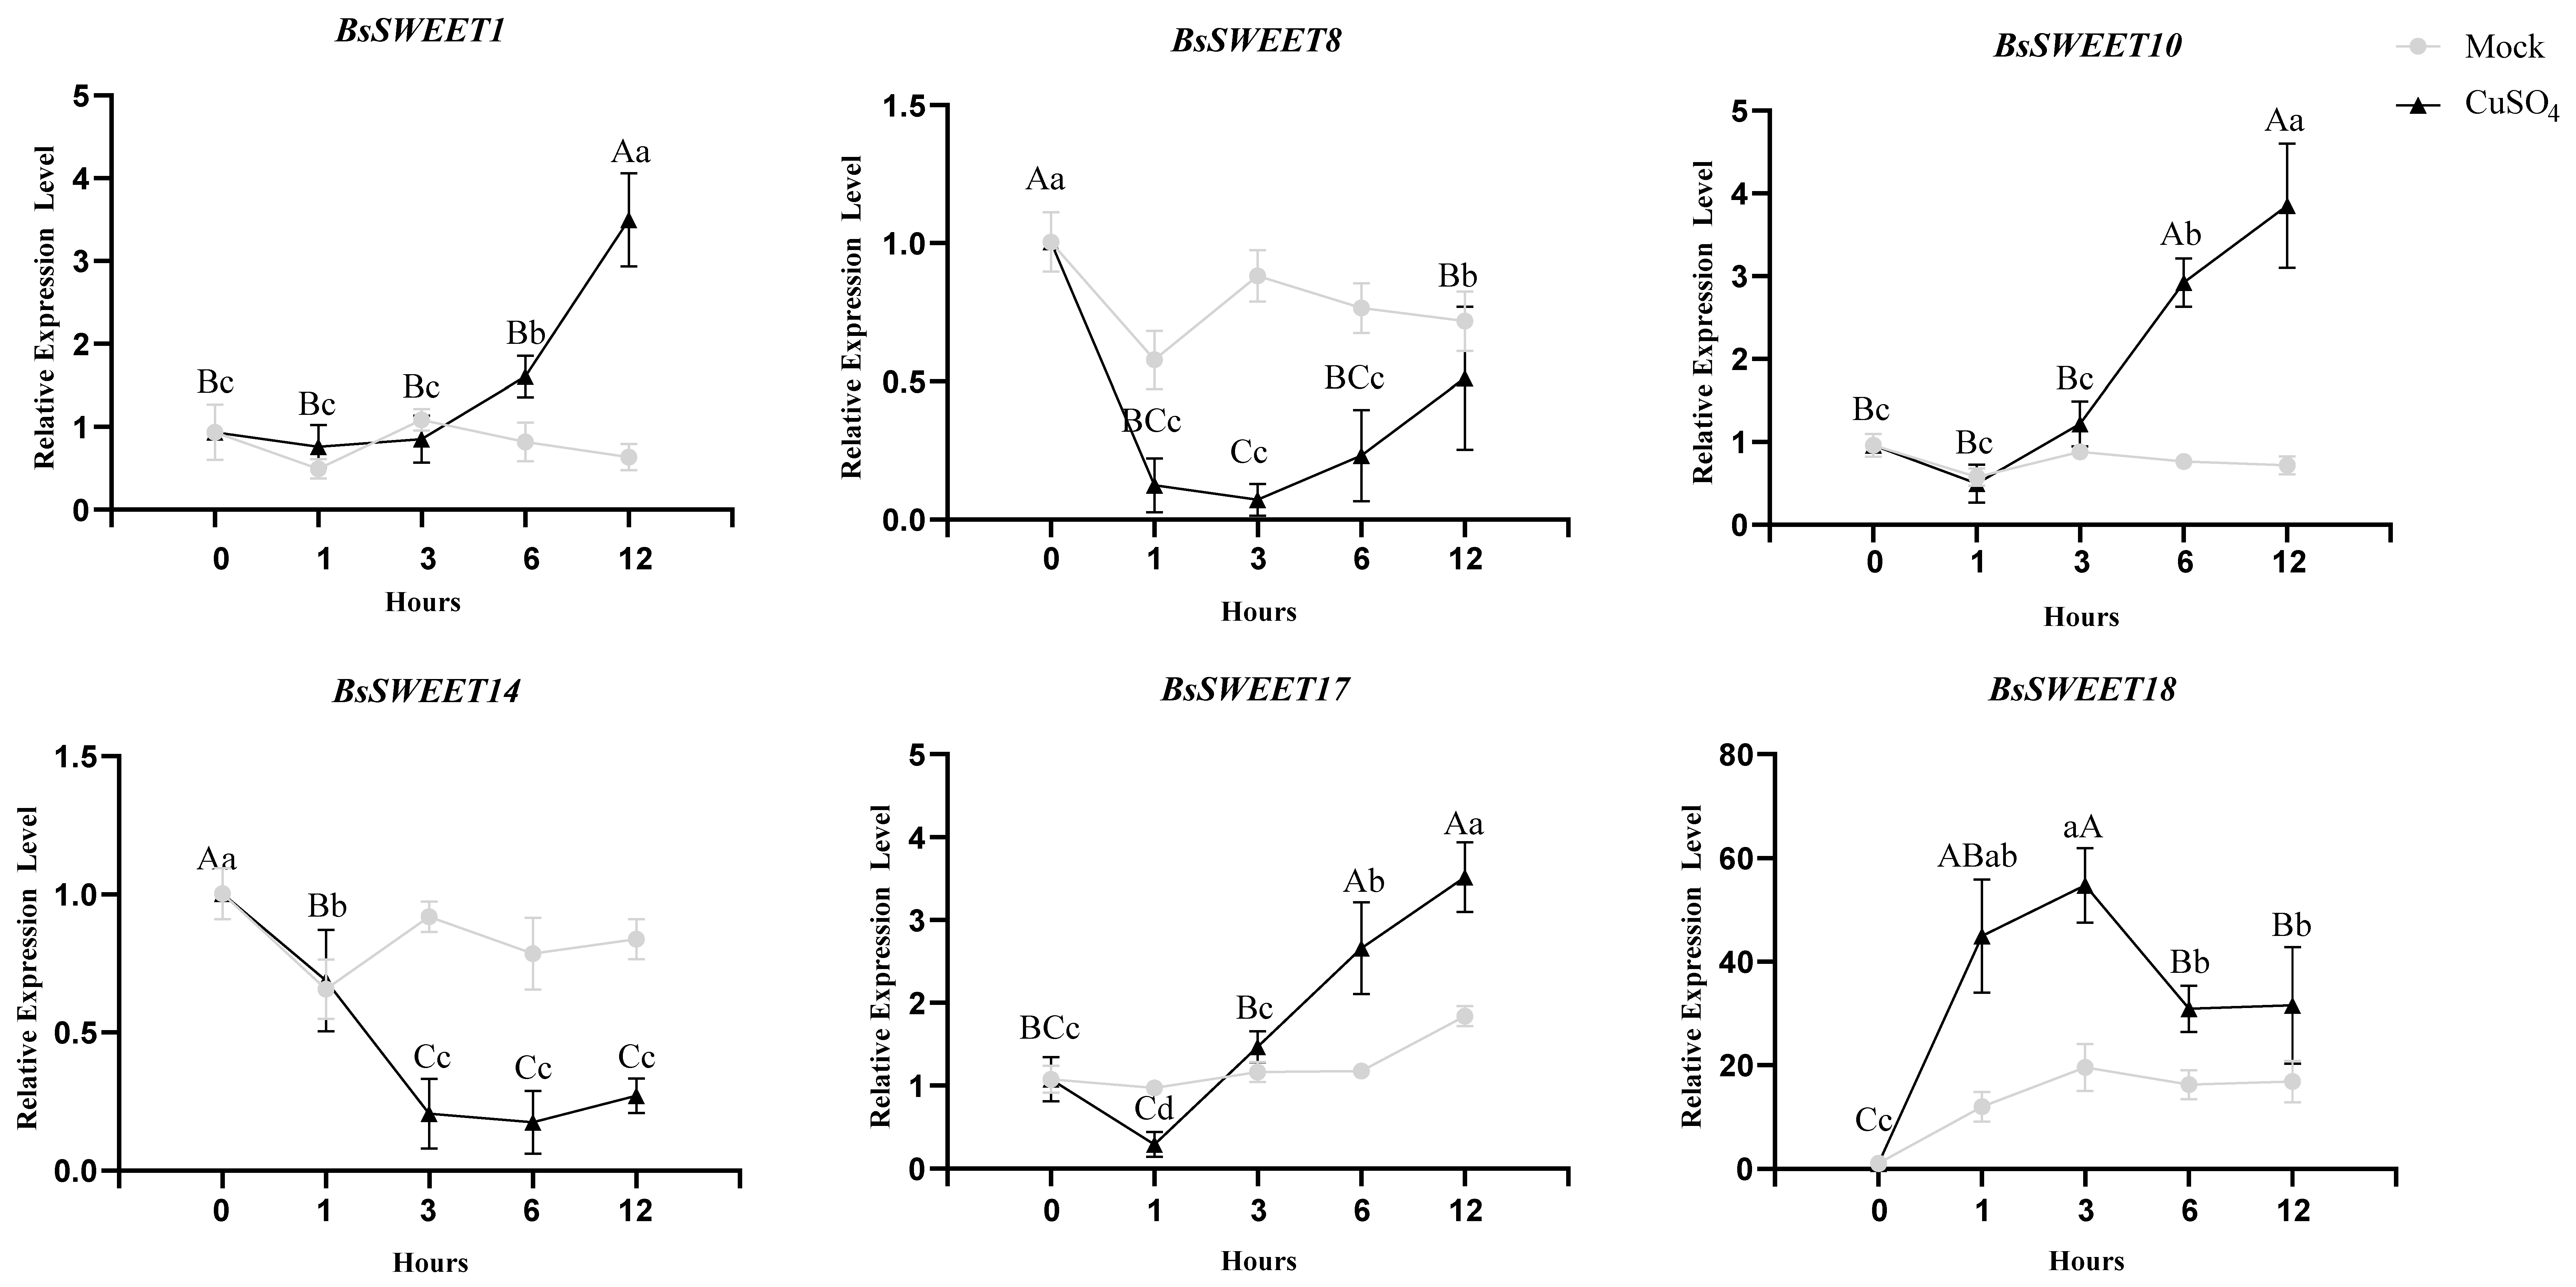
To assess the expression profile in responses to low temperature and oxidative stress, six BsSWEET genes from each subfamily were randomly selected based on available phylogenetic distance. The results revealed that the response patterns of the various genes to different treatments were inconsistent (Figure 7 and Figure 8). For low temperature treatment (4 °C), the expression levels of BsSWEET1 and BsSWEET10 were largely unchanged at 6 h post-treatment, but significantly up-regulated at 12 h post-treatment; BsSWEET8 was significantly down-regulated; BsSWEET14 expression was initially down-regulated and then up-regulated; BsSWEET18 expression was most pronounced at 12 h, with a 60-fold up-regulation. For oxidative treatment (Cu2SO4), BsSWEET1/10/17/18 were all up-regulated, with BsSWEET18 up-regulated nearly 30-fold. In conclusion, both BsSWEET10 and BsSWEET18 can be considered as candidate genes to explore the response of BsSWEETs to low temperature and oxidative stress responses.

2.8. The Subcellular Localization of BsSWEET15 and BsSWEET16

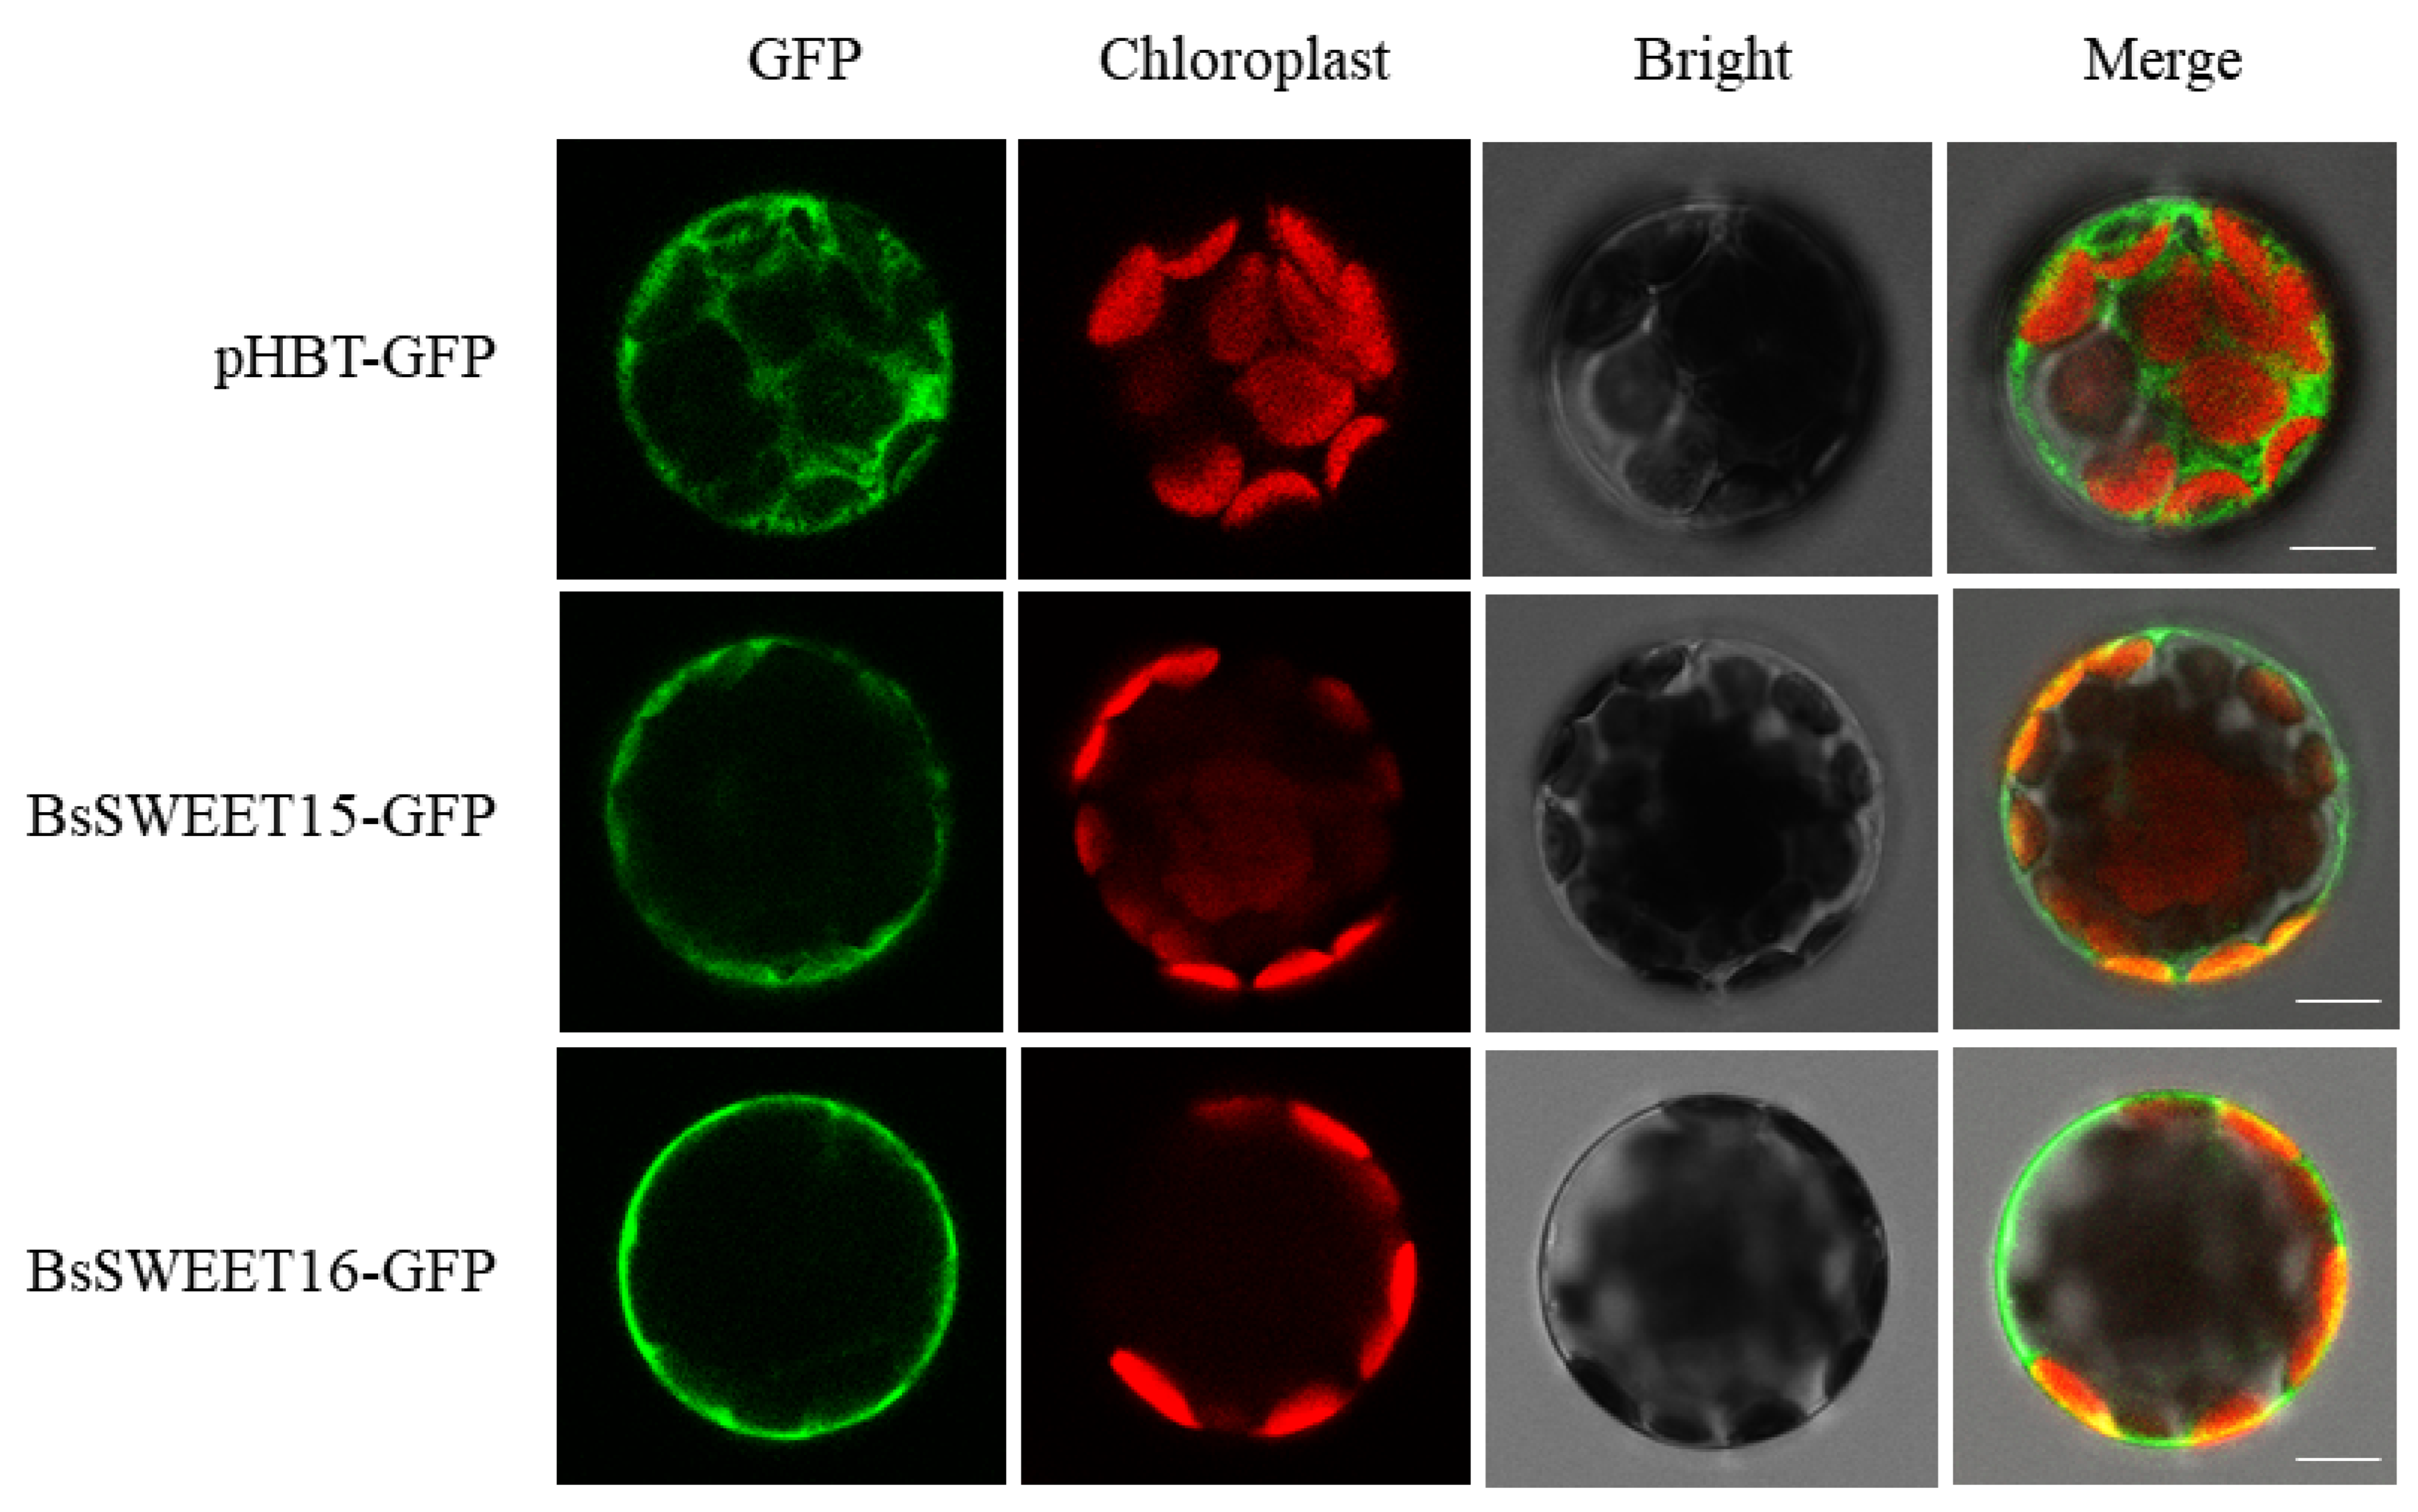
The subcellular localization of the BsSWEET protein was investigated by transiently expressing BsSWEET15-GFP and BsSWEET16-GFP fusion proteins in A. thaliana protoplasts and observing the localization of GFP (green fluorescent protein) by laser confocal microscopy. The results revealed that the fluorescence of 35S: GFP control was distributed throughout the whole cell, whereas those of BsSWEET15 and BsSWEET16 were exclusively localized on the cell membrane (Figure 9). They were both membrane-localized proteins that may serve as carriers to transport sugars into or out of cells.

2.9. Protein Interaction Analysis of BsSWEETs

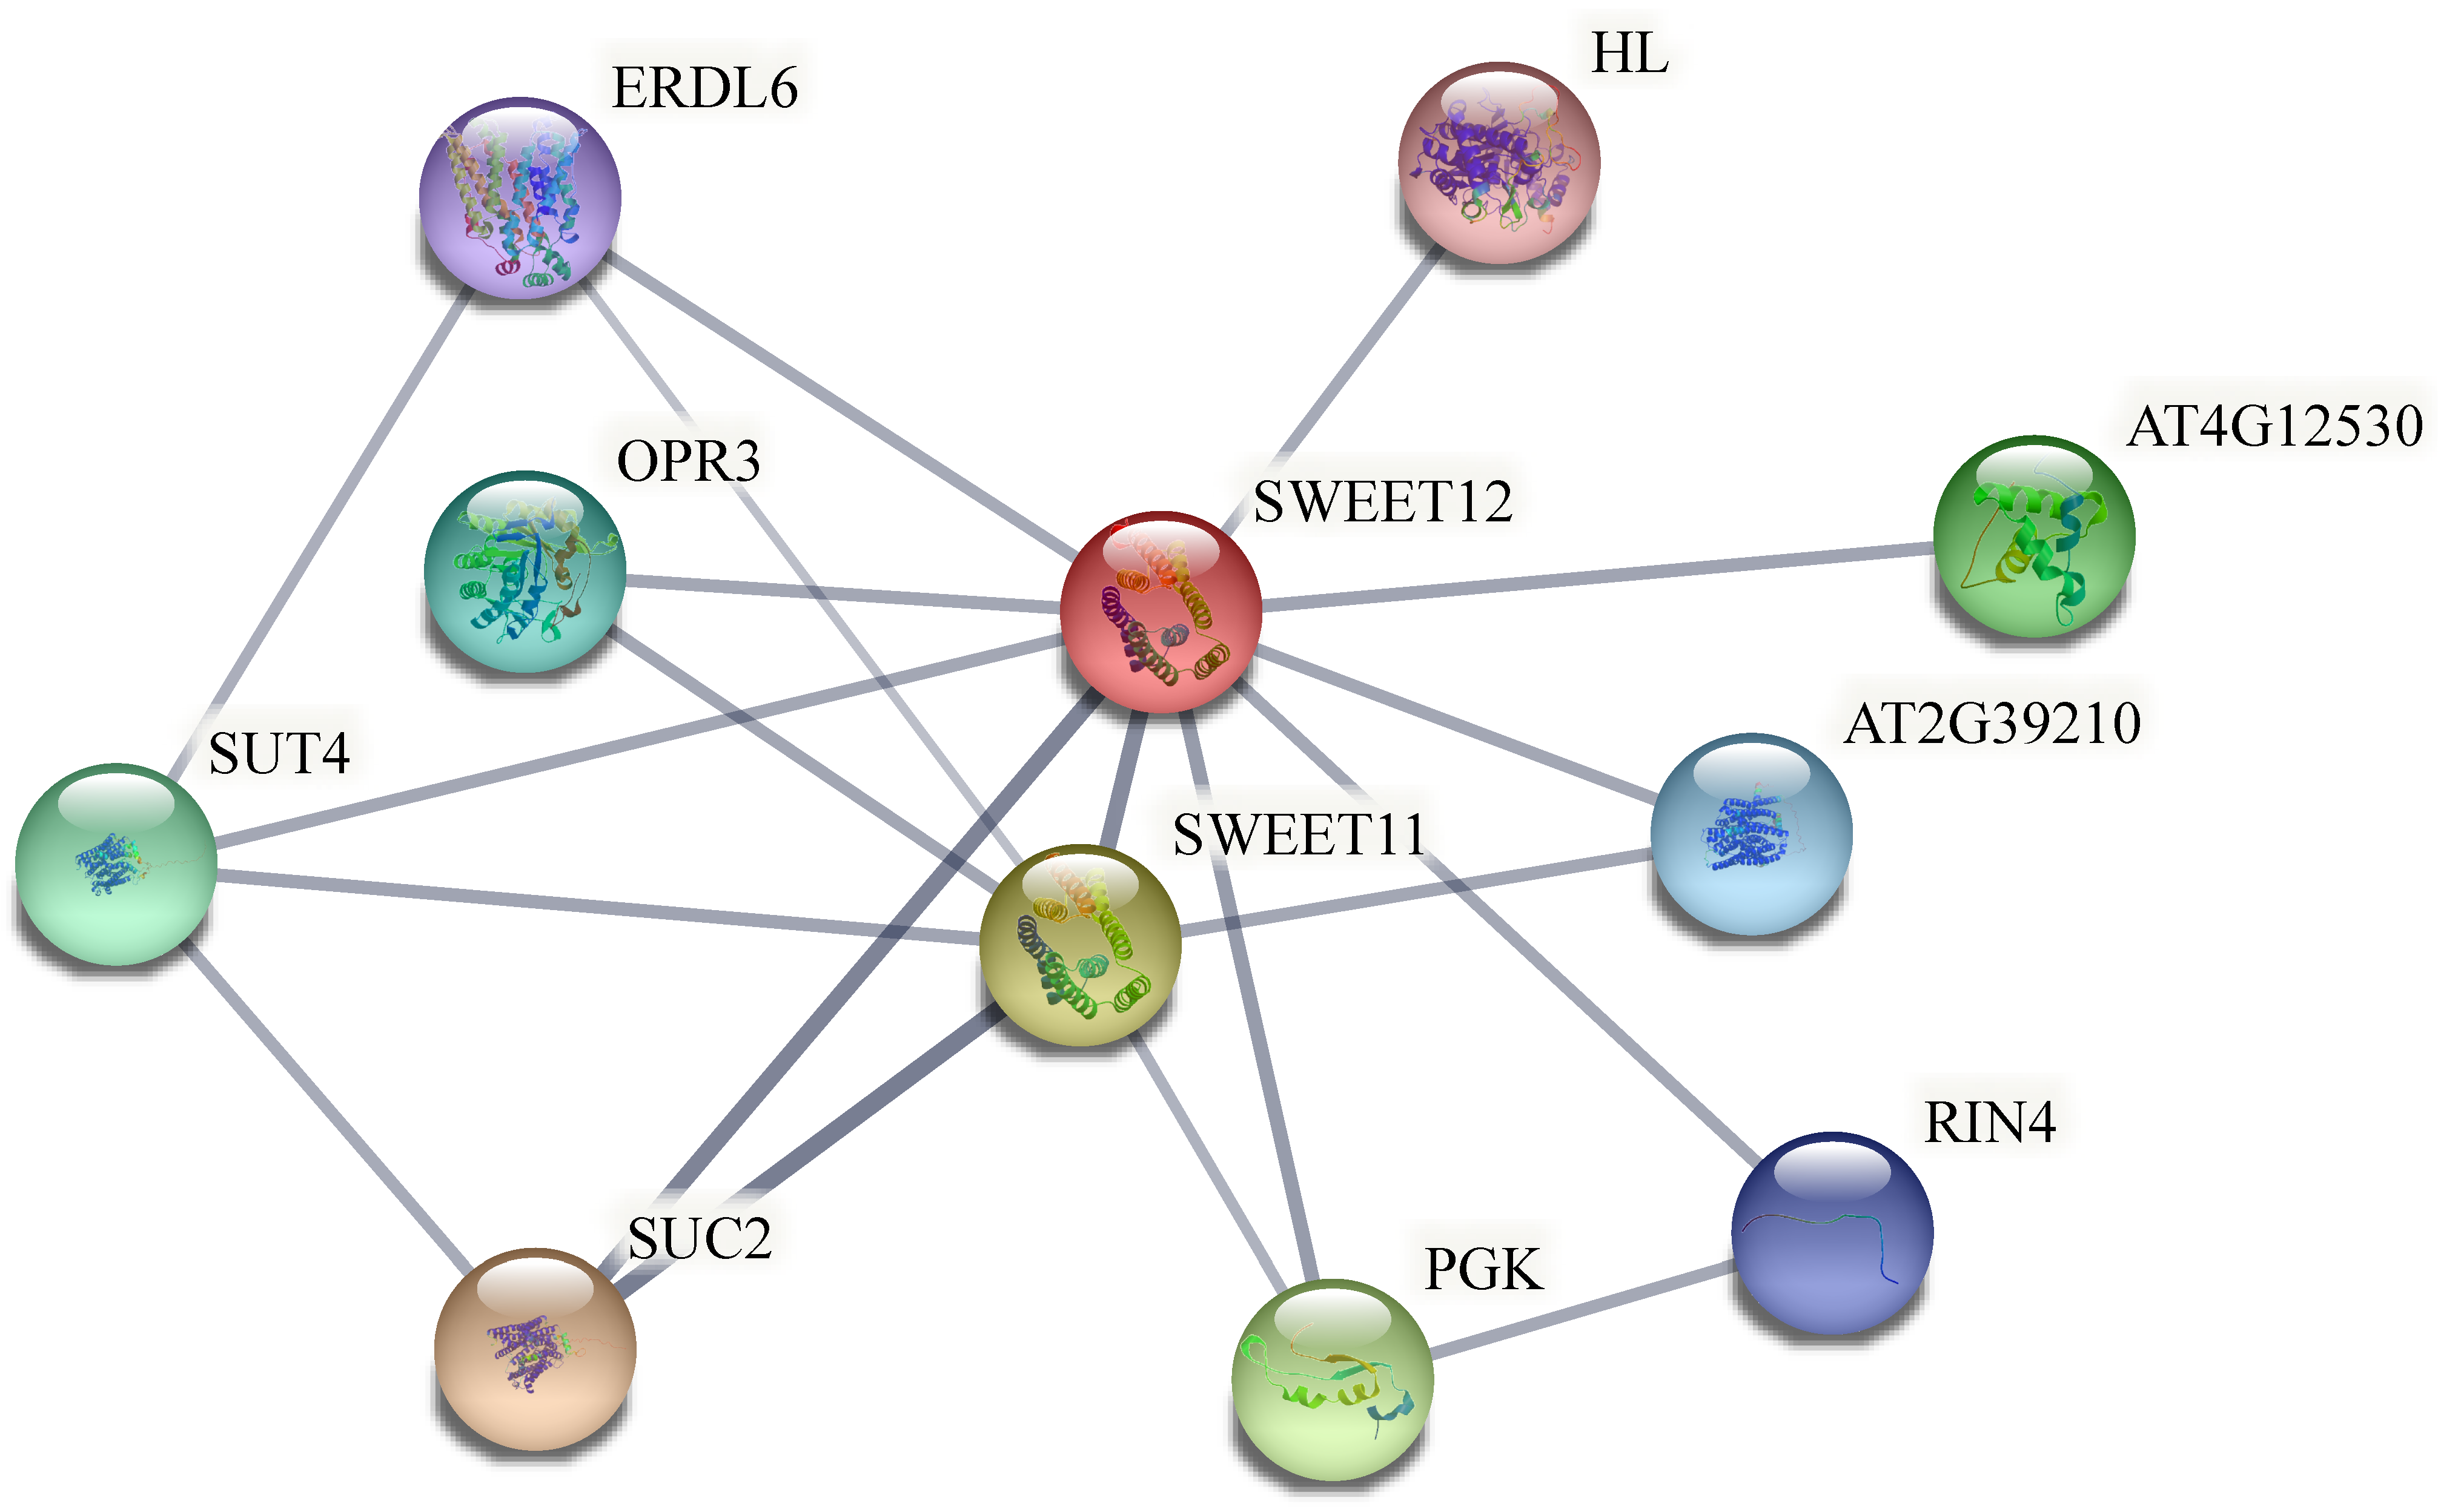
Orthoven2 was initially used to explore the protein interaction relationships of SWEETs, and conduct a homology comparison, where AtSWEET12 was a homologous gene of BsSWEET15. Subsequently, the protein interaction network of AtSWEET12 was constructed on the string website, which had a strong interaction with a sucrose transporter, AtSUC2. Homologous to AtSUC2, CTG2800.4 was found to be one of the members of the SUT gene family in B. striata [38]. Thus, we speculated that BsSWEET15 and CTG2800.4 might also have protein interactions (Figure 10). Based on the above interacting proteins, we preliminarily concluded that BsSWEET15 might be involved in the regulation of sugar transport, plant growth, and development.

3. Discussion

B. striata is one of the most significant medicinal and ornamental Orchidaceae worldwide. SWEETs and STPs are important regulators in sugar metabolism pathways. The identification of the SWEET gene family in B. striata can lay a foundation for exploring its molecular mechanisms in plant growth, development, and defense processes.
There are 23 SWEET genes in B. striata. The SWEET gene family has been found in the following numbers: 17 in A. thaliana, 21 in O. sativa, 15 in V. vinifera, 29 in Solanum lycopersicum, and 24 in Zea mays [39,40]. The genome sizes of A. thaliana, O. sativa, V. vinifera, S. lycopersicum, and Z. mays were 125 Mb, 466 Mb, 487 Mb, 900 Mb, and 2.3 Gb, respectively [41,42,43,44,45]. Therefore, the number of SWEET genes in plants is independent of genome size, but correlated with gene replication events. A total of 23 BsSWEET genes were involved in six fragment replication events and two tandem replication events, which were the main drivers of SWEET gene family expansion in B. striata. Those evolved in a neutral (ω = 1) manner or under purifying selection (ω < 1) suggested that they may have undergone strong purifying selection during evolution and were not influenced by the external environment. Thus, BsSWEET genes were more functionally conserved. Expansions of SWEET genes have also occurred in other species, such as JrSWEET genes [46].
According to phylogenetic analysis, the SWEETs were classified into four subfamilies. SWEET proteins were predicted to harbor two MtN3/saliva domains in monocots and dicots. Most BsSWEET genes contain two MtN3/saliva domains; the others contain one MtN3/saliva domain. This is consistent with the comparative sequence analysis of the ClaSWEET genes [47]. It was found that the gene structures and protein structural domains of each subfamily were arranged similarly, indicating structural and functional conservation among the same subfamilies. However, there were differences among subfamilies, which may be related to functional diversity. AtSWEET1 (clade I) serves as a unidirectional low-affinity glucose transporter that regulates glucose transport [48]. OsSWEET5 (clade II) has galactose transport activity [49]. AtSWEET11 and AtSWEET12 (clade III) transport sucrose from leaves into vascular bundles [20]. AtSWEET16 and AtSWEET17 (clade IV) are responsible for fructose transport [50]. Our study provides a reference for further investigations into the functions of BsSWEET. It is worth mentioning that the SWEET gene family has now been identified in Dendrobium officinale, which suggests that DoSWEET genes may be associated with fleshy stems and medicinal compounds such as polysaccharides [51]. However, the SWEET gene family has not been systematically and completely analyzed in Orchidaceae. Our initial comprehensive analysis of the SWEET gene family in B. striata will provide new insights into SWEET genes related to sugar transport, growth, and development in medicinal Orchidaceae.
To gain underlying functional and regulatory mechanisms, we investigated its cis-acting elements. Five types of cis-acting elements were identified, including sugar-responsive, light-responsive, phytohormone-responsive, stress-responsive, and development-related, indicating that BsSWEETs genes were functionally diverse and might respond to different biological processes. Twelve cis-elements related to sugar repression and seven cis-elements related to sugar induction were identified in the ZjSWEET2.2 promoter; ZjSWEET2.2 was confirmed as an export sugar from photosynthetic leaf cells with their gene expressions being regulated by sugar signals [52]. In this study, BsSWEET11/22 contained the most sugar-responsive elements (six), implying that those likely played vital roles in sugar regulation.
The results of subcellular localization revealed that BsSWEET15/16 were localized in the plasma membrane, and the others were predicted to be localized in the plasma membrane. It was shown that SWEET proteins could homo- and heterooligomerize to generate functional pores and provide channels. SlSWEET7a/14 localized in the plasma membrane in S. lycopersicum, formed homodimers and heterodimers, and established pores to transport sugars, particularly for larger substrates such as sucrose and fructose [53]; thus, it was hypothesized that they served as carriers to transit sugars. The formation of the potato tuber is related to photoperiods and sugar transport, and involves StSWEET11, SUTs, and StSP6A, which alter sucrose accumulation and transport in plants. Proteins were linked by STRING, in which both SUC2 and SUT4 proteins were sucrose transporters. The homologue of AtSWEET12 is BsSWEET15, whereas the homologue of AtSUC2 is CTG2800.4; thus, it was speculated that BsSWEET15 and CTG2800.4 may interact to participate in sucrose transport in B. striata. In addition, AtSWEET13 and AtSWEET14 signaling occurred during anther dehiscence and germination-mediated GA, which indicated that these transporters may be required for different stamen development processes [54]. q-PCR (Quantitative real time polymerase chain reaction) was employed to examine the expression patterns of BsSWEETs in different tissues, and the number of BsSWEETs expressed in flowers was higher than other tissues, which suggested that those might play a unique role in reproductive development.
SWEET genes are involved in abiotic stress responses and exhibit significant functional diversification [20]. AtSWEET16 confers an increased tolerance to low temperatures [50]. GhSWEET genes might also enhance the adaptability of plants to diverse abiotic stresses [55]. To test the regulation of miR398 by heavy metal-induced oxidative stress, miR398 expression was down-regulated in A. thaliana seedlings under high Cu2+ and Fe3+ exposure. In this study, most SWEETs expression patterns were altered under stress conditions. BsSWEET8 was down-regulated under low temperature and BsSWEET14 was down-regulated under oxidative treatments. However, BsSWEET10 and BsSWEET18 were up-regulated under low temperature and oxidative treatments conditions, indicating that BsSWEETs are involved in stress resistance. The functional diversity of the SWEET gene family provides potential anti-stress genes for further germplasm screening and quality improvement in B. striata.
The identification and characterization of the SWEET gene family in B. striata can assist with further analyzing its regulatory mechanisms, while elucidating their critical biological functions. However, the biokinetics of BsSWEET10/18/15/16 for abiotic stresses, plant growth, development, and sugar transport in B. striata warrant further detailed investigations.

4. Materials and Methods

4.1. Genome-Wide Identification, Protein Features, and Chromosomal Locations of BsSWEET Genes

The genomic and annotative data for B. striata was obtained from our laboratory. AtSWEET protein sequences were retrieved from the TAIR database (https://www.arabidopsis.org/, accessed on 12 March 2022); the BsSWEET gene was searched with BLAST and candidate family members were obtained. Further, HMM (Hidden Markov Model) mapping of the MtN3/saliva conserved domain (PF03083) was downloaded from the Pfam database (http://pfam.xfam.org/, accessed on 13 March 2022), which confirmed its presence in the candidate sequences, and was further confirmed using SMART (http://smart.embl.de/, accessed on 15 March 2022), InterPro (http://www.ebi.ac.uk/interpro/, accessed on 15 March 2022), and NCBI-CDD (https://www.ncbi.nlm.nih.gov/cdd/, accessed on 15 March 2022), respectively [56,57,58]. Lastly, the nucleotide and amino acid sequences of the 23 BsSWEET genes were verified. According to their positions on respective chromosomes, all SWEET genes were sequentially numbered, the chromosomal location of the BsSWEET genes was displayed by TBtools v1.089 (Chen, C., et al, China), and the chromosomal location of the above BsSWEET genes was derived from the genome annotation files. In addition, Expasy ProtParam (http://www.expasy.org/tools/protparam.html, accessed on 20 March 2022) and WoLF PSORT II (https://wolfpsort.hgc.jp/, accessed on 21 March 2022) were employed to predict the physicochemical characteristics and subcellular localization of the BsSWEET proteins, respectively [59,60].
SOPMA (http://npsa-pbil.ibcp.fr/cgi-bin/npsa_automat.pl?page=npsa_sopma.html, accessed on 24 March 2022) and Swiss-Model (https://swissmodel.expasy.org/, accessed on 24 March 2022) were used to predict the secondary and tertiary structures of the BsSWEET proteins, respectively [61,62]. Moreover, SignalP (http://www.cbs.dtu.dk/services/SignalP/, accessed on 26 March 2022), TMHMM v2.0 (http://www.cbs.dtu.dk/services/TMHMM/, accessed on 26 March 2022), and NetPhos v2.0 (http://www.labtools.us/netphos-2-0/, accessed on 27 March 2022) were utilized to predict and analyze the signal peptides, transmembrane domains, and phosphorylation sites of the BsSWEET proteins, respectively [63,64,65].

4.2. Phylogenetic Analysis of SWEET Genes

The multiple sequence alignment of BsSWEET core protein sequences in B. striata was performed using Clustal v1.83 (Higgins D.G., et al., Ireland) and Geneious v11.0 (Biomatters, Auckland, New Zealand) with default settings [66]. To investigate the phylogenetic relationships among different SWEETs, MEGA v7.0 (Mega Limited, Auckland, New Zealand) was used to construct a phylogenetic tree of SWEET proteins from B. striata, A. thaliana, O. sativa, and V. vinifera by the Neighbor-joining (NJ) method, and the bootstrap was repeated 1000 times [67]. Among them, the data for O. sativa and V. vinifera were obtained from NCBI. In addition, it was annotated and modified by EvolVIEW v2.0 (https://www.evolgenius.info/evolview-v2/, accessed on 30 March 2022) [68].

4.3. Analysis of Conserved Motifs, Gene Structures, and Cis-Acting Elements of the BsSWEET Genes

The conserved motifs of BsSWEET genes were predicted by MEME (https://meme-suite.org/meme/tools/meme, accessed on 5 April 2022), with eight searched conserved motifs and the others being default values [69]. The BsSWEET genes structures were visualized using TBtools v1.089 to identify exon–intron boundaries. Further, the Plant CARE database (http://bioinformatics.psb.ugent.be/webtools/plantcare/html/, accessed on 6 April 2022) was used to predict and analyze the cis-acting elements of the 2500 bp upstream sequence of each BsSWEET gene and visualized using TBtools v1.089 [70,71]. Finally, the exon–intron structures and 2500 bp upstream sequences of the BsSWEET genes were obtained from the genome annotation files.

4.4. Analysis of Gene Duplication and Synteny in B. striata

The SWEET genes homology analysis of B. striata was performed using MCScanX (Wang, Y., et al, China) and visualized by Circos (Krzywinski, M., et al, Canada) [72,73]. The homology of B. striata and three species of A. thaliana, V. vinifera, and V. planifolia were analyzed using MCScanX and Tbtools v1.089. The V. planifolia data were obtained from NCBI.
The ratios of non-synonymous (Ka) and synonymous (Ks) divergence levels were calculated by pairing the BsSWEET protein sequences in Clustal v1.83. The ω ratio of all BsSWEET sequences was estimated by the codeml program embedded in the PAML package and their molecular selection effects were assessed [74,75].

4.5. Plant Materials and Treatments

B. striata was planted in a greenhouse at the National Engineering Laboratory for Resource Development of Endangered Crude Drugs in Northwest China. The B. striata seedlings under similar growth conditions were transplanted into square plastic flowerpots (7 cm long × 7 cm wide × 8 cm high, four plants per pot) containing humus and sand (1:2 ratio), and placed in a light incubator at 30 °C, under 55% relative humidity and a 16 h light/8 h dark cycle. The roots, stems, leaves, and flowers of well-grown B. striata were gathered for tissue-specific expression profiling.
Two-month-old seedlings were selected for the stress treatment experiments. To determine the low temperature responses of B. striata plants, they were placed in a 4 °C incubator and whole plants were gathered at 0, 1, 3, 6, and 12 h after treatment, respectively. For oxidative stress, a 100 μM Cu2SO4 solution was sprayed on whole B. striata plants, which were gathered at 0, 1, 3, 6, and 12 h following treatment, respectively. All samples were immediately frozen and stored in a −80 °C refrigerator and three biological replicates were used.
A. thaliana seedlings (Col-0 ecotype) under similar growth conditions were transplanted into square plastic pots (7 cm long × 7 cm wide × 8 cm high, two plants per pot) containing substrate soil, perlite, and vermiculite (3:1:1), and cultured at 22 °C, 55% relative humidity, and 8 h light/16 h dark. Subcellular localization experiments were conducted using healthy A. thaliana with no shoot materials.

4.6. RNA Extraction and q-PCR Analysis

The total RNA was extracted from each sample using the Polysaccharide and Polyphenol Plant Rapid RNA Isolation Kit (TaKaRa, Dalian, China), after which the concentration and quality of RNA were measured with a NanoDrop 2000c Spectrophotometer (Thermo Scientific, USA). The cDNA was synthesized from 1 μg of total RNA using the HiScript II Q Select Reverse Transcriptase Kit (Vazyme Biotech, Nanjing, China).
The q-PCR primers were designed with genscript (https://www.genscript.com/tools/real-time-pcr-taqman-primer-design-tool, accessed on 8 April 2022), and q-PCR was performed on a LightCycler 96 system (Roche Diagnostics GmbH, Mannheim, Germany) with SYBR Green q-PCR Master MIX (Vazyme, Nanjing, China) (20 μL reaction solution, including 10 μL MasterMix, 0.4 μL forward primer, 0.4 μL reverse primer, 0.5 μL template cDNA, and 8.5 μL sterile deionized water). Three technological replications were used for each reaction, and the BsGAPDH gene was used as the internal reference gene. The reaction procedure was as follows: 95 °C for 1 min; 95 °C for 5 s; 58 °C for 30 s; 72 °C for 30 s, for a total of 45 cycles. The relative expressions of BsSWEETs were calculated using the 2−ΔΔCT method [76]. Finally, the data were analyzed via DPS v9.01 (China) and Microsoft office Excel v2019 (Microsoft, Redmond, MA, USA), and curves were drawn by TBtools v1.089 and GraphPad v8.0 (San Diego, CA, USA), with all q-PCR primers listed in Table S7. Duncan’s test was employed to compare significant differences between treatments, and all data were the mean ± standard error of three biological and three technical replicates.

4.7. Expression Patterns of BsSWEET Genes

Using the q-PCR data for roots, stems, leaves, and flowers, the expression patterns of BsSWEET in different tissues were analyzed to explore the functions of BsSWEETs in tissue development, and heatmap was created with TBtools v1.089.

4.8. The Subcellular Localization of BsSWEET15 and BsSWEET16

We randomly selected BsSWEET15 and BsSWEET16 to perform subcellular localization studies, and in plant cells, the ORF of BsSWEET15 and BsSWEET16 with no terminator codon was reamplified with ORF-F and ORF-R primers harboring Kpn I and BamH I sites. The full-length sequences of BsSWEET15 and BsSWEET16 were cloned into the pHBT-GFP-NOS vector. Among them, the primers used for ORF amplification were designed by Primer Premier 5, as listed in Table S8. Further, healthy A. thaliana leaves were selected to prepare protoplasts, which transformed the confirmed recombinant vector [77]. Transformed protoplasts were typically incubated at 22 °C for 16 h in the dark. The empty vector expressing untargeted GFP was used as a control. GFP fluorescence images were captured using a high-resolution confocal laser microscope (Leica TCS SP5, LEICA, Wetzlar, Germany) with a dual-channel red-green light scanning mode, (488 nm to excite GFP green fluorescence, and 543 nm to excite chloroplast autofluorescence).

4.9. Interactive Network Analysis of BsSWEET Genes

Ortho venn (http://www.bioinfogenome.net/OrthoVenn/, accessed on 15 April 2022) was used to identify orthologous pairs between BsSWEETs and AtSWEETs [78]. Next, based on an A. thaliana association model [79], the STRING database (http://string-db.org/cgi, accessed on 15 April 2022) was used to construct the predicted interaction network of SWEET genes in B. striata.

Supplementary Materials

The following supporting information can be downloaded at: https://www.mdpi.com/article/10.3390/ijms231710057/s1.

Author Contributions

Conceptualization, C.L., Z.W. and J.N.; methodology, J.Y. and Y.C.; formal analysis, C.L., Z.M. and S.L.; investigation, C.L. and D.W.; data curation, C.L. and Y.C.; writing—original draft preparation, C.L.; writing—review and editing, J.N.; project administration, D.W., Z.W. and J.N. All authors have read and agreed to the published version of the manuscript.

Funding

This research was funded by the National Natural Science Foundation of China [grant numbers 82104323]; Xi’an Science and Technology Project [grant numbers 20NYYF0057]; Shaanxi Provincial Key R & D Program [grant numbers 2022SF-172, 2021SF-383, 2020LSFP2-21, and 2018FP2-26]; Research Project on Postgraduate Education and Teaching Reform of Shaanxi Normal University [grant numbers GERP676 20-41]; and Youth In-novation Team Construction Scientific Research Project of the Shaanxi Education Department [grant numbers 21JP027].

Institutional Review Board Statement

Not applicable.

Informed Consent Statement

Not applicable.

Data Availability Statement

MDPI Research Data Policies.

Conflicts of Interest

The authors declare no conflict of interest.

References

  1. Lalonde, S.; Wipf, D.; Frommer, W.B. Transport mechanisms for organic forms of carbon and nitrogen between source and sink. Annu. Rev. Plant Biol. 2004, 55, 341–372. [Google Scholar] [CrossRef] [PubMed]
  2. Rolland, F.; Baena-Gonzalez, E.; Sheen, J. Sugar sensing and signaling in plants: Conserved and novel mechanisms. Annu. Rev. Plant Biol. 2006, 57, 675–709. [Google Scholar] [CrossRef] [PubMed]
  3. Ruhland, W.; Wolf, J. Metabolism of Carbohydrates and Organic Acids in Plants (Exclusive of Bacteria and Fungi). Annu. Rev. Biochem. 1936, 5, 485–512. [Google Scholar] [CrossRef]
  4. Ayre, B.G. Membrane-transport systems for sucrose in relation to whole-plant carbon partitioning. Mol. Plant 2011, 43, 377–394. [Google Scholar] [CrossRef] [PubMed]
  5. Smeekens, S. Sugar-Induced Signal Transduction in Plants. Annu. Rev. Plant Physiol. Plant Mol. Biol. 2000, 51, 49–81. [Google Scholar] [CrossRef]
  6. Gazzarrini, S.; Mccourt, P. Genetic interactions between ABA, ethylene and sugar signaling pathways. Curr. Opin. Plant Biol. 2001, 4, 387–391. [Google Scholar] [CrossRef]
  7. Neuhaus, H.E. Transport of primary metabolites across the plant vacuolar membrane. FEBS Lett. 2007, 58112, 2223–2226. [Google Scholar] [CrossRef]
  8. Kuhn, C.; Grof, C.P. Sucrose transporters of higher plants. Curr. Opin. Plant Biol. 2010, 133, 288–298. [Google Scholar] [CrossRef]
  9. Roitsch, T. Source-sink regulation by sugar and stress. Curr. Opin. Plant Biol. 1999, 2, 198–206. [Google Scholar] [CrossRef]
  10. Riesmeier, J.W.; Willmitzer, L.; Frommer, W.B. Isolation and characterization of a sucrose carrier cDNA from spinach by functional expression in yeast. EMBO J. 1992, 11, 4705–4713. [Google Scholar] [CrossRef]
  11. Lemoine, R. Sucrose transporters in plants: Update on function and structure. Biochim. Biophys. Acta 2000, 1465, 246–262. [Google Scholar] [CrossRef]
  12. Ruiz-Medrano, R.; Xoconostle-Cázares, B.; Lucas, W.J. The phloem as a conduit for inter-organ communication. Curr. Opin. Plant Biol. 2001, 4, 202–209. [Google Scholar] [CrossRef]
  13. Chen, L.Q.; Cheung, L.S.; Feng, L.; Tanner, W.; Frommer, W.B. Transport of sugars. Annu. Rev. Biochem. 2015, 84, 865–894. [Google Scholar] [CrossRef]
  14. Ainsworth, E.A.; Bush, D.R. Carbohydrate export from the leaf: A highly regulated process and target to enhance photosynthesis and productivity. Plant Physiol. 2011, 1551, 64–69. [Google Scholar] [CrossRef] [PubMed]
  15. Baker, R.F.; Leach, K.A.; Braun, D.M. SWEET as sugar: New sucrose effluxers in plants. Mol. Plant 2012, 54, 766–768. [Google Scholar] [CrossRef]
  16. Yuan, M.; Wang, S. Rice MtN3/saliva/SWEET family genes and their homologs in cellular organisms. Mol. Plant 2013, 63, 665–674. [Google Scholar] [CrossRef]
  17. Ji, J.; Yang, L.; Fang, Z.; Zhang, Y.; Zhuang, M.; Lv, H.; Wang, Y. Plant SWEET Family of Sugar Transporters: Structure, Evolution and Biological Functions. Biomolecules 2022, 122, 205. [Google Scholar] [CrossRef]
  18. Xuan, Y.H.; Hu, Y.B.; Chen, L.Q.; Sosso, D.; Ducat, D.C.; Hou, B.H.; Frommer, W.B. Functional role of oligomerization for bacterial and plant SWEET sugar transporter family. Proc. Natl. Acad. Sci. USA 2013, 110, 3685–3694. [Google Scholar] [CrossRef]
  19. Braun, D.M. Phloem Loading and Unloading of Sucrose: What a Long, Strange Trip from Source to Sink. Annu. Rev. Plant Biol. 2022, 73, 553–584. [Google Scholar] [CrossRef]
  20. Chen, L.Q.; Qu, X.Q.; Hou, B.H.; Sosso, D.; Osorio, S.; Fernie, A.R.; Frommer, W.B. Sucrose efflux mediated by SWEET proteins as a key step for phloem transport. Science 2012, 335, 207–211. [Google Scholar] [CrossRef]
  21. Guan, Y.F.; Huang, X.Y.; Zhu, J.; Gao, J.F.; Zhang, H.X.; Yang, Z.N. Ruptured Pollen Grain1, a member of the MtN3/saliva gene family, is crucial for exine pattern formation and cell integrity of microspores in Arabidopsis. Plant Physiol. 2008, 1472, 852–863. [Google Scholar] [CrossRef] [PubMed]
  22. Sun, M.X.; Huang, X.Y.; Yang, J.; Guan, Y.F.; Yang, Z.N. Arabidopsis RPG1 is important for primexine deposition and functions redundantly with RPG2 for plant fertility at the late reproductive stage. Plant Reprod. 2013, 262, 83–91. [Google Scholar] [CrossRef] [PubMed]
  23. Yang, B.; Sugio, A.; White, F.F. Os8N3 is a host disease-susceptibility gene for bacterial blight of rice. Proc. Natl. Acad. Sci. USA 2006, 103, 10503–10508. [Google Scholar] [CrossRef] [PubMed]
  24. Antony, G.; Zhou, J.; Huang, S.; Li, T.; Liu, B.; White, F.; Yang, B. Rice xa13 recessive resistance to bacterial blight is defeated by induction of the disease susceptibility gene Os-11N. Plant Cell 2010, 2211, 3864–3876. [Google Scholar] [CrossRef]
  25. Abelenda, J.A.; Bergonzi, S.; Oortwijn, M.; Sonnewald, S.; Du, M.; Visser, R.; Sonnewald, U.; Bachem, C. Source-Sink Regulation Is Mediated by Interaction of an FT Homolog with a SWEET Protein in Potato. Curr. Biol. 2019, 29, 1178–1186. [Google Scholar] [CrossRef]
  26. Bown, D. The Royal Horticultural Society Encyclopedia of Herbs & Their Uses; Dorling Kindersley Limited: New York, NY, USA, 1995. [Google Scholar]
  27. Wiart, C. Medicinal Plants of China, Korea, and Japan: Bioresources for Tomorrow’s Drugs and Cosmetics; CRC Press: Boca Raton, FL, USA, 2012. [Google Scholar]
  28. Tan, K.W. The systematic status of the genus Bletilla (Orchidaceae). Brittonia 1969, 21, 202–214. [Google Scholar] [CrossRef]
  29. Jiang, S.; Wang, M.; Jiang, L.; Xie, Q.; Yuan, H.; Yang, Y.; Zafar, S.; Liu, Y.; Jian, Y.; Li, B.; et al. The medicinal uses of the genus Bletilla in traditional Chinese medicine: A phytochemical and pharmacological review. J. Ethnopharmacol. 2021, 280, 114263. [Google Scholar] [CrossRef]
  30. Dietz, K.J.; Baier, M.; Krämer, U. Free Radicals and Reactive Oxygen Species as Mediators of Heavy Metal Toxicity in Plants; Springer: Berlin/Heidelberg, Germany, 1999. [Google Scholar]
  31. Liu, S.; Lu, C.; Jiang, G.; Zhou, R.; Chang, Y.; Wang, S.; Wang, D.; Niu, J.; Wang, Z. Comprehensive functional analysis of the PYL-PP2C-SnRK2s family in Bletilla striata reveals that BsPP2C22 and BsPP2C38 interact with BsPYLs and BsSnRK2s in response to multiple abiotic stresses. Front. Plant Sci. 2022, 13, 963069. [Google Scholar] [CrossRef]
  32. Cui, B.; Cheng, S.; Yuan, X.; Zhou, Y.; Hao, P.; Junlin, L.I.; Jie, M.A. Effects of Low Temperature Stress on the Photosynthetic Characteristics and Chlorophyll Fluorescence Parameters of Bletilla striata. Chin. J. Trop. Crops 2019, 40, 891–897. [Google Scholar] [CrossRef]
  33. Li, R.; Wang, W. Research survey and countermeasure on resources utilization in stem tuber of Bletilla striata. Chin. Tradit. Herb. Drugs 2006, 37, 1751–1755. [Google Scholar]
  34. Chandran, D. Co-option of developmentally regulated plant SWEET transporters for pathogen nutrition and abiotic stress tolerance. IUBMB Life 2015, 677, 461–471. [Google Scholar] [CrossRef]
  35. Sakr, S.; Wang, M.; Dedaldechamp, F.; Perez-Garcia, M.D.; Ogé, L.; Hamama, L.; Atanassova, R. The Sugar-Signaling Hub: Overview of Regulators and Interaction with the Hormonal and Metabolic Network. Int. J. Mol. Sci. 2018, 199, 2506. [Google Scholar] [CrossRef] [PubMed]
  36. Chen, Q.; Xu, X.; Xu, D.; Zhang, H.; Zhang, C.; Li, G. WRKY18 and WRKY53 Coordinate with HISTONE ACETYLTRANSFERASE1 to Regulate Rapid Responses to Sugar. Plant Physiol. 2019, 1804, 2212–2226. [Google Scholar] [CrossRef] [PubMed]
  37. Hwang, Y.S.; Karrer, E.E.; Thomas, B.R.; Chen, L.; Rodriguez, R.L. Three cis-elements required for rice α-amylase Amy3D expression during sugar starvation. Plant Mol. Biol. 1998, 363, 331–341. [Google Scholar] [CrossRef] [PubMed]
  38. Eom, J.S.; Chen, L.Q.; Sosso, D.; Julius, B.T.; Lin, I.W.; Qu, X.Q.; Braun, D.M.; Frommer, W.B. SWEETs, transporters for intracellular and intercellular sugar translocation. Curr. Opin. Plant Biol. 2015, 25, 53–62. [Google Scholar] [CrossRef] [PubMed]
  39. Liu, M.; Liu, T.; Lu, J.; Zhou, Y.; Liu, S.; Jiao, P.; Liu, S.; Qu, J.; Guan, S.; Ma, Y. Characterization and Functional Analysis of ZmSWEET15a in Maize. DNA Cell Biol. 2022, 416, 564–574. [Google Scholar] [CrossRef]
  40. Feng, C.Y.; Han, J.X.; Han, X.X.; Jiang, J. Genome-wide identification, phylogeny, and expression analysis of the SWEET gene family in tomato. Gene 2015, 5732, 261–272. [Google Scholar] [CrossRef]
  41. Arabidopsis Genome Initiative. Analysis of the genome sequence of the flowering plant Arabidopsis thaliana. Nature 2000, 408, 796–815. [Google Scholar] [CrossRef]
  42. Yu, J.; Hu, S.; Wang, J.; Wong, G.K.; Li, S.; Liu, B.; Deng, Y.; Dai, L.; Zhou, Y.; Zhang, X.; et al. A draft sequence of the rice genome (Oryza sativa L. ssp. indica). Science 2002, 296, 79–92. [Google Scholar] [CrossRef]
  43. Jaillon, O.; Aury, J.M.; Noel, B.; Policriti, A.; Clepet, C.; Casagrande, A.; Choisne, N.; Aubourg, S.; Vitulo, N.; Jubin, C.; et al. The grapevine genome sequence suggests ancestral hexaploidization in major angiosperm phyla. Nature 2007, 449, 463–467. [Google Scholar] [CrossRef]
  44. Tomato Genome Consortium. The tomato genome sequence provides insights into fleshy fruit evolution. Nature 2012, 485, 635–641. [Google Scholar] [CrossRef] [PubMed] [Green Version]
  45. Schnable, P.S.; Ware, D.; Fulton, R.S.; Stein, J.C.; Wei, F.; Pasternak, S.; Liang, C.; Zhang, J.; Fulton, L.; Graves, T.A.; et al. The B73 maize genome: Complexity, diversity, and dynamics. Science 2009, 326, 1112–1115. [Google Scholar] [CrossRef]
  46. Jiang, S.; Balan, B.; Assis, R.; Sagawa, C.; Wan, X.; Han, S.; Wang, L.; Zhang, L.; Zaini, P.A.; Walawage, S.L.; et al. Genome-Wide Profiling and Phylogenetic Analysis of the SWEET Sugar Transporter Gene Family in Walnut and Their Lack of Responsiveness to Xanthomonas arboricola pv. juglandis Infection. Int. J. Mol. Sci. 2020, 21, 1251. [Google Scholar] [CrossRef] [PubMed]
  47. Xuan, C.; Lan, G.; Si, F.; Zeng, Z.; Wang, C.; Yadav, V.; Wei, C.; Zhang, X. Systematic Genome-Wide Study and Expression Analysis of SWEET Gene Family: Sugar Transporter Family Contributes to Biotic and Abiotic Stimuli in Watermelon. Int. J. Mol. Sci. 2021, 22, 8407. [Google Scholar] [CrossRef]
  48. Chen, L.Q.; Hou, B.H.; Lalonde, S.; Takanaga, H.; Hartung, M.L.; Qu, X.Q.; Guo, W.J.; Kim, J.G.; Underwood, W.; Chaudhuri, B.; et al. Sugar transporters for intercellular exchange and nutrition of pathogens. Nature 2010, 468, 527–532. [Google Scholar] [CrossRef] [PubMed]
  49. Zhou, Y.; Liu, L.; Huang, W.; Yuan, M.; Zhou, F.; Li, X.; Lin, Y. Overexpression of OsSWEET5 in rice causes growth retardation and precocious senescence. PLoS ONE 2014, 94, e94210. [Google Scholar] [CrossRef]
  50. Klemens, P.A.; Patzke, K.; Deitmer, J.; Spinner, L.; Le Hir, R.; Bellini, C.; Bedu, M.; Chardon, F.; Krapp, A.; Neuhaus, H.E. Overexpression of the vacuolar sugar carrier AtSWEET16 modifies germination, growth, and stress tolerance in Arabidopsis. Plant Physiol. 2013, 1633, 1338–1352. [Google Scholar] [CrossRef]
  51. Zhang, Y.; Zhang, G.Q.; Zhang, D.; Liu, X.D.; Xu, X.Y.; Sun, W.H.; Yu, X.; Zhu, X.; Wang, Z.W.; Zhao, X.; et al. Chromosome-scale assembly of the Dendrobium chrysotoxum genome enhances the understanding of orchid evolution. Hortic. Res. 2021, 81, 183. [Google Scholar] [CrossRef]
  52. Geng, Y.; Wu, M.; Zhang, C. Sugar Transporter ZjSWEET2.2 Mediates Sugar Loading in Leaves of Ziziphus jujuba Mill. Front. Plant Sci. 2020, 11, 1081. [Google Scholar] [CrossRef]
  53. Zhang, X.; Feng, C.; Wang, M.; Li, T.; Liu, X.; Jiang, J. Plasma membrane-localized SlSWEET7a and SlSWEET14 regulate sugar transport and storage in tomato fruits. Hortic. Res. 2021, 81, 186. [Google Scholar] [CrossRef]
  54. Kanno, Y.; Oikawa, T.; Chiba, Y.; Ishimaru, Y.; Shimizu, T.; Sano, N.; Koshiba, T.; Kamiya, Y.; Ueda, M.; Seo, M. AtSWEET13 and AtSWEET14 regulate gibberellin-mediated physiological processes. Nat. Commun. 2016, 7, 13245. [Google Scholar] [CrossRef] [PubMed] [Green Version]
  55. Li, W.; Ren, Z.; Wang, Z.; Sun, K.; Pei, X.; Liu, Y.; He, K.; Zhang, F.; Song, C.; Zhou, X.; et al. Evolution and Stress Responses of Gossypium hirsutum SWEET Genes. Int. J. Mol. Sci. 2018, 19, 769. [Google Scholar] [CrossRef] [PubMed]
  56. Finn, R.D.; Coggill, P.; Eberhardt, R.Y.; Eddy, S.R.; Mistry, J.; Mitchell, A.L.; Potter, S.C.; Punta, M.; Qureshi, M.; Sangrador-Vegas, A.; et al. The Pfam protein families database: Towards a more sustainable future. Nucleic Acids Res. 2016, 44, D279–D285. [Google Scholar] [CrossRef]
  57. Letunic, I.; Doerks, T.; Bork, P. SMART: Recent updates, new developments and status. Nucleic Acids Res. 2015, D257–D260. [Google Scholar] [CrossRef] [PubMed]
  58. Jones, P.; Binns, D.; Chang, H.Y.; Fraser, M.; Li, W.; McAnulla, C.; McWilliam, H.; Maslen, J.; Mitchell, A.; Nuka, G.; et al. InterProScan 5: Genome-scale protein function classification. Bioinformatics 2014, 309, 1236–1240. [Google Scholar] [CrossRef] [PubMed]
  59. Wilkins, M.R.; Gasteiger, E.; Bairoch, A.; Sanchez, J.C.; Williams, K.L.; Appel, R.D.; Hochstrasser, D.F. Protein identification and analysis tools in the ExPASy server. Methods Mol. Biol. 1999, 112, 531–552. [Google Scholar] [CrossRef]
  60. Horton, P.; Park, K.J.; Obayashi, T.; Fujita, N.; Harada, H.; Adams-Collier, C.J.; Nakai, K. WoLF PSORT: Protein localization predictor. Nucleic Acids Res. 2007, 35, W585–W587. [Google Scholar] [CrossRef]
  61. Geourjon, C.; Deléage, G. SOPMA: Significant improvements in protein secondary structure prediction by consensus prediction from multiple alignments. Comput. Appl. Biosci. 1995, 11, 681–684. [Google Scholar] [CrossRef]
  62. Biasini, M.; Bienert, S.; Waterhouse, A.; Arnold, K.; Studer, G.; Schmidt, T.; Kiefer, F.; Gallo Cassarino, T.; Bertoni, M.; Bordoli, L.; et al. SWISS-MODEL: Modelling protein tertiary and quaternary structure using evolutionary information. Nucleic Acids Res. 2014, 42, W252–W258. [Google Scholar] [CrossRef]
  63. Almagro Armenteros, J.J.; Tsirigos, K.D.; Sonderby, C.K. Predicting transmembrane protein topology with a hidden Markov model: Application to complete genomes. SignalP 5.0 improves signal peptide predictions using deep neural networks. Nat. Biotechnol. 2019, 374, 420–423. [Google Scholar] [CrossRef]
  64. Krogh, A.; Larsson, B.; von Heijne, G.; Sonnhammer, E.L. Predicting transmembrane protein topology with a hidden Markov model: Application to complete genomes. J. Mol. Biol. 2001, 3053, 567–580. [Google Scholar] [CrossRef] [PubMed] [Green Version]
  65. Blom, N.; Sicheritz-Ponten, T.; Gupta, R. Clustal W and Clustal X version 2. Prediction of post-translational glycosylation and phosphorylation of proteins from the amino acid sequence. Proteomics 2004, 46, 1633–1649. [Google Scholar] [CrossRef]
  66. Larkin, M.A.; Blackshields, G.; Brown, N.P.; Chenna, R.; McGettigan, P.A.; McWilliam, H.; Valentin, F.; Wallace, I.M.; Wilm, A.; Lopez, R.; et al. Clustal W and Clustal X version 2. Bioinformatics 2007, 2321, 2947–2948. [Google Scholar] [CrossRef]
  67. Kumar, S.; Stecher, G.; Tamura, K. MEGA7: Molecular Evolutionary Genetics Analysis Version 7.0 for Bigger Datasets. Mol. Biol. Evol. 2016, 337, 1870–1874. [Google Scholar] [CrossRef] [PubMed]
  68. Zhang, H.; Gao, S.; Lercher, M.J.; Hu, S.; Chen, W.H. EvolView, an online tool for visualizing, annotating and managing phylogenetic trees. Nucleic Acids Res. 2012, 40, 569–572. [Google Scholar] [CrossRef] [PubMed]
  69. Bailey, T.L.; Boden, M.; Buske, F.A.; Frith, M.; Grant, C.E.; Clementi, L.; Ren, J.; Li, W.W.; Noble, W.S. MEME SUITE: Tools for motif discovery and searching. Nucleic Acids Res. 2009, 37, W202–W208. [Google Scholar] [CrossRef]
  70. Lescot, M.; Déhais, P.; Thijs, G.; Marchal, K.; Moreau, Y.; Van de Peer, Y.; Rouze, P.; Rombauts, S. PlantCARE, a database of plant cis-acting regulatory elements and a portal to tools for in silico analysis of promoter sequences. Nucleic Acids Res. 2002, 30, 325–327. [Google Scholar] [CrossRef]
  71. Chen, C.; Chen, H.; Zhang, Y.; Thomas, H.R.; Frank, M.H.; He, Y.; Xia, R. TBtools: An Integrative Toolkit Developed for Interactive Analyses of Big Biological Data. Mol. Plant 2020, 138, 1194–1202. [Google Scholar] [CrossRef]
  72. Wang, Y.; Tang, H.; Debarry, J.D.; Tan, X.; Li, J.; Wang, X.; Lee, T.H.; Jin, H.; Marler, B.; Guo, H.; et al. MCScanX: A toolkit for detection and evolutionary analysis of gene synteny and collinearity. Nucleic Acids Res. 2012, 407, e49. [Google Scholar] [CrossRef]
  73. Krzywinski, M.; Schein, J.; Birol, I.; Connors, J.; Gascoyne, R.; Horsman, D.; Jones, S.J.; Marra, M.A. Circos: An information aesthetic for comparative genomics. Genome Res. 2009, 199, 1639–1645. [Google Scholar] [CrossRef]
  74. Yang, Z. PAML 4: Phylogenetic analysis by maximum likelihood. Mol. Biol. Evol. 2007, 24, 1586–1591. [Google Scholar] [CrossRef] [PubMed] [Green Version]
  75. Yang, Z.; Nielsen, R.; Goldman, N.; Pedersen, A.M. Codon-substitution models for heterogeneous selection pressure at amino acid sites. Genetics 2000, 155, 431–449. [Google Scholar] [CrossRef] [PubMed]
  76. Livak, K.J.; Schmittgen, T.D. Analysis of relative gene expression data using real-time quantitative PCR and the 2−ΔΔCT method. Methods 2001, 25, 402–408. [Google Scholar] [CrossRef] [PubMed]
  77. Yoo, S.D.; Cho, Y.H.; Sheen, J. Arabidopsis mesophyll protoplasts: A versatile cell system for transient gene expression analysis. Nat. Protoc. 2007, 27, 1565–1572. [Google Scholar] [CrossRef] [PubMed]
  78. Xu, L.; Dong, Z.; Fang, L.; Luo, Y.; Wei, Z.; Guo, H.; Zhang, G.; Gu, Y.Q.; Coleman-Derr, D.; Xia, Q.; et al. OrthoVenn2: A web server for whole-genome comparison and annotation of orthologous clusters across multiple species. Nucleic Acids Res. 2019, 47, W52–W58. [Google Scholar] [CrossRef]
  79. Szklarczyk, D.; Gable, A.L.; Lyon, D.; Junge, A.; Wyder, S.; Huerta-Cepas, J.; Simonovic, M.; Doncheva, N.T.; Morris, J.H.; Bork, P.; et al. STRING v11: Protein-protein association networks with increased coverage, supporting functional discovery in genome-wide experimental datasets. Nucleic Acids Res. 2019, 47, D607–D613. [Google Scholar] [CrossRef] [Green Version]
Figure 1. Multiple sequence alignments of BsSWEET proteins.
Ijms 23 10057 g001
Figure 2. Phylogenetic relationships of SWEET proteins. Red, orange, dark green, and green indicate different clades (clade I, clade II, clade III, and clade IV) of SWEET genes. Red stars represent genes from B. striata. Blue triangles, yellow circles, and purple rectangles represent genes from A. thaliana, O. sativa, and V. vinifera, respectively. At, Os, Vv, and Bs represent A. thaliana, O. sativa, V. vinifera, and B. striata, respectively.
Ijms 23 10057 g002
Figure 3. Phylogenetic relationships, gene structures, and architectures of conserved protein motifs in BsSWEET genes. (A) Phylogenetic relationship analysis of BsSWEET genes. Red, orange, dark green, and green indicate clade I, clade II, clade III, and clade IV, respectively. (B) Motif analysis of BsSWEET proteins. Colored boxes numbered 1–8 indicate different motifs. Detailed information for each motif is provided in Figure S7 and Table S3. The protein lengths can be estimated by the scale at the bottom. (C) Exon–intron structures of BsSWEET genes. CDS, UTR, and introns are indicated by blue, gold, and black lines, respectively. The lengths of exons and introns from each BsSWEET gene are presented proportionally.
Ijms 23 10057 g003
Figure 4. Phylogenetic relationships and cis-acting elements in BsSWEET genes. (A) Phylogenetic relationship analysis of BsSWEET proteins. Red, orange, dark green, and green indicate clade I, clade II, clade III, and clade IV, respectively. (B) Functions of cis-acting elements found in the promoter regions of the BsSWEET genes. The promoter sequences of 23 SWEET genes (−2500 bp) were analyzed by PlantCARE. The upstream lengths of the translation start sites can be inferred from the scale at the bottom.
Ijms 23 10057 g004
Figure 5. Repeat and synteny analysis. (A) Chromosomal distribution of BsSWEET genes. The chromosome numbers and sizes are indicated at the top and left of each bar. (B) Duplication analysis of BsSWEET genes. (C) Covariance analysis of SWEET genes between B. striata and other plants. Red lines represent homologous gene pairs.
Ijms 23 10057 g005
Figure 6. Expression profiles of BsSWEET genes in different tissues. Expression levels of 23 BsSWEETs were analyzed by q-PCR in the roots, stems, leaves, and flowers. A heatmap was constructed by log2-transformed expression levels. R, S, L, and F represent root, stem, leaf, and flower, respectively.
Ijms 23 10057 g006
Figure 7. Relative expression levels of BsSWEETs under simulated mock control, low temperature treatments. All data represent averages of three biological replicates, error bars indicate SD. p < 0.05 (lowercase letters) and p < 0.01 (capital letters) were considered statistically significant by the Duncan’s test.
Ijms 23 10057 g007
Figure 8. Relative expression levels of BsSWEETs under simulated mock control and Cu2SO4 solution treatments. All data represent averages of three biological replicates, error bars indicate SD. p < 0.05 (lowercase letters) and p < 0.01 (capital letters) were considered statistically significant by the Duncan’s test.
Ijms 23 10057 g008
Figure 9. The subcellular localization of BsSWEET15 and BsSWEET16 in A. thaliana protoplasts. (Scale bar: 5 μm).
Ijms 23 10057 g009
Figure 10. Functional interactive network of BsSWEET15 and its interacting proteins.
Ijms 23 10057 g010
Publisher’s Note: MDPI stays neutral with regard to jurisdictional claims in published maps and institutional affiliations.