1. Introduction
Chronic Myeloid Leukemia (CML) is a myeloproliferative disease affecting approximately 1 per 200,000 persons per year in industrialized countries. Many treatment improvements have been achieved recently, especially in the development of new drugs, but a mortality rate of 2–3% per year remains [
1,
2]. A distinctive feature of CML is the reciprocal translocation, originating in hematopoietic stem cells (HSCs), between the long arms of chromosomes 9 and 22, i.e., t(9;22) (q34;q11.2), which results in the BCR-ABL1 chimeric gene. This genomic aberration generates a new fusion gene, BCR-ABL1, which encodes for a tyrosine kinase held accountable for the neoplastic transformation of these cells by affecting normal cellular pathways essential for tissue homeostasis and thus causing the alteration of crucial cellular processes, such as apoptosis, cell cycle, and autophagy [
3,
4]. In this context, one primary goal of research is to identify the regulatory mechanisms antagonizing the kinase activity of BCR-ABL1 and, possibly, of other vital effectors intersecting this pathway, as players other than BCR-ABL1 have been involved in the pathogenesis of the disease [
5,
6]. The natural history of CML, prior to the advent of small molecule protein kinase antagonists, features a progression from a stable or chronic phase to an accelerated phase or to a rapidly fatal blast crisis within 3–5 years. Typically blood cells differentiate normally in the stable phase, but not in the blast phase [
1]. Protein Tyrosine Phosphatase Receptor Type G (PTPRG) is a member of the protein tyrosine phosphatase (PTP) family featuring an extracellular and a single transmembrane region and two tandem intracytoplasmic catalytic domains [
7]. PTPRG is widely expressed in human tissues [
8] and is involved in the regulation of cell growth, differentiation, mitotic cycle, and oncogenic transformation [
9,
10]. The gene encoding for this phosphatase is located in a chromosomal region (3p21-p14.2) frequently deleted in renal cell and lung carcinoma, where PTPRG acts as a tumor suppressor in many cancers [
11,
12,
13,
14]. Specifically, PTPRG was recognized as having an oncosuppressor function gene and was found down-regulated in CML patients. The relevance of this gene to CML has recently been supported by several studies performed in patients, and strategies aimed at restoring its expression are expected to benefit the course of the disease by improving drug efficacy or contrasting the emergence of BCR/ABL1 mutants [
15,
16,
17].
Epigenetic events, such as the hyper-methylation of its promoter region as well as intron 1, negatively regulate the transcription of PTPRG, as demonstrated in CML and childhood acute lymphoblastic leukemia [
16,
18,
19,
20]. Re-expression of this protein occurs in leukocytes (especially neutrophils) of CML patients following targeted therapy [
18]. Once activated, PTPRG can reduce the phosphorylation level of BCR-ABL1 and some of its key targets, such as CRK-L and STAT5 [
18]. We found that in CML cells, PTPRG expression inversely correlates with BCR/ABL1 expression and activation, both in cell lines and primary cell models following pathways that include beta catenin [
21] and possibly others that are currently under investigation [
17,
20,
21].
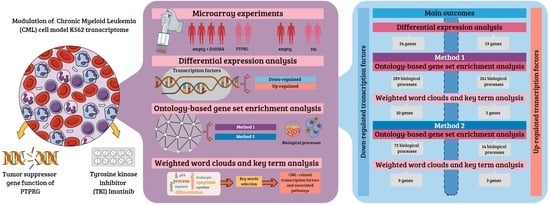
Our study focuses on the detection of genes and gene pathways in protein–protein interaction networks (commonly considered a proxy of gene networks) that are most likely affected by the state of the gene coding for PTPRG and by the treatment with a prototype tyrosine kinases inhibitor (TKI), Imatinib, in the K562 cell line overexpressing the enzymatic active and enzymatic dead PTPRG. Tyrosine kinases phosphorylate proteins on tyrosine residues, producing a biologic signal that also influences many aspects of cellular functions, including cell growth, proliferation, differentiation, and death. PTPs act as natural modulators of TKI signaling, and it is well known how the inhibition of TKI represents a strategy to disrupt signaling pathways that promote neoplastic growth and survival in haematologic malignancies and likely in other neoplasia as well. In order to identify responsive genes, we implemented two analytical pipelines, hereafter referred to as Method 1 and Method 2. On the set of differentially expressed genes, we applied two methods of analysis. With the first method (Method 1), we implemented Gene Set Enrichment Analysis (GSEA [
22]), followed by the identification of transcription factors. With the second method (Method 2), we first selected the transcription factors (TFs) from the set of differentially expressed genes and implemented GSEA on this set. Method 1 is a standard method commonly used in this type of analysis, while Method 2 is unconventional and is motivated by the intention to identify transcription factors more specifically involved in biological processes relevant to the CML condition. In Method 1, due to a larger gene universe, we expect the set of transcription factors selected upstream of the GSEA to be either larger or related to the known role of PTPRG as a modulator of hematopoietic cell differentiation [
10].
5. Discussion
We analyzed the modulation of CML cell model K562 transcriptome following transfection with the tumor suppressor gene PTPRG and treatment with the tyrosine kinase inhibitor (TKI) Imatinib with the aim of identifying genes responding to the PTPRG modulation and/or treatments with Imatinib.
We developed two GSEA-based computational methods, Method 1 and Method 2, aimed at detecting all the CML-related differentially expressed transcription factors (TF-DEGs) and the biological processes involved. To summarize, the genes responsive to the treatments found by our methods are:
Method 1:
- -
Up-regulated TF-DEGs: MECP2, NR2E1, RARG;
- -
Down-regulated TF-DEGs: ZBTB16, TFAP2C, SOX5, SMAD1, LHX2, IKZF3, IFI16, EPAS1, BATF3, BACH2;
Method 2:
- -
Up-regulated TF-DEGs: MECP2, NR2E1, RARG;
- -
Down-regulated TF-DEGs: ZBTB16, TRPS1, SOX5, SMAD1, IKZF3, IFI16, EPAS1, BATF3, BACH2.
Method 1 was designed to take as input the whole list of DEGs stemming from DEA and afterwards select only the TF-DEGs. On the other hand, Method 2 was set to filter out only TF-DEGs, identifying a smaller gene universe than Method 1. Moreover, the two methods were split into two modalities to discern between up-regulated and down-regulated genes. We observed that Method 1 returned more GO labels than Method 2 in both modalities. However, this entailed different outcomes for up-regulated and down-regulated TF-DEGs, respectively. In fact, both the word clouds and the correlation analysis showed that for up-regulated TF-DEGs, Method 1 returned appropriate and specific GO labels, while Method 2 provided more general results. Nevertheless, the selections of CML-related TF-DEGs stemming from key term analysis identified the same list of genes for both methods. Hence, we could say that in this case, Method 1 appears to be more appropriate on the grounds that it identified more specific GO labels than Method 2. For down-regulated TF-DEGs, Method 1 provided more high-level biological insights at all stages (weighted word clouds, correlation analysis, and key term selection), while Method 2 showed more specific references to CML-related biological processes. However, the final lists of CML-related TF-DEGs differ for only a few genes (LHX2 only for Method 2, and TFAP2D and TRPS1 only for Method 1). In this case, Method 2 is to be preferred to Method 1.
It is worth underlining that the validity of the dataset used and the methods applied were validated in the cell model by the identification of a novel molecular pathway that has been suggested by the analysis of the data derived from the approach proposed. Based on the identification of RARG and CD36 regulation in PTPRG overexpressing K562, we reasoned that a cell differentiation pathway might be altered in this condition. Indeed, Walkley et al. [
34] showed that RAR
null mice exhibit a considerable increase in granulocytes in the peripheral blood (PB) and in the bone marrow (BM) and spleen, developing a myeloproliferative-like syndrome and displaying a reduction in the megakaryocyte–erythroid progenitor fraction, thus altering homeostatic bone marrow erythropoiesis. We were able to confirm CD36, a Scavenger receptor expressed in myeloid cells [
52], up-regulation at the protein level and found that this was associated with hemoglobin overexpression, both markers of erythromyeloid differentiation induced by the treatment with TKI Imatinib. These data further confirm the key role of PTPRG, a gene described as a key regulator of cell differentiation in normal and in CML cells, acting as tumor suppressor in this context, a role supported by several studies performed in patients [
15,
16,
20,
21,
53]. Strategies aimed at restoring PTPRG expression are expected to benefit the course of the disease by improving drug efficacy or contrasting the emergence of BCR::ABL1 mutants.
In conclusion, the methods here presented offer a versatile exploratory computational approach to analyzing and extracting meaningful biological information. The study combines statistical tests for DEA and GSEA with human-curated contents (Gene Ontology), weighted word clouds, correlation analysis, and key term selection, originally born in different application domains (such as textual analysis). These methods could also potentially be very useful and expressive in the descriptive statistical analyses applied to gene biology.
Finally, we provide some future development of our analysis. The identification of genes responsive to pharmacological treatments is certainly not limited to the application of these exploratory methods focused mainly on the gene as a single entity and the quantitative characteristics of its activity (e.g., its expression level), but requires analyses relevant to the field of systems biology. Indeed, the past 20 years have seen a revolution in the volume and complexity of data generated in experiments and observations in the life sciences. With the increase in available data, the need for data management, integration, and analysis has become an increasingly important challenge. Biological knowledge is inherently complex and so cannot readily be integrated into existing databases of molecular data. For more than 20 years, ontologies have provided a means of unambiguously specifying biological knowledge—for example, about genes, anatomy, and phenotypes—in complex graph-based structures, which formally represent the concepts that are relevant in the domain and the relationships between them [
54]. On the one hand, an ontology defines a vocabulary of terms to denote concepts and relationships that are familiar to the user. On the other hand, it extends the data with background knowledge, such as sub-class and sub-property axioms, axioms establishing which classes constitute the domain and range of properties, and axioms expressing the disjointedness between classes or properties.
The use of ontologies began in the biological sciences around 1998 with the development of the Gene Ontology [
55,
56], which systematically summarizes the current knowledge of gene products across a wide range of species. Since then, many other initiatives have given rise to the design and implementation of ontology-based data management systems (also known as “Virtual Knowledge Graphs” [
57,
58] in the biological domain). Since then, many other databases have been created to store biological information in ontological structures. We refer the reader to [
56,
59,
60] for a comprehensive review of the most relevant existing ontologies in this field and their associated data sources.
Currently, the most prominent ontologies and ontology-based data management systems in the biology field store knowledge and data about the static structures of biological organisms, whereas the dynamic behaviours of biological processes have, for the past half-century, been captured in the mathematical language of physics-based simulation modelling [
61]. To date, there have been only a few attempts to bridge the wealth of structural knowledge and the wealth of process knowledge, i.e., of the physico-chemical laws described by equations of dynamical models. D. Cook et al. [
61] introduced the terms
bio-ontology and
biosimulation to indicate ontologies related to biological entities and simulation of physics-based mathematical models of biological systems dynamics.
Specifically, D. Cook and co-authors showed that the semantics of biosimulation models could be expressed in a formal ontology that describes the entities, the properties, and the physical laws that are encoded in the mathematical equations of a simulation model. They introduced the Ontology of Physics for Biology (OPB) [
62,
63] based on systems dynamics that makes explicit the biophysical semantics of physics-based biosimulation models. OPB can be used as a reference knowledge resource for annotating variables and equations of models and for deriving computable modeling code. Therefore, the future direction of this study is the development of a methodology to bridge this gap and link the semantics of biosimulation to the knowledge in structural bio-ontologies. A possible way to pursue this goal could be the analysis of gene networks resulting from the identification of TF-DEGs of interest. More specifically, we plan to choose TF-DEGs that seem to be involved in CML-related biological processes and expand the analysis on genes that interact with them. The types of relations between genes can be retrieved from various sources as partner or pathway databases. Here we relied on Pathway Commons, a pathway database that uses the Biological Pathway Exchange (BioPAX) [
64] standard to represent data. It allows for investigating multiple biological concepts, such as biochemical reactions; gene regulatory networks; genetic interactions; proteins, small molecules, DNA, RNA, complexes, and their cellular locations; complex assembly and transport; post-translational protein modifications; citations; experimental evidence; and links to other databases, e.g., protein sequence annotation [
65].
For our purposes, we focused on two types of gene–gene relationships involving TF-DEGs:
Control of gene expression (one-way relationship): we analyzed all the genes in control or controlled by TF-DEGs in terms of expression levels.
Interaction between genes (two-way relationship): we analyzed all the genes that chemically interact with TF-DEGs.
Since the analysis on up-regulated genes returned the same set of relevant TF-DEGs, we focused only on down-regulated genes.
Figures S2–S5 in Supplementary Materials show the analysis results for Method 1 and Method 2 as gene networks. In conclusion, we plan to investigate the biological and chemical relations between the genes represented in the networks to enrich the exploratory methods hereby defined with additional information about the network dynamics. The construction of the equations for the dynamics of the gene networks of interest involves calibrating the model as the next step. In possession only of static data, such as those used in this study, this phase will require the development of efficient sensitivity analysis techniques, given the large number of genes potentially involved and the expected non-linear dynamics. In this regard, we plan to refine the numerical techniques for parameter sensitivity analysis, inference, and the dynamic simulation developed in [
66,
67,
68].
Another future research line to be further explored is the identification and the analysis of the DEGs responsive to both the case study under examination and known pharmacological treatments with TKI. In this direction, we preliminarily performed DEA to detect DEGs between two groups: control considered as the untreated group (two replicates) and the treatment group referred to as TKI-expressing samples (two replicates). In order to discard background noise, only genes with an intra-group standard deviation <0.3 and distance between the group means >0.5 were considered. Differential expression analysis was conducted on log2-transformed gene expressions using the Bioconductor/R package
limma (Version 3.12). Both the empirical Bayes correction on the variances and the multi-testing Bonferroni–Hochberg correction on
p-values were selected. Therefore, genes with an adjusted
p-value < 0.05 and |log2FoldChange|> 0.1 were considered to be differentially expressed. Based on these criteria, 568 genes have been selected as DEGs: 310 were up-regulated, and 258 were down-regulated. Among them, we have identified 61 transcription factors, of which 25 are down-regulated, and 36 are up-regulated (see
Figure 16). The top five down-regulated TFs are GATA3, RUNX3, HES1, TBX4, and FOSL1, while the top five up-regulated are NPAS4, FOXN4, HOXA2, PURG, and ZNF540. Then, we selected only the DEGs that occurred in both selections stemming from DEA. The results are represented in
Figure 17 and are split between up-regulated and down-regulated genes.


 ,
, 


