Article

Target of Rapamycin Regulates Photosynthesis and Cell Growth in Auxenochlorella pyrenoidosa

1
Institute of Urban Agriculture, Chinese Academy of Agricultural Sciences, Chengdu National Agricultural Science and Technology Center, Chengdu 610213, China
2
Hainan Yazhou Bay Seed Laboratory, Sanya 572025, China
3
School of Agricultural Science, Zhengzhou University, Zhengzhou 450001, China
4
Department of Forest Mycology and Plant Pathology, Swedish University of Agricultural Sciences, 75007 Uppsala, Sweden
*
Authors to whom correspondence should be addressed.
These authors contributed equally to this work.
Int. J. Mol. Sci. 2022, 23(19), 11309; https://doi.org/10.3390/ijms231911309
Submission received: 2 August 2022 / Revised: 21 September 2022 / Accepted: 21 September 2022 / Published: 25 September 2022

Abstract

:
Auxenochlorella pyrenoidosa is an efficient photosynthetic microalga with autotrophic growth and reproduction, which has the advantages of rich nutrition and high protein content. Target of rapamycin (TOR) is a conserved protein kinase in eukaryotes both structurally and functionally, but little is known about the TOR signalling in Auxenochlorella pyrenoidosa. Here, we found a conserved ApTOR protein in Auxenochlorella pyrenoidosa, and the key components of TOR complex 1 (TORC1) were present, while the components RICTOR and SIN1 of the TORC2 were absent in Auxenochlorella pyrenoidosa. Drug sensitivity experiments showed that AZD8055 could effectively inhibit the growth of Auxenochlorella pyrenoidosa, whereas rapamycin, Torin1 and KU0063794 had no obvious effect on the growth of Auxenochlorella pyrenoidosa a. Transcriptome data results indicated that Auxenochlorella pyrenoidosa TOR (ApTOR) regulates various intracellular metabolism and signaling pathways in Auxenochlorella pyrenoidosa. Most genes related to chloroplast development and photosynthesis were significantly down-regulated under ApTOR inhibition by AZD8055. In addition, ApTOR was involved in regulating protein synthesis and catabolism by multiple metabolic pathways in Auxenochlorella pyrenoidosa. Importantly, the inhibition of ApTOR by AZD8055 disrupted the normal carbon and nitrogen metabolism, protein and fatty acid metabolism, and TCA cycle of Auxenochlorella pyrenoidosa cells, thus inhibiting the growth of Auxenochlorella pyrenoidosa. These RNA-seq results indicated that ApTOR plays important roles in photosynthesis, intracellular metabolism and cell growth, and provided some insights into the function of ApTOR in Auxenochlorella pyrenoidosa.

1. Introduction

Chlorella is a unicellular eukaryotic green alga that emerged 2 billion years ago and is a high-efficiency primary producer in ecosystems [1]. Chlorella can be cultured in a natural environment or in controllable closed systems, with higher productivity than most plants. For a long time, Chlorella has been deemed as a source of protein and fat, and it is used as a raw material for human food and animal feed [2,3]. Like land plants, Chlorella also performs photosynthesis via chloroplast, converting solar energy into chemical energy that is vital to its development and generates oxygen. Chlorella contains many high-value substances such as protein, pigment, antioxidants, vitamins, minerals and cell growth factor, and has been referred to as “the best genetic food in the 21st century” by the World Health Organization [4]. At present, over 10 species of Chlorella have been identified in the world [5,6], among which Auxenochlorella pyrenoidosa (A. pyrenoidosa, formerly Chlorella pyrenoidosa) has attracted much attention because it is edible and its protein content can account for more than 50% of dry weight [7]. The genome size of A. pyrenoidosa FACHB-9 is 56.6 Mbp, including 10,284 genes [8]. An analysis of the genome structure provides a foundation for improving A. pyrenoidosa production as food and fuels. Furthermore, A. pyrenoidosa has been widely used in wastewater treatment, especially in high-concentration inorganic industrial wastewater [9]. Utilizing high ammonium salts in industrial wastewater can produce up to 56.7% (dry weight) protein in A. pyrenoidosa, and 95% of ammonium salt could be consumed [10]. Additionally, A. pyrenoidosa also utilizes organic carbon source and nitrogen source for high-density heterotrophic growth, with production efficiency being over ten times higher than that of autotrophic growth [8]. However, chloroplast was degraded, lipid content was increased, and protein synthesis was inhibited in heterotrophic A. pyrenoidosa [8,11,12]. Genomic and transcriptomic sequencing results showed that heterotrophic to photoautotrophic of A. pyrenoidosa resulted in global metabolic reprogramming [8].
Target of rapamycin (TOR) is a core regulatory factor for eukaryotic growth and development, which coordinates cell proliferation, growth and metabolism [13,14]. TOR protein has highly conserved structures, including N-terminal HEAT repeats, FAT, FRB, catalytic and C-terminal FATC domains [15]. TOR protein and other proteins form TOR complex 1 (TORC1) and TORC2 in yeast and mammals [16,17]. However, there was only the conserved and functional TORC1 in plants, and TORC1 was composed of TOR, regulatory associate the protein target of rapamycin (RAPTOR) and lethal with sec-13 protein 8 (LST8) [18,19]. TORC2 core proteins RICTOR and SIN1 seem to be missing in photosynthetic eukaryotes, including plants and green algae [20,21].
Rapamycin is a macrolide immunosuppressant from the bacterium Streptomyces hygroscopicus. It binds to the 12 kDa FK506 binding protein (FKBP12) and the FRB domain of TOR, thereby inhibiting the activity of TOR protein [22]. Loss of FKBP12 function prevents rapamycin from inhibiting the TOR protein in most plants [23,24,25,26]. Fortunately, TOR kinase inhibitors such as Torin1, AZD8055 and KU0063794 from mammals were developed and applied in plants, and have also been proved to specifically and efficiently inhibit TOR kinase activity in plants [15,27,28]. With the help of TOR inhibitors and various omics research methods, animal and plant conserved and plant-specific TOR signaling pathways have been revealed [18,29]. In plants, TOR regulates cell division and elongation, protein synthesis, nutrient and metabolism, and stress response by integrating multiple exogenous environmental signals and endogenous physiological signals [15,30,31,32]. TOR affects plant growth and development from embryogenesis to photomorphogenesis, root and leaf development, flowering, and senescence in plants [13,18,33].
Genomic analysis of some algal species revealed that TORC1 components are widely conserved in algae [34]. Different from other microalgae, the functions of TOR have been comprehensively studied in the model green alga Chlamydomonas reinhardtii (C. reinhardtii) [35]. Previous studies have shown that C. reinhardtii is sensitive to rapamycin, and the rapamycin sensitive TORC1 signaling regulates cell growth, protein synthesis, autophagy, and key metabolism processes in C. reinhardtii [35,36,37]. In addition, a recent study has shown that TOR controls the carotenoid production by phosphorylating lycopene beta/epsilon cyclase in C. reinhardtii [38]. This is the first evidence that TOR directly regulates the biosynthesis of secondary metabolite carotenoid in algae. As an industrial production alga, A. pyrenoidosa has fast growth rate, rich nutrition and high protein. However, the TOR signaling pathway of A. pyrenoidosa has not been reported, and whether TOR signaling regulates the cell growth and protein synthesis of A. pyrenoidosa remains unknown. In this study, homologous sequence alignment revealed that there was only the conserved TORC1 signaling pathway in A. pyrenoidosa. Drug sensitivity experiments showed that AZD8055 could effectively inhibit the growth of A. pyrenoidosa, while rapamycin, Torin1 and KU0063794 had no effect on the growth of A. pyrenoidosa. RNA-seq results showed that most genes involved in photosynthesis were significantly down-regulated in A. pyrenoidosa treated with AZD8055, indicating that ApTOR had an important effect on photosynthesis of A. pyrenoidosa. In addition, DEGs involved in the regulation of autophagy and ubiquitin mediated proteolysis were almost all up-regulated, suggesting that ApTOR was also involved in regulating autophagy and protein catabolic process of A. pyrenoidosa. These results suggested that ApTOR plays major roles in regulating photosynthesis and cellular metabolism in A. pyrenoidosa.

2. Results

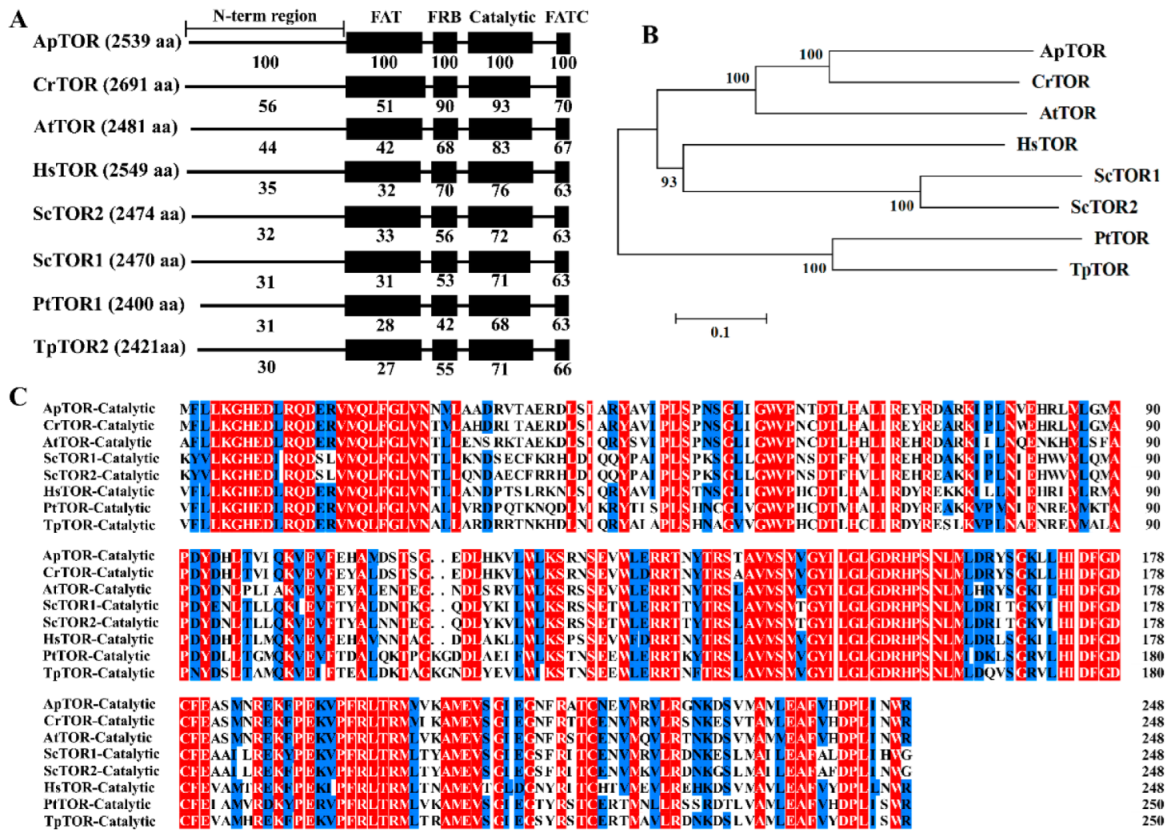
2.1. Conserved TOR Signaling Pathway in Auxenochlorella Pyrenoidosa

The conserved TORC1 signal regulates intracellular metabolism, nutrient, and energy in C. reinhardtii [35,36,37]. To investigate the conserved TOR signaling pathway in A. pyrenoidosa, BLASTp analysis was performed on the public transcriptome data of A. pyrenoidosa (NCBI accession number: PRJNA730327). Only one conserved TOR protein (ApTOR) was found in A. pyrenoidosa, with a maximum similarity of 69% to CrTOR protein. ApTOR contains N-terminal HEAT repeats, FAT, FRB, catalytic and FATC domains at C-terminal (Figure 1A). Homologous sequence alignment revealed that the catalytic domain of ApTOR was the most conserved with the highest similarity among species, while the FAT domain had the lowest similarity among species (Figure 1A,C). Phylogenetic tree showed that ApTOR and CrTOR were the most conserved in evolution but had the most distant evolutionary relationship with TpTOR and PtTOR (Figure 1B). Meanwhile, sequence alignment found that RAPTOR and LST8, the key proteins of TORC1, were also present in A. pyrenoidosa (Table 1), whereas RICTOR and SIN1, the key proteins of TORC2, were not found in A. pyrenoidosa. In addition, TORC1 signaling downstream components also existed in A. pyrenoidosa (Table 1). These results showed that there was a conserved TORC1 signaling pathway in A. pyrenoidosa.

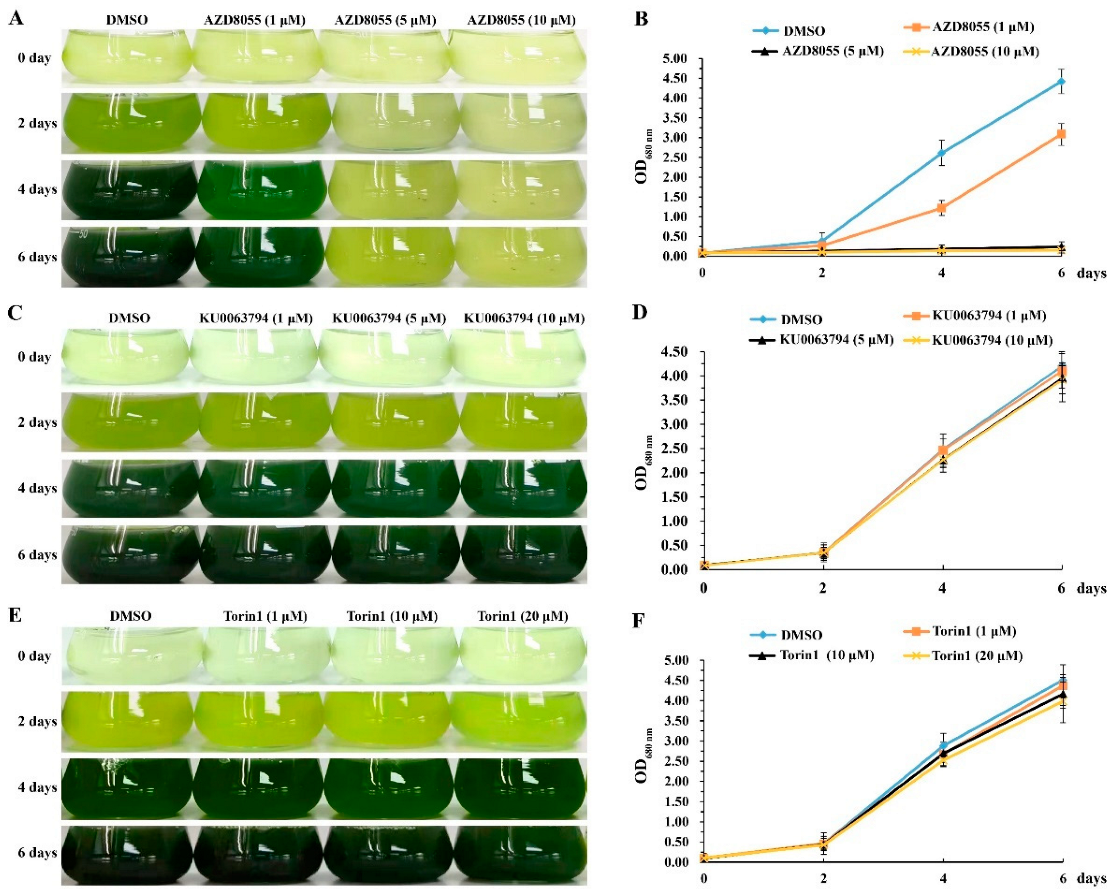
2.2. Effects of TOR Inhibitors on the Growth of Auxenochlorella Pyrenoidosa

In order to elucidate function of TOR signal in A. pyrenoidosa, A. pyrenoidosa was treated with rapamycin, a specific inhibitor of TOR protein. The results showed that rapamycin has no obvious effect on the growth of A. pyrenoidosa, even at a higher concentration of rapamycin (Figure 2A), indicating that A. pyrenoidosa is insensitive to rapamycin. Previous studies have shown that rapamycin inhibits the TOR activity by forming a ternary complex with FKBP12 and the FRB domain of TOR [39]. A ApFKBP12 sequence with 43% similarity to CrFKBP12 was found in the transcriptome data of A. pyrenoidosa, encoding 159 amino acids (Table 1). Interestingly, ApFKBP12 protein is evolutionarily closer to rapamycin-sensitive species (Figure 2B). Some amino acids involved in the formation of the FKBP12-rapamycin complex are required for inhibiting TOR activity [40]. We found that the ApFKBP12 protein sequence contains the conserved amino acids required for FKBP12 binding to rapamycin, including Tyr26, Asp38 and Gly89 (numbered according to human HsFKBP12) (Figure 2C). However, there was an additional sequence of 52 amino acids at the N-terminal of ApFKBP12 protein compared with other species (Figure 2C), which may change the function of ApFKBP12 protein and failure in binding to rapamycin. Rapamycin also interacts with the FRB domain of TOR by binding to aromatic residues [40], and sequence alignment revealed that these key amino acids were highly conserved in A. pyrenoidosa and other species (Figure 2D). As the FRB domain of ApTOR is highly conserved, the resistance of A. pyrenoidosa to rapamycin may be due to the loss of ApFKBP12 function.
Furthermore, TOR kinase inhibitors AZD8055, Torin1 and KU0063794 were used to treat A. pyrenoidosa. The results showed that AZD8055 could effectively inhibit the growth of A. pyrenoidosa, while Torin1 and KU0063794 had no effect on the growth of A. pyrenoidosa even at higher concentrations (Figure 3). The 50% inhibitory concentration (IC50) of AZD8055 on the growth of A. pyrenoidosa was about 1 μM. When the concentration of AZD8055 reached 5 μM, the growth of A. pyrenoidosa was completely inhibited, indicating that the lethal concentration of AZD8055 may be 5 μM (Figure 3A,B). However, when AZD8055 was removed from the medium, the inhibited cells resumed growth (Supplementary Figure S1), indicating that inhibition of ApTOR kinase activity by AZD8055 prevents cell division without killing cells. These results suggested that AZD8055 can be applied to elucidate the function of ApTOR in A. pyrenoidosa.

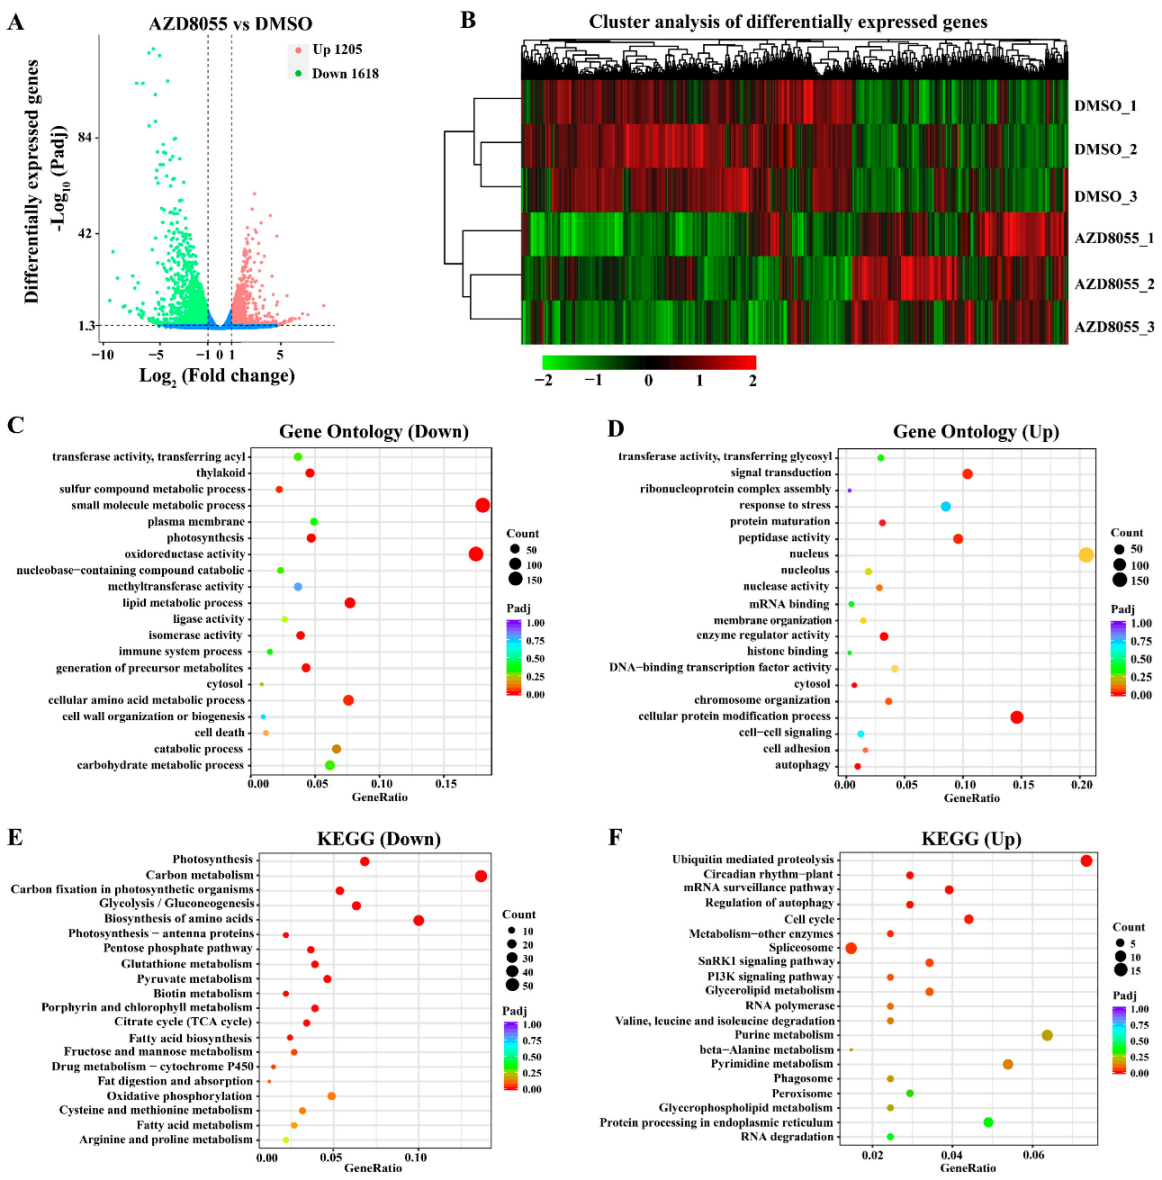
2.3. Analysis of Transcriptome Sequencing under ApTOR Inhibition

To further clarify the roles of ApTOR signaling pathway in A. pyrenoidosa, the transcriptome sequencing was performed in A. pyrenoidosa treated with AZD8055. The growth curve showed that A. pyrenoidosa was in the logarithmic phase after incubation for 4 days (Figure 3); we therefore cultured the algal cells for 4 days before AZD8055 treatment. In addition, we found that the OD680nm value, chlorophyll content, protein content, and starch content of A. pyrenoidosa were significantly changed during A. pyrenoidosa treated with 5 μM AZD8055 for 24 h (Figure 4); thus, A. pyrenoidosa treated with 5 μM AZD8055 for 24 h was used for transcriptome sequencing.
A. pyrenoidosa was cultured for 4 days, and then final-concentration 5 μM AZD8055 or equivalent DMSO was added into the algal solution for 24 h. Subsequently, AZD8055-treated algal cells were used for transcriptome sequencing. After filtering the raw data, clean reads for subsequent analysis were obtained, and the data summary is as shown in Supplementary Table S1. A total of 2823 differentially expressed genes (DEGs) were found between AZD8055 treatment and DMSO control, of which 1205 DEGs were up-regulated and 1618 were down-regulated (Figure 5A). To verify the reliability of transcriptome data, 10 DEGs were randomly selected from the transcriptome data for qRT-PCR. The qRT-PCR results showed the same trend as the transcriptome data (Supplementary Figure S2), indicating that the transcriptome data were valid and reliable.
A cluster analysis of DEGs showed that the transcription levels of many genes were changed in A. pyrenoidosa treated with AZD8055 compared to the DMSO control (Figure 5B). To clarify the functions of DEGs, GO functional enrichment analysis was conducted, and a total of 121 down-regulated GO terms and 124 up-regulated GO terms were enriched in the transcriptome data. Among the down-regulated GO terms, thylakoid (GO:0009579) and photosynthesis (GO:0015979) were most significant enrichment (Figure 5C). Among the up-regulated GO terms, the cellular protein modification process (GO:0006464) and autophagy (GO:0006914) were most significant enrichment (Figure 5D). These results suggested that ApTOR regulates multiple biological processes in A. pyrenoidosa. A KEGG pathway enrichment analysis showed that photosynthesis, carbon metabolism and carbon fixation in photosynthetic organisms were most significant enrichment in the down-regulated DEGs (Figure 5E). Among the up-regulated KEGG pathways, ubiquitin mediated proteolysis and circadian rhythm-plant were most significantly enriched (Figure 5F). These results suggested that ApTOR controls various intracellular metabolism and signaling pathways in A. pyrenoidosa.

2.4. DEGs Involved in Regulating Chloroplast Development and Photosynthesis of Auxenochlorella Pyrenoidosa

Chloroplasts containing chlorophyll are necessary for photosynthesis in plants [41]. Previous studies showed that TOR has the function of regulating chloroplast development and photosynthesis in Arabidopsis [42]. Down-regulated GO terms related to photosynthesis and chloroplast development were enriched in the transcriptome data (Figure 5C). Meanwhile, metabolic pathways related to plant photosynthesis were also found in the KEGG pathways, such as photosynthesis, carbon fixation in photosynthetic organisms, and porphyrin and chlorophyll metabolism (Figure 5E). These results indicated that ApTOR has important effects on chloroplast development and photosynthesis in A. pyrenoidosa.
A total of 62 DEGs were associated with photosynthesis under ApTOR inhibition, among which 29, 9 and 24 DEGs were enriched in the “Photosynthesis”, “Photosynthesis-antenna proteins” and “Carbon fixation in photosynthetic organisms” KEGG pathways, respectively (Table 2). Most DEGs related to photosynthesis were significantly down-regulated, and all DEGs of photosystem I, photosystem II and chlorophyll a/b binding protein pathways were down-regulated under ApTOR inhibition (Table 2 and Supplementary Figure S3). The highest down-regulated gene was Chlorophyll a-b binding protein 4 (Cluster-495.6691) gene with 131.60-fold decrease. In the dark reaction of photosynthesis, 22 down-regulated DEGs and 2 up-regulated DEGs were involved in carbon fixation. In addition, all 16 chlorophyll synthesis genes involved in “Porphyrin and chlorophyll biosynthesis” pathway were down-regulated from 2.27- to 27.67-fold, and 44 down-regulated DEGs and 6 up-regulated DEGs were involved in the “Thylakoid” pathway (Supplementary Table S2). These results suggested that ApTOR positively regulates chloroplast development and photosynthesis in A. pyrenoidosa.

2.5. DEGs Involved in Regulating Protein Synthesis and Catabolism of Auxenochlorella Pyrenoidosa

A. pyrenoidosa has a high protein content, but whether ApTOR regulates the protein synthesis of A. pyrenoidosa remains unknown. Previous studies have shown that ribosomes are responsible for protein synthesis in all organisms, and TOR plays an essential role in regulating ribosome synthesis [43,44,45]. In this study, genes involved in the “Ribosome biogenesis” pathway were significantly changed in A. pyrenoidosa, including ribosomal proteins and U3 small nucleolar ribonucleoprotein proteins. A total of 40 DEGs were enriched in the KEGG “Ribosome biogenesis” pathway, including 26 down-regulated DEGs and 14 up-regulated DEGs, and most of DEGs were ribosome proteins (Supplementary Table S3). Importantly, most of DEGs associated with ribosomal proteins were significantly down-regulated, and the most down-regulated gene was 50S ribosomal protein L2 (Cluster-829.0) with 26.17-fold decrease (Supplementary Table S3). These results indicated that ApTOR inhibition leads to dysfunction of ribosomes, especially changes in ribosomal protein-related genes, further indicating that ApTOR controls protein synthesis by ribosomes.
Autophagy plays a central role in protein degradation, and previous studies showed that TOR negatively regulates autophagy [46,47,48]. In this study, transcriptome analysis showed that autophagy related DEGs were significantly enriched in GO terms and KEGG pathways (Figure 5D,F). Total 8 DEGs were assigned to the “Regulation of autophagy” pathway, of which 7 genes were up-regulated including SnRK1α and ATG genes, and 1 gene was down-regulated in the RNA-seq data (Table 3). These results suggested that ApTOR negatively regulates autophagy in A. pyrenoidosa. Ubiquitin (Ub)/26S proteasome system (UPS) is the main pathway of protein degradation in cells. Ub is sequentially covalently linked to the target protein by ubiquitin activase (E1), ubiquitin binding enzyme (E2), and ubiquitin protein ligase (E3), and then the target protein is degraded by the proteasome [49,50]. The “Ubiquitin mediated proteolysis” KEGG pathway was influenced by AZD8055 (Figure 5F). Total 19 DEGs were assigned to the “Ubiquitin mediated proteolysis” pathway, including 15 up-regulated genes and 4 down-regulated genes (Table 3). Four genes encoding E1 activating enzyme were up-regulated from 2.28- to 7.84-fold under ApTOR inhibition. In addition, some important E3 ubiquitin ligase genes, including Cullin 1, Cullin 3, and Cullin 4, were significantly up-regulated (Table 3). These results showed that ApTOR inhibition activated protein catabolism in A. pyrenoidosa.

2.6. DEGs Involved in Regulating the Cell Growth of Auxenochlorella Pyrenoidosa

Carbon and nitrogen metabolism, protein and fat synthesis are important limiting factors of cell growth and proliferation [51,52]. In this study, the genes associated with carbon metabolism, amino acid metabolism and fatty acid metabolism were significantly changed under ApTOR inhibition (Supplementary Table S4). DEGs of carbon metabolism and biosynthesis of amino acids and fatty acid pathways were significantly enriched in the down-regulated KEGG pathways (Figure 5E). A total 65 DEGs were assigned to the “carbon metabolism” pathway, including 56 down-regulated genes and 9 up-regulated genes. Some rate-limiting enzyme genes in the “carbon metabolism” pathway such as fructose bisphosphate aldolase and pyruvate kinase were significantly down-regulated. A total 45 DEGs were assigned to the “biosynthesis of amino acids” pathway, including 41 down-regulated genes and 4 up-regulated genes. In addition, all 10 DEGs assigned to the “fatty acid biosynthesis” pathway were down-regulated from 2.53- to 28.44-fold (Supplementary Table S4), indicating that AZD8055 inhibited the biosynthesis of fatty acids in A. pyrenoidosa. These results suggested that ApTOR inhibition affects a variety of intracellular metabolic processes, especially carbon and nitrogen metabolism and fatty acid metabolism. The disruption of metabolic homeostasis by AZD8055 may help to inhibit the growth of A. pyrenoidosa cells. Consistent with the growth phenotype of A. pyrenoidosa treated with AZD8055, all 14 DEGs related to tricarboxylic acid (TCA) cycle were down-regulated from 2.18- to 11.98-fold in the transcriptome data, including rate-limiting enzymes isocitrate dehydrogenase, α-oxoglutarate dehydrogenase and pyruvate dehydrogenase (Table 4), implying that AZD8055 inhibited cell growth of A. pyrenoidosa by inhibiting TCA cycle and reducing energy supply.

3. Discussion

TOR regulates protein synthesis, intracellular metabolism and cell proliferation by integrating nutrients, energy and environmental signals [13,14,53]. In this study, we provide some new insights into how ApTOR controls multiple cellular processes to regulate cell growth of A. pyrenoidosa. Only TORC1 is found in higher plants and the green algae C. reinhardtii, which contains key proteins TOR, RAPTOR and LST8. TORC1 activity is regulated by nutrients and environmental stresses and responds to different environmental conditions by controlling intracellular metabolic processes [21,35]. Consistent with the results of higher plants and C. reinhardtii, only one conserved ApTOR protein was found in A. pyrenoidosa (Figure 1 and Table 1). The key components RAPTOR and LST8 of TORC1 were present, while the components RICTOR and SIN1 of the TORC2 were absent in A. pyrenoidosa, implying that the conserved TORC1 pathway exists in A. pyrenoidosa.
Studies have shown that C. reinhardtii is sensitive to rapamycin [54]. Unexpectedly, we found that rapamycin had no obvious effect on the growth of A. pyrenoidosa, even at a higher concentration of rapamycin (20 μM) (Figure 2), showing that A. pyrenoidosa is insensitive to rapamycin. Phylogenetic tree analysis and amino acid sequence alignment showed that the resistance of A. pyrenoidosa to rapamycin may be caused by the loss of ApFKBP12 function. In addition, we found that AZD8055 could effectively inhibit the growth of A. pyrenoidosa, while Torin1 and KU0063794 had no effect on the growth of A. pyrenoidosa even at higher concentrations, implying that Torin1 and KU0063794 could not act on the kinase domain of ApTOR protein due to amino acid variation.
Photosynthesis is a plant-specific physiological activity, providing energy and sugars for plants autotrophic growth, which is the biggest difference from animals [55,56]. Previous studies have shown that TOR signaling is closely related to chloroplast development and photosynthesis in plants [33,57,58]. Photosynthetic absorption of CO2 increased TOR activity, which in turn the enhanced TOR activity further promoted photosynthesis in C. reinhardtii [58]. Most DEGs involving chloroplast development and photosynthesis, such as thylakoid, porphyrin and chlorophyll biosynthesis, and photosynthesis, were down-regulated under ApTOR inhibition by AZD8055 (Table 2), showing that ApTOR had important effects on chloroplast development and photosynthesis of A. pyrenoidosa.
Protein degradation is mainly mediated by the ubiquitin/26S proteasome pathway and autophagy [59,60]. In this study, we found that ApTOR inhibition activates autophagy and ubiquitin mediated proteolysis pathway in A. pyrenoidosa (Table 3), promoting catabolism of protein. However, genes related to ribosome synthesis were significantly down-regulated in the RNA-seq data, thus inhibiting protein synthesis. These results indicated that ApTOR is involved in regulating protein synthesis and catabolism by multiple metabolic pathways in A. pyrenoidosa. Furthermore, the transcriptome data showed that ApTOR controls various intracellular metabolism and signaling pathways in A. pyrenoidosa. Inhibition of ApTOR activity resulted in disorders of carbon and nitrogen metabolism, protein and fatty acid metabolism and TCA cycle, which further inhibited the cell growth of A. pyrenoidosa.

4. Materials and Methods

4.1. Algae and Growth Condition

The strain of A. pyrenoidosa (FACHB-9) used in this study was purchased from the Institute of Hydrobiology, Chinese Academy of Sciences (Wuhan, China). A. pyrenoidosa was cultured in BG11 liquid medium supplemented with 20 g.L−1 glucose under 28 °C, 2000 lux continuous light, and 180 rpm.

4.2. Treatment of Auxenochlorella Pyrenoidosa by TOR Inhibitors

The A. pyrenoidosa cells was inoculated into a 50 mL BG11 liquid medium supplemented with different concentrations of TOR inhibitors (rapamycin, AZD8055, KU0063794, Torin1) and incubated at 28 °C, 2000 lux continuous light, and 180 rpm. The cell density at 680 nm optical density (OD680) was measured with a Microplate Reader (Biotek EpochTM2, Winooski, VT, USA) at 0, 2, 4 and 6 days.
To test whether A. pyrenoidosa cells were killed by high concentrations of AZD8055. A. pyrenoidosa cells were treated with 1, 5 and 10 μM AZD8055 for 4 days, and AZD8055 was removed from the medium, then the pellet was resuspended with BG11 and adjusted to the same OD value. Meanwhile, the removed supernatant containing different concentrations of AZD8055 was added into fresh A. pyrenoidosa cells. The phenotype was observed after culturing with or without AZD8055 for 4 days.

4.3. Phylogenetic Tree Analysis

Homologous sequences from different species were aligned by ClustalX software. Phylogenetic tree was generated from the Neighbor-Joining method by MEGA 4 software, and Poisson correction model was used to compute genetic distance. TpTOR (XP_002293107.1), CrTOR (XP_042921379.1), PtTOR (XP_002181617.1), AtTOR (NP_175425.2), HsTOR (NP_001373429.1), ScTOR1 (NP_012600.1), ScTOR2 (NP_012719.2), CrFKBP12 (XP_001693615.1), AtFKBP12 (NP_201240.1), StFKBP12 (XP_006351741.1), OsFKBP12 (XP_015625368.1), SpFKBP12 (NP_595257.1), HsFKBP12 (NP_000792.1) and ScFKBP12 (NP_014264.1) protein sequences were download from NCBI database.

4.4. Construction of the RNA-seq Library and Transcriptome Sequencing

A. pyrenoidosa was cultured in 50 mL BG11 liquid medium supplemented with 20 g·L−1 glucose at 28 °C, 2000 lux continuous light, and 180 rpm for 4 days. Then, final-concentration 5 μM AZD8055 and equivalent DMSO were added into the alga solution for 24 h, and algal cells were precipitated by centrifugation and collected. Three independent biological replicates were performed for each treatment. Total RNA of A. pyrenoidosa treated with AZD8055 or DMSO was extracted by Plant RNA extraction kit (TIANGEN, Beijing, China). The RNA library was constructed using NEBNext® Ultra TMRNA Library Prep Kit (NEB, Boston, MA, USA) by Tianjin Novogene Bioinformatics Technology Co., Ltd. Qualified library was sequenced on an Illumina Novaseq 6000 platform and 150 bp paired-end reads were generated. Clean reads were obtained by filtering the raw data.

4.5. Transcriptome Assembly, Annotation and Differential Expression Analysis

After obtaining clean reads, the Trinity software (V2.6.6, Marlborough, MA, USA) [61] was used to spliced clean reads to obtain reference sequences for subsequent analysis. Diamond software (V0.9.13.114, Tübingen, Germany) [62] was used to match the gene sequence into the protein database for functional annotation. Using gene function annotations information from major databases, including NR, GO, KEGG, Pfam, KOG/COG, and Swiss-prot databases, the spliced genes were annotated. DESeq2 R package (1.20.0) [63] was used to analyze the differentially expressed genes (DEGs) between AZD8055 treatment and DMSO control. P-adj < 0.05 and | Log2 (Fold change)|> 1 were set as the threshold values of gene differential expression. GO and KEGG plant databases were used to predict the function of genes and describe the gene products, and the annotation information related to plants was selected for GO and KEGG pathway enrichment. Goseq (V1.10.0, Parkville, Australia) and KOBAS (V2.0.12, Beijing, China) software were used for GO and KEGG pathway enrichment analysis of DEGs, respectively [64,65].

4.6. Quantitative Real-Time PCR (qRT-PCR) Validation

To verify reliability of transcriptome data, qRT-PCR was used to quantify the expression levels of 10 randomly selected genes. CDS sequences of the genes were derived from transcriptome sequencing data, and the corresponding specific primers were presented in Supplementary Table S5. ApActin (Cluster-495.7101) was used as a reference gene. RNA from A. pyrenoidosa that was processed in the same batch as transcriptome sequencing was selected for qRT-PCR. Relative expression levels of genes were assayed by two-step RT-PCR analysis using the Bio-Rad CFX96 Manager software (BIO-RAD, Hercules, CA, USA). Reaction was performed in a final volume of 20 µL containing 10 µL of 2 × SYBR Green PCR Mastermix (Solarbio, Beijing, China). The relative RNA products of the genes were analyzed using the formula 2ΔΔCT.

5. Conclusions

In conclusion, this study revealed the conserved ApTOR signaling in A. pyrenoidosa and elucidated the effects of TOR inhibitors on the growth of A. pyrenoidosa. Transcriptome data results showed that ApTOR is involved in regulating chloroplast development, photosynthesis and intracellular metabolism in A. pyrenoidosa, and ApTOR promotes the cell growth of A. pyrenoidosa by regulating various signaling pathways and intracellular metabolic processes. This study provides some insights into the function of ApTOR in A. pyrenoidosa.

Supplementary Materials

The following supporting information can be downloaded at: https://www.mdpi.com/article/10.3390/ijms231911309/s1.

Author Contributions

M.R. and T.Z. designed the experiments. T.Z. and L.L. performed the experiments. M.R., T.Z. and L.L. analyzed the data. T.Z., L.L., J.Z. and H.C. wrote the manuscript. All authors have read and agreed to the published version of the manuscript.

Funding

This work was supported by grants from the Agricultural Science and Technology Innovation Program of Chinese Academy of Agricultural Sciences (34-IUA-02), the “open competition mechanism to select the best candidates project” of Hainan Yazhou Bay Seed Laboratory (B21HJ0203) and the special project of Nanfan Research Institute of Chinese Academy of Agricultural Sciences (YBXM12).

Institutional Review Board Statement

Not applicable.

Informed Consent Statement

Not applicable.

Data Availability Statement

The transcriptome data have been deposited in the NCBI Sequence Read Archive under accession number PRJNA841794.

Conflicts of Interest

The authors declare no conflict of interest.

References

  1. Heckman, D.S.; Geiser, D.M.; Eidell, B.R.; Stauffer, R.L.; Kardos, N.L.; Hedges, S.B. Molecular evidence for the early colonization of land by fungi and plants. Science 2001, 293, 1129–1133. [Google Scholar] [CrossRef]
  2. Spolaore, P.; Joannis-Cassan, C.; Duran, E.; Isambert, A. Commercial applications of microalgae. J. Biosci. Bioeng. 2006, 101, 87–96. [Google Scholar] [CrossRef]
  3. Barkia, I.; Saari, N.; Manning, S.R. Microalgae for High-Value Products towards Human Health and Nutrition. Mar. Drugs 2019, 17, 304. [Google Scholar] [CrossRef] [PubMed]
  4. Torres-Tiji, Y.; Fields, F.J.; Mayfield, S.P. Microalgae as a future food source. Biotechnol. Adv. 2020, 41, 107536. [Google Scholar] [CrossRef]
  5. Yang, B.; Liu, J.; Jiang, Y.; Chen, F. Chlorella species as hosts for genetic engineering and expression of heterologous proteins: Progress, challenge and perspective. Biotechnol. J. 2016, 11, 1244–1261. [Google Scholar] [CrossRef]
  6. Krienitz, L.; Huss, V.A.; Bock, C. Chlorella: 125 years of the green survivalist. Trends Plant Sci. 2015, 20, 67–69. [Google Scholar] [CrossRef] [PubMed]
  7. Song, X.; Wang, J.; Wang, Y.; Feng, Y.; Cui, Q.; Lu, Y. Artificial creation of Chlorella pyrenoidosa mutants for economic sustainable food production. Bioresour. Technol. 2018, 268, 340–345. [Google Scholar] [CrossRef] [PubMed]
  8. Fan, J.; Ning, K.; Zeng, X.; Luo, Y.; Wang, D.; Hu, J.; Li, J.; Xu, H.; Huang, J.; Wan, M.; et al. Genomic Foundation of Starch-to-Lipid Switch in Oleaginous Chlorella spp. Plant Physiol. 2015, 169, 2444–2461. [Google Scholar] [CrossRef] [PubMed]
  9. Zhao, X.C.; Tan, X.B.; Yang, L.B.; Liao, J.Y.; Li, X.Y. Cultivation of Chlorella pyrenoidosa in anaerobic wastewater: The coupled effects of ammonium, temperature and pH conditions on lipids compositions. Bioresour. Technol. 2019, 284, 90–97. [Google Scholar] [CrossRef] [PubMed]
  10. Wang, Q.; Yu, Z.; Wei, D. High-yield production of biomass, protein and pigments by mixotrophic Chlorella pyrenoidosa through the bioconversion of high ammonium in wastewater. Bioresour. Technol. 2020, 313, 123499. [Google Scholar] [CrossRef]
  11. Sachdeva, N.; Kumar, G.D.; Gupta, R.P.; Mathur, A.S.; Manikandan, B.; Basu, B.; Tuli, D.K. Kinetic modeling of growth and lipid body induction in Chlorella pyrenoidosa under heterotrophic conditions. Bioresour. Technol. 2016, 218, 934–943. [Google Scholar] [CrossRef]
  12. Liu, Z.H.; Li, T.; He, Q.Y.; Sun, Z.; Jiang, Y. Role of Mitochondria in Regulating Lutein and Chlorophyll Biosynthesis in Chlorella pyrenoidosa under Heterotrophic Conditions. Mar. Drugs 2018, 16, 354. [Google Scholar] [CrossRef]
  13. Burkart, G.M.; Brandizzi, F. A Tour of TOR Complex Signaling in Plants. Trends Biochem. Sci. 2021, 46, 417–428. [Google Scholar] [CrossRef] [PubMed]
  14. Artins, A.; Caldana, C. The metabolic homeostaTOR: The balance of holding on or letting grow. Curr. Opin. Plant Biol. 2022, 66, 102196. [Google Scholar] [CrossRef]
  15. Shi, L.; Wu, Y.; Sheen, J. TOR signaling in plants: Conservation and innovation. Development 2018, 145, dev160887. [Google Scholar] [CrossRef] [PubMed]
  16. Szwed, A.; Kim, E.; Jacinto, E. Regulation and metabolic functions of mTORC1 and mTORC2. Physiol. Rev. 2021, 101, 1371–1426. [Google Scholar] [CrossRef] [PubMed]
  17. Tafur, L.; Kefauver, J.; Loewith, R. Structural Insights into TOR Signaling. Genes 2020, 11, 885. [Google Scholar] [CrossRef] [PubMed]
  18. Liu, Y.; Xiong, Y. Plant target of rapamycin signaling network: Complexes, conservations, and specificities. J. Integr. Plant Biol. 2022, 64, 342–370. [Google Scholar]
  19. Xiong, Y.; Sheen, J. Novel links in the plant TOR kinase signaling network. Curr. Opin. Plant Biol. 2015, 28, 83–91. [Google Scholar] [CrossRef] [PubMed]
  20. van Dam, T.J.; Zwartkruis, F.J.; Bos, J.L.; Snel, B. Evolution of the TOR pathway. J. Mol. Evol. 2011, 73, 209–220. [Google Scholar] [CrossRef]
  21. Dobrenel, T.; Caldana, C.; Hanson, J.; Robaglia, C.; Vincentz, M.; Veit, B.; Meyer, C. TOR Signaling and Nutrient Sensing. Annu. Rev. Plant Biol. 2016, 67, 261–285. [Google Scholar] [CrossRef]
  22. Crespo, J.L.; Hall, M.N. Elucidating TOR signaling and rapamycin action: Lessons from Saccharomyces cerevisiae. Microbiol. Mol. Biol. Rev. 2002, 66, 579–591. [Google Scholar] [CrossRef]
  23. Xu, Q.; Liang, S.; Kudla, J.; Luan, S. Molecular characterization of a plant FKBP12 that does not mediate action of FK506 and rapamycin. Plant. J. 1998, 15, 511–519. [Google Scholar] [CrossRef] [PubMed]
  24. Sormani, R.; Yao, L.; Menand, B.; Ennar, N.; Lecampion, C.; Meyer, C.; Robaglia, C. Saccharomyces cerevisiae FKBP12 binds Arabidopsis thaliana TOR and its expression in plants leads to rapamycin susceptibility. BMC Plant Biol. 2007, 7, 26. [Google Scholar] [CrossRef] [PubMed]
  25. Imamura, S.; Ishiwata, A.; Watanabe, S.; Yoshikawa, H.; Tanaka, K. Expression of budding yeast FKBP12 confers rapamycin susceptibility to the unicellular red alga Cyanidioschyzon merolae. Biochem. Biophys. Res. Commun. 2013, 439, 264–269. [Google Scholar] [CrossRef]
  26. Ren, M.; Venglat, P.; Qiu, S.; Feng, L.; Cao, Y.; Wang, E.; Xiang, D.; Wang, J.; Alexander, D.; Chalivendra, S.; et al. Target of rapamycin signaling regulates metabolism, growth, and life span in Arabidopsis. Plant Cell 2012, 24, 4850–4874. [Google Scholar] [CrossRef]
  27. Montané, M.H.; Menand, B. TOR inhibitors: From mammalian outcomes to pharmacogenetics in plants and algae. J. Exp. Bot. 2019, 70, 2297–2312. [Google Scholar] [CrossRef] [PubMed]
  28. Montané, M.H.; Menand, B. ATP-competitive mTOR kinase inhibitors delay plant growth by triggering early differentiation of meristematic cells but no developmental patterning change. J. Exp. Bot. 2013, 64, 4361–4374. [Google Scholar] [CrossRef]
  29. Van Leene, J.; Han, C.; Gadeyne, A.; Eeckhout, D.; Matthijs, C.; Cannoot, B.; De Winne, N.; Persiau, G.; Van De Slijke, E.; Van de Cotte, B.; et al. Capturing the phosphorylation and protein interaction landscape of the plant TOR kinase. Nat. Plants 2019, 5, 316–327. [Google Scholar] [CrossRef]
  30. Li, L.; Liu, K.H.; Sheen, J. Dynamic Nutrient Signaling Networks in Plants. Annu. Rev. Cell Dev. Biol. 2021, 37, 341–367. [Google Scholar] [CrossRef]
  31. McCready, K.; Spencer, V.; Kim, M. The Importance of TOR Kinase in Plant Development. Front. Plant Sci. 2020, 11, 16. [Google Scholar] [CrossRef] [PubMed] [Green Version]
  32. Fu, L.; Wang, P.; Xiong, Y. Target of Rapamycin Signaling in Plant Stress Responses. Plant Physiol. 2020, 182, 1613–1623. [Google Scholar] [CrossRef]
  33. Song, Y.; Alyafei, M.S.; Masmoudi, K.; Jaleel, A.; Ren, M. Contributions of TOR Signaling on Photosynthesis. Int. J. Mol. Sci. 2021, 22, 8959. [Google Scholar] [CrossRef] [PubMed]
  34. Shemi, A.; Ben-Dor, S.; Vardi, A. Elucidating the composition and conservation of the autophagy pathway in photosynthetic eukaryotes. Autophagy 2015, 11, 701–715. [Google Scholar] [CrossRef]
  35. Pérez-Pérez, M.E.; Couso, I.; Crespo, J.L. The TOR Signaling Network in the Model Unicellular Green Alga Chlamydomonas reinhardtii. Biomolecules 2017, 7, 54. [Google Scholar] [CrossRef]
  36. Mubeen, U.; Jüppner, J.; Alpers, J.; Hincha, D.K.; Giavalisco, P. Target of Rapamycin Inhibition in Chlamydomonas reinhardtii Triggers de Novo Amino Acid Synthesis by Enhancing Nitrogen Assimilation. Plant Cell 2018, 30, 2240–2254. [Google Scholar] [CrossRef]
  37. Jüppner, J.; Mubeen, U.; Leisse, A.; Caldana, C.; Wiszniewski, A.; Steinhauser, D.; Giavalisco, P. The target of rapamycin kinase affects biomass accumulation and cell cycle progression by altering carbon/nitrogen balance in synchronized Chlamydomonas reinhardtii cells. Plant J. 2018, 93, 355–376. [Google Scholar] [CrossRef]
  38. Werth, E.G.; McConnell, E.W.; Couso Lianez, I.; Perrine, Z.; Crespo, J.L.; Umen, J.G.; Hicks, L.M. Investigating the effect of target of rapamycin kinase inhibition on the Chlamydomonas reinhardtii phosphoproteome: From known homologs to new targets. New Phytol. 2019, 221, 247–260. [Google Scholar] [CrossRef]
  39. Benjamin, D.; Colombi, M.; Moroni, C.; Hall, M.N. Rapamycin passes the torch: A new generation of mTOR inhibitors. Nat Rev Drug Discov. 2011, 10, 868–880. [Google Scholar] [CrossRef]
  40. Choi, J.; Chen, J.; Schreiber, S.L.; Clardy, J. Structure of the FKBP12-rapamycin complex interacting with the binding domain of human FRAP. Science 1996, 273, 239–242. [Google Scholar] [CrossRef]
  41. Kaiser, E.; Correa Galvis, V.; Armbruster, U. Efficient photosynthesis in dynamic light environments: A chloroplast’s perspective. Biochem. J. 2019, 476, 2725–2741. [Google Scholar] [CrossRef] [PubMed] [Green Version]
  42. Dong, P.; Xiong, F.; Que, Y.; Wang, K.; Yu, L.; Li, Z.; Ren, M. Expression profiling and functional analysis reveals that TOR is a key player in regulating photosynthesis and phytohormone signaling pathways in Arabidopsis. Front. Plant Sci. 2015, 6, 677. [Google Scholar] [CrossRef] [PubMed]
  43. Brunkard, J.O. Exaptive Evolution of Target of Rapamycin Signaling in Multicellular Eukaryotes. Dev. Cell 2020, 54, 142–155. [Google Scholar] [CrossRef] [PubMed]
  44. Saba, J.A.; Liakath-Ali, K.; Green, R.; Watt, F.M. Translational control of stem cell function. Nat. Rev. Mol. Cell Biol. 2021, 22, 671–690. [Google Scholar] [CrossRef]
  45. Mak, T.; Jones, A.W.; Nurse, P. The TOR-dependent phosphoproteome and regulation of cellular protein synthesis. Embo J. 2021, 40, e107911. [Google Scholar] [CrossRef]
  46. Ganley, I.G.; Lam du, H.; Wang, J.; Ding, X.; Chen, S.; Jiang, X. ULK1.ATG13.FIP200 complex mediates mTOR signaling and is essential for autophagy. J. Biol. Chem. 2009, 284, 12297–12305. [Google Scholar] [CrossRef]
  47. Kim, J.; Kundu, M.; Viollet, B.; Guan, K.L. AMPK and mTOR regulate autophagy through direct phosphorylation of Ulk1. Nat. Cell Biol. 2011, 13, 132–141. [Google Scholar] [CrossRef]
  48. Pu, Y.; Luo, X.; Bassham, D.C. TOR-Dependent and -Independent Pathways Regulate Autophagy in Arabidopsis thaliana. Front. Plant Sci. 2017, 8, 1204. [Google Scholar] [CrossRef]
  49. Cappadocia, L.; Lima, C.D. Ubiquitin-like Protein Conjugation: Structures, Chemistry, and Mechanism. Chem. Rev. 2018, 118, 889–918. [Google Scholar] [CrossRef]
  50. Mehrtash, A.B.; Hochstrasser, M. Ubiquitin-dependent protein degradation at the endoplasmic reticulum and nuclear envelope. Semin. Cell Dev. Biol. 2019, 93, 111–124. [Google Scholar] [CrossRef]
  51. Yuan, H.X.; Xiong, Y.; Guan, K.L. Nutrient sensing, metabolism, and cell growth control. Mol. Cell 2013, 49, 379–387. [Google Scholar] [CrossRef] [PubMed] [Green Version]
  52. Baslam, M.; Mitsui, T.; Sueyoshi, K.; Ohyama, T. Recent Advances in Carbon and Nitrogen Metabolism in C3 Plants. Int. J. Mol. Sci. 2020, 22, 318. [Google Scholar] [CrossRef] [PubMed]
  53. Caldana, C.; Li, Y.; Leisse, A.; Zhang, Y.; Bartholomaeus, L.; Fernie, A.R.; Willmitzer, L.; Giavalisco, P. Systemic analysis of inducible target of rapamycin mutants reveal a general metabolic switch controlling growth in Arabidopsis thaliana. Plant J. 2013, 73, 897–909. [Google Scholar] [CrossRef] [PubMed]
  54. Pérez-Pérez, M.E.; Florencio, F.J.; Crespo, J.L. Inhibition of target of rapamycin signaling and stress activate autophagy in Chlamydomonas reinhardtii. Plant Physiol. 2010, 152, 1874–1888. [Google Scholar] [CrossRef]
  55. Martin, W.F.; Bryant, D.A.; Beatty, J.T. A physiological perspective on the origin and evolution of photosynthesis. FEMS Microbiol. Rev. 2018, 42, 205–231. [Google Scholar] [CrossRef]
  56. Stirbet, A.; Lazár, D.; Guo, Y.; Govindjee, G. Photosynthesis: Basics, history and modelling. Ann. Bot. 2020, 126, 511–537. [Google Scholar] [CrossRef]
  57. Li, L.; Song, Y.; Wang, K.; Dong, P.; Zhang, X.; Li, F.; Li, Z.; Ren, M. TOR-inhibitor insensitive-1 (TRIN1) regulates cotyledons greening in Arabidopsis. Front. Plant Sci. 2015, 6, 861. [Google Scholar] [CrossRef]
  58. Mallén-Ponce, M.J.; Pérez-Pérez, M.E.; Crespo, J.L. Photosynthetic assimilation of CO2 regulates TOR activity. Proc. Natl. Acad. Sci. USA 2022, 119, e2115261119. [Google Scholar] [CrossRef]
  59. Vierstra, R.D. The ubiquitin-26S proteasome system at the nexus of plant biology. Nat. Rev. Mol. Cell Bio.l 2009, 10, 385–397. [Google Scholar] [CrossRef]
  60. Siva Sankar, D.; Dengjel, J. Protein complexes and neighborhoods driving autophagy. Autophagy 2021, 17, 2689–2705. [Google Scholar] [CrossRef]
  61. Grabherr, M.G.; Haas, B.J.; Yassour, M.; Levin, J.Z.; Thompson, D.A.; Amit, I.; Adiconis, X.; Fan, L.; Raychowdhury, R.; Zeng, Q.; et al. Full-length transcriptome assembly from RNA-Seq data without a reference genome. Nat. Biotechnol. 2011, 29, 644–652. [Google Scholar] [CrossRef] [Green Version]
  62. Buchfink, B.; Xie, C.; Huson, D.H. Fast and sensitive protein alignment using DIAMOND. Nat. Methods 2015, 12, 59–60. [Google Scholar] [CrossRef]
  63. Love, M.I.; Huber, W.; Anders, S. Moderated estimation of fold change and dispersion for RNA-seq data with DESeq2. Genome Biol. 2014, 15, 550. [Google Scholar] [CrossRef]
  64. Mao, X.; Cai, T.; Olyarchuk, J.G.; Wei, L. Automated genome annotation and pathway identification using the KEGG Orthology (KO) as a controlled vocabulary. Bioinformatics 2005, 21, 3787–3793. [Google Scholar] [CrossRef]
  65. Young, M.D.; Wakefield, M.J.; Smyth, G.K.; Oshlack, A. Gene ontology analysis for RNA-seq: Accounting for selection bias. Genome Biol. 2010, 11, R14. [Google Scholar] [CrossRef] [PubMed] [Green Version]
Figure 1. A structure and sequence analysis of ApTOR. (A) An analysis of the conserved domains of ApTOR protein and homologs from other species. The number denotes the identity (%) of ApTOR domain with homologs from other species. Chlamydomonas reinhardtii (Cr) (Chlorophyta), Arabidopsis thaliana (At) (Plantae, Magnoliophyta), Homo sapiens (Hs) (Animalia, Chordata), Saccharomyces cerevisiae (Sc) (Fungi, Ascomycota), Phaeodactylum tricornutum (Pt) (Bacillariophyta), Thalassiosira pseudonana (Tp) (Bacillariophyta). (B) The phylogenetic tree of ApTOR protein and homologs from other species. The phylogenetic tree was constructed by MEGA 4 software using the Neighbor-Joining method. Numbers represent bootstrap percentages (1000 of bootstrap replicates). (C) Sequence alignment of the catalytic domains of ApTOR protein and homologs from other species. Red represents identical amino acid sequences, and blue represents more than 75% identical amino acid sequences.
Ijms 23 11309 g001
Figure 2. Auxenochlorella pyrenoidosa is resistant to rapamycin. (A) The phenotype of A. pyrenoidosa treated with different concentrations of rapamycin for 0, 2, 4, and 6 days. The numbers denote the corresponding OD680nm values. (B) The phylogenetic tree of ApFKBP12 protein and homologs from other species. Phylogenetic tree was constructed by MEGA 4 software using the Neighbor-Joining method. Numbers represent bootstrap percentages (1000 of bootstrap replicates). Schizosaccharomyces pombe (Sp) (Fungi, Ascomycota), Oryza sativa (Os) (Plantae, Tracheophyta), Solanum tuberosum (St) (Plantae, Tracheophyta). (C) Sequence alignment of the ApFKBP12 protein and homologs from other species. The red rectangle denotes the amino acid required for FKBP12 binding to rapamycin. (D) Sequence alignment of the FRB domains of the ApTOR protein and homologs from other species. The red rectangle denotes the amino acid required for the FRB domain binding to rapamycin.
Ijms 23 11309 g002
Figure 3. The effects of TOR protein inhibitors on the growth of Auxenochlorella pyrenoidosa. (A) AZD8055 inhibits the growth of A. pyrenoidosa in a dose-dependent manner. (B) Change curves of OD680nm values of A. pyrenoidosa treated with 1, 5 and 10 μM AZD8055 for 0, 2, 4 and 6 days. (C) Phenotype of A. pyrenoidosa treated with 1, 5 and 10 μM KU0063794 for 0, 2, 4, and 6 days. (D) Change curves of OD680nm values as described in (C). (E) Phenotype of A. pyrenoidosa treated with 1, 10, 20 μM Torin1 for 0, 2, 4, and 6 days. (F) Change curves of OD680nm values as described in (E).
Ijms 23 11309 g003
Figure 4. TOR regulates the biosynthesis of major intracellular substances in Auxenochlorella pyrenoidosa. (A) Phenotypes of A. pyrenoidosa treated with AZD8055 for 0, 12, 24, 36, and 48 h. A. a pyrenoidosa was cultured in 50 mL BG11 liquid medium for 4 days. Then, final-concentration 5 μM AZD8055 or equivalent DMSO was added into the alga solution for 0, 12, 24, 36, and 48 h. (B) Change curves of OD680nm values of A. pyrenoidosa treated with 5 μM AZD8055 for 0, 12, 24, 36, and 48 h. (C) Total chlorophyll content of A. pyrenoidosa treated with 5 μM AZD8055 for 0, 12, 24, 36, and 48 h. (D) Protein content of A. pyrenoidosa treated with 5 μM AZD8055 for 0, 12, 24, 36, and 48 h. (E) Starch content of A. pyrenoidosa treated with 5 μM AZD8055 for 0, 12, 24, 36, and 48 h. Fresh weight of A. pyrenoidosa was used to measure chlorophyll, protein and starch contents, respectively. The data represents the mean ± SD of n = 3 independent experiments. Asterisks denote Student’s t-test significant difference compared with DMSO (* p < 0.05; ** p < 0.01).
Ijms 23 11309 g004
Figure 5. The transcriptome data analysis of AZD8055-treated Auxenochlorella pyrenoidosa. (A) Number of up- and down-regulated DEGs between AZD8055 and DMSO treatment. (B) Cluster analysis of DEGs between AZD8055 and DMSO treatment. The color represents the FPKM value of the gene by Z-score. Red denotes high gene expression and green denotes low gene expression. (C) The top 20 enriched gene ontology in down-regulated DEGs. (D) The top 20 enriched gene ontology in up-regulated DEGs. (E) The top 20 enriched KEGG pathways in down-regulated DEGs. (F) The top 20 enriched KEGG pathways in up-regulated DEGs.
Ijms 23 11309 g005
Table 1. The putative components of TOR signaling pathway in Auxenochlorella pyrenoidosa.
Protein NameChlamydomonas reinhardtiiAuxenochlorella pyrenoidosaIdentity (%)
Target of rapamycin (TOR)CrTORApTOR like58
Regulatory associate protein of TOR (RAPTOR)CrRAPTORApRAPTOR like37
Lethal with SEC-13 protein 8 (LST8)CrLST8ApLST8 like81
FK506-binding protein 12 kDa (FKBP12)CrFKBP12ApFKBP12 like43
Ribosomal protein S6 kinase (S6K)CrS6KApS6K like45
Ribosome protein small subunit 6 (RPS6)CrRPS6ApRPS6 like78
Transcription factor E2F alpha (E2FA)CrE2FAApE2FA like39
Translation initiation factor 2 alpha subunit (eIF2α)CreIF2αApeIF2α like72
Type 2A phosphatase associated protein 46 (TAP46)CrTAP46ApTAP46 like40
Autophagy protein 1 (ATG1)CrATG1ApATG1 like39
Autophagy protein 13 (ATG13)CrATG13ApATG13 like32
Table 2. Differentially expressed genes in the photosynthetic process.
Gene IDLog2 (Fold Change)P-adjKO NameKO Description
Photosynthesis
Cluster-495.6756−5.9733 5.56 × 10−90PETEPlastocyanin
Cluster-498.0−5.6390 3.47 × 10⁻⁵PSBEPhotosystem II cytochrome b559 subunit α
Cluster-495.7678−5.6230 6.53 × 10−124PSANPhotosystem I subunit psan
Cluster-495.7002−5.4544 9.90 × 10−104PSAHPhotosystem I subunit VI
Cluster-495.6324−5.3253 2.42 × 10−70PSBPPhotosystem II oxygen-evolving enhancer 2
Cluster-495.8198−5.2049 9.45 × 10⁻³ATPF0BF-type H+ transporting ATPase subunit b
Cluster-495.827−4.6442 6.89 × 10⁻⁴PETAApocytochrome f
Cluster-495.10228−4.6211 4.34 × 10⁻²PSBJPhotosystem II psbj protein
Cluster-495.5726−4.0208 1.05 × 10⁻³¹PSBSPhotosystem II 22kda protein
Cluster-495.5249−4.0063 1.02 × 10−46PSB27Photosystem II Psb27 protein
Cluster-495.4105−3.9952 2.49 × 10⁻²ATPF1AF-type H+-transporting atpase subunit alpha
Cluster-495.6958−3.8390 5.22 × 10−43PSAFPhotosystem I subunit III
Cluster-495.7332−3.7857 2.68 × 10⁻³PSBCPhotosystem II CP43 chlorophyll apoprotein
Cluster-495.6505−3.4964 1.36 × 10⁻²⁸PSAKPhotosystem I subunit X
Cluster-495.6979−3.3834 1.87 × 10⁻²³PSBRPhotosystem II 10kda protein
Cluster-495.8002−3.2884 4.79 × 10⁻⁶ATPF1BF-type H+-transporting atpase subunit beta
Cluster-495.6124−3.1305 3.85 × 10⁻³PETBCytochrome b6
Cluster-495.7894−3.0592 3.40 × 10⁻¹⁷PSABPhotosystem I P700 chlorophyll a apoprotein
Cluster-495.1037−2.9414 3.35 × 10⁻²⁰PSBPPhotosystem II oxygen-evolving enhancer 2
Cluster-495.4143−2.8547 8.51 × 10−45PSADPhotosystem I subunit II
Cluster-495.6035−2.8402 3.44 × 10−36PSALPhotosystem I subunit XI
Cluster-495.4194−2.7017 7.15 × 10⁻¹⁸PSAOPhotosystem I subunit psao
Cluster-495.4418−2.3110 2.12 × 10⁻²¹PSAGPhotosystem I subunit V
Cluster-495.5609−2.2904 4.52 × 10⁻¹⁸PSBOPhotosystem II oxygen-evolving enhancer 1
Cluster-495.4835−1.7041 5.65 × 10⁻¹²PETJCytochrome c6
Cluster-495.6263−1.5457 9.25 × 10⁻¹³PETHFerredoxin--NADP+ reductase
Cluster-495.7190−1.4895 5.90 × 10⁻¹¹PSBYPhotosystem II psby protein
Cluster-495.4933−1.2359 4.99 × 10⁻⁸PSB28Photosystem II 13kda protein
Cluster-495.78711.1214 1.83 × 10⁻⁵PETFFerredoxin
Photosynthesis-antenna proteins
Cluster-495.6691−7.0421 1.03 × 10−108LHCA4Photosystem I chlorophyll a/b binding protein 4
Cluster-495.3640−5.9832 4.43 × 10−122LHCA3Photosystem I chlorophyll a/b binding protein 3
Cluster-495.6564−5.2717 1.81 × 10−78LHCA1Photosystem I chlorophyll a/b binding protein 1
Cluster-495.5144−4.5671 6.62 × 10−78LHCB4Photosystem II chlorophyll a/b binding protein 4
Cluster-495.6386−4.1987 1.03 × 10−51LHCB1Photosystem II chlorophyll a/b binding protein 1
Cluster-495.5553−3.9840 1.96 × 10−76LHCA4Photosystem I chlorophyll a/b binding protein 4
Cluster-495.6485−3.9329 1.45 × 10−40LHCB5Photosystem II chlorophyll a/b binding protein 5
Cluster-495.6349−3.4326 3.63 × 10⁻³³LHCB1Photosystem II chlorophyll a/b binding protein 1
Cluster-495.8808−2.5721 2.26 × 10⁻²LHCB2Photosystem II chlorophyll a/b binding protein 2
Carbon fixation in photosynthetic organisms
Cluster-495.5099−5.0936 5.78 × 10−121PGKPhosphoglycerate kinase
Cluster-495.2276−4.3041 1.39 × 10−43ALDOFructose-bisphosphate aldolase, class I
Cluster-495.7895−4.0597 1.13 × 10⁻⁹GOT2Aspartate aminotransferase
Cluster-495.2903−3.5833 1.72 × 10−36MDH2Malate dehydrogenase
Cluster-495.5815−3.0446 6.82 × 10−42PRKBPhosphoribulokinase
Cluster-495.5677−2.9728 3.99 × 10⁻²⁹PPDKPyruvate, orthophosphate dikinase
Cluster-495.5005−2.8583 3.63 × 10−42TPITriosephosphate isomerase (TIM)
Cluster-495.5217−2.7963 1.37 × 10⁻²⁹ALDOFructose-bisphosphate aldolase, class I
Cluster-495.4546−2.7251 3.02 × 10−38TPITriosephosphate isomerase (TIM)
Cluster-495.5985−2.5229 6.25 × 10−42MDH1Malate dehydrogenase
Cluster-495.3332−2.5073 2.29 × 10⁻¹⁹RPIARibose 5-phosphate isomerase A
Cluster-495.1259−2.5056 8.33 × 10⁻⁶PCKAPhosphoenolpyruvate carboxykinase
Cluster-495.4145−1.8990 6.39 × 10⁻¹⁶MDH2Malate dehydrogenase
Cluster-495.4967−1.7549 3.89 × 10⁻¹¹MAEBMalate dehydrogenase (NADP+)
Cluster-495.3492−1.6252 7.78 × 10⁻⁷MAEBMalate dehydrogenase (NADP+)
Cluster-495.5038−1.6083 3.40 × 10⁻¹⁷TKTATransketolase
Cluster-495.6521−1.6040 1.68 × 10⁻¹⁴GAPDHGlyceraldehyde-3-phosphate dehydrogenase
Cluster-495.6227−1.2768 9.08 × 10⁻⁹GAPDHGlyceraldehyde 3-phosphate dehydrogenase
Cluster-495.3372−1.1984 1.25 × 10⁻⁴PPCPhosphoenolpyruvate carboxylase
Cluster-495.5601−1.0961 2.63 × 10⁻⁹E3.1.3.37Sedoheptulose-bisphosphatase
Cluster-495.2869−1.0914 3.29 × 10⁻⁷FBPFructose-1,6-bisphosphatase I
Cluster-495.6190−1.0435 5.51 × 10⁻⁵GAPDHGlyceraldehyde 3-phosphate dehydrogenase
Cluster-495.52071.1296 7.49 × 10⁻⁷E1.1.1.39Malate dehydrogenase (decarboxylating)
Cluster-495.72151.4168 6.87 × 10⁻⁸GGATGlutamate-glyoxylate aminotransferase
Table 3. Differentially expressed genes in protein catabolism.
Gene IDLog2 (Fold Change)P-adjKO NameKO Description
Regulation of autophagy
Cluster-495.1651.6278 3.68 × 10⁻²SnRK1αSNF1-related protein kinase 1 α subunit
Cluster-495.64891.5520 9.00 × 10⁻¹³ATG7Autophagy-related protein 7
Cluster-495.45831.3266 5.06 × 10⁻⁵ATG3Autophagy-related protein 3
Cluster-495.75071.2287 1.39 × 10⁻⁶ATG16L1Autophagy-related protein 16-1
Cluster-495.68221.1679 3.45 × 10⁻⁶SnRK1αSNF1-related protein kinase 1 α subunit
Cluster-495.78771.15331.91 × 10−7ATG101Autophagy-related protein 101
Cluster-495.47051.0000 4.53 × 10⁻⁶ATG11Autophagy-related protein 11
Cluster-495.2673−1.6051 8.07 × 10⁻⁶ATG12Autophagy-related protein 12
Ubiquitin mediated proteolysis
Cluster-495.54692.9686 4.17 × 10⁻²¹UBLE1BUbiquitin-like 1-activating enzyme E1 B
Cluster-495.38042.7399 2.91 × 10−53UBE2AUbiquitin-conjugating enzyme E2 A
Cluster-495.45162.3622 8.08 × 10⁻²⁶ERCC8DNA excision repair protein ERCC8
Cluster-495.42581.7941 1.47 × 10⁻¹³CDH1Cell division cycle 20-like protein 1
Cluster-495.32831.7552 2.29 × 10⁻¹⁹CUL3Cullin 3
Cluster-495.55961.7515 2.80 × 10⁻²UBLE1BUbiquitin-like 1-activating enzyme E1 B
Cluster-495.80381.4688 1.57 × 10⁻¹⁶CUL1Cullin 1
Cluster-495.42751.4562 6.98 × 10⁻¹¹SKP1S-phase kinase-associated protein 1
Cluster-495.65971.4529 1.99 × 10⁻⁶UBE2EUbiquitin-conjugating enzyme E2 E
Cluster-495.45731.2755 1.57 × 10⁻⁹UBE1Ubiquitin-activating enzyme E1
Cluster-495.46111.2633 8.88 × 10⁻⁹CUL4Cullin 4
Cluster-495.29511.1905 1.28 × 10⁻⁸UBE1CUbiquitin-activating enzyme E1 C
Cluster-495.84661.1285 6.54 × 10−4RBX1RING-box protein 1
Cluster-495.18241.0291 3.12 × 10⁻⁵PPIL2Peptidyl-prolyl cis-trans isomerase-like 2
Cluster-495.41931.0217 1.66 × 10−3RBX1RING-box protein 1
Cluster-495.1695−1.1161 1.39 × 10⁻³FANCLE3 ubiquitin-protein ligase FANCL
Cluster-495.1057−1.2830 1.16 × 10⁻⁴UBE3AUbiquitin-protein ligase E3 A
Cluster-495.7130−1.6390 1.07 × 10⁻¹⁰UBLE1AUbiquitin-like 1-activating enzyme E1 A
Cluster-495.9644−1.7193 5.31 × 10⁻³UBE2SUbiquitin-conjugating enzyme E2 S
Table 4. Differentially expressed genes in the TCA cycle.
Gene IDLog2 (Fold Change)P-adjKO NameKO Description
Cluster-495.2903−3.58331.72 × 10−36MDH2Malate dehydrogenase
Cluster-495.5985−2.52296.25 × 10−42MDH1Malate dehydrogenase
Cluster-495.1259−2.50568.33 × 10−6PCKAPhosphoenolpyruvate carboxykinase
Cluster-495.4145−1.89906.39 × 10−16MDH2Malate dehydrogenase
Cluster-495.5734−1.60825.41 × 10−16LSC1Succinyl-CoA synthetase alpha subunit
Cluster-495.5974−1.58143.82 × 10−15ACOAconitate hydratase
Cluster-495.4348−1.46803.68 × 10−8PDHDDihydrolipoamide dehydrogenase
Cluster-495.4853−1.29931.45 × 10−10DLSTα-oxoglutarate dehydrogenase E2
Cluster-495.6949−1.27201.91 × 10−5PDHCPyruvate dehydrogenase E2
Cluster-495.6523−1.25877.65 × 10−7FUMCFumarate hydratase, class II
Cluster-495.5492−1.21872.33 × 10−8IDH1Isocitrate dehydrogenase
Cluster-495.6105−1.20678.64 × 10−11LSC2Succinyl-CoA synthetase beta subunit
Cluster-495.2778−1.13712.54 × 10−6SDHDSuccinate dehydrogenase subunit
Cluster-495.5250−1.12541.39 × 10−6OGDHα-oxoglutarate dehydrogenase E1
Publisher’s Note: MDPI stays neutral with regard to jurisdictional claims in published maps and institutional affiliations.

