
Archaea Microbiome Dysregulated Genes and Pathways as Molecular Targets for Lung Adenocarcinoma and Squamous Cell Carcinoma

 , ,
, ,
Abstract
:
1. Introduction
2. Results
2.1. Microbial Contamination Correction
2.2. Lung Tissue Microbial Landscaping
2.3. LUAD and LUSC Microbiome Clinical Significance
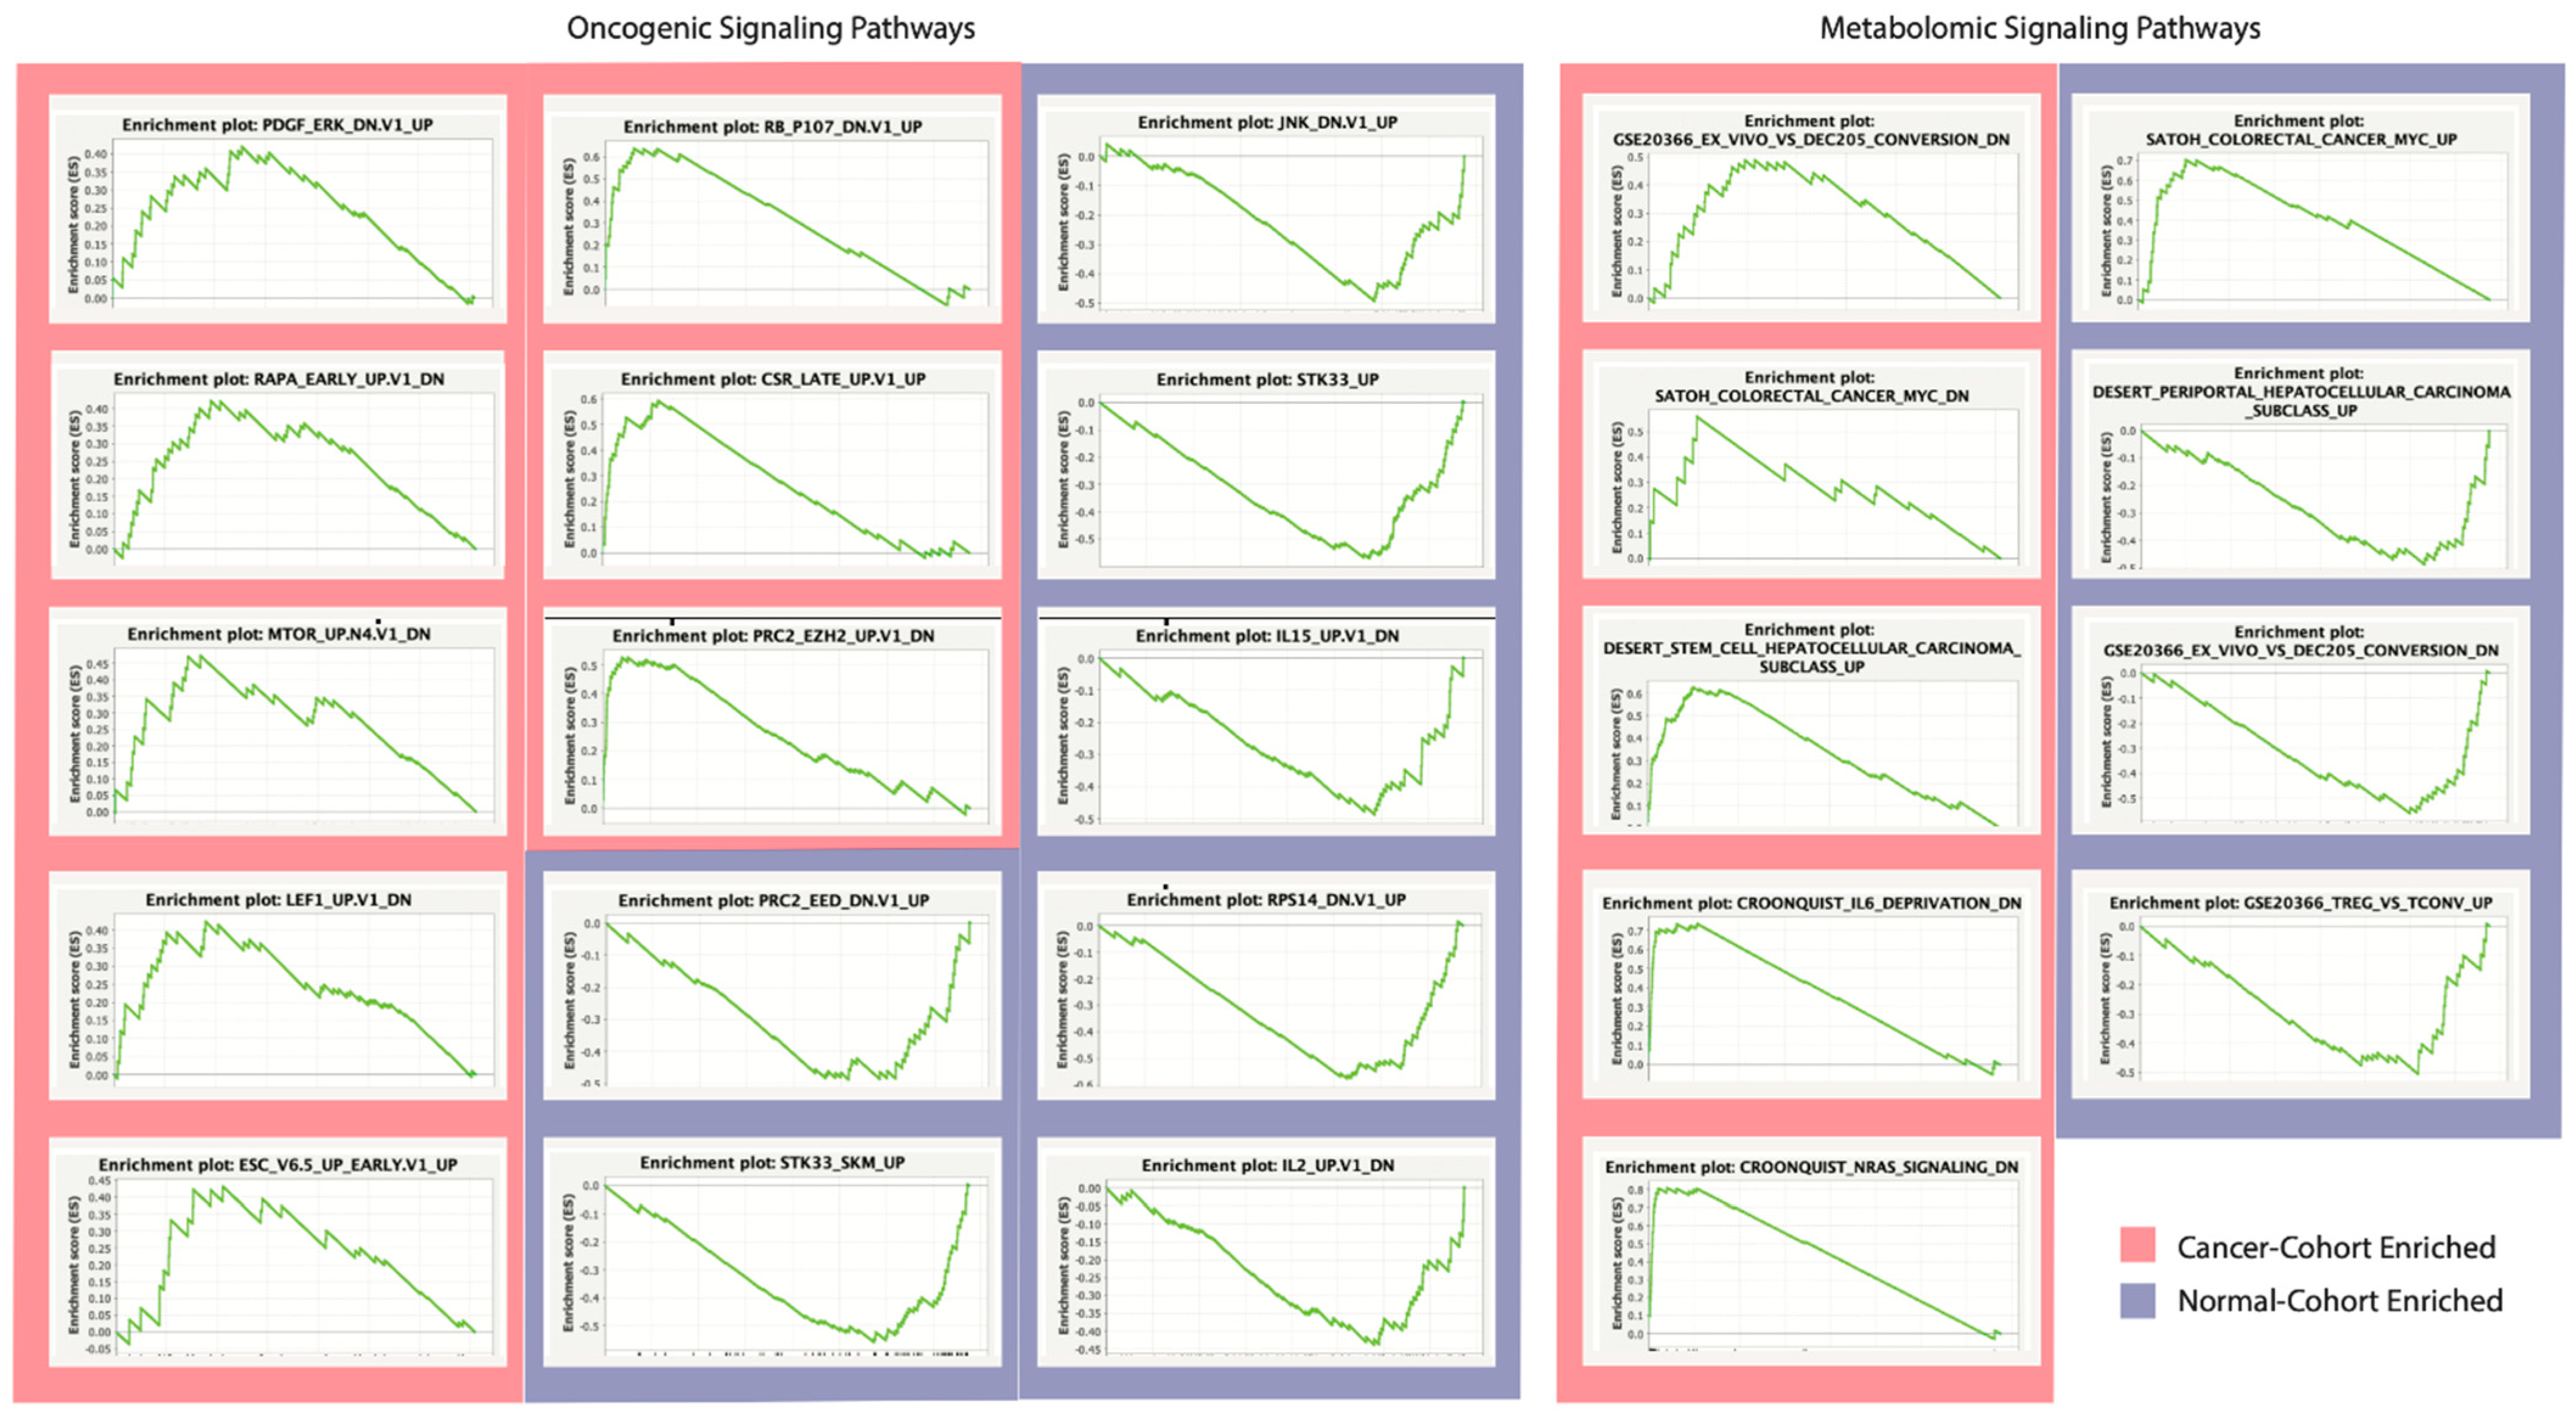
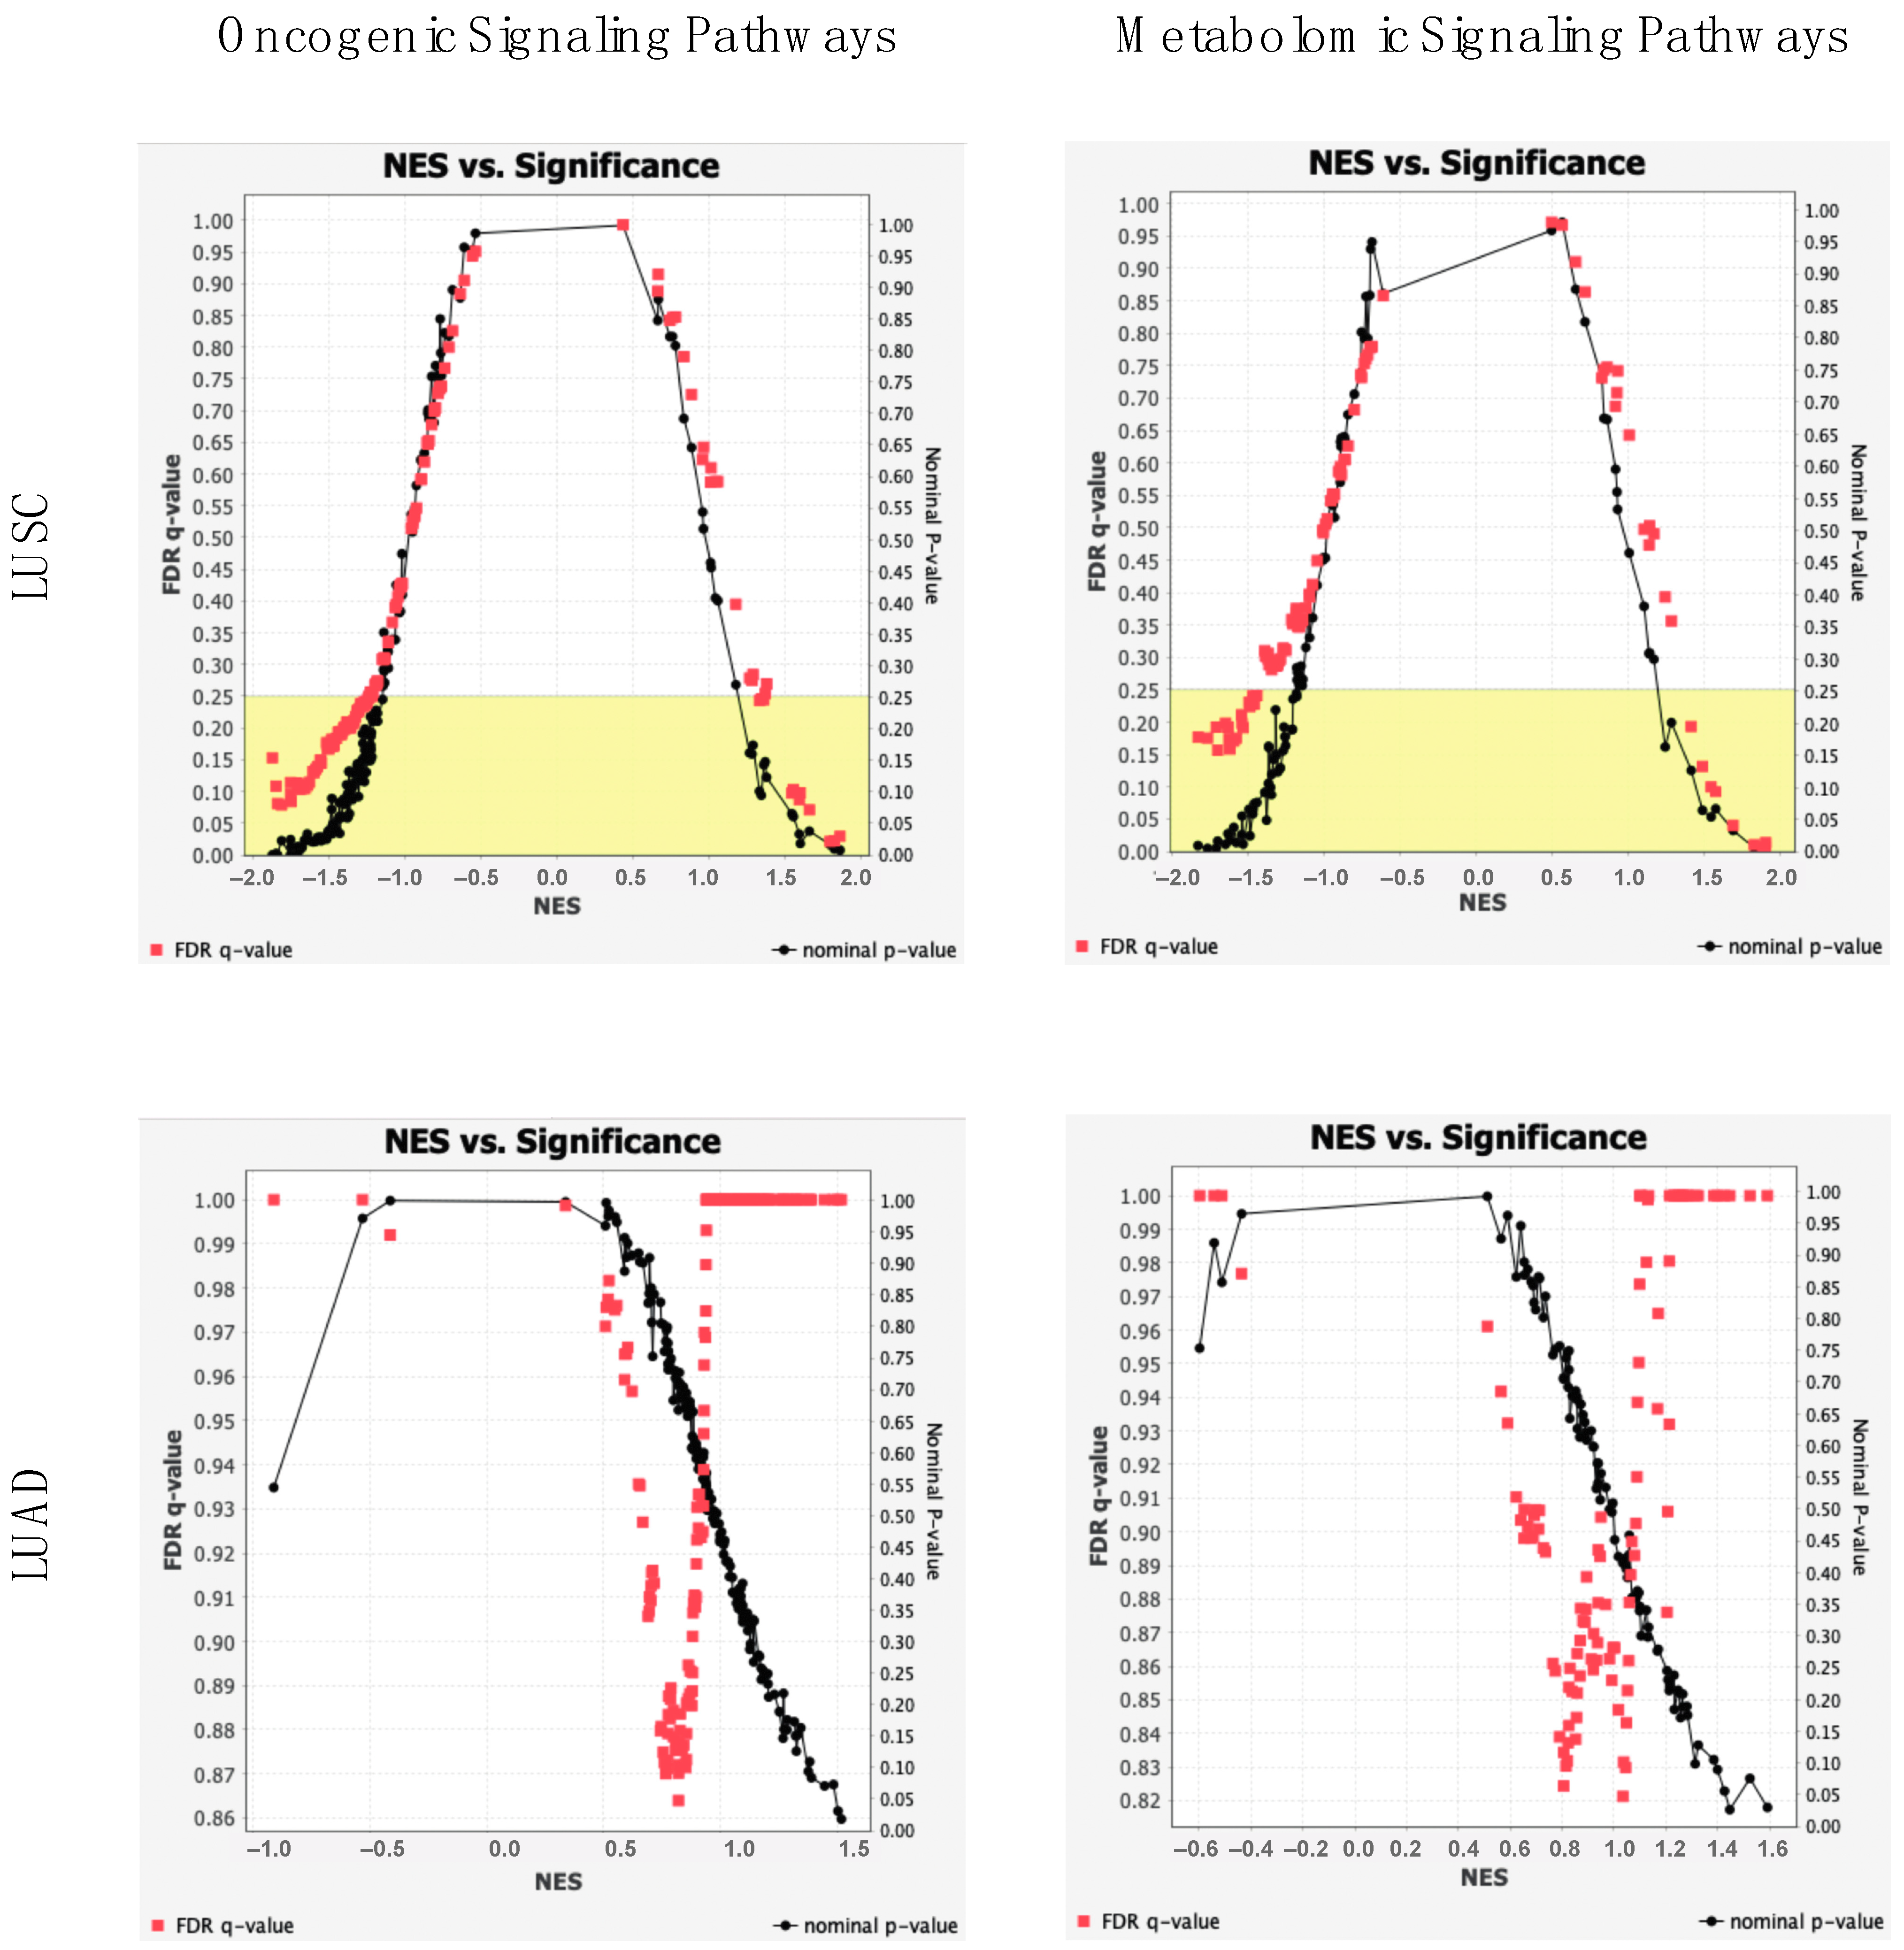
2.4. Oncogenic and Metabolomic Signaling Pathway Dysregulation
2.5. Archaeal Microbiome-Based Machine Learning Algorithm for Clinical Diagnosis
3. Discussion
3.1. Phylogenic Classification
3.2. Molecular Targets
4. Methods
4.1. TCGA Data Acquisition
4.2. Microbial Abundance Extraction and Computation
4.3. Microbial Contamination Correction
4.4. MDS Ordination Application
4.5. β-Diversity Assessment
4.6. Differential Abundance Determination
4.7. Survival Discrepancy Determination
4.8. Supervised Machine Learning Classification
4.9. Gene Set Enrichment Analysis (GSEA)
Supplementary Materials
Author Contributions
Funding
Institutional Review Board Statement
Informed Consent Statement
Data Availability Statement
Conflicts of Interest
References
- Gilbert, J.A.; Blaser, M.J.; Caporaso, J.G.; Jansson, J.K.; Lynch, S.V.; Knight, R. Current understanding of the human microbiome. Nat. Med. 2018, 24, 392–400. [Google Scholar] [CrossRef] [PubMed]
- Rajagopala, S.V.; Vashee, S.; Oldfield, L.M.; Suzuki, Y.; Venter, J.C.; Telenti, A.; Nelson, K.E. The Human Microbiome and Cancer. Cancer Prev. Res. 2017, 10, 226–234. [Google Scholar] [CrossRef] [PubMed]
- Wong-Rolle, A.; Wei, H.K.; Zhao, C.; Jin, C. Unexpected guests in the tumor microenvironment: Microbiome in cancer. Protein Cell 2021, 12, 426–435. [Google Scholar] [CrossRef]
- Elinav, E.; Garrett, W.S.; Trinchieri, G.; Wargo, J. The cancer microbiome. Nat. Rev. Cancer 2019, 19, 371–376. [Google Scholar] [CrossRef] [PubMed]
- Lü, J.M.; Lin, P.H.; Yao, Q.; Chen, C. Chemical and molecular mechanisms of antioxidants: Experimental approaches and model systems. J. Cell. Mol. Med. 2010, 14, 840–860. [Google Scholar] [CrossRef]
- Poljsak, B. Strategies for reducing or preventing the generation of oxidative stress. Oxidative Med. Cell. Longev. 2011, 2011, 194586. [Google Scholar] [CrossRef]
- Fang, Y.; Yan, C.; Zhao, Q.; Xu, J.; Liu, Z.; Gao, J.; Zhu, H.; Dai, Z.; Wang, D.; Tang, D. The roles of microbial products in the development of colorectal cancer: A review. Bioengineered 2021, 12, 720–735. [Google Scholar] [CrossRef] [PubMed]
- Nasr, R.; Shamseddine, A.; Mukherji, D.; Nassar, F.; Temraz, S. The Crosstalk between Microbiome and Immune Response in Gastric Cancer. Int. J. Mol. Sci. 2020, 21, 6586. [Google Scholar] [CrossRef]
- Dong, Q.; Chen, E.S.; Zhao, C.; Jin, C. Host-Microbiome Interaction in Lung Cancer. Front. Immunol. 2021, 12, 679829. [Google Scholar] [CrossRef]
- Poore, G.D.; Kopylova, E.; Zhu, Q.; Carpenter, C.; Fraraccio, S.; Wandro, S.; Kosciolek, T.; Janssen, S.; Metcalf, J.; Song, S.J.; et al. Microbiome analyses of blood and tissues suggest cancer diagnostic approach. Nature 2020, 579, 567–574. [Google Scholar] [CrossRef]
- Bang, C.; Schmitz, R.A. Archaea associated with human surfaces: Not to be underestimated. FEMS Microbiol. Rev. 2015, 39, 631–648. [Google Scholar] [CrossRef] [PubMed]
- Baker, B.J.; De Anda, V.; Seitz, K.W.; Dombrowski, N.; Santoro, A.E.; Lloyd, K.G. Diversity, ecology and evolution of Archaea. Nat. Microbiol. 2020, 5, 887–900. [Google Scholar] [CrossRef] [PubMed]
- Koskinen, K.; Pausan, M.R.; Perras, A.K.; Beck, M.; Bang, C.; Mora, M.; Schilhabel, A.; Schmitz, R.; Moissl-Eichinger, C. First Insights into the Diverse Human Archaeome: Specific Detection of Archaea in the Gastrointestinal Tract, Lung, and Nose and on Skin. mBio 2017, 8, e00824-17. [Google Scholar] [CrossRef]
- Schabath, M.B.; Cote, M.L. Cancer Progress and Priorities: Lung Cancer. Cancer Epidemiol. Biomark. Prev. 2019, 28, 1563–1579. [Google Scholar] [CrossRef] [PubMed]
- Cancer of the Lung and Bronchus—Cancer Stat Facts. SEER. Available online: https://seer.cancer.gov/statfacts/html/lungb.html (accessed on 2 June 2022).
- Myers, D.J.; Wallen, J.M. Lung Adenocarcinoma. In StatPearls [Internet]; StatPearls Publishing: Treasure Island, FL, USA, 2022. Available online: https://www.ncbi.nlm.nih.gov/books/NBK519578/ (accessed on 10 September 2021).
- Mao, Q.; Jiang, F.; Yin, R.; Wang, J.; Xia, W.; Dong, G.; Ma, W.; Yang, Y.; Xu, L.; Hu, J. Interplay between the lung microbiome and lung cancer. Cancer Lett. 2018, 415, 40–48. [Google Scholar] [CrossRef] [PubMed]
- Sabbula, B.R.; Anjum, F. Squamous Cell Lung Cancer. In StatPearls [Internet]; StatPearls Publishing: Treasure Island, FL, USA, 2022. Available online: https://www.ncbi.nlm.nih.gov/books/NBK564510/ (accessed on 8 December 2021).
- Morton, J.T.; Toran, L.; Edlund, A.; Metcalf, J.L.; Lauber, C.; Knight, R. Uncovering the horseshoe effect in microbial analyses. mSystems 2017, 2, e00166-16. [Google Scholar] [CrossRef]
- Zhang, W.; An, Y.; Qin, X.; Wu, X.; Wang, X.; Hou, H.; Song, X.; Liu, T.; Wang, B.; Huang, X.; et al. Gut Microbiota-Derived Metabolites in Colorectal Cancer: The Bad and the Challenges. Front. Oncol. 2021, 11, 739648. [Google Scholar] [CrossRef]
- Lyu, Z.; Shao, N.; Akinyemi, T.; Whitman, W.B. Methanogenesis. Curr. Biol. 2018, 28, R727–R732. [Google Scholar] [CrossRef]
- Dharmawardana, N.; Goddard, T.; Woods, C.; Watson, D.I.; Butler, R.; Ooi, E.H.; Yazbeck, R. Breath methane to hydrogen ratio as a surrogate marker of intestinal dysbiosis in head and neck cancer. Sci. Rep. 2020, 10, 15010. [Google Scholar] [CrossRef]
- Kulis, M.; Esteller, M. DNA methylation and cancer. Adv. Genet. 2010, 70, 27–56. [Google Scholar] [CrossRef]
- Wajed, S.A.; Laird, P.W.; DeMeester, T.R. DNA methylation: An alternative pathway to cancer. Ann. Surg. 2001, 234, 10–20. [Google Scholar] [CrossRef] [PubMed]
- Siebers, B.; Zaparty, M.; Raddatz, G.; Tjaden, B.; Albers, S.-V.; Bell, S.D.; Blombach, F.; Kletzin, A.; Kyrpides, N.; Lanz, C.; et al. The complete genome sequence of Thermoproteus Tenax: A physiologically versatile member of the crenarchaeota. PLoS ONE 2011, 6, e24222. [Google Scholar] [CrossRef] [PubMed]
- Wu, D.; Li, M.; Tian, W.; Wang, S.; Cui, L.; Li, H.; Wang, H.; Ji, A.; Li, Y. Hydrogen sulfide acts as a double-edged sword in human hepatocellular carcinoma cells through EGFR/ERK/MMP-2 and PTEN/Akt signaling pathways. Sci. Rep. 2017, 7, 5134. [Google Scholar] [CrossRef] [PubMed]
- Brusa, T.; Ferrari, F.; Canzi, E. Methanogenic bacteria: Presence in foodstuffs. J. Basic Microbiol. 1998, 38, 79–84. [Google Scholar] [CrossRef]
- Jakubczyk, K.; Dec, K.; Kałduńska, J.; Kawczuga, D.; Kochman, J.; Janda, K. Reactive oxygen species—Sources, functions, oxidative damage. Pol. Merkur. Lekarski. 2020, 48, 124–127. [Google Scholar]
- Dahl, W.J.; Rivero Mendoza, D.; Lambert, J.M. Diet, nutrients and the microbiome. Prog. Mol. Biol. Transl. Sci. 2020, 171, 237–263. [Google Scholar] [CrossRef]
- Christian, V.J.; Miller, K.R.; Martindale, R.G. Food Insecurity, Malnutrition, and the Microbiome. Curr. Nutr. Rep. 2020, 9, 356–360. [Google Scholar] [CrossRef]
- Roh, S.W.; Kim, K.H.; Nam, Y.D.; Chang, H.W.; Park, E.J.; Bae, J.W. Investigation of archaeal and bacterial diversity in fermented seafood using barcoded pyrosequencing. ISME J. 2010, 4, 700–710. [Google Scholar] [CrossRef]
- Gopalakrishnan, V.; Helmink, B.A.; Spencer, C.N.; Reuben, A.; Wargo, J.A. The Influence of the Gut Microbiome on Cancer, Immunity, and Cancer Immunotherapy. Cancer Cell 2018, 33, 570–580. [Google Scholar] [CrossRef]
- Li, Y.; Zhang, Y.; Wei, K.; He, J.; Ding, N.; Hua, J.; Zhou, T.; Niu, F.; Zhou, G.; Shi, T.; et al. Review: Effect of Gut Microbiota and Its Metabolite SCFAs on Radiation-Induced Intestinal Injury. Front. Cell. Infect. Microbiol. 2021, 11, 577236. [Google Scholar] [CrossRef]
- Anwar, S.; Almatroudi, A.; Alsahli, M.A.; Khan, M.A.; Khan, A.A.; Rahmani, A.H. Natural Products: Implication in Cancer Prevention and Treatment through Modulating Various Biological Activities. Anticancer. Agents Med Chem. 2020, 20, 2025–2040. [Google Scholar] [CrossRef]
- Ford, T.C.; Downey, L.A.; Simpson, T.; McPhee, G.; Oliver, C.; Stough, C. The Effect of a High-Dose Vitamin B Multivitamin Supplement on the Relationship between Brain Metabolism and Blood Biomarkers of Oxidative Stress: A Randomized Control Trial. Nutrients 2018, 10, 1860. [Google Scholar] [CrossRef] [PubMed]
- Slavin, J.L.; Lloyd, B. Health benefits of fruits and vegetables. Adv Nutr. 2012, 3, 506–516. [Google Scholar] [CrossRef]
- Ngoi, N.Y.L.; Eu, J.Q.; Hirpara, J.; Wang, L.; Lim, J.S.J.; Lee, S.C.; Lim, Y.C.; Pervaiz, S.; Goh, B.C.; Wong, A.L.A. Targeting Cell Metabolism as Cancer Therapy. Antioxid Redox Signal. 2020, 32, 285–308. [Google Scholar] [CrossRef] [PubMed]
- Yakar, M.; Etiz, D.; Metintas, M.; Ak, G.; Celik, O. Prediction of Radiation Pneumonitis With Machine Learning in Stage III Lung Cancer: A Pilot Study. Technol. Cancer Res. Treat. 2021, 20, 15330338211016373. [Google Scholar] [CrossRef]
- Ntakolia, C.; Kokkotis, C.; Karlsson, P.; Moustakidis, S. An Explainable Machine Learning Model for Material Backorder Prediction in Inventory Management. Sensors 2021, 21, 7926. [Google Scholar] [CrossRef] [PubMed]
- Nohara, Y.; Matsumoto, K.; Soejima, H.; Nakashima, N. Explanation of machine learning models using shapley additive explanation and application for real data in hospital. Comput. Methods Programs Biomed. 2022, 214, 106584. [Google Scholar] [CrossRef]
- Liberzon, A.; Birger, C.; Thorvaldsdóttir, H.; Ghandi, M.; Mesirov, J.P.; Tamayo, P. The Molecular Signatures Database (MSigDB) hallmark gene set collection. Cell Syst. 2015, 1, 417–425. [Google Scholar] [CrossRef]
- Subramanian, A.; Tamayo, P.; Mootha, V.K.; Mukherjee, S.; Ebert, B.L.; Gillette, M.A.; Paulovich, A.; Pomeroy, S.L.; Golub, T.R.; Lander, E.S.; et al. Gene set enrichment analysis: A knowledge-based approach for interpreting genome-wide expression profiles. Proc. Natl. Acad. Sci. USA 2005, 102, 15545–15550. [Google Scholar] [CrossRef]
- Mootha, V.K.; Lindgren, C.M.; Eriksson, K.F.; Subramanian, A.; Sihag, S.; Lehar, J.; Puigserver, P.; Carlsson, E.; Ridderstråle, M.; Laurila, E.; et al. PGC-1alpha-responsive genes involved in oxidative phosphorylation are coordinately downregulated in human diabetes. Nat. Genet. 2003, 34, 267–273. [Google Scholar] [CrossRef]


| Microbe | LUAD vs. Normal | LUSC vs. Normal |
|---|---|---|
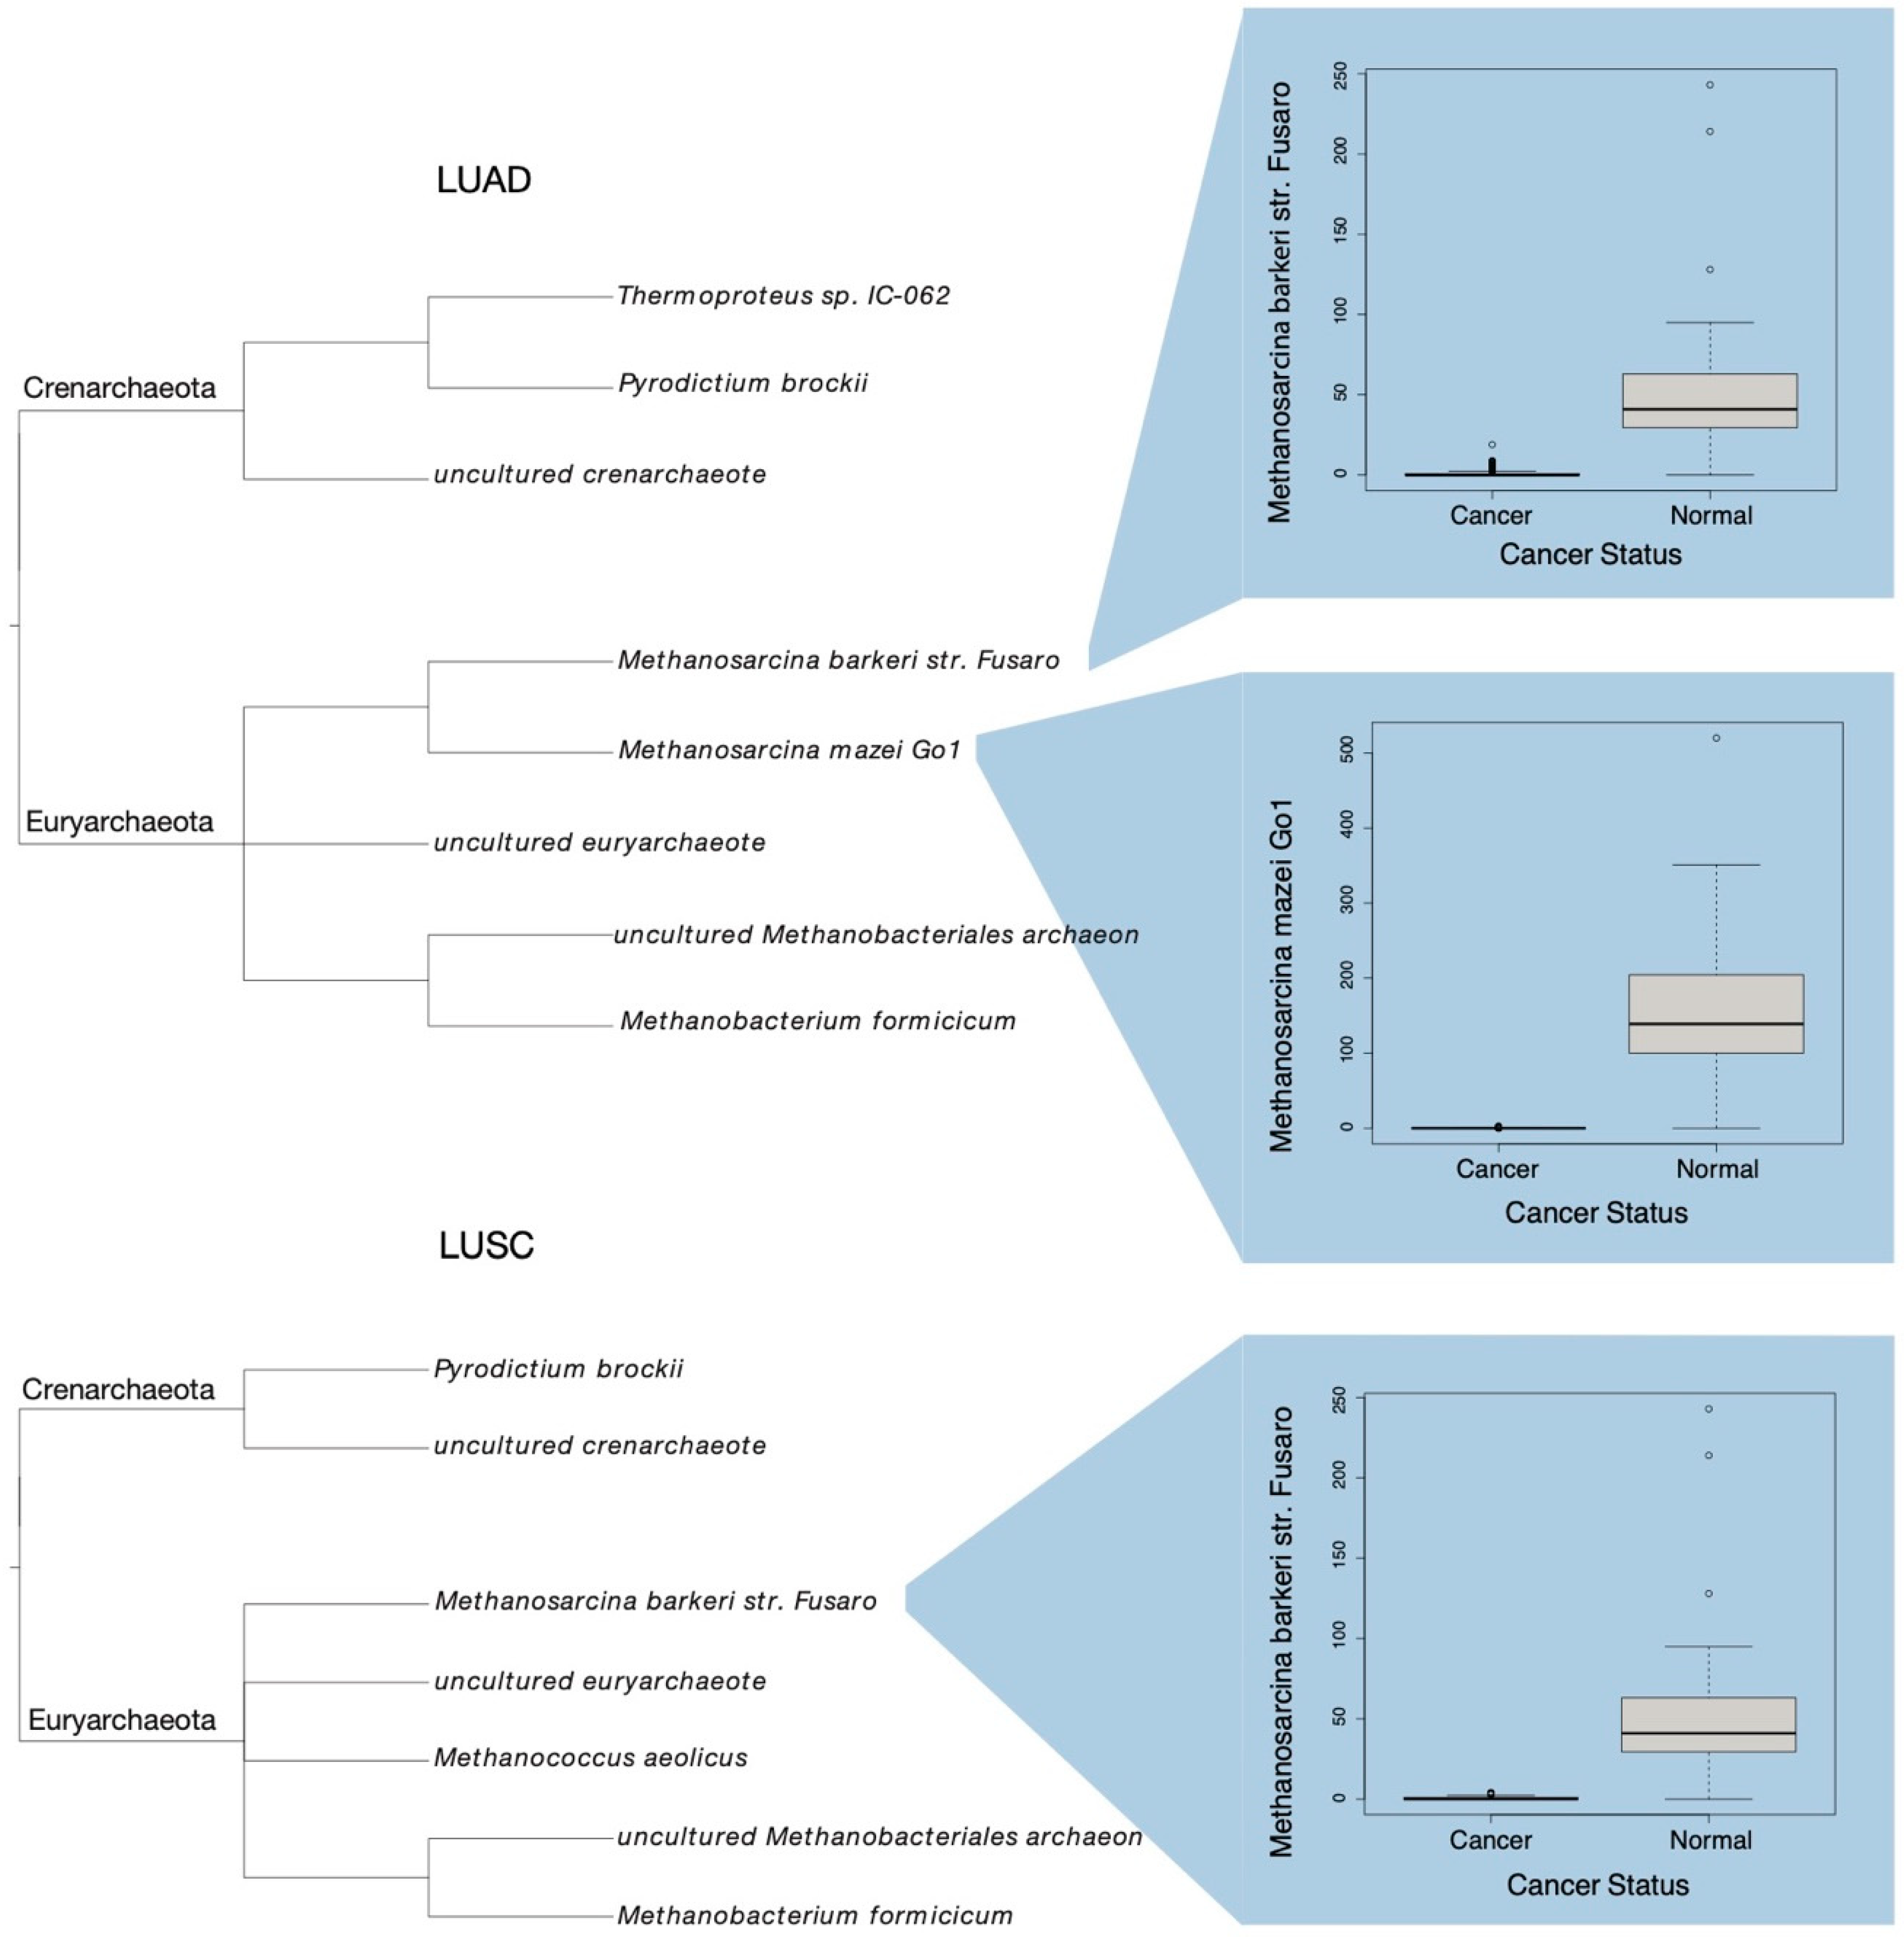
| Methanobacterium formicicum | 1.37 × 10⁻¹⁵ | 3.88 × 10⁻¹⁹ |
| Methanococcus aeolicus | 0.035682 | |
| Methanosarcina barkeri str. Fusaro | 3.45 × 10−45 | 1.42 × 10−49 |
| Methanosarcina mazei Go1 | 1.70 × 10−101 | |
| Pyrodictium brockii | 0.026487 | 0.014115 |
| Thermoproteus sp. IC-062 | 0.011968 | |
| uncultured crenarchaeote | 1.09 × 10⁻³⁵ | 1.32 × 10−36 |
| uncultured euryarchaeote | 1.12 × 10−50 | 4.92 × 10−52 |
| uncultured Methanobacteriales archaeon | 0.000271 | 0.004886 |
| Cancer | Microbe | Diagnosis Age | Sex | Race | Smoking History | Pathologic Stage | Neoplasm Presence | Therapy Outcome |
|---|---|---|---|---|---|---|---|---|
| LUAD | Aeropyrum pernix | 0.000339 | 0.027172 | |||||
| Caldivirga maquilingensis | 0.01464 | |||||||
| Candidatus Nitrosarchaeum limnium BG20 | 0.012235 | 0.011974 | ||||||
| Candidatus Nitrosocosmicus oleophilus | 0.000243 | 0.026028 | ||||||
| Candidatus Nitrososphaera gargensis | 0.026028 | |||||||
| Desulfurococcus amylolyticus 1221n | 0.034768 | |||||||
| Halogeometricum borinquense DSM 11551 | 0.015319 | |||||||
| Halorhabdus tiamatea SARL4B | 0.047583 | |||||||
| Infirmifilum uzonense | 0.003069 | |||||||
| Metallosphaera yellowstonensis MK1 | 0.036199 | |||||||
| Methanobacterium kanagiense | 0.029399 | |||||||
| Methanocaldococcus infernus ME | 0.022004 | |||||||
| Methanocella arvoryzae MRE50 | 0.047327 | |||||||
| Methanococcus aeolicus | 0.002794 | |||||||
| Methanococcus maripaludis S2 | 0.001452 | |||||||
| Methanococcus vannielii SB | 0.001327 | |||||||
| Methanoculleus marisnigri JR1 | 1.42 ×10⁻⁸ | 0.000996 | ||||||
| Methanopyrus kandleri AV19 | 0.024732 | 0.007884 | ||||||
| Methanosaeta harundinacea 6Ac | 0.000167 | |||||||
| Methanosarcina siciliae HI350 | 0.041515 | |||||||
| Methanothermobacter thermautotrophicus | 0.001041 | |||||||
| Natrialba magadii ATCC 43099 | 0.022468 | |||||||
| Natrinema pellirubrum DSM 15624 | 8.59 × 10⁻¹² | |||||||
| Pyrobaculum islandicum | 0.016035 | 0.046881 | 0.000782 | |||||
| Pyrodictium brockii | 0.044358 | |||||||
| Pyrolobus fumarii 1A | 0.037196 | 0.025456 | ||||||
| Thermofilum adornatus 1505 | 0.037196 | |||||||
| Thermofilum pendens Hrk 5 | 0.000006 | |||||||
| Thermoplasma volcanium GSS1 | 0.042784 | |||||||
| Thermoplasmatales archaeon BRNA1 | 0.02283 | |||||||
| Thermoproteus uzoniensis | 0.016035 | 0.046881 | 0.000782 | |||||
| Thermosphaera aggregans DSM 11486 | 5.79 × 10⁻⁷ | |||||||
| uncultured crenarchaeote | 0.045191 | 0.010931 | ||||||
| uncultured Methanobacteriales archaeon | 0.007569 | |||||||
| uncultured methanogenic archaeon | 0.002368 | 0.009116 | ||||||
| uncultured Nitrosopumilales archaeon | 0.00077 | 0.032531 | ||||||
| Vulcanisaeta distributa DSM 14429 | 0.000003 | |||||||
| LUSC | Aeropyrum pernix | 0.030009 | ||||||
| Desulfurococcus amylolyticus 1221n | 0.006251 | |||||||
| Desulfurococcus amylolyticus DSM 16532 | 0.002899 | |||||||
| Haloarcula sp CBA1115 | 0.00029 | |||||||
| Halorhabdus tiamatea SARL4B | 0.005232 | |||||||
| Metallosphaera yellowstonensis MK1 | 0.032987 | |||||||
| Methanobacterium formicicum | 0.042146 | |||||||
| Methanocaldococcus infernus ME | 0.007339 | |||||||
| Methanococcus maripaludis X1 | 7.02 × 10⁻²⁴ | |||||||
| Methanopyrus kandleri AV19 | 0.018165 | |||||||
| Methanosarcina barkeri CM1 | 0.013269 | 0.011716 | ||||||
| Methanothermococcus okinawensis IH1 | 0.024171 | |||||||
| Methanothermus fervidus DSM 2088 | 0.007446 | 0.034249 | ||||||
| Thermoplasmatales archaeon BRNA1 | 0.014448 | |||||||
| uncultured Candidatus Thalassoarchaea | 0.015503 | |||||||
| euryarchaeote | ||||||||
| uncultured crenarchaeote | 0.02786 | |||||||
| uncultured Methanosarcinales archaeon | 0.001505 | |||||||
| uncultured Thermoprotei archaeon | 0.047705 |
| Microbe | LUAD | LUSC |
|---|---|---|
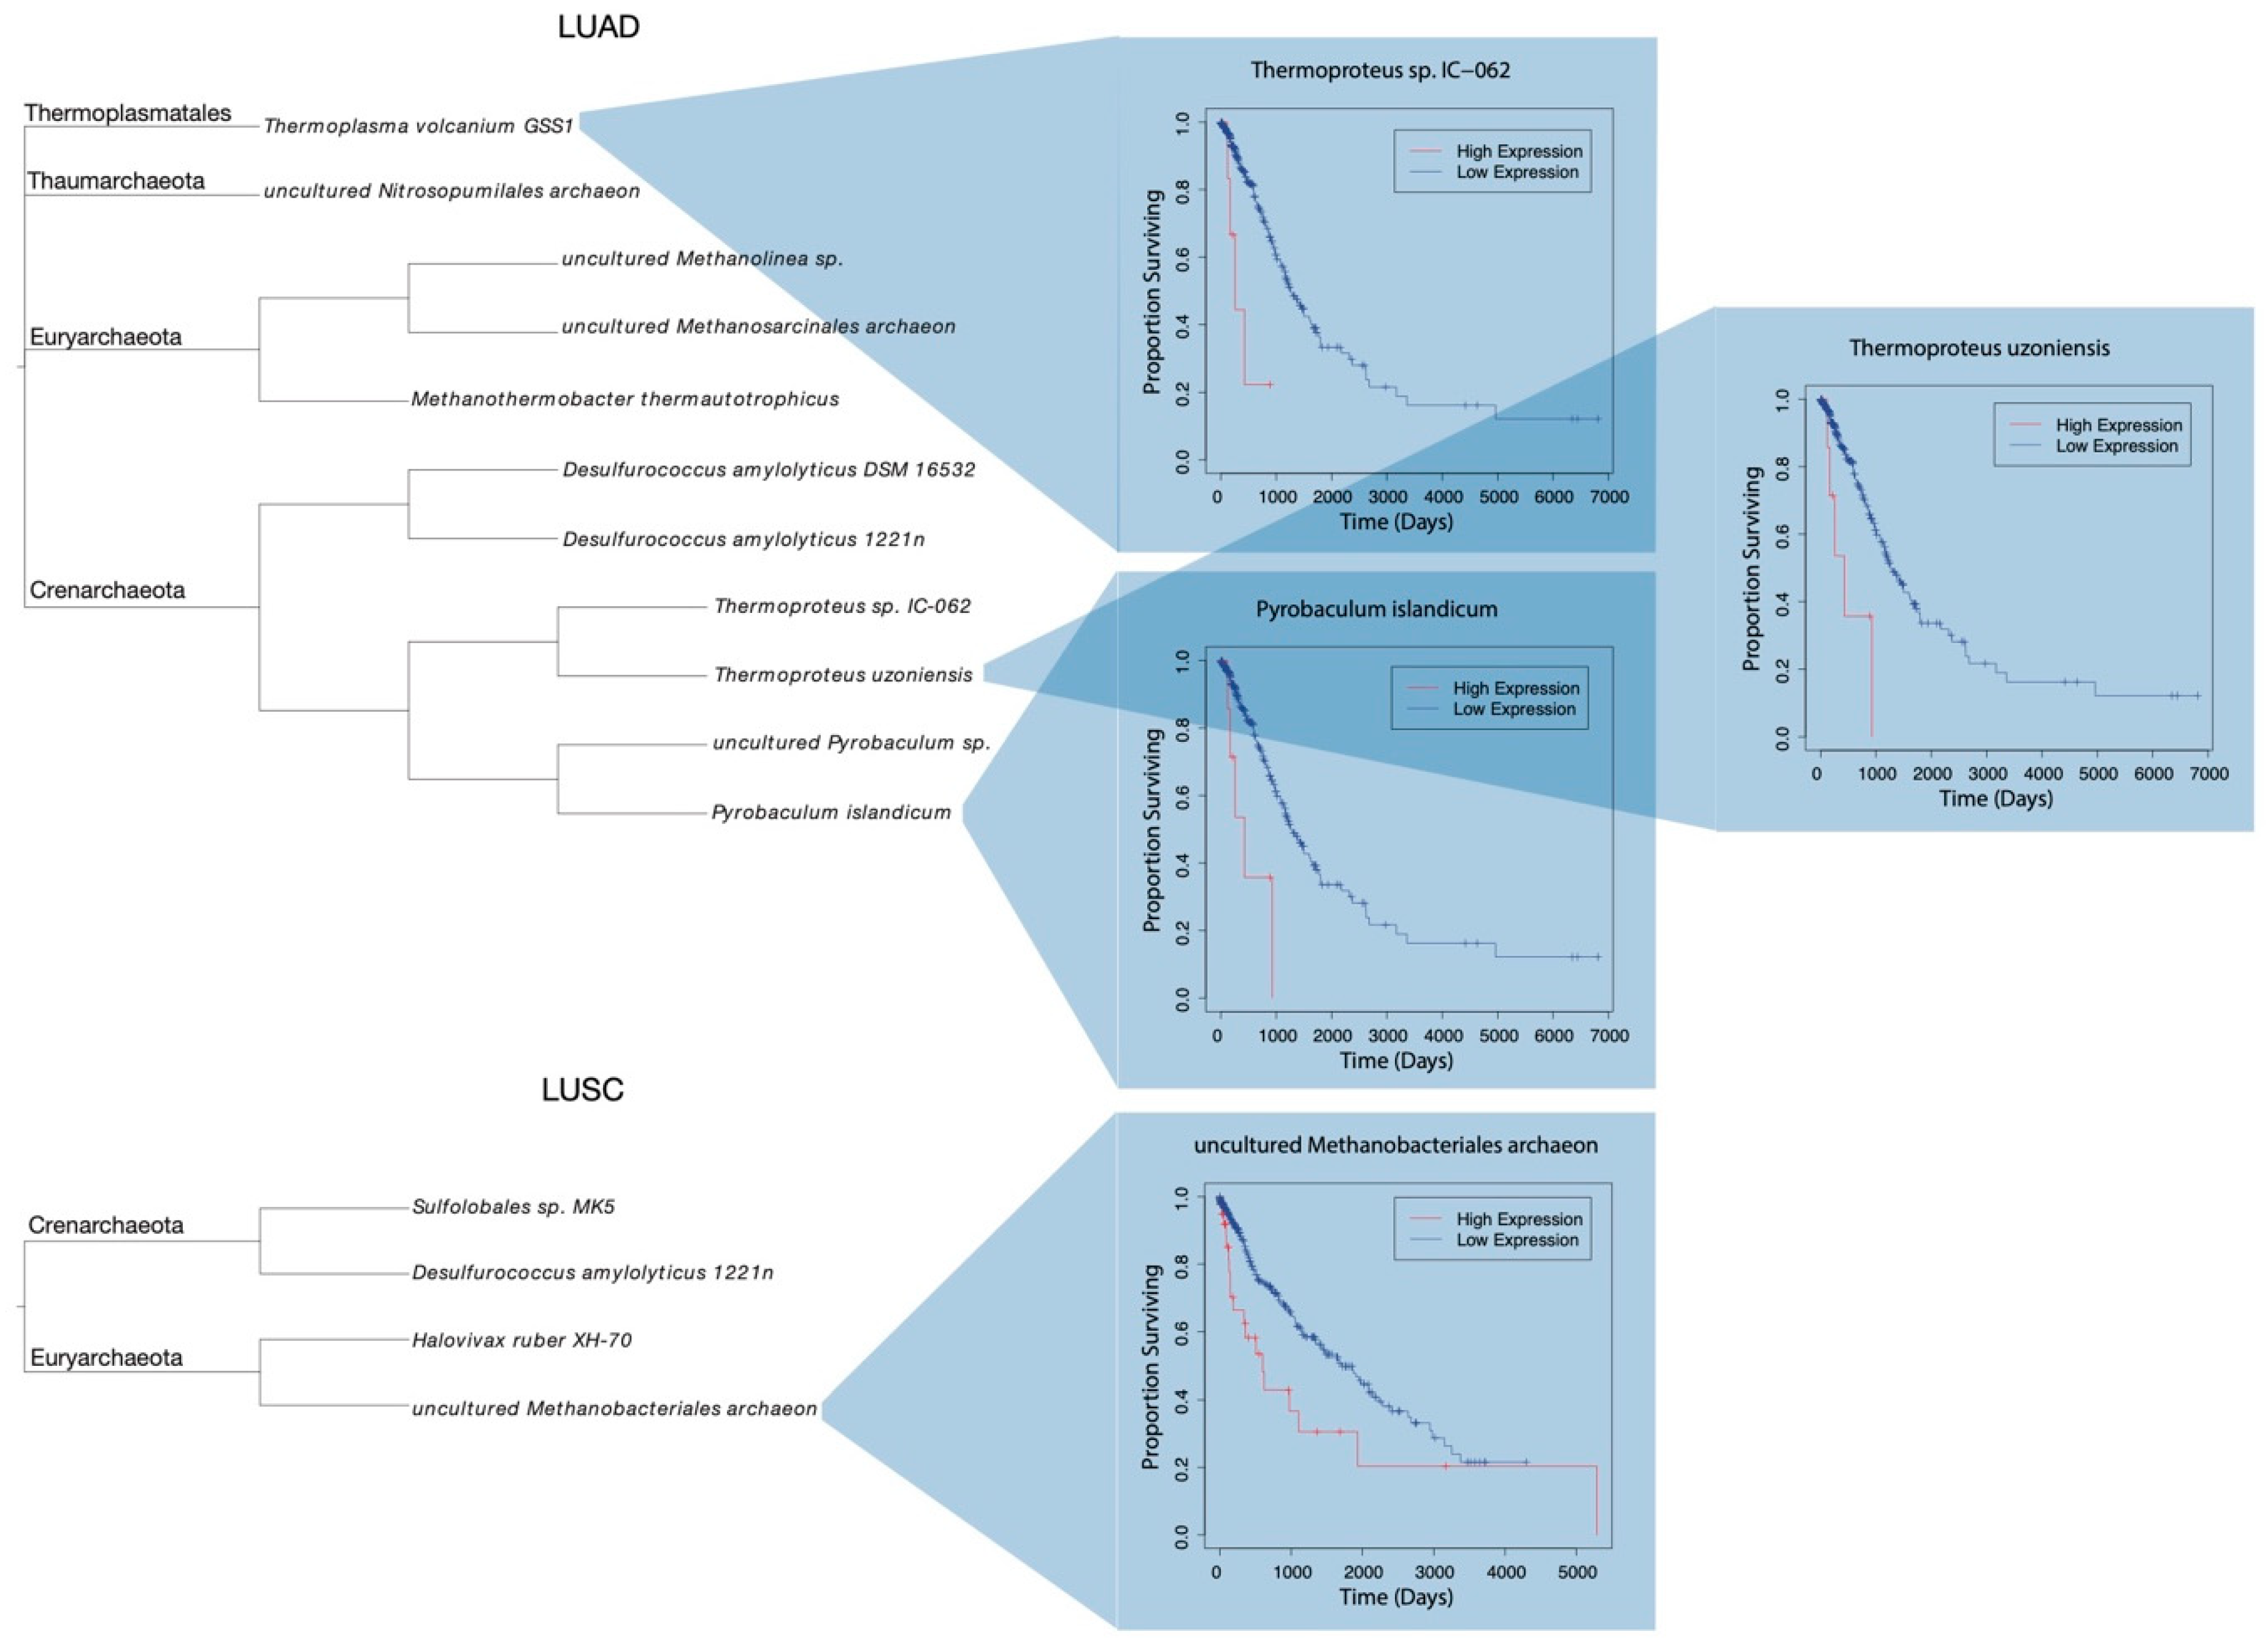
| Desulfurococcus amylolyticus 1221n | 0.030359 | 0.049114 |
| Desulfurococcus amylolyticus DSM 16532 | 0.034705 | |
| Halovivax ruber XH-70 | 0.043801 | |
| Methanothermobacter thermautotrophicus | 0.035661 | |
| Pyrobaculum islandicum | 0.002939 | |
| Sulfolobales sp. MK5 | 0.026319 | |
| Thermoplasma volcanium | 0.045003 | |
| Thermoproteus sp. IC-062 | 0.002299 | |
| Thermoproteus uzoniensis | 0.002939 | |
| uncultured Methanolinea sp. | 0.010941 | |
| uncultured Methanosarcinales archaeon | 0.028039 | 0.958966 |
| uncultured Nitrosopumilales archaeon | 0.014496 | |
| uncultured Pyrobaculum sp. | 0.040101 | |
Publisher’s Note: MDPI stays neutral with regard to jurisdictional claims in published maps and institutional affiliations. |
© 2022 by the authors. Licensee MDPI, Basel, Switzerland. This article is an open access article distributed under the terms and conditions of the Creative Commons Attribution (CC BY) license (https://creativecommons.org/licenses/by/4.0/).
Share and Cite
Uzelac, M.; Li, Y.; Chakladar, J.; Li, W.T.; Ongkeko, W.M. Archaea Microbiome Dysregulated Genes and Pathways as Molecular Targets for Lung Adenocarcinoma and Squamous Cell Carcinoma. Int. J. Mol. Sci. 2022, 23, 11566. https://doi.org/10.3390/ijms231911566
Uzelac M, Li Y, Chakladar J, Li WT, Ongkeko WM. Archaea Microbiome Dysregulated Genes and Pathways as Molecular Targets for Lung Adenocarcinoma and Squamous Cell Carcinoma. International Journal of Molecular Sciences. 2022; 23(19):11566. https://doi.org/10.3390/ijms231911566
Chicago/Turabian StyleUzelac, Matthew, Yuxiang Li, Jaideep Chakladar, Wei Tse Li, and Weg M. Ongkeko. 2022. "Archaea Microbiome Dysregulated Genes and Pathways as Molecular Targets for Lung Adenocarcinoma and Squamous Cell Carcinoma" International Journal of Molecular Sciences 23, no. 19: 11566. https://doi.org/10.3390/ijms231911566
APA StyleUzelac, M., Li, Y., Chakladar, J., Li, W. T., & Ongkeko, W. M. (2022). Archaea Microbiome Dysregulated Genes and Pathways as Molecular Targets for Lung Adenocarcinoma and Squamous Cell Carcinoma. International Journal of Molecular Sciences, 23(19), 11566. https://doi.org/10.3390/ijms231911566