
Can TPO as Photoinitiator Replace “Golden Mean” Camphorquinone and Tertiary Amines in Dental Composites? Testing Experimental Composites Containing Different Concentration of Diphenyl(2,4,6-trimethylbenzoyl)phosphine Oxide
 , , , and
Abstract
:1. Introduction
2. Materials and Methods
- DTS—diametral tensile strength (MPa);
- P—load applied (N);
- D—diameter of sample (mm);
- T—high of sample (mm).
- W—force, which caused the destruction of the sample (N);
- l—distance between supports, 20 mm;
- b—width of sample (mm);
- h—high of sample (mm).
3. Results
- Composite including CQ and 0.27 wt.% TPO (p-value = 0.00032), with higher values of experimental composite with 0.27 wt.% TPO.
- Composite including CQ and 0.5 wt.% TPO (p-value = 0.00000), with higher values of experimental composite with 0.5 wt.% TPO.
- Composite including CQ and 0.75 wt.% TPO (p-value = 0.00000), with higher values of experimental composite with 0.75 wt.% TPO.
- Composite including CQ and 1 wt.% TPO (p-value = 0.00000), with higher values of experimental composite with 1 wt.% TPO.
- Composite containing 0.27 and 1 wt.% of TPO (p-value = 0.00117), with higher values for material with 1 wt.% TPO.
- Composite containing TPO 0.5 wt.% and 0.75 wt.% of TPO (p-value = 0.01763), with higher values for composite with 0.75 wt.% TPO.
- Dental material including TPO 0.5 wt.% and 1 wt.% of TPO (p-value = 0.04058), with higher values of material with 1 wt.% TPO.
- Composite including CQ and 0.75 wt.% TPO (p-value = 0.01319), with higher values of experimental composite with 0.75 wt.% TPO.
- Material with 0.27 wt.% and 0.75 wt.% TPO (p-value = 0.00065), with higher values of material with 0.75 wt.% TPO.
- Composites including TPO 0.5% and TPO 0.75% (p-value = 0.02816), with higher values in TPO 0.75%.
- Composite with CQ and 0.5 wt.% of TPO (p-value = 0.00015), with higher values of material including CQ,
- Materials containing CQ and 0.75 wt.% TPO (p-value = 0.00001), with higher values of composite with CQ,
- Dental resin composite including CQ and 1 wt.% TPO (p-value = 0.00000), with higher values of material with CQ,
- Composite containing 0.27 wt.% and 0.5 wt.% TPO (p-value = 0.00001), with higher values of material with 0.27 wt.% of TPO,
- Resins with 0.27 wt.% and 0.75 wt.% of TPO (p-value = 0.00000), with higher values of composite including 0.27 wt.% of TPO,
- Dental materials with 0.27 wt.% and 1 wt.% of TPO (p-value = 0.00000), with higher values of material with 0.27 wt.% of TPO,
- Composites with 0.5 wt.% and 1 wt. % (p-value = 0.001207), with higher values of resin containing 0.5 wt.% of TPO.
- Composite containing CQ and 0.27 wt.% TPO (p-value = 0.00022), with higher values for resin with CQ.
- Dental resin including CQ and 0.75 wt. %TPO (p-value = 0.03649), with higher values for material with CQ.
- Material with CQ and 1 wt.% TPO (p-value = 0.00472), with higher values for composite with 1 wt.% of TPO.
- Dental composite including 0.27 wt.% and 0.5 wt.% TPO (p-value = 0.01404), with higher values for resin with 0.5 wt.% of TPO.
- Resin based composite with 0.27 wt.% and 1 wt.% TPO (p-value = 0.00000), with higher values for composite 1 wt.% of TPO.
- Material containing 0.5 wt.% and 1 wt.% TPO (p-value = 0.00012), with higher values for resin based composite with 1 wt.% of TPO.
- Composite with 0.75 wt.% and 1 wt.% TPO (p-value = 0.00004), with higher values for material containing 1 wt.% of TPO.
4. Discussion
5. Conclusions
References
Author Contributions
Funding
Institutional Review Board Statement
Informed Consent Statement
Data Availability Statement
Conflicts of Interest
Appendix A

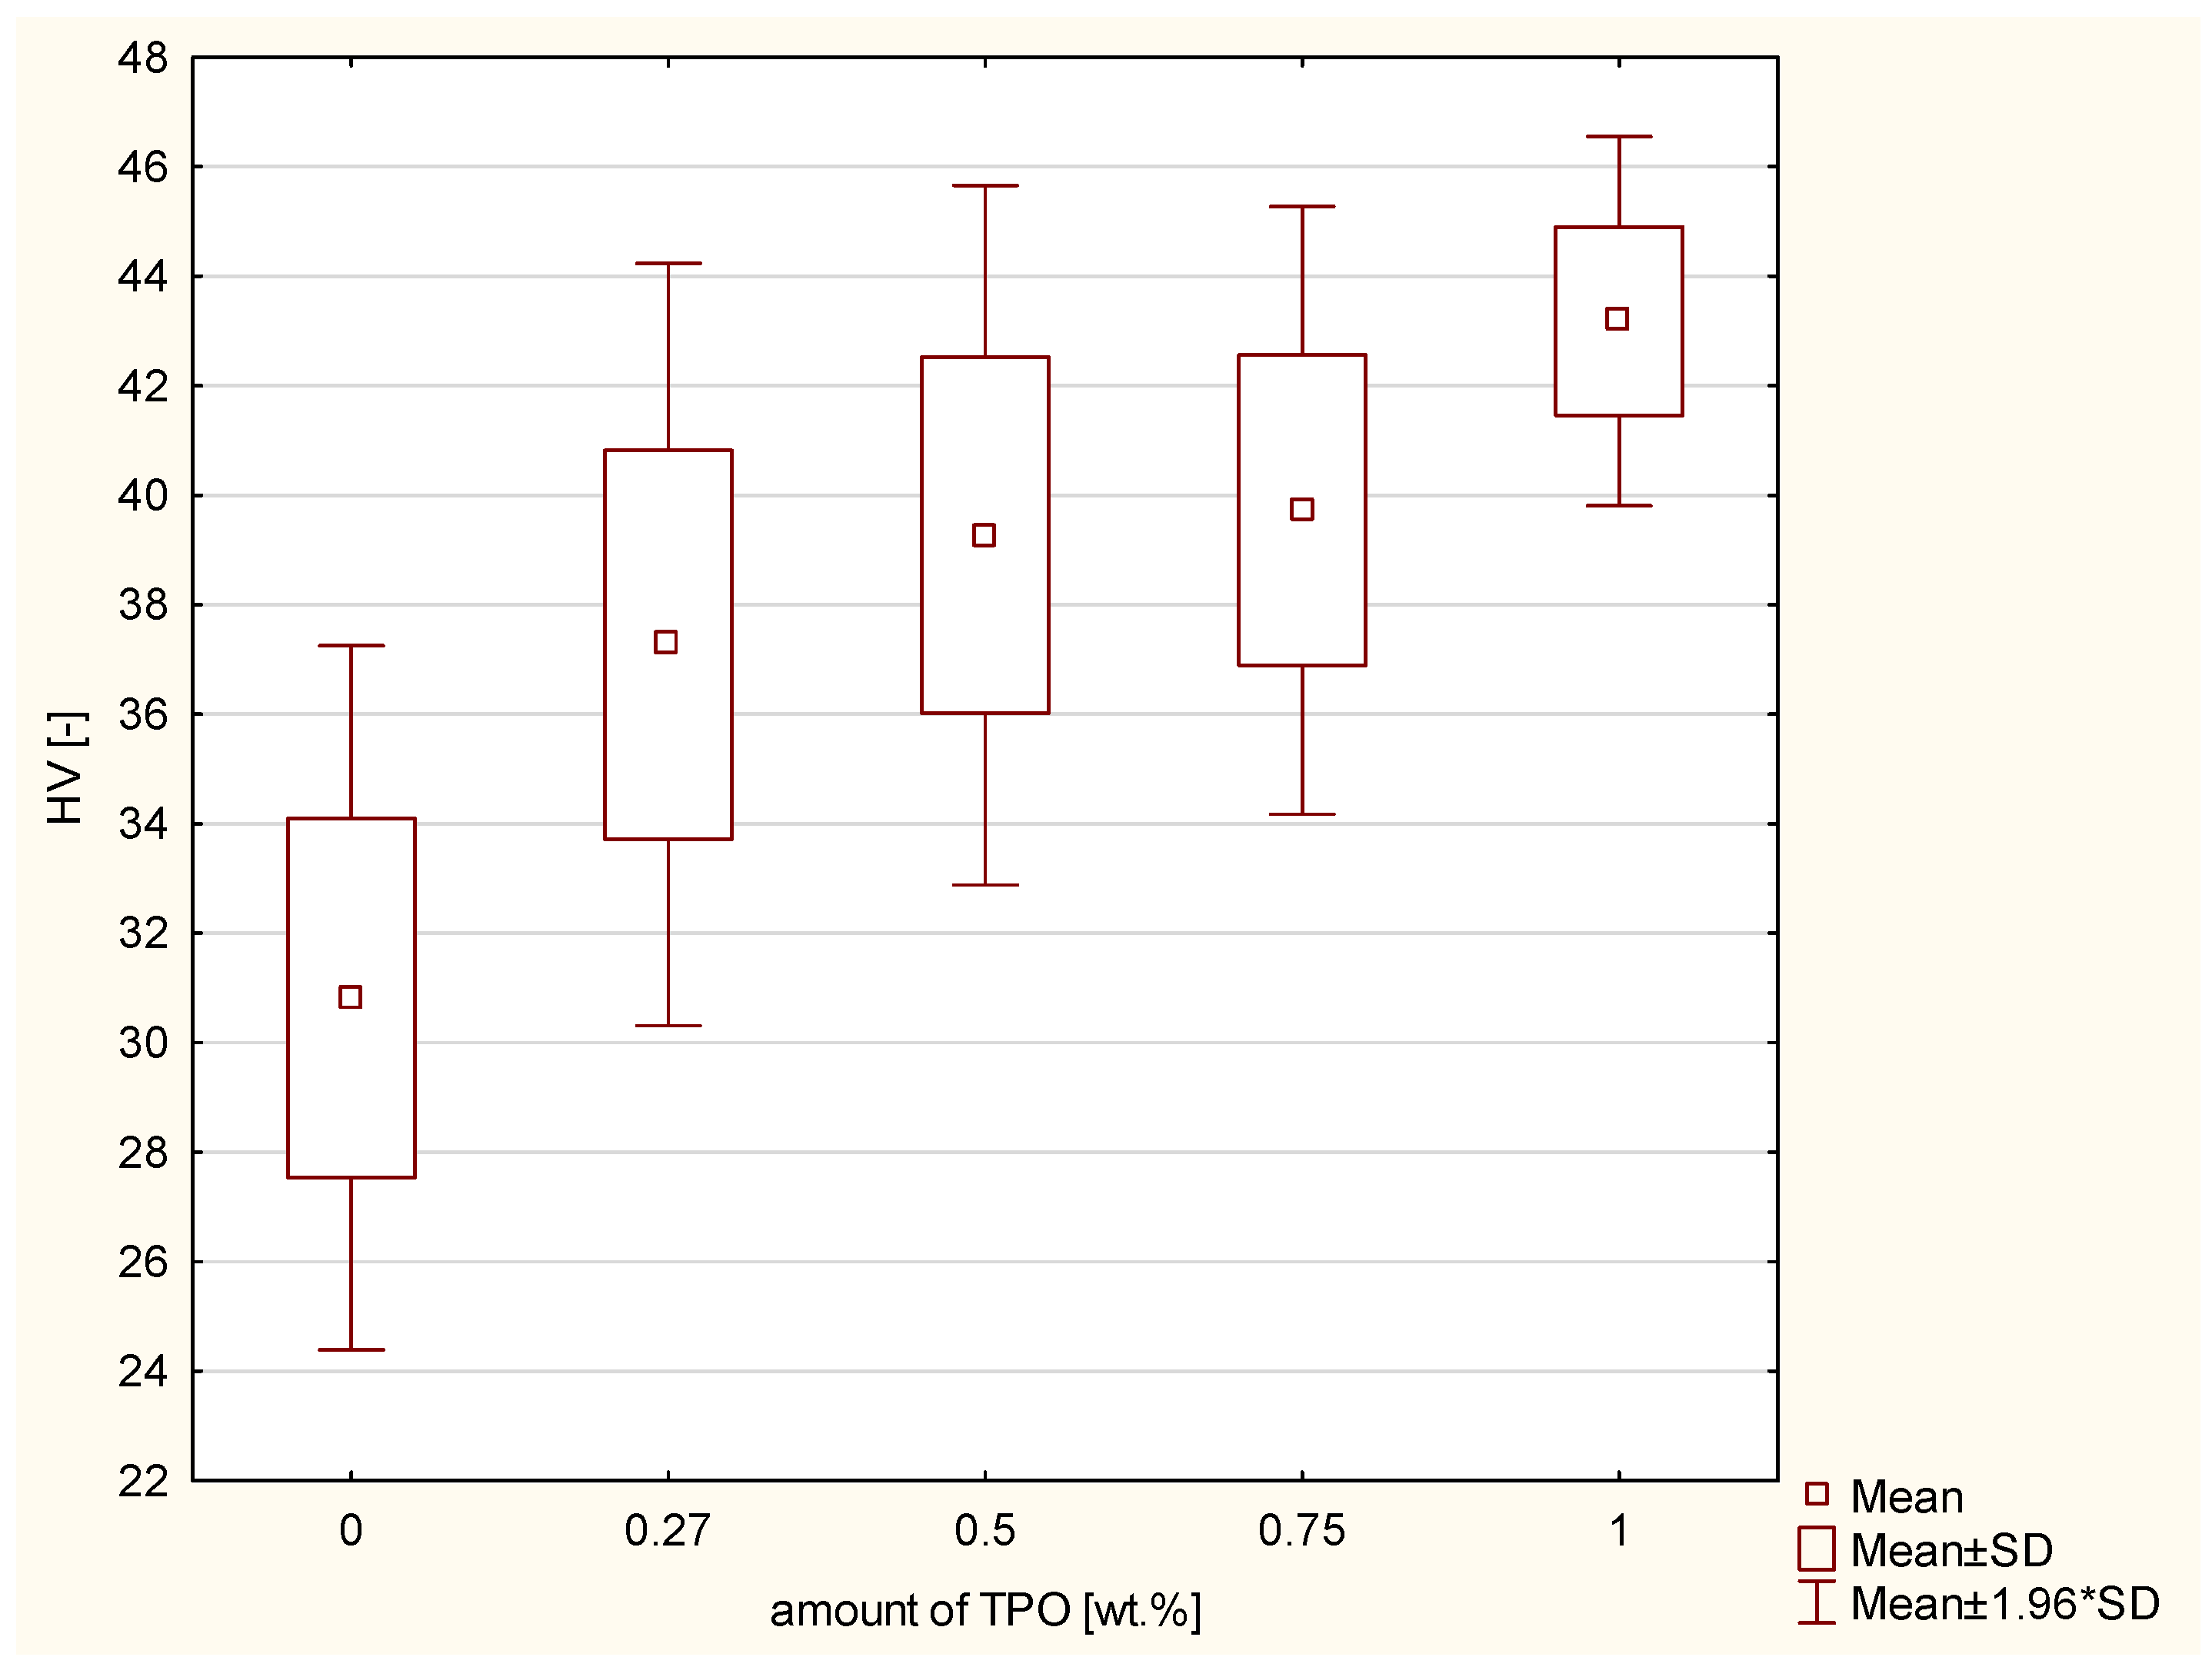
| Composite | Vicker’s Hardness | Standard Deviation | DTS [MPa] | Standard Deviation | TPB [MPa] | Standard Deviation | FS Modulus [MPa] | Standard Deviation |
|---|---|---|---|---|---|---|---|---|
| CQ + DMAEMA | 30.82 | 3.3 | 28.32 | 3.4 | 77.3 | 9.9 | 3734.00 | 136.7 |
| TPO 0.27 wt.% | 37.27 | 3.6 | 26.87 | 4.1 | 66.38 | 12.4 | 3281.67 | 435.4 |
| TPO 0.5 wt.% | 39.27 | 3.3 | 22.7 | 4.7 | 65.4 | 16.6 | 3953.33 | 540.0 |
| TPO 0.75 wt.% | 39.73 | 2.8 | 29.73 | 4.8 | 86.4 | 6.6 | 5383.33 | 1067.1 |
| TPO 1 wt.% | 43.28 | 1.7 | 29.06 | 5.4 | 75.1 | 16.2 | 4521.67 | 783.4 |
References
- Pratap, B.; Kant, R.; Bhardwaj, B.; Nag, M. Resin based restorative dental materials: Characteristics and future perspectives. Jpn. Dent. Sci. Rev. 2019, 55, 126–138. [Google Scholar] [CrossRef] [PubMed]
- Van Landuyt, K.L.; Snauwaert, J.; De Muncka, J.; Peumansa, M.; Yoshidac, Y.; Poitevin, A.; Coutinho, E.; Suzuki, K.; Lambrechts, P.; Van Meerbeeka, B. Systematic review of the chemical composition of contemporary dental adhesives. Biomaterials 2007, 28, 3757–3785. [Google Scholar] [CrossRef]
- Hadis, M.A.; Shortall, A.C.; Palin, W.M. Competitive light absorbers in photoactive dental resin-based materials. Dent. Mater. 2012, 28, 831–841. [Google Scholar] [CrossRef]
- Taira, M.; Urabe, H.; Hirose, T.; Wakasa, K.; Yamaki, M. Analysis of Photo-initiators in Visible-light-cured Dental Composite Resins. J. Dent. Res. 1987, 67, 24–28. [Google Scholar] [CrossRef] [PubMed]
- Alvim, H.H.; Alecio, A.C.; Vasconcellos, W.A.; Furlan, M.; de Oliveira, J.E.; Saad, J.R.C. Analysis of camphorquinone in compositeresins as a function of shade. Dent. Mater. 2006, 3, 1245–1249. [Google Scholar]
- Shintani, H.; Inoue, T.; Yamaki, M. Analysis of camphorquinone in visible light-cured composite resins. Dent. Mater. 1985, 1, 124–126. [Google Scholar] [CrossRef]
- Park, Y.; Chae, K.; Rawls, H.R. Development of a new photoinitiation system for dental light-cure composite resins. Dent. Mater. 1999, 15, 120–127. [Google Scholar] [CrossRef]
- Kowalska, A.; Sokolowski, J.; Gozdek, T.; Kopacz, K.; Bociong, K. The influence of various photoinitiators on the properties of commercial dental composite. Polymers 2021, 13, 3972. [Google Scholar] [CrossRef]
- Da Silva Alves Maciel, D.; Caires-Filho, A.B.; Fernandez-Garcia, M.; Anauate-Netto, C.; Alonso, R.C.B. Effect of Camphorquinone Concentration in Physical-Mechanical Properties of Experimental Flowable Resin Composites. BioMed Res. Int. 2018, 2018, 7921247. [Google Scholar]
- Musanje, L.; Ferracane, J.L.; Sakaguchi, R.L. Determination of the optimal photoinitiator concentration in dental compositesbased on essential material properties. Dent. Mater. 2009, 5, 994–1000. [Google Scholar] [CrossRef] [PubMed]
- Almeida, S.M.; Meereis, C.T.W.; Leal, F.B.; Carvalho, R.V.; Boeira, P.O.; Chisini, L.A.; Cuevas-Suárez, C.E.; Lima, G.S.; Piva, E. Evaluation of alternative photoinitiator systems in two-step self-etch adhesive systems. Dent. Mater. 2020, 36, e29–e37. [Google Scholar] [CrossRef] [PubMed]
- Boeira, O.P.; Meereis, C.T.W.; Suárez, C.E.C.; Almeida, S.M.; Piva, E.; Lima, G.S. Coumarin—Based iodonium hexafluoroanti-monate as an alternative photoinitiator for experimental dental adhesives resin. Appl. Adhes. Sci. 2017, 5, 2. [Google Scholar] [CrossRef] [Green Version]
- Kowalska, A.; Sokolowski, J.; Bociong, K. The photoinitiators used in resin based dental composite—A review and futureperspectives. Polymers 2021, 13, 470. [Google Scholar] [CrossRef] [PubMed]
- Georg, H.; Canuto, S.; Coutinho, K. Solvent effects on the UV-visible absorption spectrum of benzophenone in water: A combined Monte Carlo quantum mechanics study including solute polarization. J. Chem. Phys. 2007, 126, 034507. [Google Scholar] [CrossRef]
- Da Silveira Lima, G.; Ogliari, F.A.; Souza e Silva, M.G.; Münchow, E.A.; Petzhold, C.L.; Piva, E. Benzodioxoles as alternative coinitiators for radical polymerization in a model-dental adhesive resin. J Appl Polym Sci. 2013, 127, 4160–4167. [Google Scholar] [CrossRef]
- Alsheikh, R. Color stability of Lucirin-photo-activated resin composite after immersion in different staining solutions: Aspectrophotometric study. Clin. Cosmet. Investig. Dent. 2019, 11, 297–311. [Google Scholar] [CrossRef] [PubMed]
- Miletic, V.; Santini, A. Optimizing the concentration of 2,4,6-trimethylbenzoyldiphenylphosphine oxide initiator in compositeresins in relation to monomer conversion. Dent. Mater. J. 2012, 31, 717–723. [Google Scholar] [CrossRef] [PubMed]
- Ullrich, G.; Herzog, D.; Liska, R.; Burtscher, P.; Moszner, N. Photoinitiators with Functional Groups. VII. Covalently Bonded Camphorquinone-Amines. J. Polym. Sci. Part A Polym. Chem. 2004, 42, 4948–4963. [Google Scholar] [CrossRef]
- Arikawa, H.; Takahashi, H.; Kanie, T.; Ban, S. Effect of various visible light photoinitiators on the polymerization and color oflight-activated resins. Dent. Mater. J. 2009, 28, 454–460. [Google Scholar] [CrossRef] [PubMed]
- Kinomoto, Y.; Torii, M.; Takeshige, F.; Ebisu, S. Comparison of polymerization contraction stresses between self- and light-curingcomposites. J. Dent. 1999, 27, 383–389. [Google Scholar] [CrossRef]
- Randolph, L.D.; Palin, W.M.; Watts, D.C.; Genet, M.; Devaux, J.; Leloup, G. The effect of ultra-fast photopolymerisation ofexperimental composites on shrinkage stress, network formation and pulpal temperature rise. Dent. Mater. 2014, 30, 1280–1289. [Google Scholar] [CrossRef] [PubMed]
- Moszner, N.; Salz, U.; Zimmermann, J. Chemical aspects of self-etching enamel–dentin adhesives: A systematic review. Dent. Mater. 2005, 21, 895–910. [Google Scholar] [CrossRef] [PubMed]
- Salgado, V.E.; Borba, M.M.; Cavalcante, L.M.; De Moraes, R.R.; Schneider, L.F. Effect of Photoinitiator Combinations on Hardness, Depth of Cure, and Color of Model Resin Composites. J. Esthet. Restor. Dent. 2015, 27, 41–48. [Google Scholar] [CrossRef] [PubMed]
- Vinicius, M.; Bertolo, L.; De Cássia, R.; Moraes, M. Influence of Photoinitiator System on Physical-Chemical Properties ofExperimental Self-Adhesive Composites. Braz. Dent. J. 2017, 28, 35–39. [Google Scholar]
- Oliver, W.C.; Pharr, G.M. An improved technique for determining hardness and elastic modulus using load and displacementsensing indentation experiments. J. Mater. Res. 1992, 7, 1564–1583. [Google Scholar] [CrossRef]
- ISO 4049; Dentistry—Polymer-Based Restorative Materials. International Organization for Standardization: Geneva, Switzerland, 2019; pp. 1–29.
- Ferracane, J.L. Correlation between hardness and degree of conversion during the setting reaction of unfilled dental restorative resins. Dent. Mater. 1985, 1, 11–14. [Google Scholar] [CrossRef]
- Palin, W.M.; Senyilmaz, D.P.; Marquis, P.M.; Shortall, A.C. Cure width potential for MOD resin composite molar restorations. Dent. Mater. 2008, 24, 1083–1094. [Google Scholar] [CrossRef]
- Par, M.; Marovic, D.; Attin, T.; Tarle, Z.; Tauböck, T.T. The effect of rapid high-intensity light-curing on micromechanical propertiesof bulk-fill and conventional resin composites. Sci. Rep. 2020, 10, 10560. [Google Scholar] [CrossRef]
- Alkhudhairy, F.; Vohra, F.; Naseem, M.; Owais, M.M.; Bin Amer, A.H. Color stability and degree of conversion of a novel dibenzoyl germanium derivative containing photo-polymerized resin luting cement. J. Appl. Biomater. Funct. Mater. 2020, 18, 1–7. [Google Scholar] [CrossRef]
- Delgado, A.J.; Oliveira, D.; Abdulhameed, N.; Geraldeli, S. The Use of Different Photoinitiator Systems in PhotopolymerizingResin Cements Through Ceramic Veneers. Oper. Dent. 2019, 44, 396–404. [Google Scholar] [CrossRef]


| Group | Photoinitiator System | Manufacturer | Concentration of Photoinitiator |
|---|---|---|---|
| A. | CQ and DMAEMA | Sigma-Aldrich Inc., St. Louis, MO, USA | 0.4 wt.% and 0.8 wt.% |
| B. | TPO | 0.27 wt.% | |
| C. | TPO | 0.5 wt.% | |
| D. | TPO | 0.75 wt.% | |
| E. | TPO | 1 wt.% |
| Distance [µm] | CQ/DMAEMA | TPO 0.27 wt.% | TPO 0.75 wt.% | TPO 1 wt.% | ||||
|---|---|---|---|---|---|---|---|---|
| Microhardness [MPa] | Reduced Modulus [GPa] | Microhardness [MPa] | Reduced Modulus [GPa] | Microhardness [MPa] | Reduced Modulus [GPa] | Microhardness [MPa] | Reduced Modulus [GPa] | |
| 0 | 67.52 ± 2.5 | 2.15 ± 0.1 | 109.58 ± 2.6 | 0.53 ± 0.1 | 57.58 ± 2.5 | 0.3 ± 0.0 | 44.97 ± 5.8 | 0.69 ± 0.0 |
| 450 | 352.5 ± 55.4 | 5.38 ± 0.4 | 372.77 ± 34.7 | 4.08 ± 0.3 | 108.66 ± 10.5 | 1.8 ± 0.1 | 336.67 ± 50.8 | 4.08 ± 0.5 |
| 900 | 671.43 ± 89.9 | 5.51 ± 0.1 | 486.34 ± 9.3 | 5.07 ± 0.1 | 590.06 ± 3.6 | 6.9 ± 0.9 | 423.08 ± 10.1 | 3.93 ± 0.5 |
| 1350 | 753.49 ± 2.9 | 8.34 ± 0.6 | 478.84 ± 69.2 | 5.00 ± 0.5 | 499.52 ± 43.1 | 5.5 ± 0.3 | 280.53 ± 4.3 | 3.21 ± 0.2 |
| 1800 | 12.2 ± 1.5 | 0.72 ± 0.0 | 50.25 ± 1.1 | 2.08 ± 0.3 | 255.98 ± 3.8 | 4.00 ± 0.4 | 210.4 ± 5.9 | 3.12 ± 0.4 |
Publisher’s Note: MDPI stays neutral with regard to jurisdictional claims in published maps and institutional affiliations. |
© 2022 by the authors. Licensee MDPI, Basel, Switzerland. This article is an open access article distributed under the terms and conditions of the Creative Commons Attribution (CC BY) license (https://creativecommons.org/licenses/by/4.0/).
Share and Cite
Kowalska, A.; Sokołowski, J.; Szynkowska-Jóźwik, M.I.; Gozdek, T.; Kopacz, K.; Bociong, K. Can TPO as Photoinitiator Replace “Golden Mean” Camphorquinone and Tertiary Amines in Dental Composites? Testing Experimental Composites Containing Different Concentration of Diphenyl(2,4,6-trimethylbenzoyl)phosphine Oxide. Int. J. Mol. Sci. 2022, 23, 11594. https://doi.org/10.3390/ijms231911594
Kowalska A, Sokołowski J, Szynkowska-Jóźwik MI, Gozdek T, Kopacz K, Bociong K. Can TPO as Photoinitiator Replace “Golden Mean” Camphorquinone and Tertiary Amines in Dental Composites? Testing Experimental Composites Containing Different Concentration of Diphenyl(2,4,6-trimethylbenzoyl)phosphine Oxide. International Journal of Molecular Sciences. 2022; 23(19):11594. https://doi.org/10.3390/ijms231911594
Chicago/Turabian StyleKowalska, Andrea, Jerzy Sokołowski, Małgorzata Iwona Szynkowska-Jóźwik, Tomasz Gozdek, Karolina Kopacz, and Kinga Bociong. 2022. "Can TPO as Photoinitiator Replace “Golden Mean” Camphorquinone and Tertiary Amines in Dental Composites? Testing Experimental Composites Containing Different Concentration of Diphenyl(2,4,6-trimethylbenzoyl)phosphine Oxide" International Journal of Molecular Sciences 23, no. 19: 11594. https://doi.org/10.3390/ijms231911594