
NGF Enhances CGRP Release Evoked by Capsaicin from Rat Trigeminal Neurons: Differential Inhibition by SNAP-25-Cleaving Proteases

 , ,
, , 
Abstract
:1. Introduction
2. Results
2.1. Exposure to CAP Induces Concentration-Dependent Increases in Intracellular Ca2+ ([Ca2+]i) in Neonatal Rat TGNs In Vitro
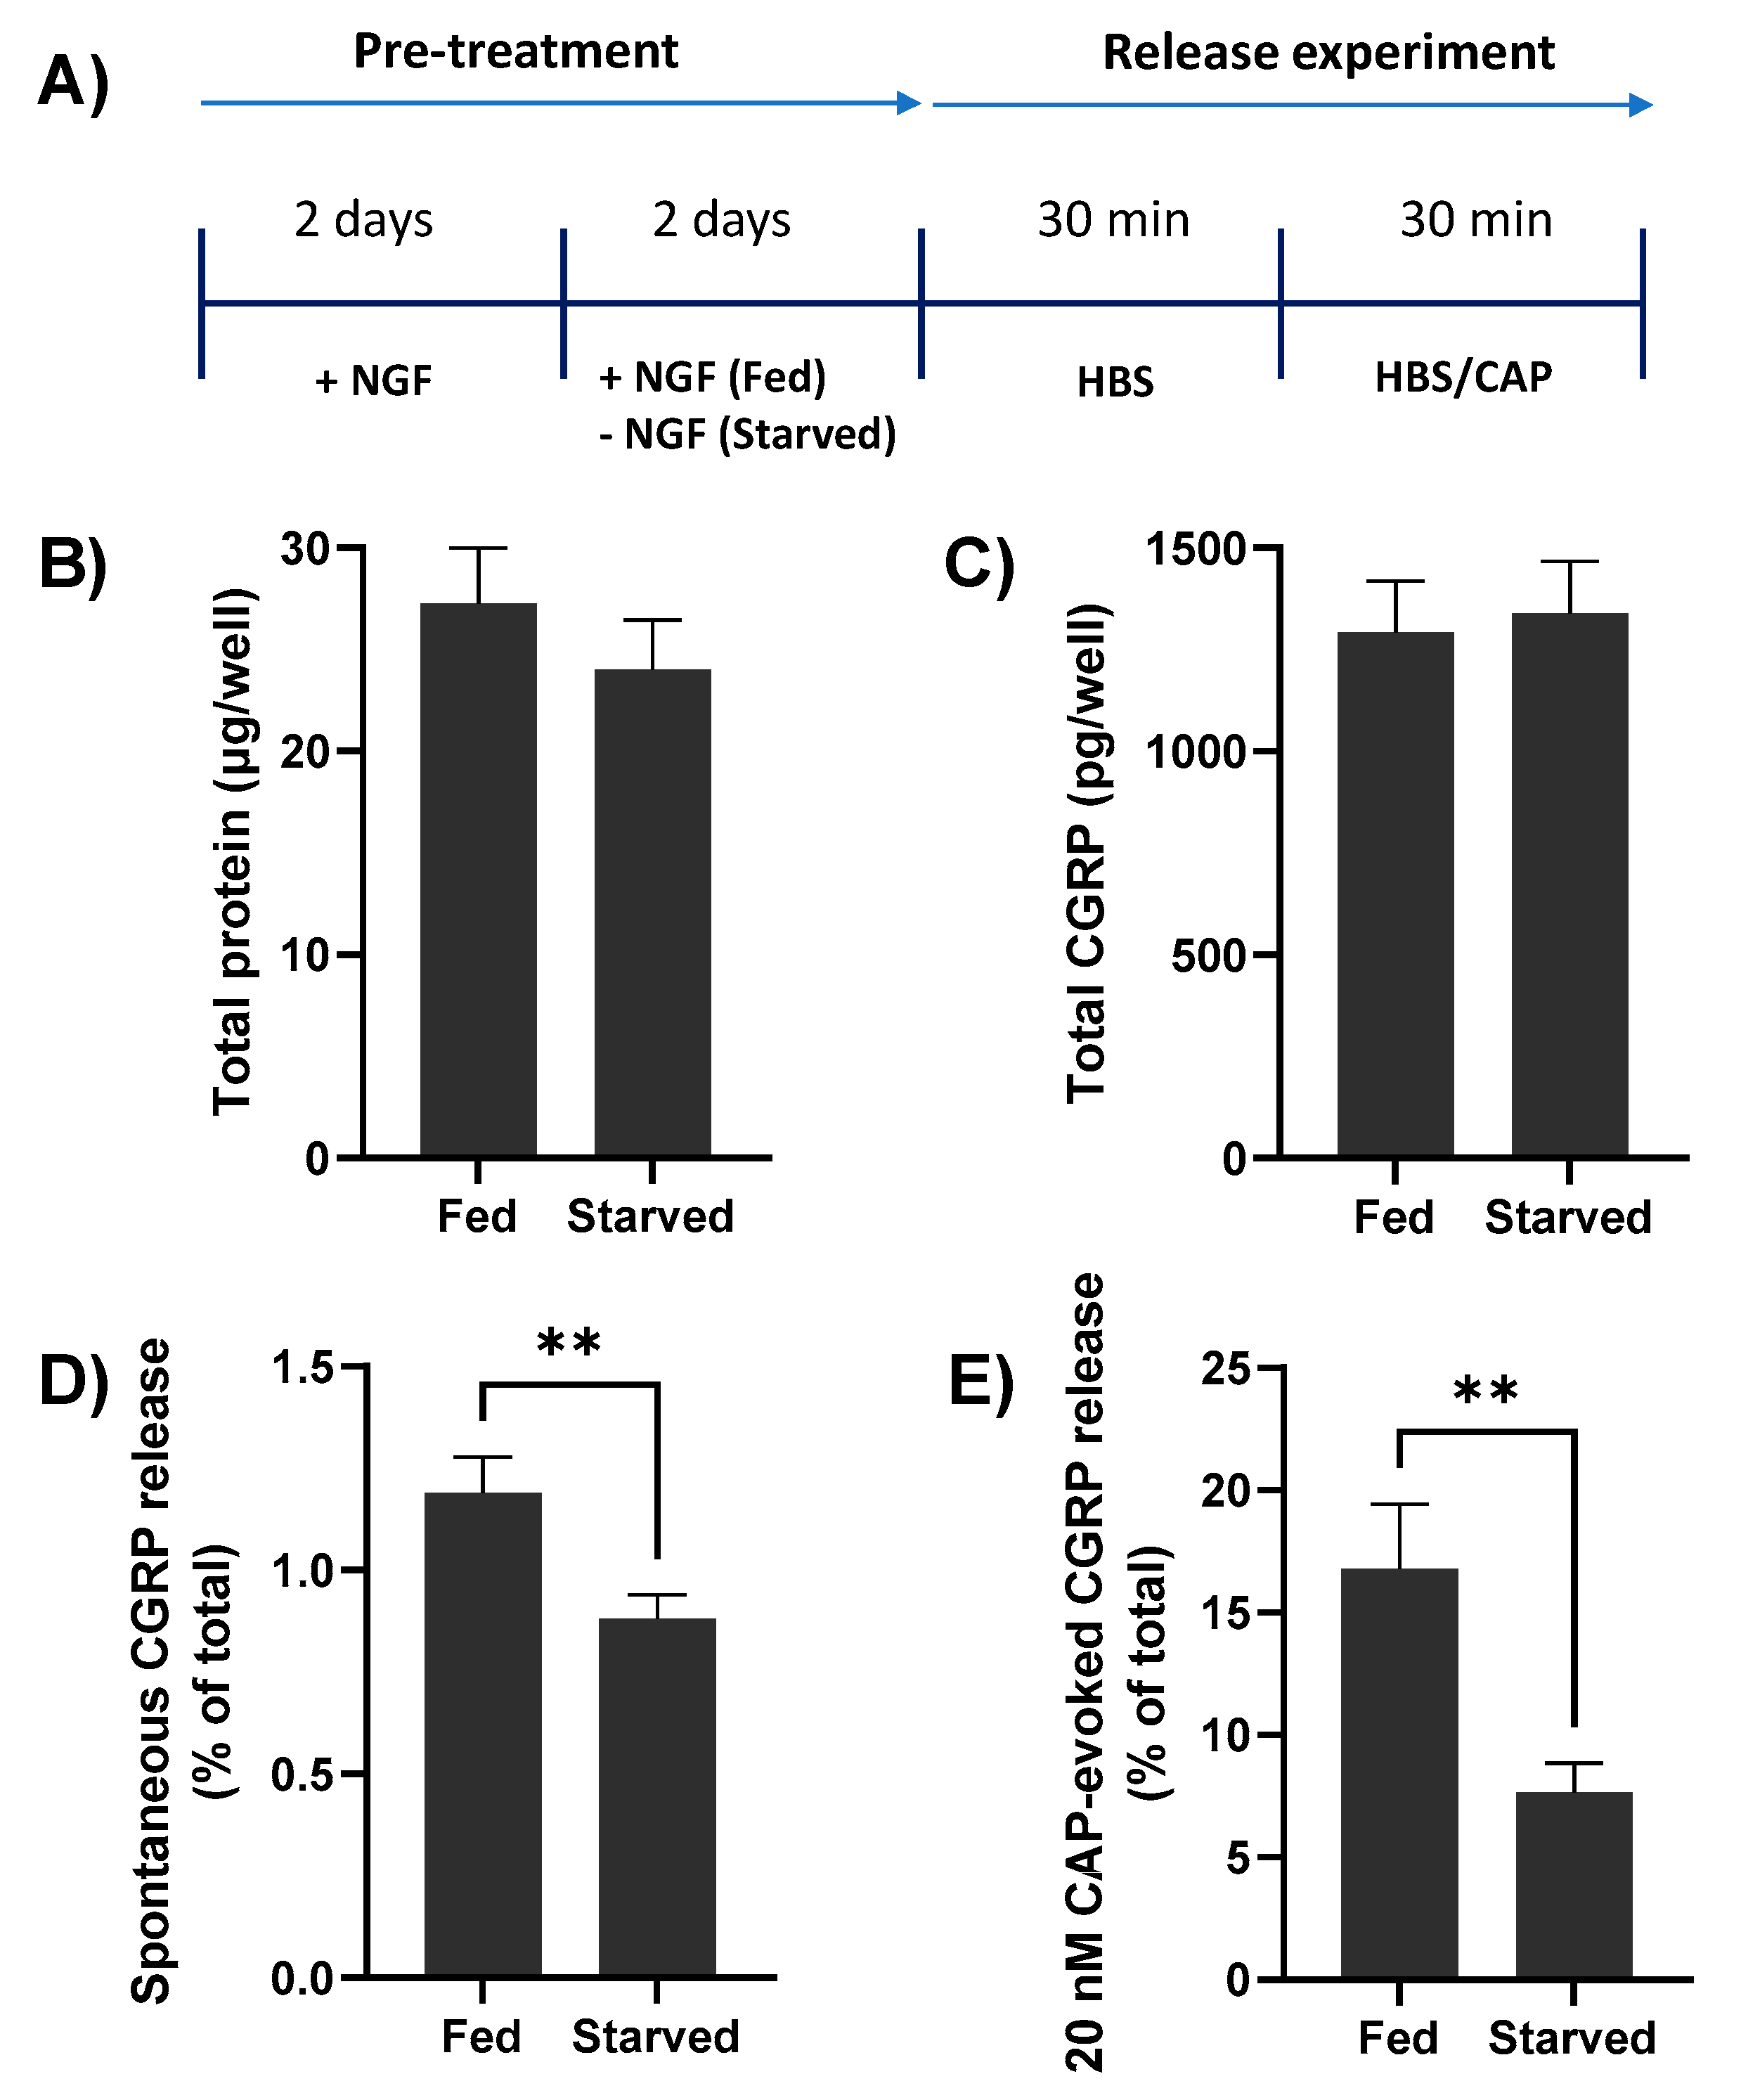
2.2. NGF Withdrawal from TGNs In Vitro Reduces Both Spontaneous and CAP-Evoked CGRP Release
2.3. Depriving TGNs of NGF Reduces the Amount of CGRP Release Evoked by CAP
2.4. Brief Re-Exposure to NGF Induces CGRP Exocytosis from Starved TGNs and Augments the Amount Released in Response to Subsequent Stimulation with CAP
2.5. NGF Requires Extracellular Ca2+ for Inducing CGRP Release but Not Its Enhancement of 20 nM CAP-Evoked CGRP Exocytosis
2.6. BoNT/A Blocks NGF-Induced Release of CGRP and Enhancement of That Stimulated by Low but Not High [CAP]
2.7. Chimera/EA Inhibits CGRP Release Elicited by High [CAP]
3. Discussion
4. Materials and Methods
4.1. Materials
4.2. Isolation and Culturing of Rat TGNs
4.3. NGF Withdrawal from TGNs and Treatment with BoNTs
4.4. Intracellular Ca2+ Imaging
4.5. Incubation of TGNs to Monitor CGRP Release
4.6. Quantification of CGRP by ELISA
4.7. Western Blotting to Quantify ERK1/2 Phosphorylation and SNAP-25 Cleavage
4.8. Quantification of Total Protein Amounts
4.9. Quantification of TRPV1-Expressing Neurons after NGF Starvation
4.10. Data Analysis
Author Contributions
Funding
Institutional Review Board Statement
Informed Consent Statement
Conflicts of Interest
References
- Scott-Solomon, E.; Boehm, E.; Kuruvilla, R. The sympathetic nervous system in development and disease. Nat. Rev. Neurosci. 2021, 22, 685–702. [Google Scholar] [CrossRef]
- Sharma, N.; Flaherty, K.; Lezgiyeva, K.; Wagner, D.E.; Klein, A.M.; Ginty, D.D. The emergence of transcriptional identity in somatosensory neurons. Nature 2020, 577, 392–398. [Google Scholar] [CrossRef]
- Barker, P.A.; Mantyh, P.; Arendt-Nielsen, L.; Viktrup, L.; Tive, L. Nerve Growth Factor Signaling and Its Contribution to Pain. J. Pain Res. 2020, 13, 1223–1241. [Google Scholar] [CrossRef]
- Denk, F.; Bennett, D.L.; McMahon, S.B. Nerve Growth Factor and Pain Mechanisms. Annu. Rev. Neurosci. 2017, 40, 307–325. [Google Scholar] [CrossRef]
- Crawford, L.K.; Caterina, M.J. Functional Anatomy of the Sensory Nervous System: Updates from the Neuroscience Bench. Toxicol. Pathol. 2019, 48, 174–189. [Google Scholar] [CrossRef]
- Dubin, A.E.; Patapoutian, A. Nociceptors: The sensors of the pain pathway. J. Clin. Investig. 2010, 120, 3760–3772. [Google Scholar] [CrossRef] [Green Version]
- Caterina, M.J.; Schumacher, M.A.; Tominaga, M.; Rosen, T.A.; Levine, J.D.; Julius, D. The capsaicin receptor: A heat-activated ion channel in the pain pathway. Nature 1997, 389, 816–824. [Google Scholar] [CrossRef]
- Caterina, M.J.; Leffler, A.; Malmberg, A.B.; Martin, W.J.; Trafton, J.; Petersen-Zeitz, K.R.; Koltzenburg, M.; Basbaum, A.I.; Julius, D. Impaired Nociception and Pain Sensation in Mice Lacking the Capsaicin Receptor. Science 2000, 288, 306–313. [Google Scholar] [CrossRef]
- Davis, J.B.; Gray, J.; Gunthorpe, M.J.; Hatcher, J.P.; Davey, P.T.; Overend, P.; Harries, M.H.; Latcham, J.; Clapham, C.; Atkinson, K.; et al. Vanilloid receptor-1 is essential for inflammatory thermal hyperalgesia. Nature 2000, 405, 183–187. [Google Scholar] [CrossRef]
- Kim, Y.S.; Chu, Y.; Han, L.; Li, M.; Li, Z.; LaVinka, P.C.; Sun, S.; Tang, Z.; Park, K.; Caterina, M.J.; et al. Central Terminal Sensitization of TRPV1 by Descending Serotonergic Facilitation Modulates Chronic Pain. Neuron 2014, 81, 873–887. [Google Scholar] [CrossRef] [Green Version]
- Gold, M.S.; Gebhart, G.F. Nociceptor sensitization in pain pathogenesis. Nat. Med. 2010, 16, 1248–1257. [Google Scholar] [CrossRef]
- Meents, J.E.; Neeb, L.; Reuter, U. TRPV1 in migraine pathophysiology. Trends Mol. Med. 2010, 16, 153–159. [Google Scholar] [CrossRef]
- Lewin, G.L.; Ritter, A.M.; Mendell, L.M. Nerve growth factor-induced hyperalgesia in the neonatal and adult rat. J. Neurosci. 1993, 13, 2136–2148. [Google Scholar] [CrossRef] [PubMed]
- Bergmann, I.; Reiter, R.; Toyka, K.V.; Koltzenburg, M. Nerve growth factor evokes hyperalgesia in mice lacking the low-affinity neurotrophin receptor p75. Neurosci. Lett. 1998, 255, 87–90. [Google Scholar] [CrossRef]
- Bonnington, J.K.; McNaughton, P.A. Signalling pathways involved in the sensitisation of mouse nociceptive neurones by nerve growth factor. J. Physiol. 2003, 551, 433–446. [Google Scholar] [CrossRef]
- Shu, X.; Mendell, L.M. Nerve growth factor acutely sensitizes the response of adult rat sensory neurons to capsaicin. Neurosci. Lett. 1999, 274, 159–162. [Google Scholar] [CrossRef]
- Shu, X.; Mendell, L.M. Acute Sensitization by NGF of the Response of Small-Diameter Sensory Neurons to Capsaicin. J. Neurophysiol. 2001, 86, 2931–2938. [Google Scholar] [CrossRef]
- Zhang, X.; Huang, J.; McNaughton, P.A. NGF rapidly increases membrane expression of TRPV1 heat-gated ion channels. EMBO J. 2005, 24, 4211–4223. [Google Scholar] [CrossRef] [PubMed] [Green Version]
- Chuang, H.-H.; Prescott, E.D.; Kong, H.; Shields, S.; Jordt, S.-E.; Basbaum, A.I.; Chao, M.; Julius, D. Bradykinin and nerve growth factor release the capsaicin receptor from PtdIns(4,5)P2-mediated inhibition. Nature 2001, 411, 957–962. [Google Scholar] [CrossRef] [PubMed]
- Huang, J.; Zhang, X.; McNaughton, P.A. Modulation of temperature-sensitive TRP channels. Semin. Cell Dev. Biol. 2006, 17, 638–645. [Google Scholar] [CrossRef]
- Camprubí-Robles, M.; Planells-Cases, R.; Ferrer-Montiel, A. Differential contribution of SNARE-dependent exocytosis to inflammatory potentiation of TRPV1 in nociceptors. FASEB J. 2009, 23, 3722–3733. [Google Scholar] [CrossRef] [PubMed]
- Morenilla-Palao, C.; Planells-Cases, R.; García-Sanz, N.; Ferrer-Montiel, A. Regulated Exocytosis Contributes to Protein Kinase C Potentiation of Vanilloid Receptor Activity. J. Biol. Chem. 2004, 279, 25665–25672. [Google Scholar] [CrossRef] [PubMed] [Green Version]
- Takayama, Y.; Derouiche, S.; Maruyama, K.; Tominaga, M. Emerging Perspectives on Pain Management by Modulation of TRP Channels and ANO1. Int. J. Mol. Sci. 2019, 20, 3411. [Google Scholar] [CrossRef] [Green Version]
- Edvinsson, L.; Haanes, K.A.; Warfvinge, K.; Krause, D.N. CGRP as the target of new migraine therapies—Successful translation from bench to clinic. Nat. Rev. Neurol. 2018, 14, 338–350. [Google Scholar] [CrossRef]
- Dolly, J.O.; Lawrence, G.W.; Meng, J.; Wang, J.; Ovsepian, S.V. Neuro-exocytosis: Botulinum toxins as inhibitory probes and versatile therapeutics. Curr. Opin. Pharmacol. 2009, 9, 326–335. [Google Scholar] [CrossRef] [PubMed]
- Dolly, J.O.; O’Connell, M.A. Neurotherapeutics to inhibit exocytosis from sensory neurons for the control of chronic pain. Curr. Opin. Pharmacol. 2012, 12, 100–108. [Google Scholar] [CrossRef]
- Becker, W.J. Botulinum Toxin in the Treatment of Headache. Toxins 2020, 12, 803. [Google Scholar] [CrossRef]
- Diener, H.C.; Dodick, D.W.; Aurora, S.K.; Turkel, C.C.; DeGryse, R.E.; Lipton, R.B.; Silberstein, S.D.; Brin, M.F. OnabotulinumtoxinA for treatment of chronic migraine: Results from the double-blind, randomized, placebo-controlled phase of the PREEMPT 2 trial. Cephalalgia 2010, 30, 804–814. [Google Scholar] [CrossRef]
- Dodick, D.W.; Turkel, C.C.; Ms, R.E.D.; Aurora, S.K.; Silberstein, S.D.; Lipton, R.B.; Diener, H.-C.; Brin, M.F. OnabotulinumtoxinA for Treatment of Chronic Migraine: Pooled Results from the Double-Blind, Randomized, Placebo-Controlled Phases of the PREEMPT Clinical Program. Headache J. Head Face Pain 2010, 50, 921–936. [Google Scholar] [CrossRef] [PubMed]
- Cernuda-Morollón, E.; Ramón, C.; Martínez-Camblor, P.; Serrano-Pertierra, E.; Larrosa, D.; Pascual, J. OnabotulinumtoxinA decreases interictal CGRP plasma levels in patients with chronic migraine. Pain 2015, 156, 820–824. [Google Scholar] [CrossRef] [PubMed]
- Hayashi, T.; McMahon, H.; Yamasaki, S.; Binz, T.; Hata, Y.; Südhof, T.; Niemann, H. Synaptic vesicle membrane fusion complex: Action of clostridial neurotoxins on assembly. EMBO J. 1994, 13, 5051–5061. [Google Scholar] [CrossRef]
- Meng, J.; Ovsepian, S.V.; Wang, J.; Pickering, M.; Sasse, A.; Aoki, K.R.; Lawrence, G.W.; Dolly, J.O. Activation of TRPV1 Mediates Calcitonin Gene-Related Peptide Release, Which Excites Trigeminal Sensory Neurons and Is Attenuated by a Retargeted Botulinum Toxin with Anti-Nociceptive Potential. J. Neurosci. 2009, 29, 4981–4992. [Google Scholar] [CrossRef]
- Sakaba, T.; Stein, A.; Jahn, R.; Neher, E. Distinct Kinetic Changes in Neurotransmitter Release After SNARE Protein Cleavage. Science 2005, 309, 491–494. [Google Scholar] [CrossRef] [PubMed] [Green Version]
- Dong, M.; Liu, H.; Tepp, W.H.; Johnson, E.A.; Janz, R.; Chapman, E.R. Glycosylated SV2A and SV2B Mediate the Entry of Botulinum Neurotoxin E into Neurons. Mol. Biol. Cell 2008, 19, 5226–5237. [Google Scholar] [CrossRef] [PubMed] [Green Version]
- Dong, M.; Yeh, F.; Tepp, W.H.; Dean, C.; Johnson, E.A.; Janz, R.; Chapman, E.R. SV2 Is the Protein Receptor for Botulinum Neurotoxin, A. Science 2006, 312, 592–596. [Google Scholar] [CrossRef] [PubMed]
- Wang, J.; Meng, J.; Lawrence, G.W.; Zurawski, T.H.; Sasse, A.; Bodeker, M.O.; Gilmore, M.A.; Fernández-Salas, E.; Francis, J.; Steward, L.E.; et al. Novel Chimeras of Botulinum Neurotoxins A and E Unveil Contributions from the Binding, Translocation, and Protease Domains to Their Functional Characteristics. J. Biol. Chem. 2008, 283, 16993–17002. [Google Scholar] [CrossRef] [Green Version]
- Meng, J.; Wang, J.; Lawrence, G.; Dolly, J.O. Synaptobrevin I mediates exocytosis of CGRP from sensory neurons and inhibition by botulinum toxins reflects their anti-nociceptive potential. J. Cell Sci. 2007, 120, 2864–2874. [Google Scholar] [CrossRef] [PubMed] [Green Version]
- Rasetti-Escargueil, C.; Popoff, M.R. Engineering Botulinum Neurotoxins for Enhanced Therapeutic Applications and Vaccine Development. Toxins 2020, 13, 1. [Google Scholar] [CrossRef]
- Nugent, M.; Yusef, Y.R.; Meng, J.; Wang, J.; Dolly, J.O. A SNAP-25 cleaving chimera of botulinum neurotoxin /A and /E prevents TNFα−induced elevation of the activities of native TRP channels on early postnatal rat dorsal root ganglion neurons. Neuropharmacology 2018, 138, 257–266. [Google Scholar] [CrossRef]
- Meng, J.; Wang, J.; Steinhoff, M.; Dolly, J.O. TNFα induces co-trafficking of TRPV1/TRPA1 in VAMP1-containing vesicles to the plasmalemma via Munc18–1/syntaxin1/SNAP-25 mediated fusion. Sci. Rep. 2016, 6, 21226. [Google Scholar] [CrossRef]
- Cholewinski, A.; Burgess, G.M.; Bevan, S. The role of calcium in capsaicin-induced desensitization in rat cultured dorsal root ganglion neurons. Neuroscience 1993, 55, 1015–1023. [Google Scholar] [CrossRef]
- Zhu, W.; Oxford, G.S. Phosphoinositide-3-kinase and mitogen activated protein kinase signaling pathways mediate acute NGF sensitization of TRPV1. Mol. Cell. Neurosci. 2007, 34, 689–700. [Google Scholar] [CrossRef] [Green Version]
- Bannwarth, B.; Kostine, M. Nerve Growth Factor Antagonists: Is the Future of Monoclonal Antibodies Becoming Clearer? Drugs 2017, 77, 1377–1387. [Google Scholar] [CrossRef] [PubMed]
- Huang, J.; Zhang, X.; McNaughton, P.A. Inflammatory Pain: The Cellular Basis of Heat Hyperalgesia. Curr. Neuropharmacol. 2006, 4, 197–206. [Google Scholar] [CrossRef]
- Russell, F.A.; King, R.; Smillie, S.-J.; Kodji, X.; Brain, S.D. Calcitonin Gene-Related Peptide: Physiology and Pathophysiology. Physiol. Rev. 2014, 94, 1099–1142. [Google Scholar] [CrossRef] [Green Version]
- Richardson, J.D.; Vasko, M.R. Cellular Mechanisms of Neurogenic Inflammation. J. Pharmacol. Exp. Ther. 2002, 302, 839–845. [Google Scholar] [CrossRef] [PubMed] [Green Version]
- Price, T.J.; Louria, M.D.; Candelario-Soto, D.; Dussor, G.O.; Jeske, N.A.; Patwardhan, A.M.; Diogenes, A.; Trott, A.A.; Hargreaves, K.M.; Flores, C.M. Treatment of trigeminal ganglion neurons in vitro with NGF, GDNF or BDNF: Effects on neuronal survival, neurochemical properties and TRPV1-mediated neuropeptide secretion. BMC Neurosci. 2005, 6, 4. [Google Scholar] [CrossRef] [Green Version]
- Park, K.A.; Fehrenbacher, J.C.; Thompson, E.L.; Duarte, D.B.; Hingtgen, C.L.; Vasko, M. Signaling pathways that mediate nerve growth factor-induced increase in expression and release of calcitonin gene-related peptide from sensory neurons. Neuroscience 2010, 171, 910–923. [Google Scholar] [CrossRef] [PubMed] [Green Version]
- Tian, Q.; Hu, J.; Xie, C.; Mei, K.; Pham, C.; Mo, X.; Hepp, R.; Soares, S.; Nothias, F.; Wang, Y.; et al. Recovery from tachyphylaxis of TRPV1 coincides with recycling to the surface membrane. Proc. Natl. Acad. Sci. USA 2019, 116, 5170–5175. [Google Scholar] [CrossRef] [Green Version]
- Devesa, I.; Ferrándiz-Huertas, C.; Mathivanan, S.; Wolf, C.; Luján, R.; Changeux, J.-P.; Ferrer-Montiel, A. αCGRP is essential for algesic exocytotic mobilization of TRPV1 channels in peptidergic nociceptors. Proc. Natl. Acad. Sci. USA 2014, 111, 18345–18350. [Google Scholar] [CrossRef] [Green Version]
- Lawrence, G.W.; Zurawski, T.H.; Dolly, J.O. Ca2+ Signalling Induced by NGF Identifies a Subset of Capsaicin-Excitable Neurons Displaying Enhanced Chemo-Nociception in Dorsal Root Ganglion Explants from Adult pirt-GCaMP3 Mouse. Int. J. Mol. Sci. 2021, 22, 2589. [Google Scholar] [CrossRef] [PubMed]
- Egea, J.; Espinet, C.; Soler, R.M.; Peiró, S.; Rocamora, N.; Comella, J.X. Nerve Growth Factor Activation of the Extracellular Signal-Regulated Kinase Pathway Is Modulated by Ca2+ and Calmodulin. Mol. Cell. Biol. 2000, 20, 1931–1946. [Google Scholar] [CrossRef] [PubMed] [Green Version]
- Pandiella-Alonso, A.; Malgaroli, A.; Vicentini, L.M.; Meldolesi, J. Early rise of cytosolic Ca2+ induced by NGF in PC12 and chromaffin cells. FEBS Lett. 1986, 208, 48–51. [Google Scholar] [CrossRef] [Green Version]
- Jiang, H.; Guroff, G. Actions of the neurotrophins on calcium uptake. J. Neurosci. Res. 1997, 50, 355–360. [Google Scholar] [CrossRef]
- Benemei, S.; Dussor, G. TRP Channels and Migraine: Recent Developments and New Therapeutic Opportunities. Pharmaceuticals 2019, 12, 54. [Google Scholar] [CrossRef] [Green Version]
- Fabbretti, E.; D’Arco, M.; Fabbro, A.; Simonetti, M.; Nistri, A.; Giniatullin, R. Delayed Upregulation of ATP P2X3 Receptors of Trigeminal Sensory Neurons by Calcitonin Gene-Related Peptide. J. Neurosci. 2006, 26, 6163–6171. [Google Scholar] [CrossRef] [PubMed] [Green Version]
- Wang, J.; Casals-Diaz, L.; Zurawski, T.; Meng, J.; Moriarty, O.; Nealon, J.; Edupuganti, O.P.; Dolly, O. A novel therapeutic with two SNAP-25 inactivating proteases shows long-lasting anti-hyperalgesic activity in a rat model of neuropathic pain. Neuropharmacology 2017, 118, 223–232. [Google Scholar] [CrossRef] [PubMed]
- Foster, K.; Chaddock, J. Targeted Secretion Inhibitors—Innovative Protein Therapeutics. Toxins 2010, 2, 2795–2815. [Google Scholar] [CrossRef] [Green Version]
- Eckert, S.P.; Taddese, A.; McCleskey, E.W. Isolation and culture of rat sensory neurons having distinct sensory modalities. J. Neurosci. Methods 1997, 77, 183–190. [Google Scholar] [CrossRef]
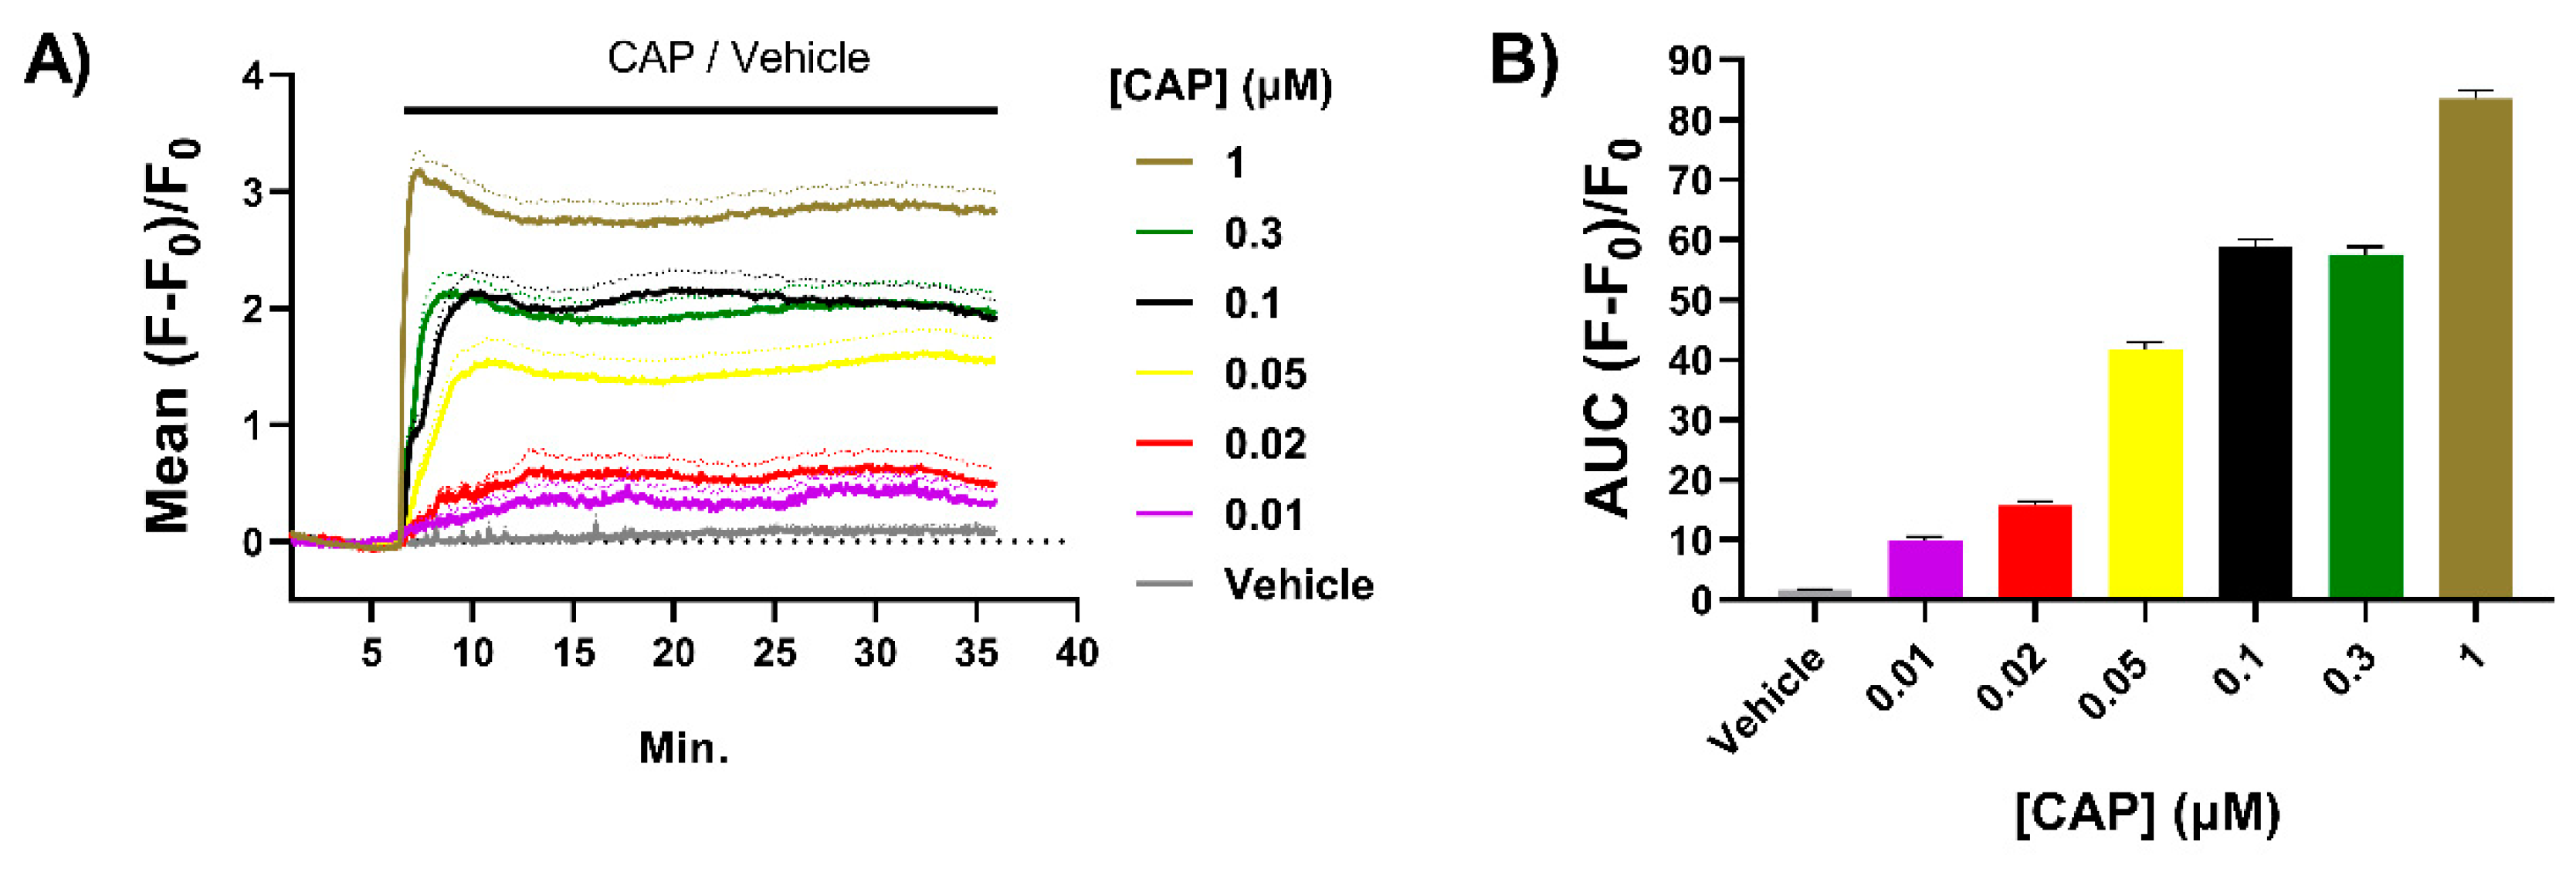
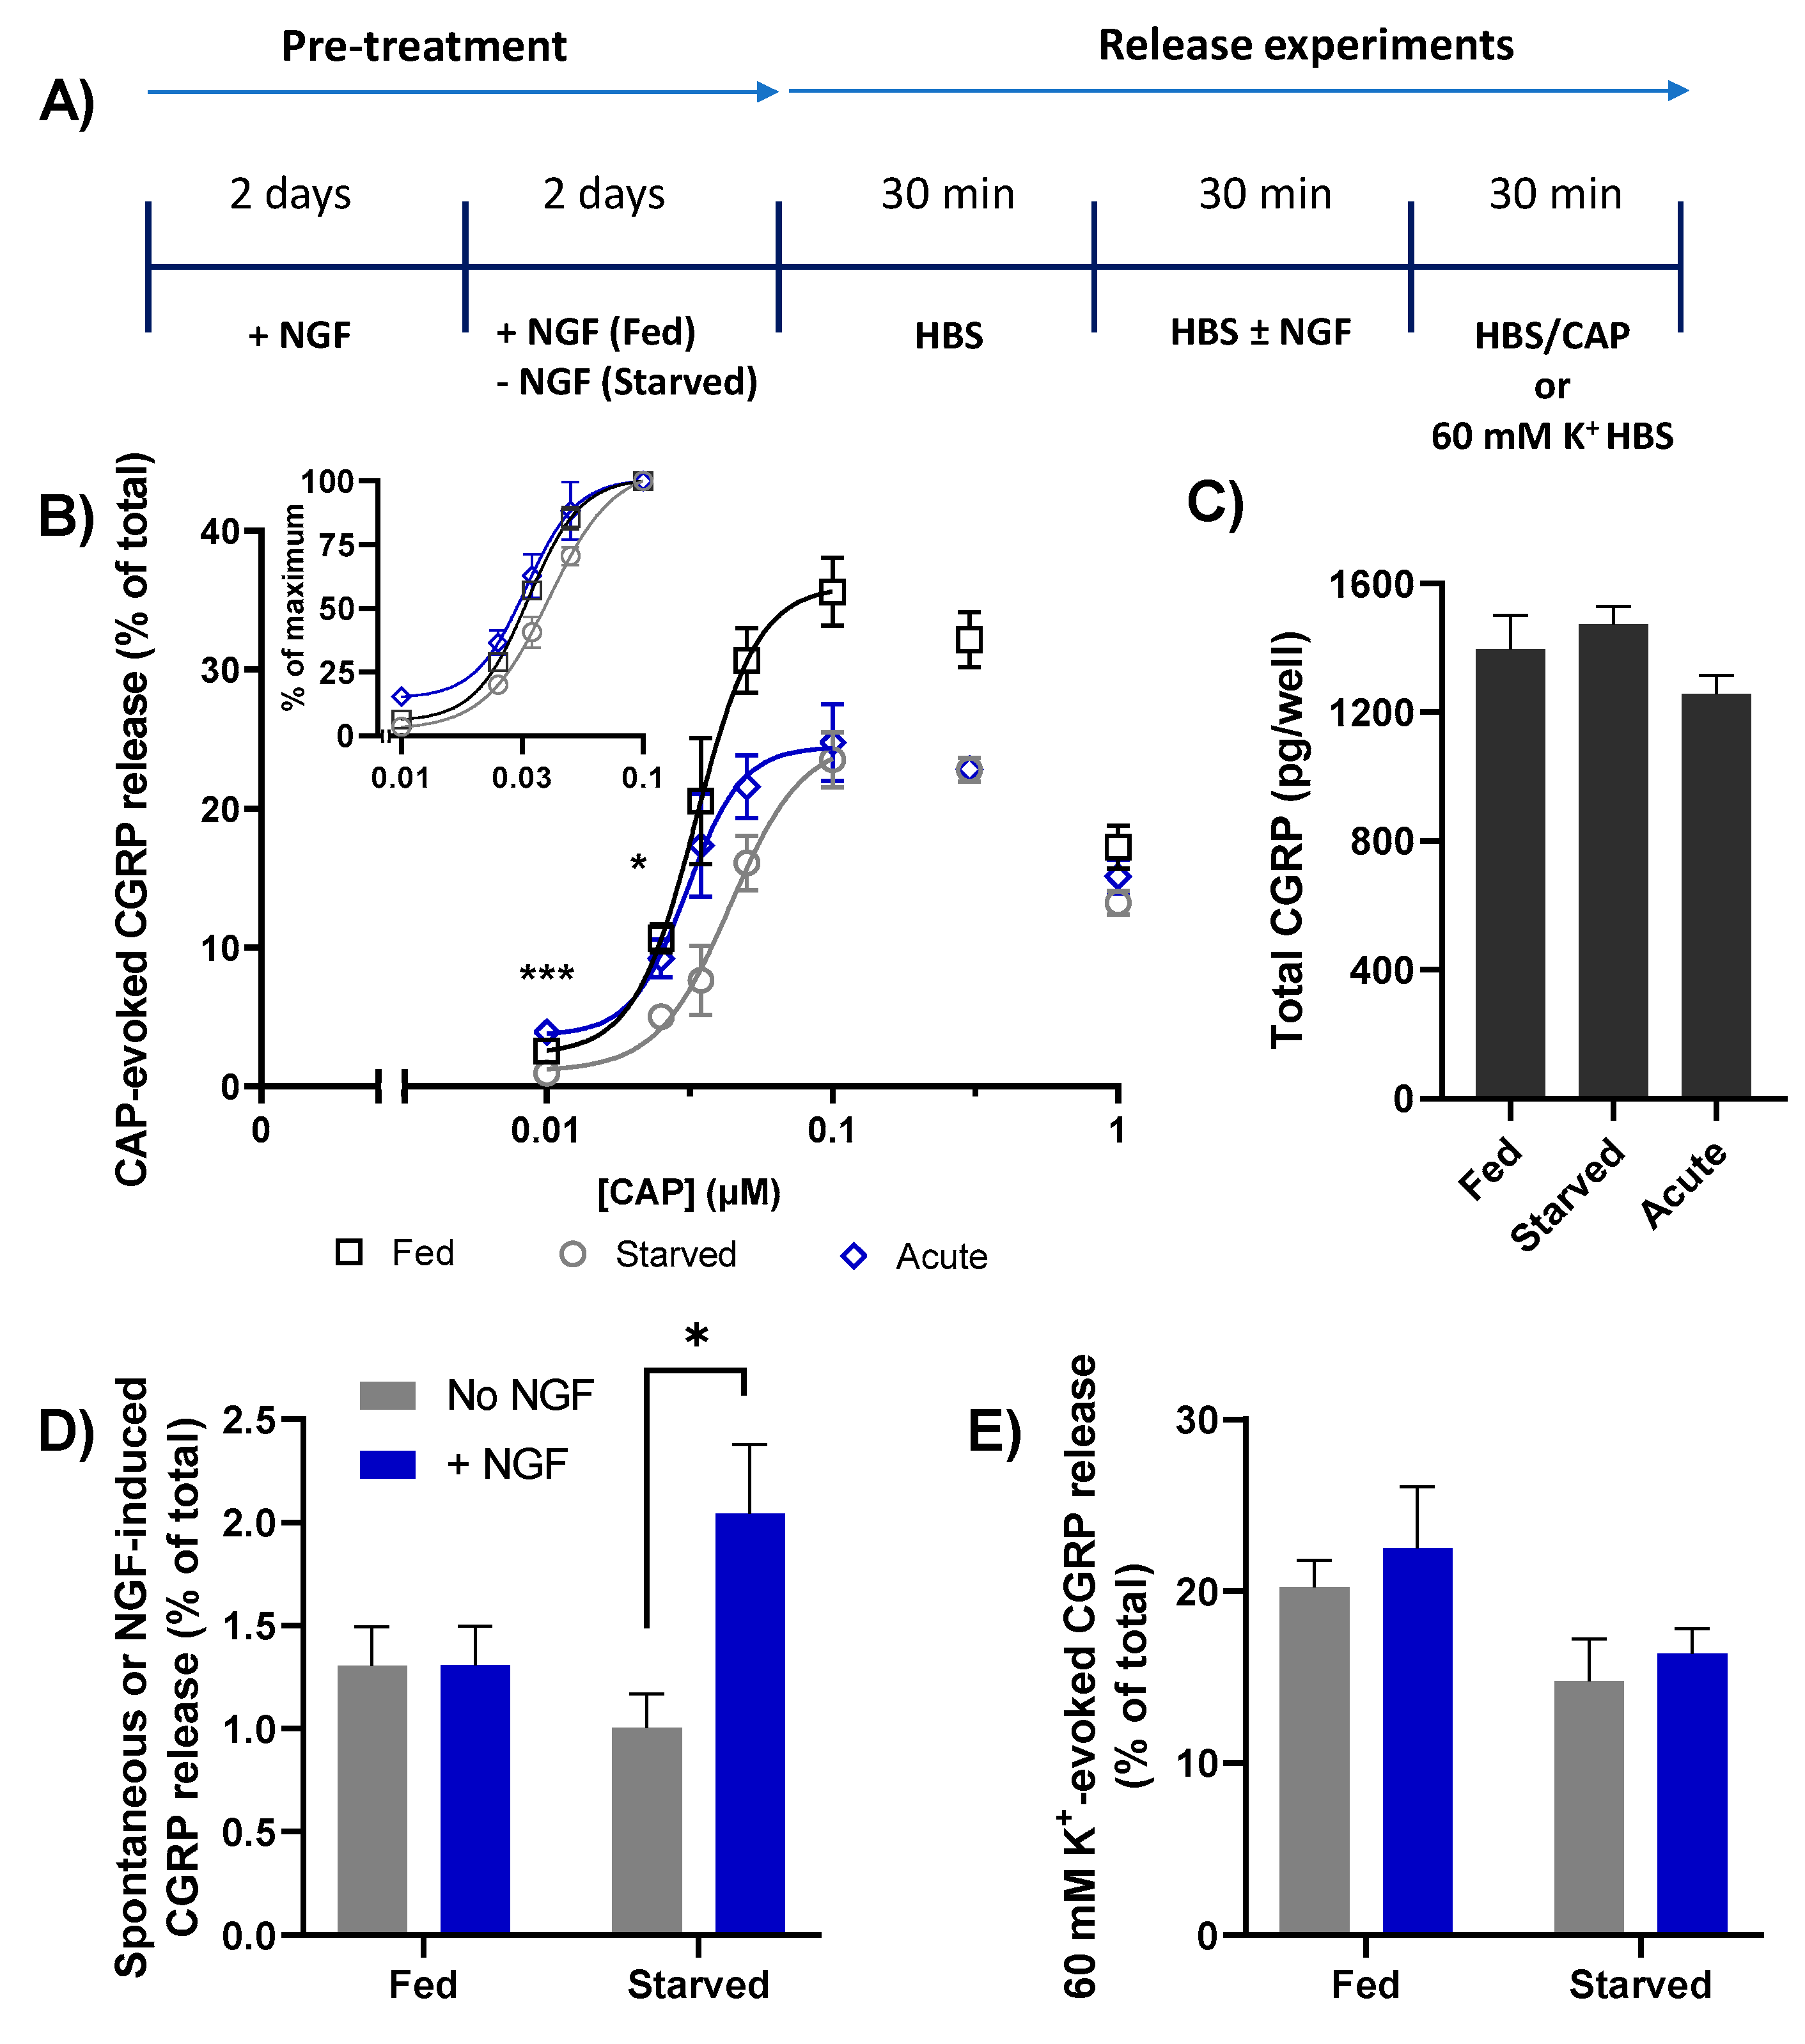
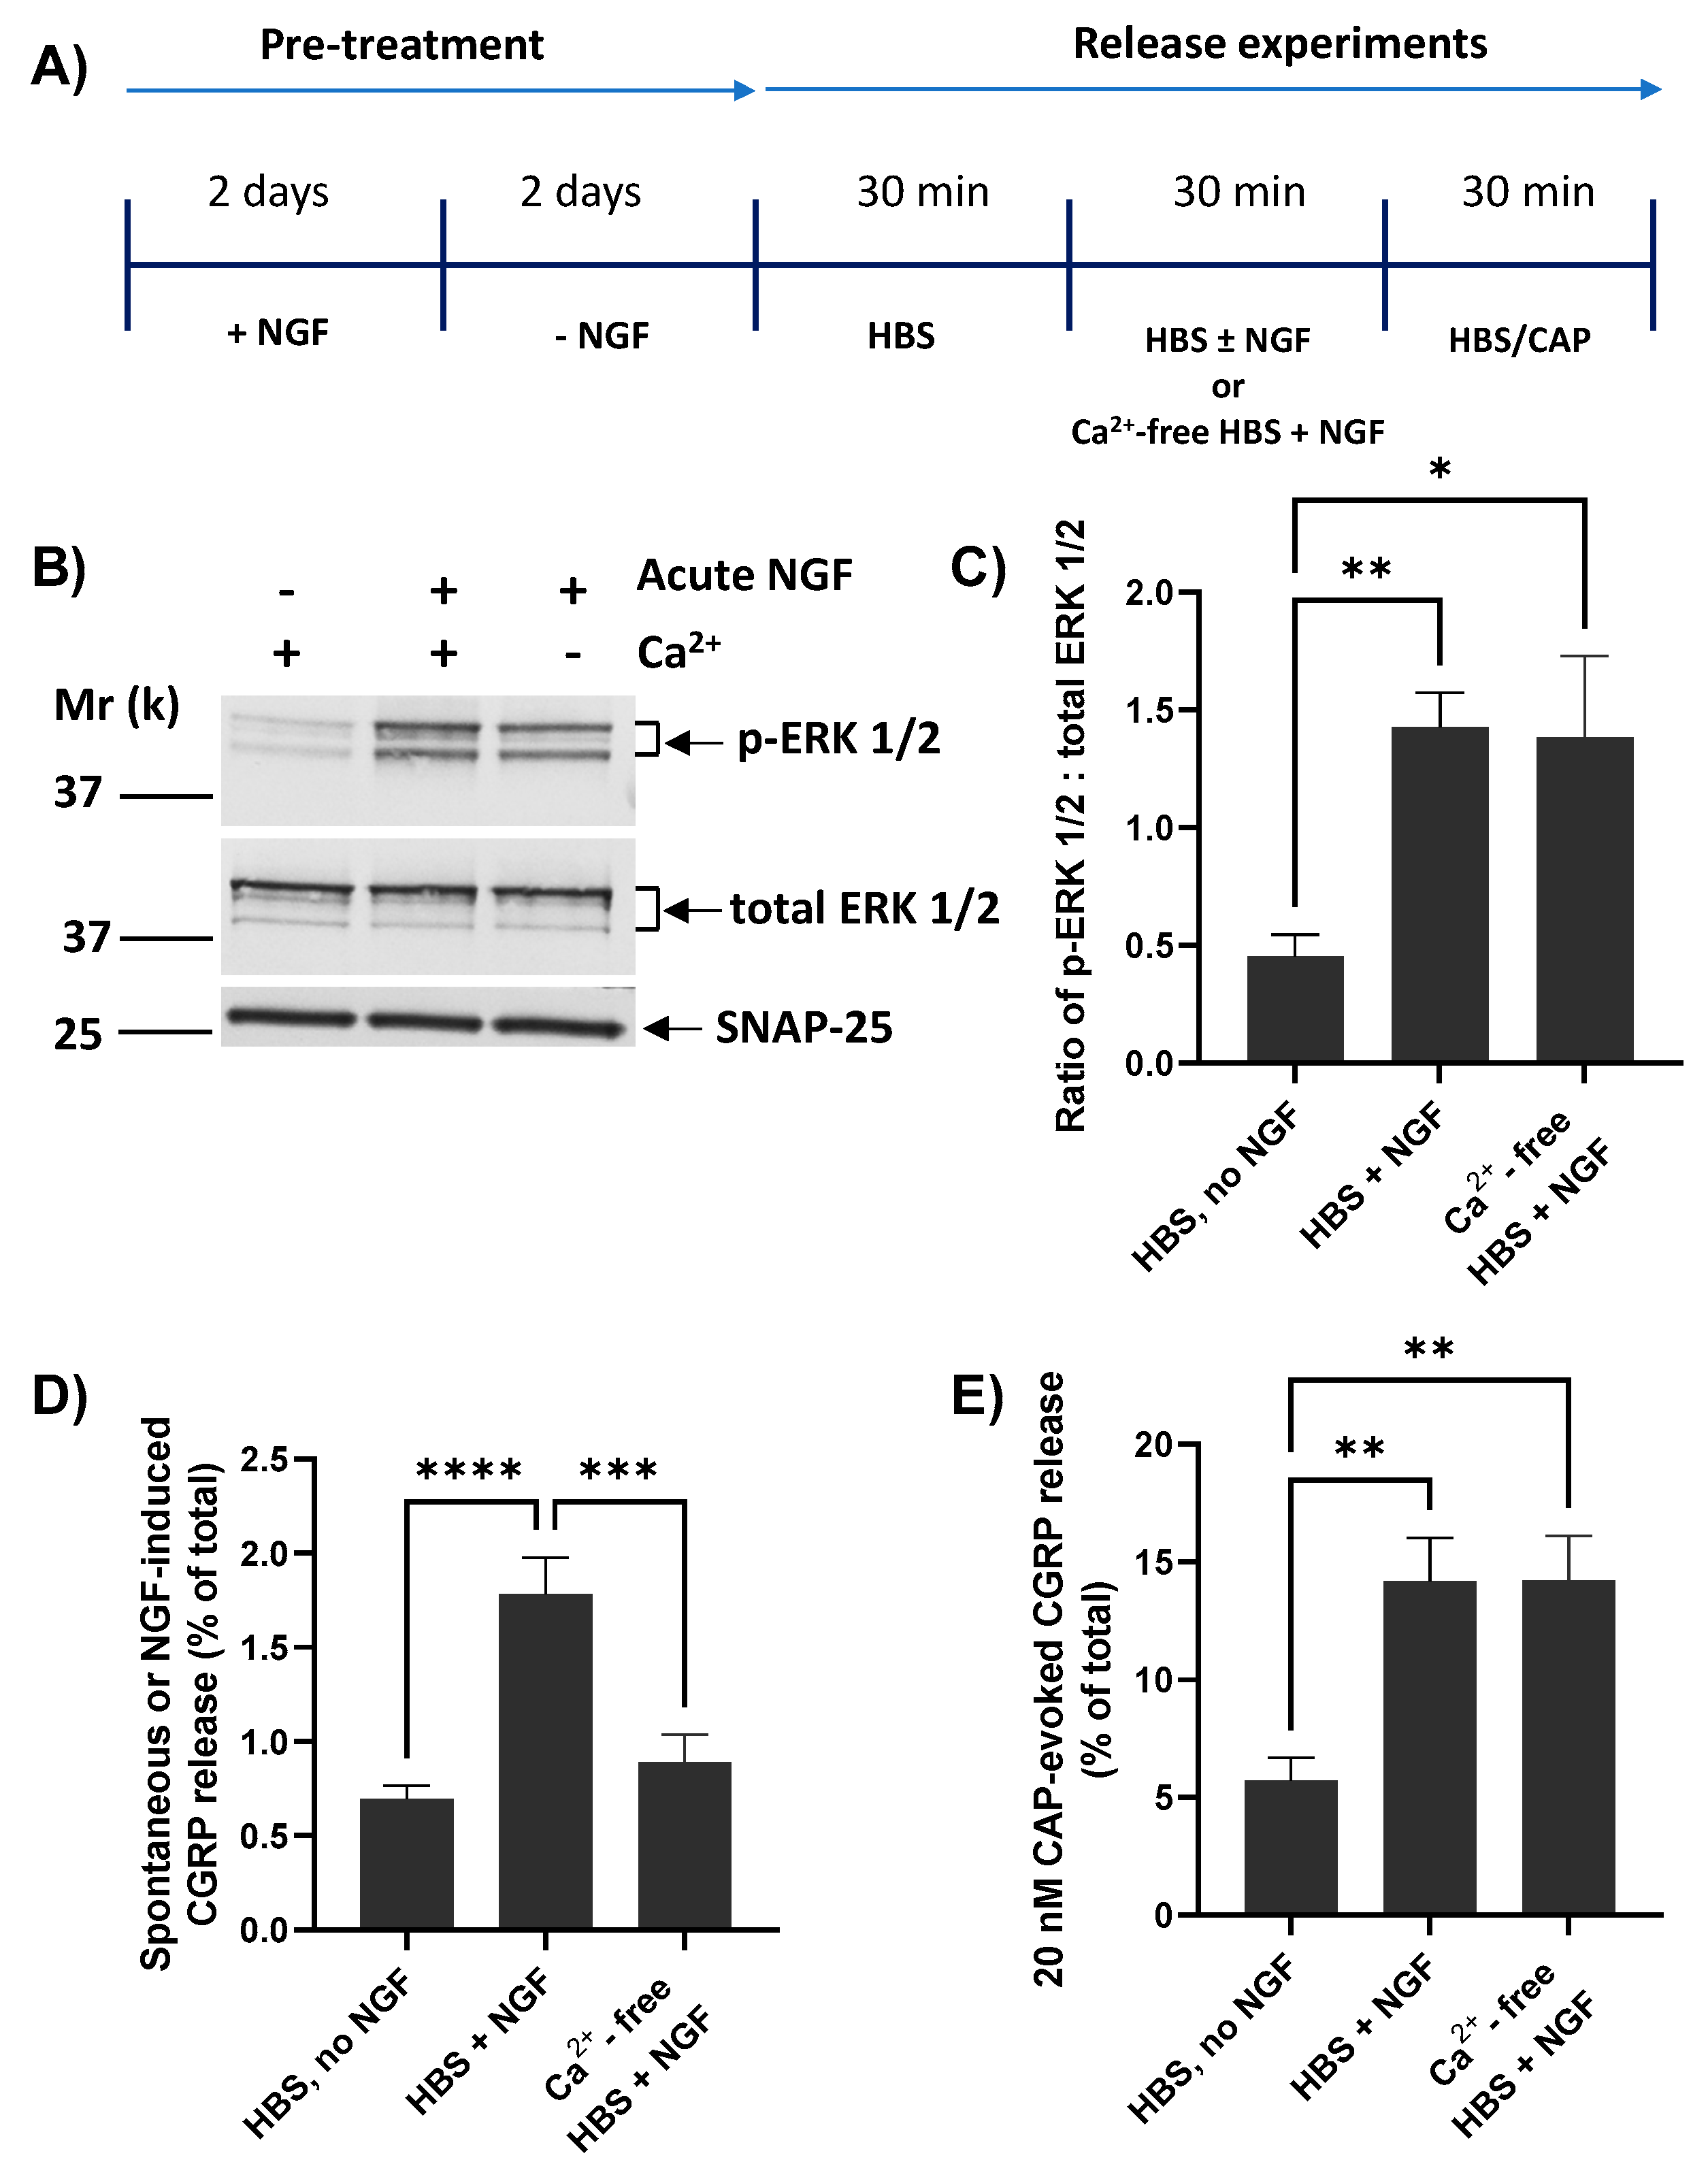
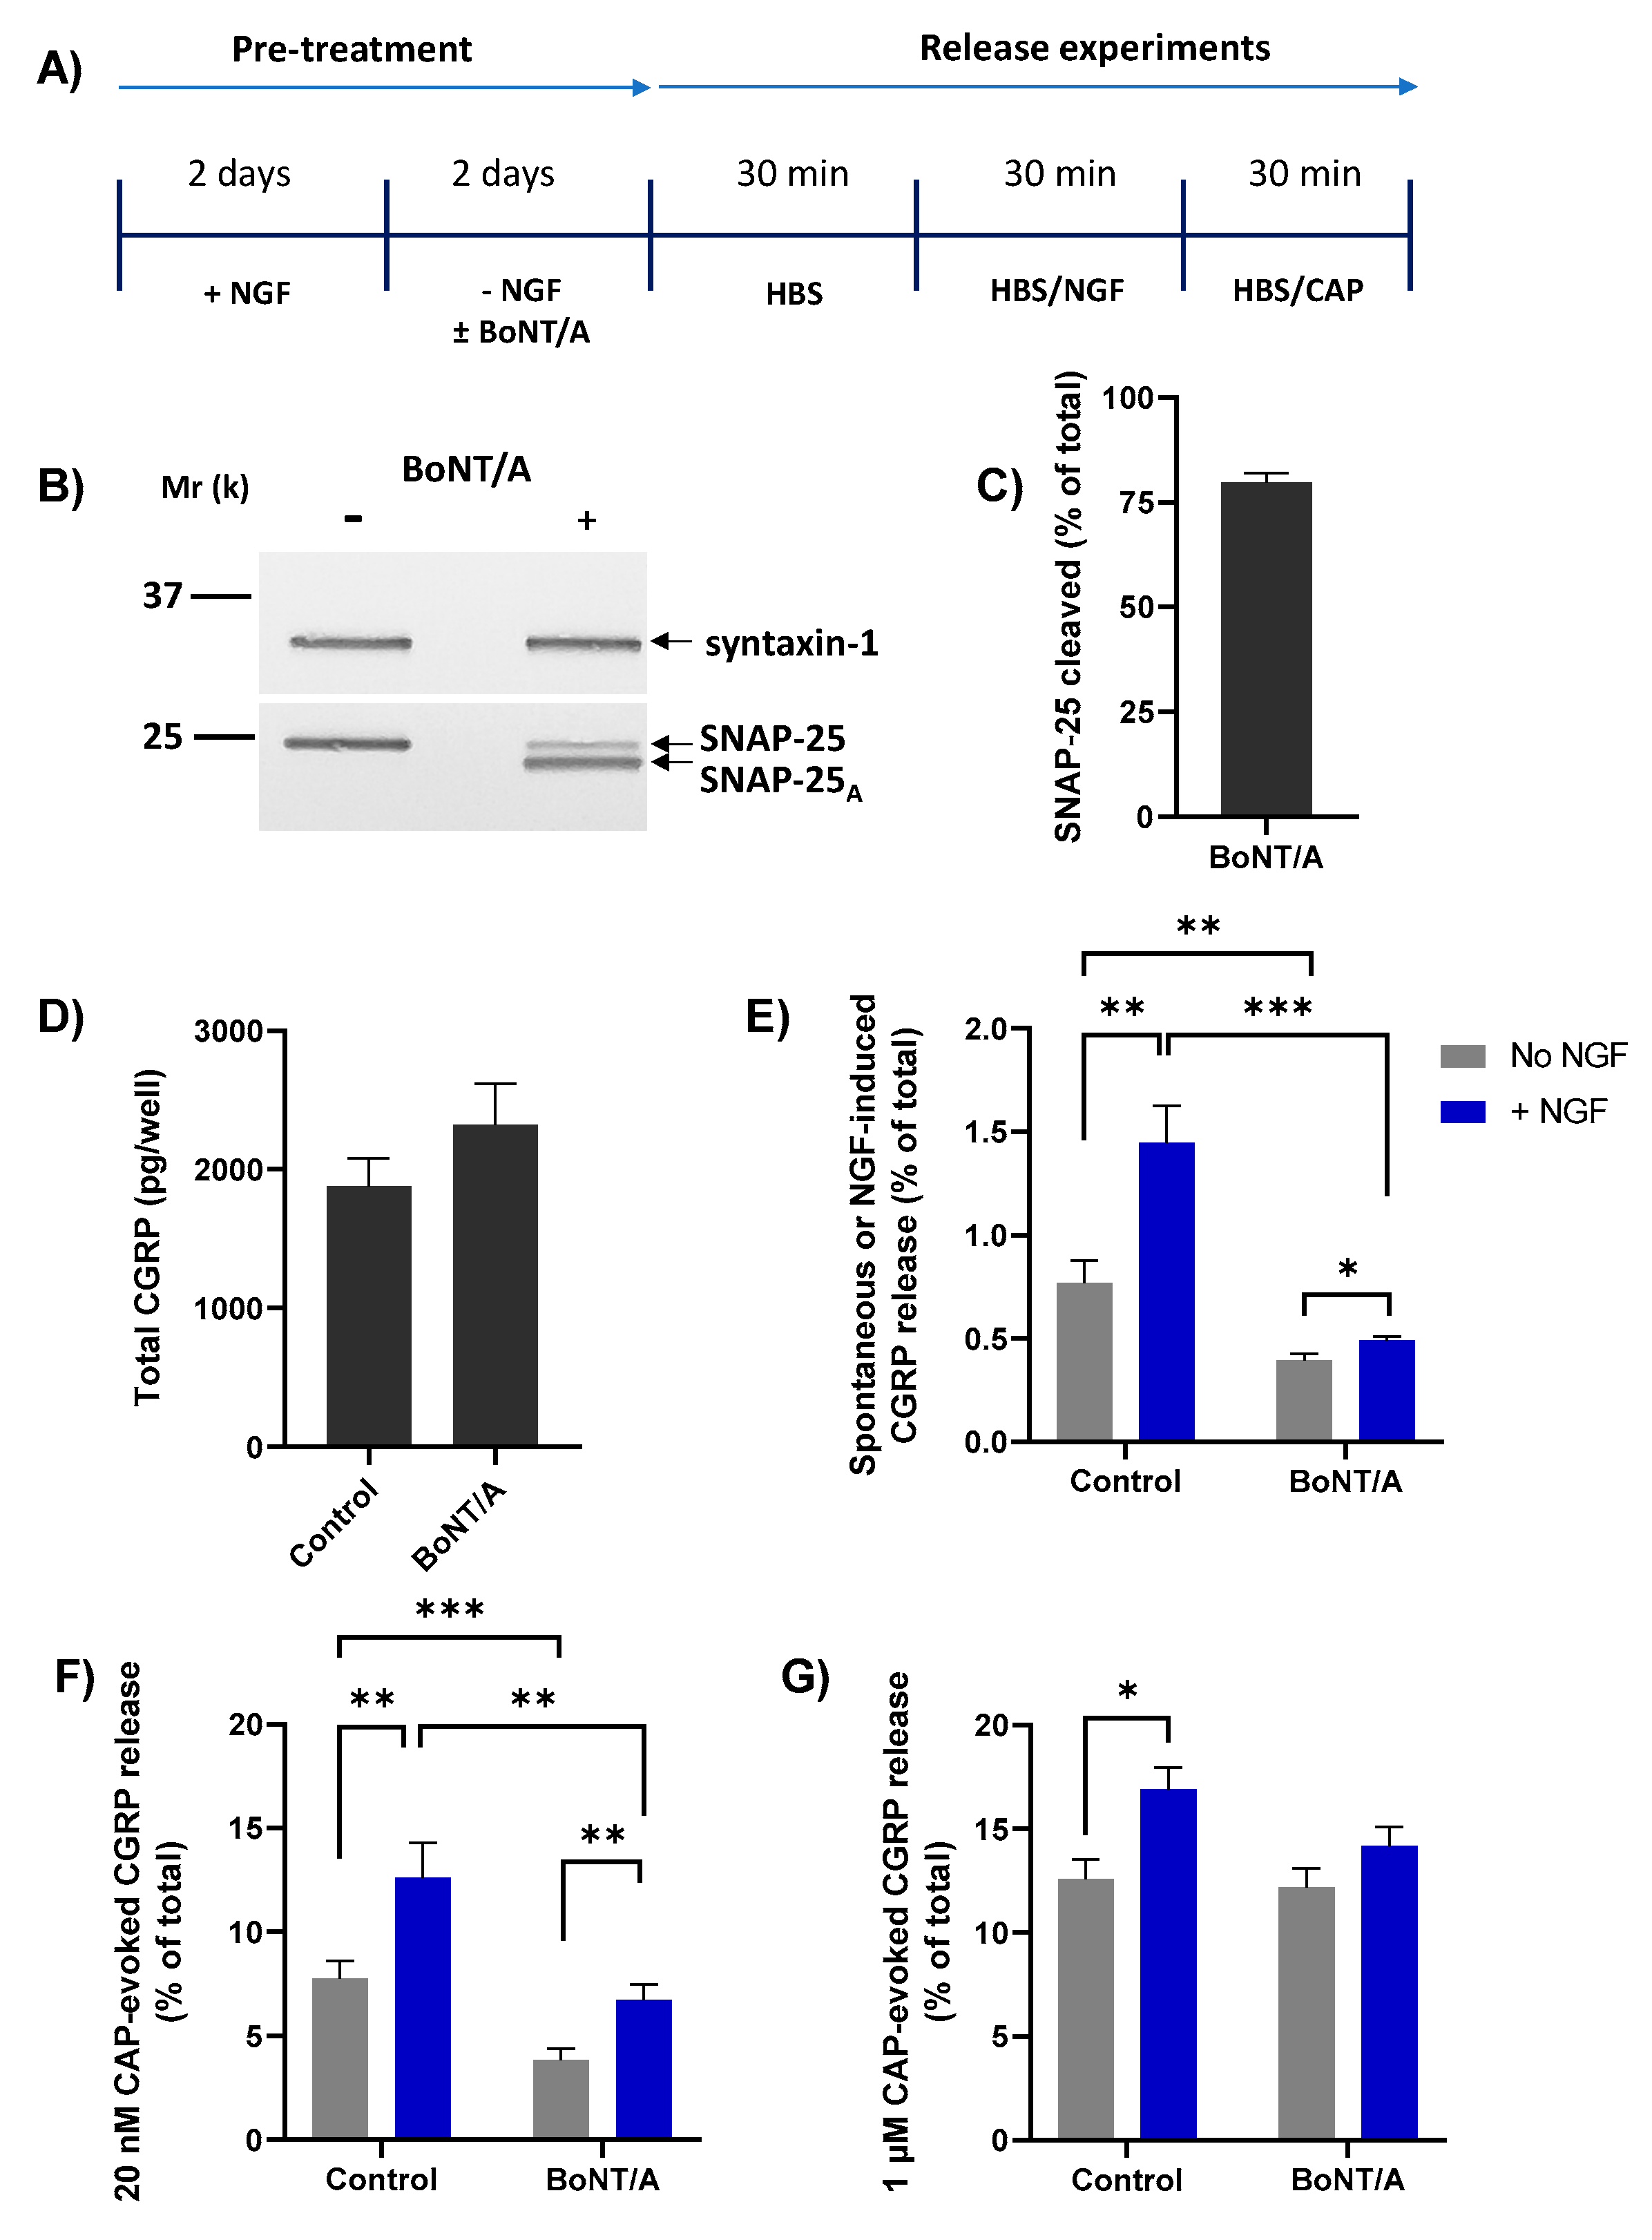
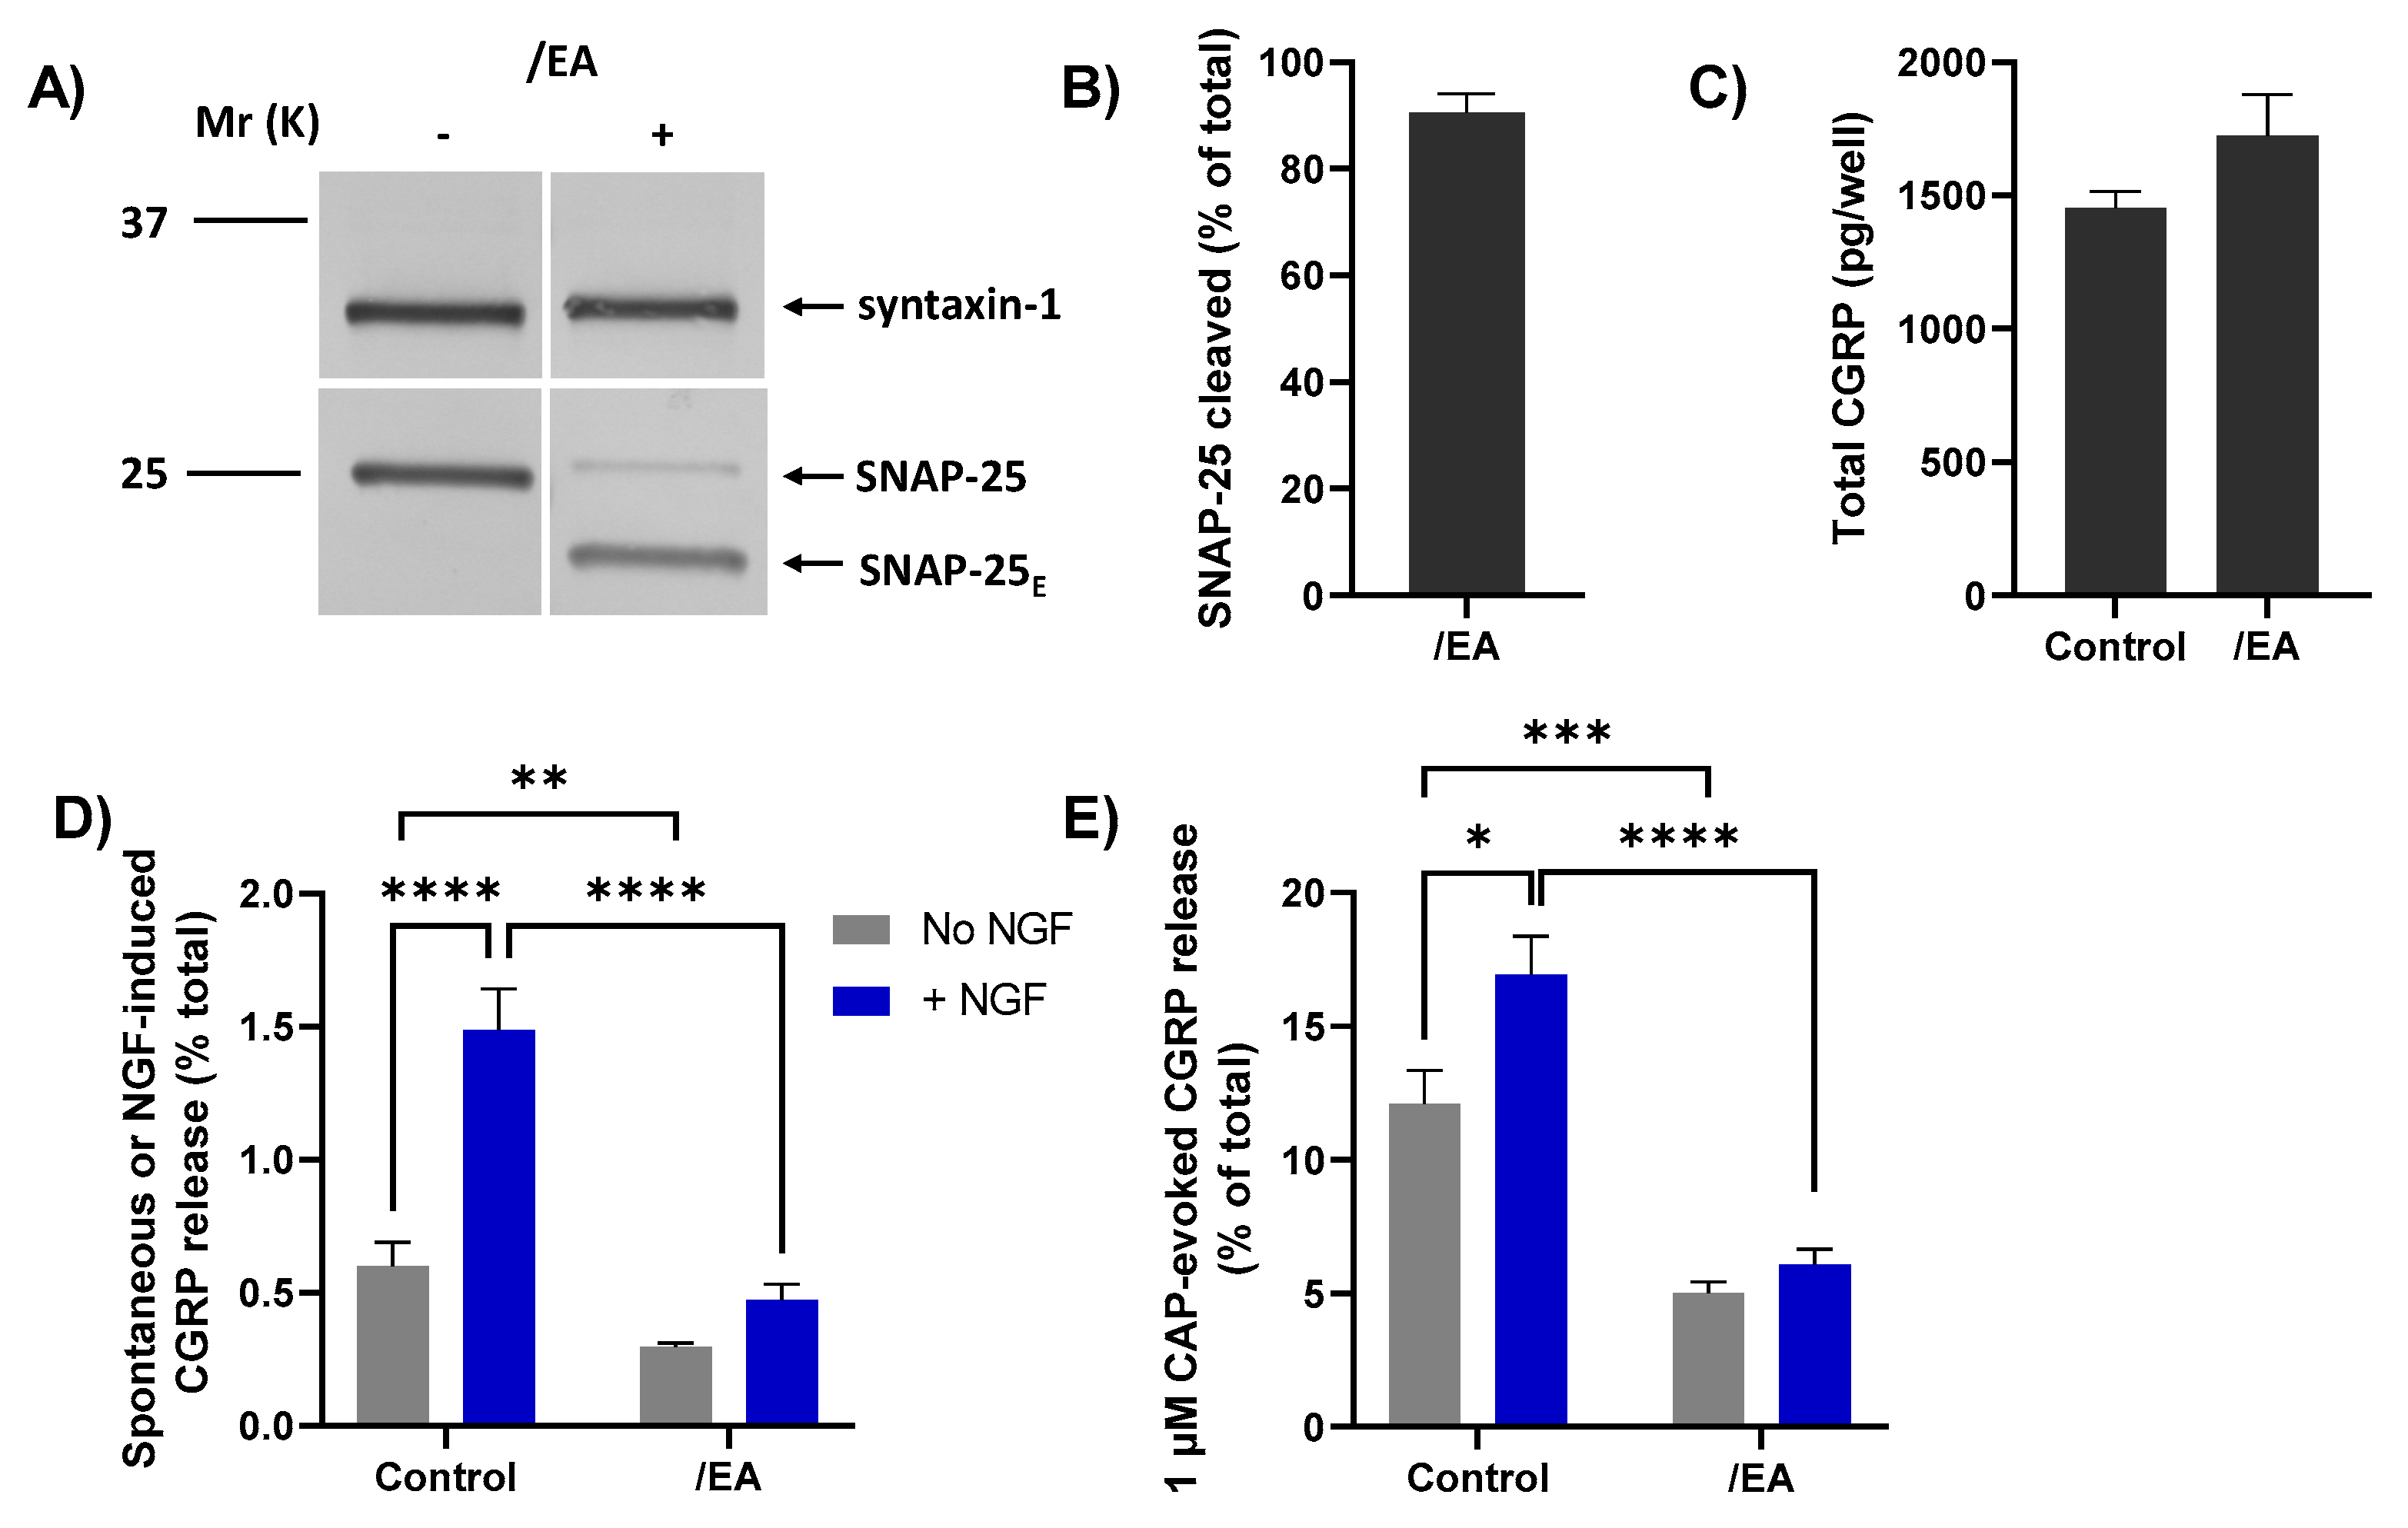
 ) (arrow with crosses, centre). Stronger stimulation of TRPV1 with 1 µM CAP ( ) induces a lot more Ca2+ influx ([Ca2+]i, ([Ca2+]i, ([Ca2+]i; Figure 1) which causes a moderate increase in CGRP release but overcomes the inhibition by BoNT/A (purple cross with broken lines, right) while/EA (green cross, right) remains effective in diminishing CGRP release. Acute sensitisation by NGF of TRPV1 selectively enhances neuropeptide exocytosis stimulated by low [CAP] (<100 nM) and only moderately affects responses to ≥100 nM CAP (Figure 3B). Despite being impotent against 1 µM CAP-evoked CGRP release in starved cells ((B), , and Figure 5G), BoNT/A partially inhibits the moderate NGF-enhancement of 1 µM CAP-evoked CGRP release (Figure 5G), implicating membrane trafficking in the sensitisation process (B, PI3K-Src stimulated pathway) in accordance with its inhibition of NGF-induced, Ca2+-dependent CGRP exocytosis (Figure 5E).
) (arrow with crosses, centre). Stronger stimulation of TRPV1 with 1 µM CAP ( ) induces a lot more Ca2+ influx ([Ca2+]i, ([Ca2+]i, ([Ca2+]i; Figure 1) which causes a moderate increase in CGRP release but overcomes the inhibition by BoNT/A (purple cross with broken lines, right) while/EA (green cross, right) remains effective in diminishing CGRP release. Acute sensitisation by NGF of TRPV1 selectively enhances neuropeptide exocytosis stimulated by low [CAP] (<100 nM) and only moderately affects responses to ≥100 nM CAP (Figure 3B). Despite being impotent against 1 µM CAP-evoked CGRP release in starved cells ((B), , and Figure 5G), BoNT/A partially inhibits the moderate NGF-enhancement of 1 µM CAP-evoked CGRP release (Figure 5G), implicating membrane trafficking in the sensitisation process (B, PI3K-Src stimulated pathway) in accordance with its inhibition of NGF-induced, Ca2+-dependent CGRP exocytosis (Figure 5E).
) (arrow with crosses, centre). Stronger stimulation of TRPV1 with 1 µM CAP ( ) induces a lot more Ca2+ influx ([Ca2+]i, ([Ca2+]i, ([Ca2+]i; Figure 1) which causes a moderate increase in CGRP release but overcomes the inhibition by BoNT/A (purple cross with broken lines, right) while/EA (green cross, right) remains effective in diminishing CGRP release. Acute sensitisation by NGF of TRPV1 selectively enhances neuropeptide exocytosis stimulated by low [CAP] (<100 nM) and only moderately affects responses to ≥100 nM CAP (Figure 3B). Despite being impotent against 1 µM CAP-evoked CGRP release in starved cells ((B), , and Figure 5G), BoNT/A partially inhibits the moderate NGF-enhancement of 1 µM CAP-evoked CGRP release (Figure 5G), implicating membrane trafficking in the sensitisation process (B, PI3K-Src stimulated pathway) in accordance with its inhibition of NGF-induced, Ca2+-dependent CGRP exocytosis (Figure 5E).
Publisher’s Note: MDPI stays neutral with regard to jurisdictional claims in published maps and institutional affiliations. |
© 2022 by the authors. Licensee MDPI, Basel, Switzerland. This article is an open access article distributed under the terms and conditions of the Creative Commons Attribution (CC BY) license (https://creativecommons.org/licenses/by/4.0/).
Share and Cite
Belinskaia, M.; Zurawski, T.; Kaza, S.K.; Antoniazzi, C.; Dolly, J.O.; Lawrence, G.W. NGF Enhances CGRP Release Evoked by Capsaicin from Rat Trigeminal Neurons: Differential Inhibition by SNAP-25-Cleaving Proteases. Int. J. Mol. Sci. 2022, 23, 892. https://doi.org/10.3390/ijms23020892
Belinskaia M, Zurawski T, Kaza SK, Antoniazzi C, Dolly JO, Lawrence GW. NGF Enhances CGRP Release Evoked by Capsaicin from Rat Trigeminal Neurons: Differential Inhibition by SNAP-25-Cleaving Proteases. International Journal of Molecular Sciences. 2022; 23(2):892. https://doi.org/10.3390/ijms23020892
Chicago/Turabian StyleBelinskaia, Mariia, Tomas Zurawski, Seshu Kumar Kaza, Caren Antoniazzi, J. Oliver Dolly, and Gary W. Lawrence. 2022. "NGF Enhances CGRP Release Evoked by Capsaicin from Rat Trigeminal Neurons: Differential Inhibition by SNAP-25-Cleaving Proteases" International Journal of Molecular Sciences 23, no. 2: 892. https://doi.org/10.3390/ijms23020892
APA StyleBelinskaia, M., Zurawski, T., Kaza, S. K., Antoniazzi, C., Dolly, J. O., & Lawrence, G. W. (2022). NGF Enhances CGRP Release Evoked by Capsaicin from Rat Trigeminal Neurons: Differential Inhibition by SNAP-25-Cleaving Proteases. International Journal of Molecular Sciences, 23(2), 892. https://doi.org/10.3390/ijms23020892