Article

Evolution of Gene Arrangements in the Mitogenomes of Ensifera and Characterization of the Complete Mitogenome of Schizodactylus jimo

College of Life Sciences, Shaanxi Normal University, Xi’an 710119, China
*
Authors to whom correspondence should be addressed.
These authors contributed equally to this work.
Int. J. Mol. Sci. 2022, 23(20), 12094; https://doi.org/10.3390/ijms232012094
Submission received: 6 September 2022 / Revised: 29 September 2022 / Accepted: 4 October 2022 / Published: 11 October 2022
(This article belongs to the Section Molecular Genetics and Genomics)

Abstract

:
Gene arrangement (relative location of genes) is another evolutionary marker of the mitogenome that can provide extensive information on the evolutionary mechanism. To explore the evolution of gene arrangements in the mitogenome of diversified Ensifera, we sequenced the mitogenome of the unique dune cricket species found in China and used it for phylogenetic analysis, in combination with 84 known Ensiferan mitogenomes. The mitogenome of Schizodactylus jimo is a 16,428-bp circular molecule that contains 37 genes. We identified eight types of gene arrangement in the 85 ensiferan mitogenomes. The gene location changes (i.e., gene translocation and duplication) were in three gene blocks: I-Q-M-ND2, rrnl-rns-V, and ND3-A-R-N-S-E-F. From the phylogenetic tree, we found that Schizodactylus jimo and most other species share a typical and ancient gene arrangement type (Type I), while Grylloidea has two types (Types II and III), and the other five types are rare and scattered in the phylogenetic tree. We deduced that the tandem replication–random loss model is the evolutionary mechanism of gene arrangements in Ensifera. Selection pressure analysis revealed that purifying selection dominated the evolution of the ensiferan mitochondrial genome. This study suggests that most gene rearrangements in the ensiferan mitogenome are rare accidental events.

1. Introduction

The mitogenome of insects is a typical circular double-stranded molecule that is 14–20 kb in size and contains 37 genes, including 13 protein-coding genes (PCGs), 22 transfer RNA (tRNA) genes, 2 ribosomal RNA (rRNA) genes, and a sizeable non-coding region called the control region (CR) or A + T-rich region, which has high A + T content [1,2]. Due to its characteristics of conservative gene composition and arrangement, absence (or deficient level) of recombination, uniparental inheritance, and a faster evolutionary rate than that of nuclear DNA, the mitogenome has been extensively used as a standard molecular marker in the phylogenetic, evolutionary, and taxonomic research of animals, especially insects [2,3,4,5].
Gene rearrangement has been extensively reported in various insect mitogenomes [6,7,8,9,10,11,12,13,14,15,16,17,18,19]. The most common type of gene arrangement involves tRNA genes, among which the gene orders in Hymenoptera, Thysanoptera, Psocoptera, Hemiptera, and Phthiraptera exhibit more frequent rearrangements than the putative ancestral gene order [7,20,21,22,23,24,25,26]. Some studies have suggested that mitogenome rearrangement may provide essential clues regarding evolution and origin [2,27,28,29]. In recent years, the discovery of gene rearrangements has dramatically increased with the development of new sequencing methods. Although many mitogenomes have been completely sequenced, only a few gene arrangements have been recorded in Ensifera [30,31].
Ensifera is a group of large and morphologically diverse insect taxa, including crickets, mole crickets, katydids, dune crickets, and wetas. It contains 12,000 species, with approximately 2000 genera in seven superfamilies [32]. Schizodactyloidea is a superfamily of Ensifera insects found in Asia and Africa, composed of only 17 species and two genera (Schizodactylus and Comicus) [33]. Although they are taxonomically studied, the phylogenetic role of Schizodactyloidea has not been elucidated because of the lack of mitochondrial data and limited molecular research on this lineage [34,35,36]. Schizodactyloidea is considered an ancient group of Orthoptera. Some early morphological studies have suggested that Schizodactyloidea is a sister group to other taxa in the Katydid branch, except for Rhaphidophoroidea. Later, some phylogenetic studies based on molecular data also supported Schizodactyloidea and Tettigonioidea as sister groups [32,36]. In the most recent phylogenetic study of Orthoptera based on mitochondrial genes, Schizodactyloidea was found in the cricket branch [37]. However, the results were obtained using only the mitochondrial genome of the genus Comicus.
To further investigate the evolution of the mitochondrial gene order in Schizodactyloidea and compare it with the gene orders of other Ensifera species, we sequenced the complete mitogenome of Schizodactylus jimo He 2021, a unique species of Schizodactyloidea that is found in China [38]. We then used the S. jimo mitogenome sequence, combined with 84 other available Ensiferan mitogenomes, to carry out a phylogenetic analysis that investigated the types and evolutionary mechanisms of mitochondrial gene arrangements in Ensifera. The results of this study will improve our understanding of the changes in relative gene locations in mitogenomes.

2. Results

2.1. Mitogenome Features of Schizodactylus jimo

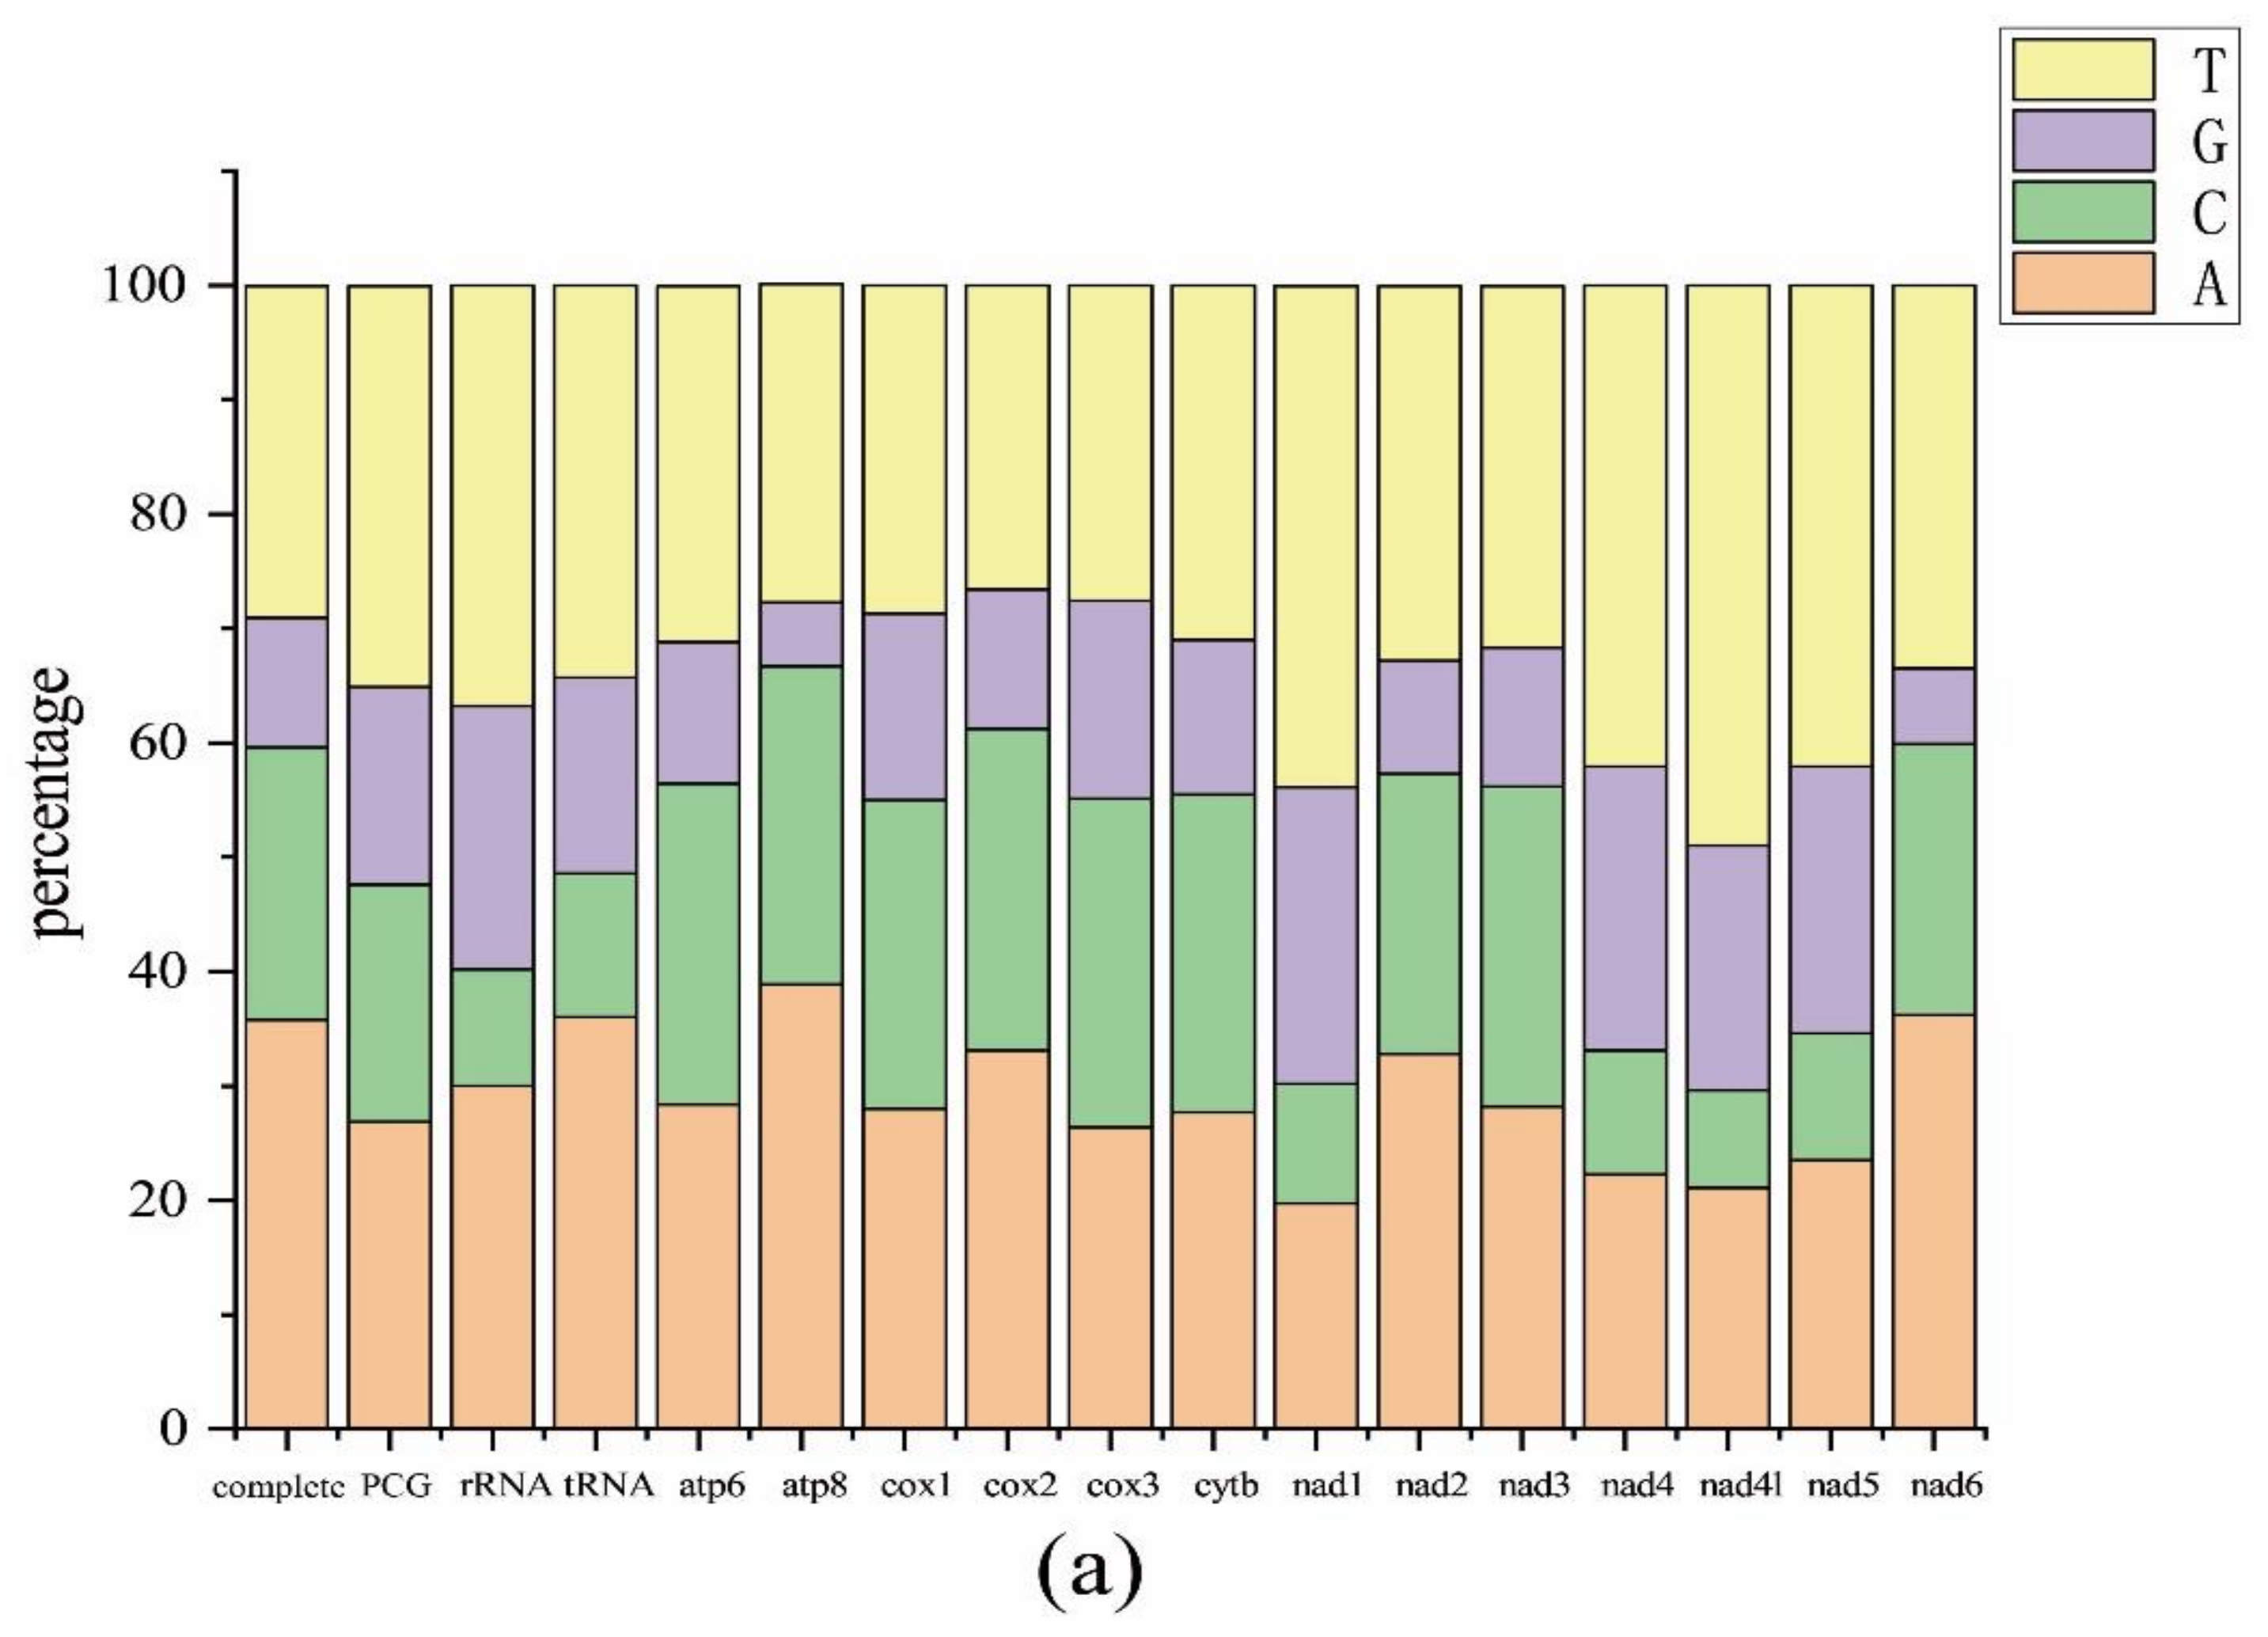
The complete mitogenome of S. jimo was 16,428 bp (GenBank ID: OP178893), including 13 PCGs, 22 tRNA genes, 2 rRNA genes, and an A + T rich region (Figure 1). The mitogenome size of S. jimo was in the range of that of the 84 other Ensifera mitogenomes (from 14,971 bp for Ruspolia dubia to 18,133 bp for Sinochlora longifissa, Table S2). Among these, the light strand (N-strand) encoded 14 genes and the heavy strand (J-strand) encoded 23 genes. The overall AT and GC skews for S. jimo were −0.105 and −0.221, respectively (Figure 2).
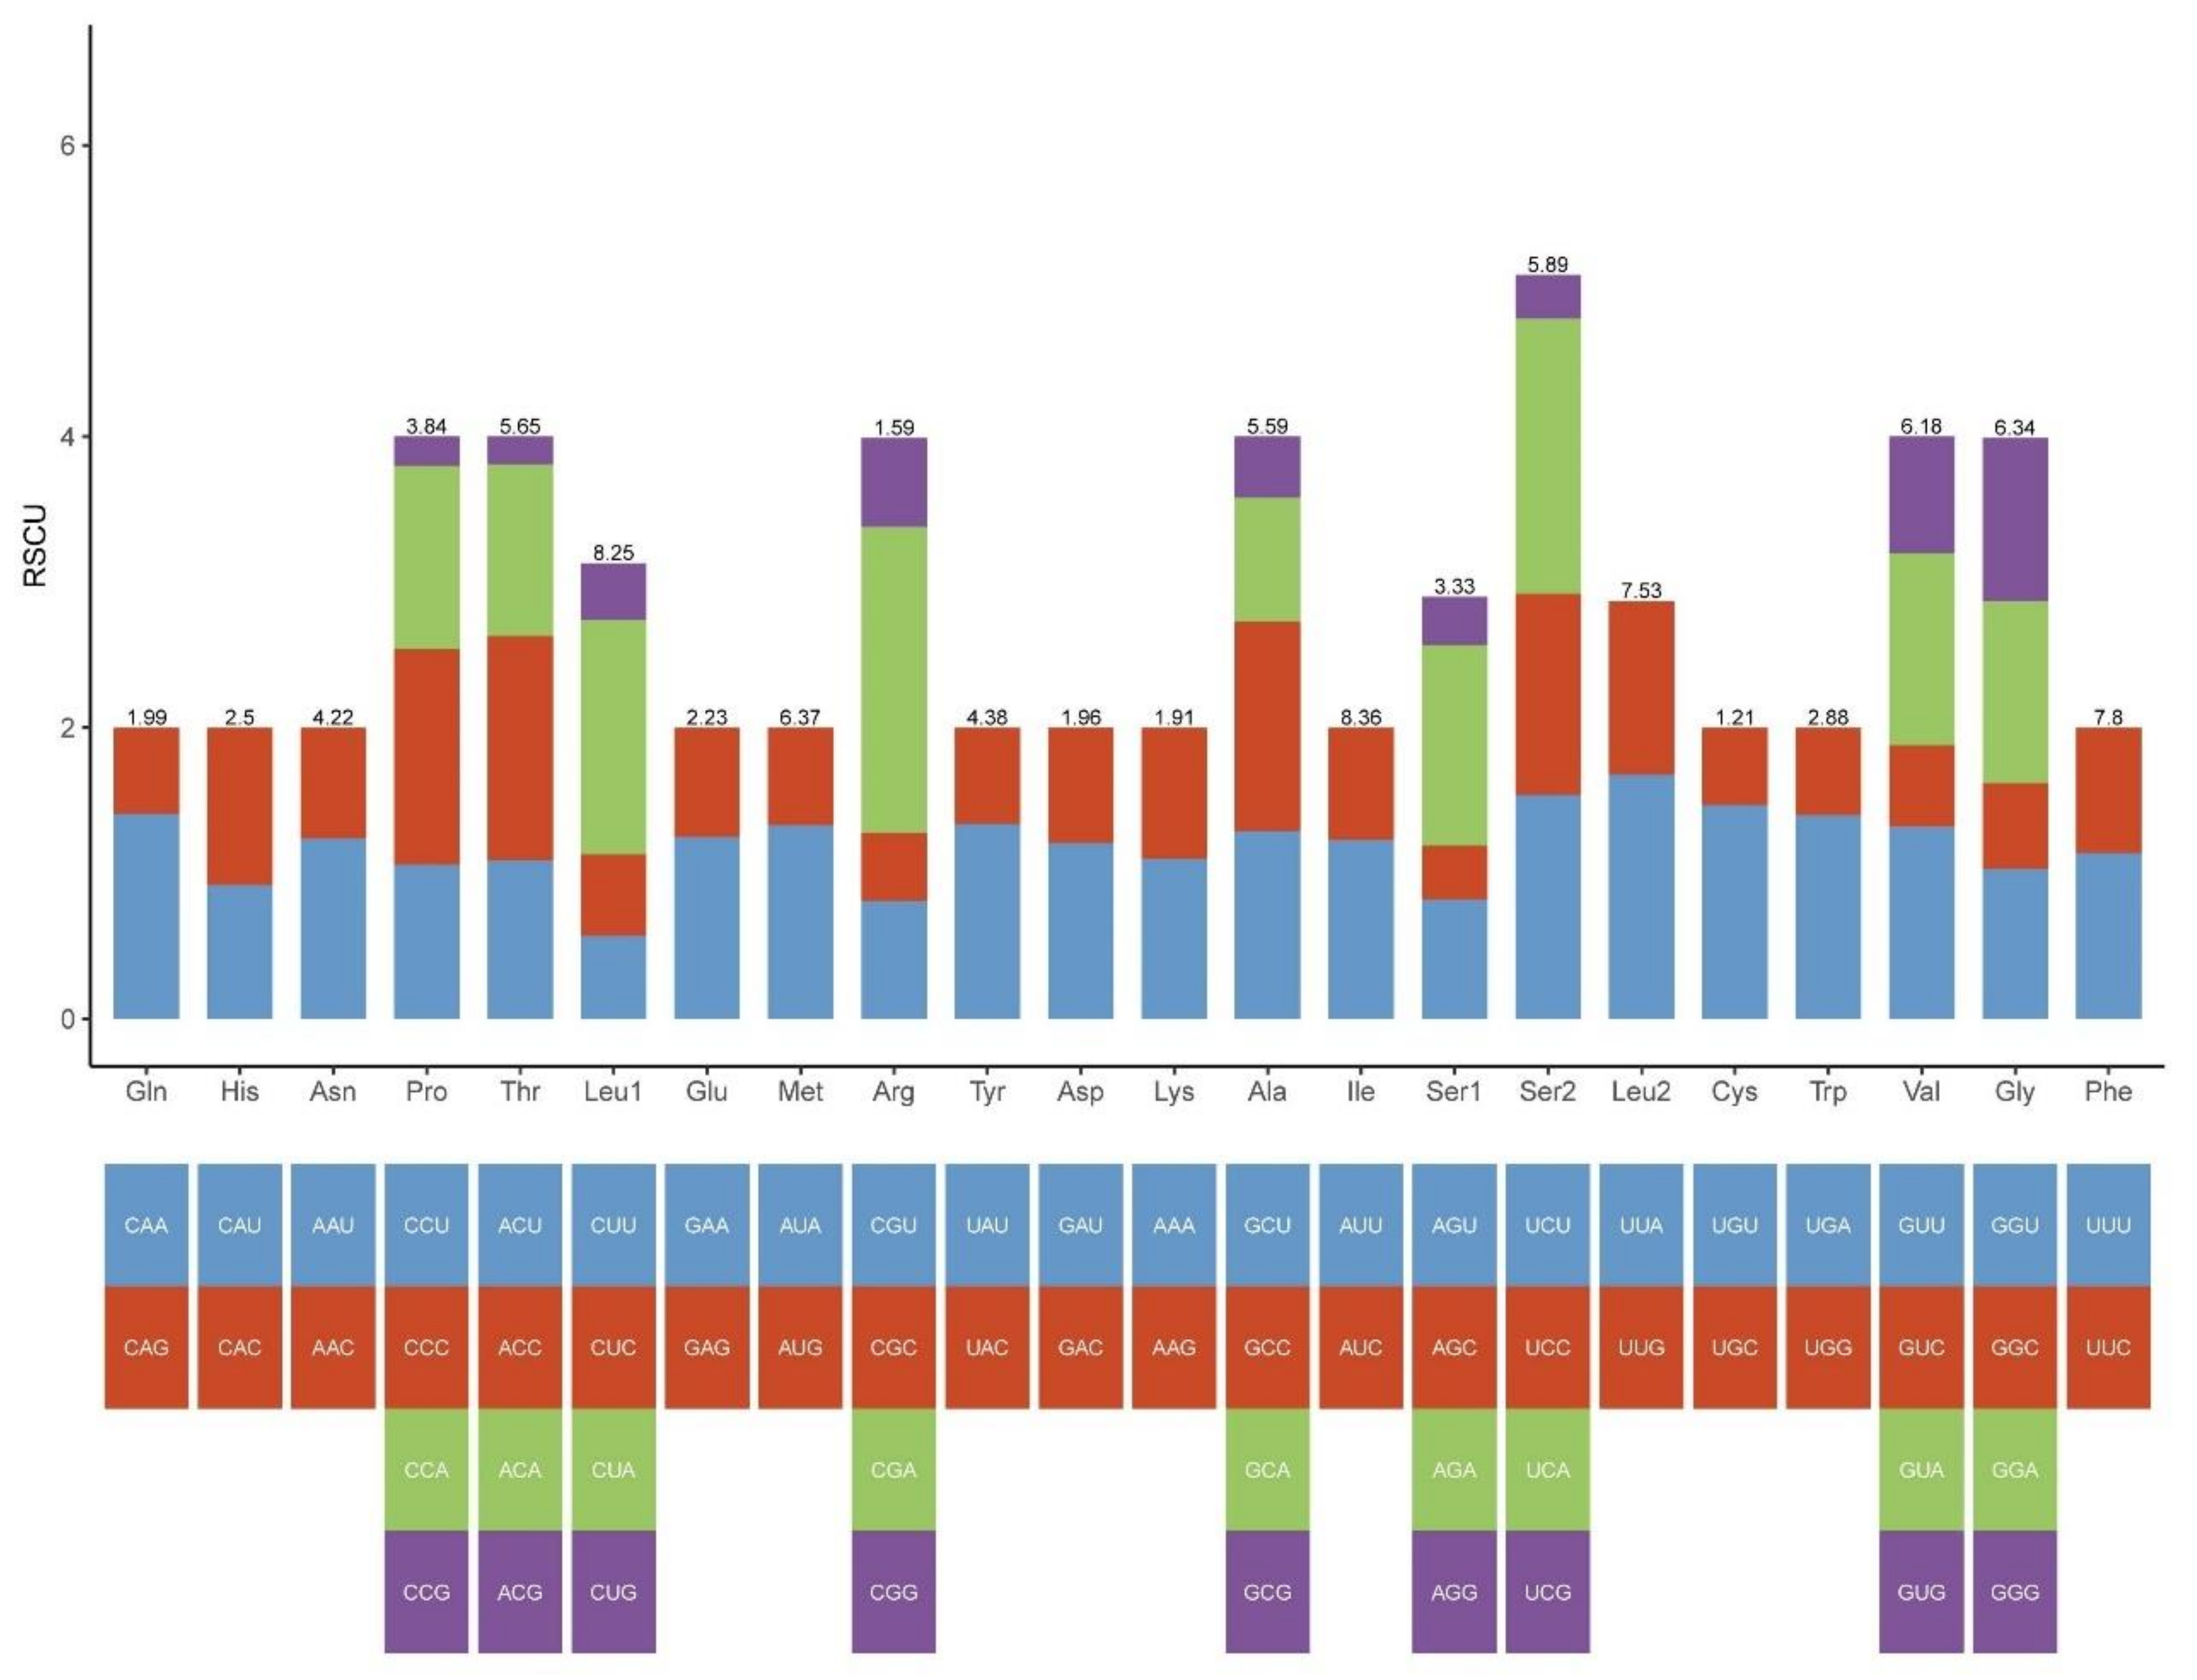
The total length of the 13 PCGs in S. jimo was 11,195 bp, accounting for 68.1% of the entire mitogenome. The mitogenome of S. jimo encodes 3731 amino acids (apart from the stop codon). The number of amino acids was within the range of the other Ensifera species (from 3684 in Capnogryllacris melanocrania to 3760 in Orophyllus montanus, Table S2). Codon usage analysis revealed that the most frequently used codons in the Ensiferan mitogenomes included AUU (for isoleucine; Ile), UUU (for phenylalanine; Phe), and UUA (for leucine; Leu) (Figure 3 and Table S3).
Twenty-two typical tRNA genes were identified in the S. jimo mitogenomes, ranging from 63 to 72 bp. All tRNAs could be folded into a typical clover-leaf structure, except for tRNASer (AGN), in which the dihydrouridine (DHU) arm formed a loop. The reduced DHU stem of tRNASer (AGN) is commonly found in the mitogenomes of other insects, including in all the available mitogenomes of Ensifera. Two rRNA genes (12S and 16S) were identified on the L-strand of the S. jimo mitogenome, with the 16S rRNA gene located between tRNALeu (CUN) and tRNAVal, and the 12S rRNA gene present between tRNAVal and the control region. The lengths of the 16S and 12S rRNA genes were 1285 and 765 bp, respectively. The A + T content was 67.7% for the 16S rRNA and 65.2% for the 12S rRNA.
The CR is characterized by high AT content and is thought to regulate mtDNA transcription and replication. The length of the CR of S. jimo was 1275 bp, with an AT content of 80.2%. In other Ensiferan species, the CR length ranged from 294 bp (Mecopoda elongata) to 2023 bp (Atlanticus sp.) (Table S2).

2.2. Phylogenetic and Divergence Time Analyses

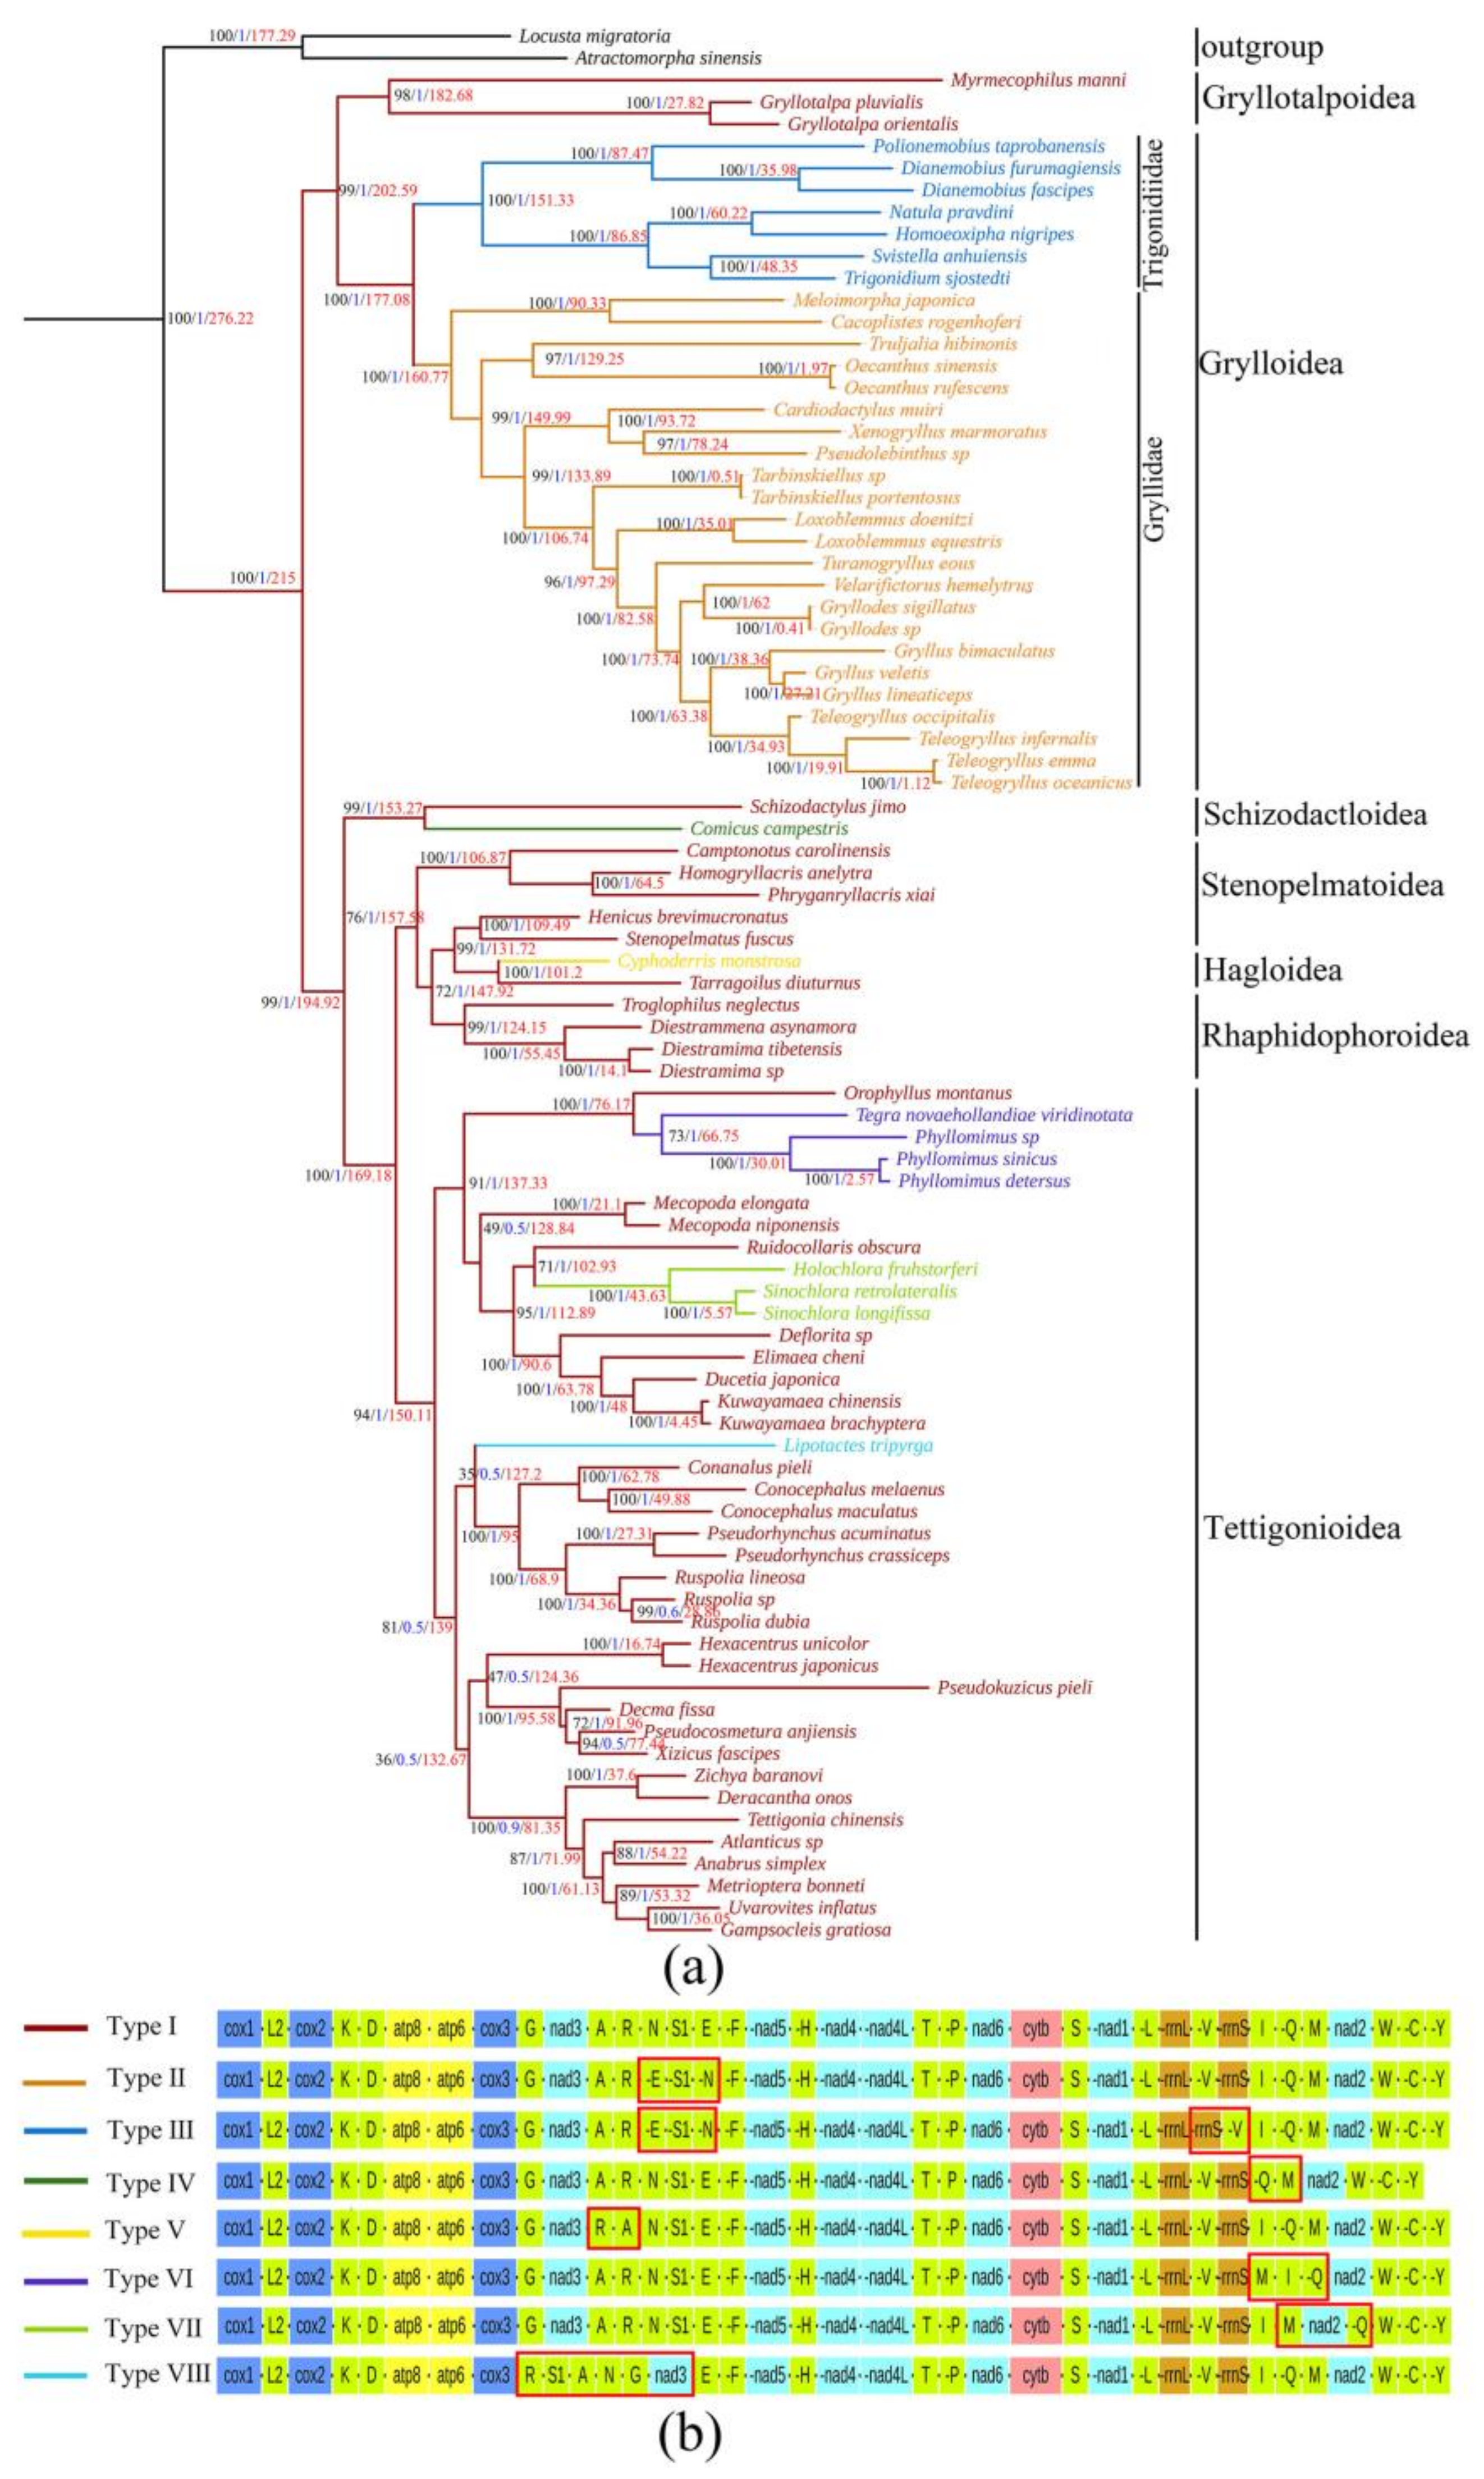
The ML and BI phylogenetic trees, based on all three codon positions from the 13 PCGs and 2 rRNAs derived from the 85 Ensifera mitogenomes (including the newly sequenced S. jimo), were identical (see Figure 4a). Both the ML and BI trees strongly supported the lineage containing the superfamilies Schizodactyloidea, Stenopelmatoidea, Hagloidea, Rhaphidophoroidea, and Tettigonioidea.
S. jimo is a sister group to Comicus campestris, implying a close relationship between these two lineages. In addition, the clade S. jimo + Comicus campestris was located at the root of the katydid branch. The relationships between the seven superfamilies of Ensifera were as follows: (Grylloidea, Gryllotalpoidea) (Schizodactyloidea, (Stenopelmatoidea, ((Hagloidea, Rhaphidophoroidea), Tettigonioidea))), consistent with the findings of Zhou et al. [39]. Tettigonioidea is split into two large clades, Tettigoniidae and Phaneropteridae, which are identical to the phylogenetic relationship presented in the Orthoptera Species File Online [40]. To better understand the taxonomic status of Schizodactyloidea and the phylogenetic relationships among Ensifera, there is a need for more sampling of the Schizodactyloidea taxa, which can help in obtaining sufficient molecular data.
Based on the fossil-calibrated phylogeny (Figure 4a), Ensifera originated in the Permian (~276.22 Mya) and diverged into two branches in the Early Triassic period (~215 Mya): a cricket branch and a Katydid branch. The divergence between Grylloidea and Gryllotalpoidea occurred in the Early Triassic period (~202.59 Mya). From the Katydid branch, we dated that S. jimo and Comicus campestris diverged in the Late Jurassic period (~153.27 Mya). Subsequently, Tettigonioidea and the remaining three superfamilies (Hagloidea, Stenopelmatoidea, and Rhaphidophoroidea) diverged during the middle Jurassic period (~169.18 Mya). The divergence between Rhaphidophoroidea and Hagloidea occurred during the Middle Jurassic period (~147.92 Mya). The divergence between Phaneropteridae and Tettigoniidae occurred during the Middle Jurassic period (~150.11 Mya), and most of the significant subfamilies within Tettigonioidea branched off during the Cretaceous period.

2.3. Evolution of Gene Rearrangements

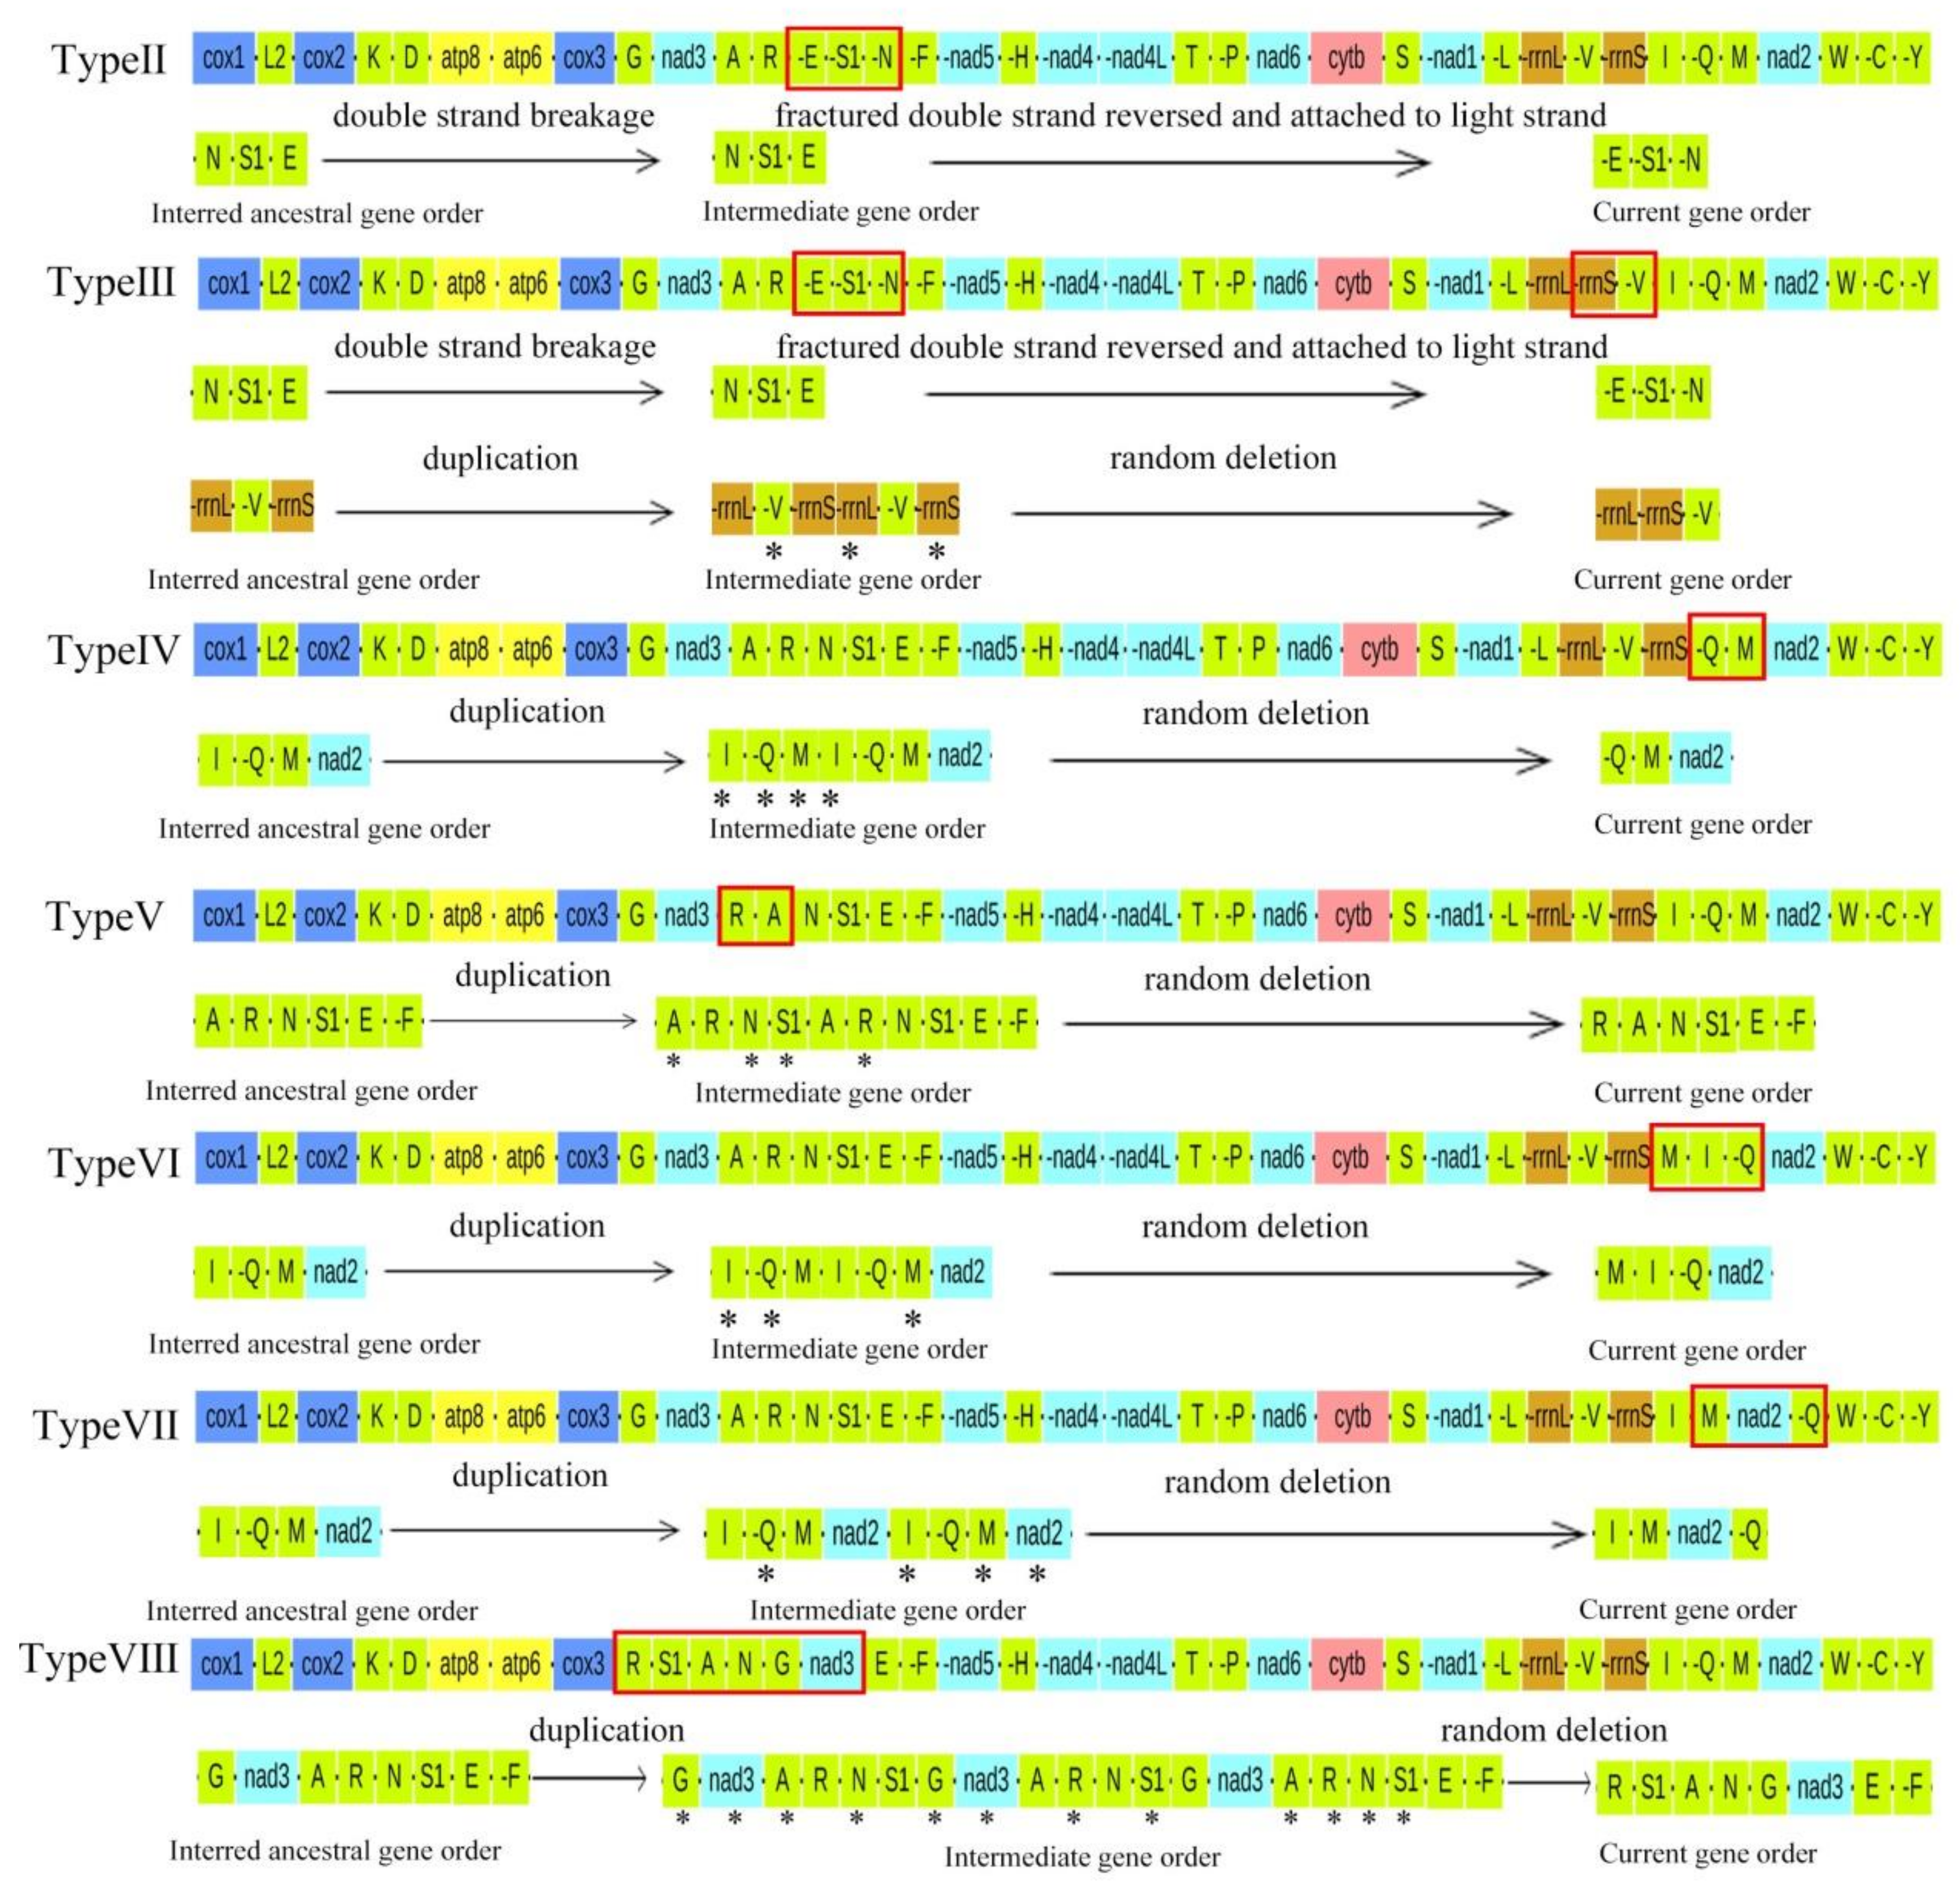
We identified eight gene arrangement types in Ensifera (Figure 4). Compared to the major Ensifera lineages, the gene order had undergone more significant changes. For example, trnN and trnE of the major Grylloidea lineage were interchanged and moved from heavy to light strands (Type II). However, a unique transposition of rrnS and trnV was found in Trigonidiidae (Type III) compared to the significant mole crickets. The structures of the two dune cricket mitogenomes, S. jimo and Comicus campestris, were very similar, except for the deletion of trnI in Comicus campestris (Type IV). The gene sequence of Tettigonioidea was significantly different from that of most Ensifera species. In Tegra novaehollandiae viridinotata and three Phyllomimus species, the position of trnM was changed, between rrns and trnI (Type VI). In some Phaneropterinae species, including Holochlora fruhstorferi and two Sinochlora species, trnQ was inserted after nad2 (Type VII). Compared to the significant Tettigonioidea lineage, more inversion and transpositions were observed in Lipotactes tripyrga (Type VIII), trnA and trnR were interchanged, trnS1 was inserted after trnR, and trnG and nad3 were located after trnN. However, gene order changes occurred only in tRNA genes; translocated tRNAs did not change their transcription direction, except for that in the case of Type V (for more details, see Figure 5).
In addition to gene arrangement Type I, which is familiar to most Ensifera spp., the positions of several tRNAs of the other seven types were significantly altered. Type III was the gene arrangement type in Trigonidiidae species, and the positions of one rRNA and several tRNAs changed dramatically, suggesting an overactivated status in mitogenomes of species that underwent Type III rearrangement. We calculated the RS and RF for each gene in all the collected mitogenomes. We calculated the RS of each mitogenome by accumulating the RSs of all genes in the mitogenome. The results indicated that the arrangement Type VIII was a very active group, with the highest RS among Ensifera insects (Figure 6a).
Among the individual genes, tRNA genes had higher RFs than the PCGs (Figure 6b). Among the tRNA genes, A, E, and I exhibited the highest RFs. In addition to tRNA genes, PCGs and rRNA genes were dramatically rearranged in Ensifera.

2.4. Evolutionary Analysis of Ensifera Mitogenomes

Upon examination of the ka and ka/ks values calculated from the 13 PCGs of the 85 Ensiferan mitogenomes, atp8 had the highest averages. This implies that atp8 may have evolved more quickly than the other PCGs in the Ensiferan mitogenomes (Figure 7a,c). Conversely, cox1 had the lowest average ka and ka/ks values (Figure 7a,c). Compared to ka/ks among the 13 mitochondrial PCGs for all insects, all ka/ks(ω) values were lower than 1, indicating that these 13 PCGs were in a state of purification selection (Figure 7).
Furthermore, all the ka/ks (ω) of the eight gene arrangement types were less than 1, indicating that the eight types were subjected to purification selection (Figure 8a). Type V had the lowest mean value of ω. In contrast, Types II and III had higher mean values of ω. Group comparisons showed no significant differences among the arrangement types with ω values (p > 0.05). Type V insects experienced tremendous purification selection pressure. Interestingly, Types II and VII had the highest nucleotide substitution rates, while Type IV had the lowest (Figure 8b).

3. Discussion

3.1. Evolution of Mitogenomic Gene Rearrangements in Ensifera

Most mitochondrial genomes of Ensifera are in an ancient aligned order, whereas those of Grylloidea species have undergone rearrangement. According to previously reported mitochondrial genomes of Grylloidea, gene rearrangements mainly occurred in the gene blocks A-R-E1-S-N-F and rrnl-rns-V (Type III), while others occurred in A-R-E1-S-N-F (Type II) [41,42,43]. In the Grylloidea species, trnE, trnS (AGN), and trnN are inversed to the minority strand. Therefore, we assumed that the ancestor of Grylloidea possessed the same gene order as ancestral insects. The double-strand breakage of the region “trnN-trnS(AGN)-trnE” would have been the first step, after which the fractured double strand was reconnected to the fracture sites in the minority with the help of enzymes. This is a possible way in which the inversion of the gene cluster “trnE-trnS(AGN)-trnN” could have been formed. The regular rearrangement of Grylloidea could be associated with an adaptation to underground life.
Except for two gene rearrangement types in Grylloidea, all other types are random and irregular. In our study, the mitochondrial gene rearrangements of Ensifera were primarily concentrated in the regions of I-Q-M-ND2 and A-R-N-S-E-F. These gene rearrangements have also been observed in the previously reported mitochondrial genome of Ensifera [42,43,44]. For gene rearrangements of Ensifera, the tandem duplication–random loss model was proposed [45,46,47], which posits that the tandem duplication of mtDNA stretches followed by unexpected loss (via pseudogenization and degeneration) of redundant genes is responsible for between-lineage differences in the mtDNA gene order. This model has already explained similar rearrangements of the gene block CR-I-Q-M in other insects and crabs [48] and even in amphibians [49], which indicates that these are plausible mechanisms that explain the comparable phenomena in Ensifera. The original gene order in this region was assumed to be CR-I-Q-M-ND2. Since the gene rearrangement of Comicus campestris was shown as Q-M-ND2, it was inferred as follows: tandem duplication of I-Q-M occurred, followed by accidental loss of trnI.
Consequently, trnI loss was observed in Comicus campestris. As for Holochlora fruhstorferi and two Sinochlora species, their genes were rearranged as I-M-ND2-Q; therefore, we propose a tandem duplication of Q-M-ND2 occurred, followed by accidental loss of the first trnQ and second ND2, trnM. Thus, the genes were arranged as I-M-ND2-Q. In Tegra novaehollandiae viridinotata and three Phyllomimus species, as compared to the ancestral mitogenome arrangement, trnM was translocated to a position 5′-upstream of trnI, thereby generating the gene order M-I-Q. In Type VII, the gene cluster CR-I-Q-M-ND2 was duplicated, likely promoted by the stem-loop structures detected in the CR. Subsequently, non-random deletions may occur in the entire subset of duplicated genes, depending on the gene copy’s transcriptional polarity and location in the genome, because the CR includes a transcriptional control sequence [50]. Redundant genes that possess the same polarity, such as the redundant gene cluster I-M-ND2, were successively deleted during replication (Figure 4). In contrast, the persistence of trnS (UCN) pseudogenes may have resulted from the tandem duplication of trnS (UCN), followed by a subsequent random loss of trnS (UCN) paralogs.

3.2. Selection Constraints on the Mitogenome of Ensifera

All 13 PCGs in the mitogenomes of animals participate in aerobic metabolism. Positive selection is associated with adaptation to new environments. In the 85 mitogenomes studied, the Ka/Ks values for all 13 PCGs were less than 1, suggesting that purifying selection has dominated the evolution of Ensiferan mitogenomes. Among them, the atp8 gene had the highest Ka and Ka/Ks values. In contrast, the cox1 gene had the lowest, indicating that the cox1 gene experienced more substantial evolutionary selection pressure (Figure 7a,b). This phenomenon has been observed in previous studies of insects and fishes [51,52].
Types II and III showed much higher Ka/Ks values among all eight mitogenome types. This indicates that these two types of mitogenomes have higher non-synonymous substitution rates than the others. The higher number of non-synonymous mutations suggests that these cricket species have experienced more relaxed evolutionary constraints, and the slightly beneficial amino acid changes have been fixed in their mitogenomes. Based on the analysis of Ka/Ks ratios and nucleotide substitution rates of all the Ensiferan mitogenomes, we found that mitogenome types with high substitution rates had high RFs. This relationship between the substitution rate and RFs has also been observed in other insect mitogenomes [40,53,54], indicating that there is a need for further studies that investigate the role of nucleotide substitution in mitochondrial gene arrangement in insects.

4. Material and Methods

4.1. Sample Collection and DNA Extraction

The adult samples of S. jimo were collected from Baoshan City, Yunnan Province, China, in 2021. The collected samples were initially placed in 100% ethyl alcohol and stored at −20 °C (College of Life Sciences, Shaanxi Normal University, Xi’an, China). Total DNA was extracted from the whole body of three individuals using a TIANamp Genomic DNA Kit (Tiangen, Beijing, China), following the manufacturer’s instructions. The quality of the DNA samples was checked using 1% agarose gel, and the concentrations were measured using a NanoDrop™ 2000 spectrophotometer (Thermo Fisher, Waltham, MA, USA).

4.2. Mitogenome Assembly, Annotation, and Analysis

The entire mitochondrial genome was sequenced using a HiSeq 2500 platform (Illumina, San Diego, CA, USA) by Biomarker Biotechnologies Inc., Beijing, China. The mitogenome of S. jimo was assembled using the GetOrganell pipeline v1.7.5.3 [55], in which KM657337 was used as the initial bait to screen for mitochondrial reads. Following the spades, a Denovo assembly software was used to construct these reads into mitogenomic contigs. The 13 PCGs were predicted through comparison with the homologous sequence of reference mitogenomes and by finding the open reading frames based on the invertebrate mitochondrial genetic code. The locations of 22 tRNAs were identified using MITOS WebServer (http://mitos.bioinf.uni-leipzig.de/index.py, 2012, accessed on 20 October 2021) [56]. The two rRNA genes (rrnS and rrnL) and the A + T-rich region were determined based on the locations of adjacent genes (trnL1 and trnV) and alignment with homologous sequences of reference mitogenomes.
The nucleotide composition and skew, codon usage of PCGs, and relative synonymous codon usage values of each PCG were calculated using PhyloSuite v1.2.1 [57]. At the same time, tandem repeat units of the A + T-control region were analyzed using the Tandem Repeats Finder online server (http://tandem.bu.edu/trf/trf.html, 1999, accessed on 21 October 2021) [58]. Differences in the nucleotide composition (composition skew) were measured using the following formulae: AT-skew = [(A − T)/(A + T)] and GC-skew = [(G − C)/(G + C)] [59]. Evolutionary rate analysis of genes was performed using Phylogenetic Analysis by Maximum Likelihood (PAML) v4.9 [60]. The maps of mitochondrial DNA (mtDNA) were drawn using CGView Server v1.0 [61].

4.3. Phylogenetic Analyses and Estimation of Divergence Time

We prepared a dataset comprising the novel mitogenome of S. jimo and the complete mitogenomes of 84 other insect species downloaded from NCBI GenBank (see Tables S1 and S2), using two grasshopper species [Atractomorpha sinensis and Locusta migratoria (Acrididae)], as outgroup taxa. We performed phylogenetic analyses on this dataset using Bayesian inference (BI) and maximum likelihood (ML) methods. Nucleotide sequences were aligned using the G-INS-I (accurate) strategy and codon alignment mode, while amino acid sequences were aligned using auto strategy and the normal alignment mode. We aligned the nucleotide and amino acid sequences of 13 PCGs from each mitogenome using the multiple sequence alignment program MAFFT in PhyloSuite v1.2.1 [57]. The optimal partitioning scheme and nucleotide substitution model for BI and ML phylogenetic analyses with PartitionFinder-2.1.1 were incorporated into PhyloSuite v1.2.1 [62].
We used the Penalized likelihood (PL) method with a truncated Newton algorithm in R8S v1.81 [63] to estimate divergence times, using an input tree with the consensus topology and branch lengths from MrBayes [64]. Five known divergence times were used as calibration points (Gampsocleis gratiosa with A nabrus simplex: 57 Mya [37]; Conocephalus maculatus with Ruspolia dubia: 95 Mya [37]; Ruspolia lineosa with Xizicus fascipes: 139 Mya [37]; Elimaea cheni with Mecopoda elongate: 128 Mya [37]; and Myrmecophilus manni with Gryllodes sp: 215 Mya [37]).

4.4. Gene Arrangement Analysis in the Mitogenome

Gene orders were extracted using the PhyloSuite software package and visualized on the Interactive Tree of Life (iTOL) website server (https://itol.embl.de/, accessed on 11 November 2021) [65,66]. For a quantitative comparison of gene arrangements in each mitogenome, we calculated the rearrangement score (RS) and rearrangement frequency (RF) of each gene in all collected mitogenomes using the quantifying mitochondrial genome rearrangement (qMGR) approach [67]. The RS of each mitogenome can be calculated by accumulating the RSs of all genes in one genome; this value can be further used as a quantitative feature of mitogenome gene rearrangements.

4.5. Analysis of Natural Selection Strength and Nucleotide Substitution Rates

To evaluate the potential adaptive evolution of the mitochondrial genes in Ensifera insects, we performed positive selection analyses using PAML. Synonymous substitutions in protein-coding sequences cannot cause changes in amino acids, typically found in the third position or sometimes in the first position of a codon. Thus, we used a gene-level approach based on the ratio of non-synonymous (Ka) to synonymous (Ks) substitution rates to detect potential positive selection signals on PCGs across closely related or divergent species. We divided the 85 species into eight groups, according to their arrangement types, to explore whether there were differences between different arrangement types under natural selection pressure.
We estimated the mean nucleotide substitution rate using R8S to determine the major driving forces of mitochondrial evolution [63].

5. Conclusions

Based on sequencing the mitogenome of S. jimo, a unique dune cricket in China, and phylogenetic analysis of known mitogenomes, we identified eight types of gene arrangements in Ensiferan mitogenomes. Crickets (Grylloidea) have two mitogenomic types, which have experienced relaxed evolutionary constraints. Most species share a common ancient gene arrangement type. The remaining types are randomly distributed in the phylogenetic tree. These gene rearrangements can be explained using the tandem replication–random loss model. Mitogenome types with high substitution rates have high RFs, but further studies are needed to investigate the role of nucleotide substitution in mitochondrial gene arrangement in insects.

Supplementary Materials

The following supporting information can be downloaded at: https://www.mdpi.com/article/10.3390/ijms232012094/s1.

Author Contributions

Conceptualization, S.-Q.X. and D.-L.G.; formal analysis, Z.-C.D., T.J. and H.W.; writing—original draft preparation, Z.-C.D. and L.Z.; writing—review and editing, S.-Q.X. All authors have read and agreed to the published version of the manuscript.

Funding

This research was supported by the Fundamental Research Funds For the Central Universities (GK201903063, GK202105003, and TD2020041Y). This work was partly supported by the National Natural Science Foundation of China (No. 31872273).

Institutional Review Board Statement

Not applicable.

Informed Consent Statement

Not applicable.

Data Availability Statement

The data are contained within the article or Supplementary Materials.

Conflicts of Interest

The authors declare no conflict of interest.

References

  1. Boore, J.L. Animal mitochondrial genomes. Nucleic Acids Res. 1999, 27, 1767–1780. [Google Scholar] [CrossRef] [PubMed] [Green Version]
  2. Cameron, S.L. Insect mitochondrial genomics: Implications for evolution and phylogeny. Annu. Rev. Entomol. 2014, 59, 95–117. [Google Scholar] [CrossRef] [PubMed] [Green Version]
  3. Boore, J.L. The use of genome-level characters for phylogenetic reconstruction. Trends Ecol. Evol. 2006, 21, 439–446. [Google Scholar] [CrossRef] [PubMed]
  4. Cheng, X.F.; Zhang, L.P.; Yu, D.N.; Storey, K.B.; Zhang, J.Y. The complete mitochondrial genomes of four cockroaches (Insecta: Blattodea) and phylogenetic analyses within cockroaches. Gene 2016, 586, 115–122. [Google Scholar] [CrossRef]
  5. Ma, Y.; He, K.; Yu, P.; Yu, D.; Cheng, X.; Zhang, J. The complete mitochondrial genomes of three bristletails (Insecta: Archaeognatha): The paraphyly of Machilidae and insights into archaeognathan phylogeny. PLoS ONE 2015, 10, e0117669. [Google Scholar] [CrossRef]
  6. Yoshizawa, K.; Johnson, K.P.; Sweet, A.D.; Yao, I.; Ferreira, R.L.; Cameron, S.L. Mitochondrial phylogenomics and genome rearrangements in the barklice (Insecta: Psocodea). Mol. Phylogenetics Evol. 2018, 119, 118–127. [Google Scholar] [CrossRef] [Green Version]
  7. Zheng, B.Y.; Cao, L.J.; Tang, P.; van Achterberg, K.; Hoffmann, A.A.; Chen, H.Y.; Chen, X.X.; Wei, S.J. Gene arrangement and sequence of mitochondrial genomes yield insights into the phylogeny and evolution of bees and sphecid wasps (Hymenoptera: Apoidea). Mol. Phylogenetics Evol. 2018, 124, 1–9. [Google Scholar] [CrossRef]
  8. Zhang, Y.; Sun, J.; Rouse, G.W.; Wiklund, H.; Pleijel, F.; Watanabe, H.K.; Chen, C.; Qian, P.Y.; Qiu, J.W. Phylogeny, evolution and mitochondrial gene order rearrangement in scale worms (Aphroditiformia, Annelida). Mol. Phylogenetics Evol. 2018, 125, 220–231. [Google Scholar] [CrossRef]
  9. Li, H.; Hui, L.; Shi, A.; Štys, P.; Zhou, X.; Cai, W. The Complete Mitochondrial Genome and Novel Gene Arrangement of the Unique-Headed Bug Stenopirates sp. (Hemiptera: Enicocephalidae). PLoS ONE 2012, 7, e29419. [Google Scholar]
  10. Riyaz, M.; Shah, R.A.; Savarimuthu, I.; Kuppusamy, S. Comparative mitochondrial genome analysis of Eudocima salaminia (Cramer, 1777) (Lepidoptera: Noctuoidea), novel gene rearrangement and phylogenetic relationship within the superfamily Noctuoidea. Mol. Biol. Rep. 2021, 48, 4449–4463. [Google Scholar] [CrossRef]
  11. Wu, Y.; Yang, H.; Feng, Z.; Li, B.; Cai, W. Novel gene rearrangement in the mitochondrial genome of Pachyneuron aphidis (Hymenoptera: Pteromalidae). Int. J. Biol. Macromol. 2020, 149, 1207–1212. [Google Scholar] [CrossRef] [PubMed]
  12. Deng, Y.P.; Suleman; Zhang, Y.; Nie, Y.; Fu, Y.T.; Liu, G.H. The complete mitochondrial genome of capillariid nematodes (Eucoleus annulatus): A novel gene arrangement and phylogenetic implications. Vet. Parasitol. 2021, 296, 109476. [Google Scholar] [CrossRef]
  13. Xu, W.; Ding, J.; Lin, S.; Xu, R.; Liu, H. Comparative mitogenomes of three species in Moenkhausia: Rare irregular gene rearrangement within Characidae. Int. J. Biol. Macromol. 2021, 183, 1079–1086. [Google Scholar] [CrossRef] [PubMed]
  14. Cao, Y.Q.; Ma, C.; Chen, J.Y.; Yang, D.R. The complete mitochondrial genomes of two ghost moths, Thitarodes renzhiensis and Thitarodes yunnanensis: The ancestral gene arrangement in Lepidoptera. BMC Genomics 2012, 13, 276. [Google Scholar] [CrossRef] [Green Version]
  15. Xu, X.D.; Jia, Y.Y.; Cao, S.S.; Zhang, Z.Y.; Storey, K.B.; Yu, D.N.; Zhang, J.Y. Six complete mitochondrial genomes of mayflies from three genera of Ephemerellidae (Insecta: Ephemeroptera) with inversion and translocation of trnI rearrangement and their phylogenetic relationships. PeerJ 2020, 8, e9740. [Google Scholar] [CrossRef]
  16. Gao, X.Y.; Cai, Y.Y.; Yu, D.N.; Storey, K.B.; Zhang, J.Y. Characteristics of the complete mitochondrial genome of Suhpalacsa longialata (Neuroptera, Ascalaphidae) and its phylogenetic implications. PeerJ 2018, 6, e5914. [Google Scholar] [CrossRef] [Green Version]
  17. Gao, X.Y.; Zhang, S.S.; Zhang, L.P.; Yu, D.N.; Zhang, J.Y.; Cheng, H.Y. The complete mitochondrial genome of Epeorus herklotsi (Ephemeroptera: Heptageniidae) and its phylogeny. Mitochondrial DNA B Resour. 2018, 3, 303–304. [Google Scholar] [CrossRef] [PubMed] [Green Version]
  18. Zhang, L.P.; Cai, Y.Y.; Yu, D.N.; Storey, K.B.; Zhang, J.Y. Gene characteristics of the complete mitochondrial genomes of Paratoxodera polyacantha and Toxodera hauseri (Mantodea: Toxoderidae). PeerJ 2018, 6, e4595. [Google Scholar] [CrossRef] [PubMed] [Green Version]
  19. Zhang, L.P.; Yu, D.N.; Storey, K.B.; Cheng, H.Y.; Zhang, J.Y. Higher tRNA gene duplication in mitogenomes of praying mantises (Dictyoptera, Mantodea) and the phylogeny within Mantodea. Int. J. Biol. Macromol. 2018, 111, 787–795. [Google Scholar] [CrossRef]
  20. Shao, R.; Barker, S.C. The highly rearranged mitochondrial genome of the plague thrips, Thrips imaginis (Insecta:thysanoptera): Convergence of two novel gene boundaries and an extraordinary arrangement of rRNA genes. Mol. Biol. Evol. 2003, 3, 362–370. [Google Scholar] [CrossRef] [PubMed] [Green Version]
  21. Shao, R.; Zhu, X.Q.; Barker, S.C.; Kate, H. Evolution of Extensively Fragmented Mitochondrial Genomes in the Lice of Humans. Genome Biol. Evol. 2012, 4, 1088–1101. [Google Scholar] [CrossRef] [PubMed]
  22. Mao, M.; Gibson, T.; Dowton, M. Evolutionary Dynamics of the Mitochondrial Genome in the Evaniomorpha (Hymenoptera)—A Group with an Intermediate Rate of Gene Rearrangement. Genome Biol. Evol. 2014, 6, 1862–1874. [Google Scholar] [CrossRef]
  23. Mao, M.; Dowton, M. Complete mitochondrial genomes of Ceratobaeus sp. and Idris sp. (Hymenoptera: Scelionidae): Shared gene rearrangements as potential phylogenetic markers at the tribal level. Mol. Biol. Rep. 2014, 41, 6419–6427. [Google Scholar] [CrossRef] [PubMed]
  24. Wu, Q.L.; Li, Q.; Gu, Y.; Shi, B.C.; Achterberg, C.V.; Wei, S.J.; Chen, X.X. The complete mitochondrial genome of Taeniogonalos taihorina (Bischoff) (Hymenoptera: Trigonalyidae) reveals a novel gene rearrangement pattern in the Hymenoptera. Gene 2014, 543, 76–84. [Google Scholar] [CrossRef] [PubMed]
  25. Li, H.; Shao, R.; Song, F.; Zhou, X.; Yang, Q.; Li, Z.; Cai, W. Mitochondrial Genomes of Two Barklice, Psococerastis albimaculata and Longivalvus hyalospilus (Psocoptera: Psocomorpha): Contrasting Rates in Mitochondrial Gene Rearrangement between Major Lineages of Psocodea. PLoS ONE 2013, 8, e61685. [Google Scholar]
  26. Zhang, H.; Lu, C.; Liu, Q.; Zou, T.; Qiao, G.; Huang, X. Insights into the evolution of aphid mitogenome features from new data and comparative analysis. Animals 2022, 12, 1970. [Google Scholar] [CrossRef]
  27. Dowton, M.; Cameron, S.L.; Dowavic, J.I.; Austin, A.D.; Whiting, M.F. Characterization of 67 mitochondrial tRNA gene rearrangements in the Hymenoptera suggests that mitochondrial tRNA gene position is selectively neutral. Mol. Biol. Evol. 2009, 26, 1607–1617. [Google Scholar] [CrossRef] [Green Version]
  28. Magadum, S.; Banerjee, U.; Murugan, P.; Gangapur, D.; Ravikesavan, R. Gene duplication as a major force in evolution. J. Genet. 2013, 92, 155–161. [Google Scholar] [CrossRef]
  29. Schierup, M.H.; Hein, J. Consequences of recombination on traditional phylogenetic analysis. Genetics 2000, 156, 879–891. [Google Scholar] [CrossRef]
  30. Wei, Y.E.; Dang, J.P.; Xie, L.D.; Huang, Y. Complete Mitochondrial Genome of Teleogryllus emma (Orthoptera:Gryllidae) with a New Gene Order in Orthoptera. Zool. Res. 2008, 29, 236–244. [Google Scholar]
  31. Liu, C.; Chang, J.; Ma, C.; Li, L.; Zhou, S. Mitochondrial genomes of two Sinochlora species (Orthoptera): Novel genome rearrangements and recognition sequence of replication origin. BMC Genomics 2013, 14, 114. [Google Scholar] [CrossRef] [PubMed] [Green Version]
  32. Gwynne, D.T. Phylogeny of the Ensifera (Orthoptera): A hypothesis supporting multiple origins of acoustical signalling, complex spermatophores and maternal care in crickets, katydids, and weta. J. Orthoptera Res. 1995, 4, 203–218. [Google Scholar] [CrossRef]
  33. Kevan, D.K.M. Orthoptera. In Synopsis and Classification of Living Organisms; Parker, S.P., Ed.; McGraw-Hill Inc.: New York, NY, USA, 1982; pp. 352–379. [Google Scholar]
  34. Leubner, F.; Bradler, S.; Wipfler, B. The thoracic morphology of the wingless dune cricket Comicus calcaris (Orthoptera: Schizodactylidae): Novel apomorphic characters for the group and adaptations to sand desert environments. Arthropod. Struct. Dev. 2017, 46, 449–461. [Google Scholar] [CrossRef] [PubMed]
  35. Irish, J. The species of Comicus Brunner v. Wattenwyl (Orthoptera: Schizodactylidae) with a discussion of their origin: Introduction. Navors. Nas. Mus. Res. Natl. Mus. 1986, 5, 254–263. [Google Scholar]
  36. Heads, S.; Leuzinger, L. On the placement of the Cretaceous orthopteran Brauckmannia groeningae from Brazil, with notes on the relationships of Schizodactylidae (Orthoptera, Ensifera). Zookeys 2011, 77, 17–30. [Google Scholar] [CrossRef]
  37. Song, H.; Amédégnato, C.; Cigliano, M.M.; Desutter-Grandcolas, L.; Heads, S.W.; Huang, Y.; Otte, D.; Whiting, M.F. 300 million years of diversification: Elucidating the patterns of orthopteran evolution based on comprehensive taxon and gene sampling. Cladistics Int. J. Willi Hennig Soc. 2015, 31, 621–651. [Google Scholar] [CrossRef] [PubMed]
  38. He, Z.Q.; Liu, Y.J. A new species of Dune Cricket from China (Orthoptera: Ensifera: Schizodactylidae). Zootaxa 2021, 4999, 356–362. [Google Scholar] [CrossRef]
  39. Zhou, Z.J.; Shi, F.M.; Zhao, L.; Fox, G.E. The First Mitochondrial Genome for the Superfamily Hagloidea and Implications for Its Systematic Status in Ensifera. PLoS ONE 2014, 9, e86027. [Google Scholar] [CrossRef]
  40. Shao, R.; Campbell, N.J.; Schmidt, E.R.; Barker, S.C. Increased rate of gene rearrangement in the mitochondrial genomes of three orders of hemipteroid insects. Mol. Biol. Evol. 2001, 18, 1828–1832. [Google Scholar] [CrossRef] [PubMed] [Green Version]
  41. Ryuto, S.; Kosuke, K.; Shota, H.; Keigo, I.; Nguyen, C.; Nguyen, T.P.; Le, B.; Kim, O.; Katsuhiko, M.; Haruko, T. Comparative Analysis of Mitochondrial Genomes in Gryllidea (Insecta: Orthoptera): Implications for Adaptive Evolution in Ant-Loving Crickets. Genome Biol. Evol. 2021, 10, evab222. [Google Scholar]
  42. Yang, J.; Ye, F.; Huang, Y. Mitochondrial genomes of four katydids (Orthoptera: Phaneropteridae): New gene rearrangements and their phylogenetic implications. Gene 2016, 575, 702–711. [Google Scholar] [CrossRef]
  43. Yang, J.; Ren, Q.; Huang, Y. Complete mitochondrial genomes of three crickets (Orthoptera: Gryllidae) and comparative analyses within Ensifera mitogenomes. Zootaxa 2016, 4092, 529. [Google Scholar] [CrossRef] [PubMed]
  44. Zhou, Z.J.; Zhao, L.; Liu, N.; Guo, H.; Guan, B.; Di, J.; Shi, F. Towards a higher-level Ensifera phylogeny inferred from mitogenome sequences. Mol. Phylogenetics Evol. 2017, 108, 22–33. [Google Scholar] [CrossRef]
  45. Arndt, A.; Smith, M.J. Mitochondrial gene rearrangement in the sea cucumber genus Cucumaria. Mol. Biol. Evol. 1998, 15, 1009–1016. [Google Scholar] [CrossRef] [PubMed] [Green Version]
  46. Excoffier, L. Evolution of human mitochondrial DNA: Evidence for departure from a pure neutral model of populations at equilibrium. J. Mol. Evol. 1990, 30, 125–139. [Google Scholar] [CrossRef] [PubMed]
  47. Boore, J.L.; Brown, W.M. Big trees from little genomes: Mitochondrial gene order as a phylogenetic tool. Curr. Opin. Genet. Dev. 1998, 8, 668–674. [Google Scholar] [CrossRef]
  48. Li, Y.T.; Xin, Z.Z.; Tang, Y.Y.; Yang, T.T.; Tang, B.P.; Sun, Y.; Zhang, D.Z.; Zhou, C.L.; Liu, Q.N.; Yu, X.M. Comparative Mitochondrial Genome Analyses of Sesarmid and Other Brachyuran Crabs Reveal Gene Rearrangements and Phylogeny. Front. Genet. 2020, 11, 536640. [Google Scholar] [CrossRef] [PubMed]
  49. Zhang, J.; Miao, G.; Hu, S.; Sun, Q.; Ding, H.; Ji, Z.; Guo, P.; Yan, S.; Wang, C.; Kan, X.; et al. Quantification and evolution of mitochondrial genome rearrangement in Amphibians. BMC Ecol. Evol. 2021, 21, 19. [Google Scholar] [CrossRef]
  50. Lavrov, D.V.; Boore, J.L.; Brown, W.M. Complete mtDNA sequences of two millipedes suggest a new model for mitochondrial gene rearrangements: Duplication and nonrandom loss. Mol. Biol. Evol. 2002, 19, 163–169. [Google Scholar] [CrossRef] [Green Version]
  51. Chang, H.; Qiu, Z.; Yuan, H.; Wang, X.; Huang, Y. Evolutionary rates of and selective constraints on the mitochondrial genomes of Orthoptera insects with different wing types. Mol. Phylogenetics Evol. 2020, 145, 106734. [Google Scholar] [CrossRef] [PubMed]
  52. Yunyun, L.; Yanping, L.; Zhiqiang, R.; Chao, B.; Xinxin, Y.; Junxing, Y.; Wansheng, J.; Qiong, S. The Complete Mitochondrial Genome of Glyptothorax macromaculatus Provides a Well-Resolved Molecular Phylogeny of the Chinese Sisorid Catfishes. Genes 2018, 9, 282. [Google Scholar]
  53. Renfu, S.; Mark, D.; Anna, M.; Barker, S.C. Rates of gene rearrangement and nucleotide substitution are correlated in the mitochondrial genomes of insects. Mol. Biol. Evol. 2003, 20, 1612–1619. [Google Scholar]
  54. Wang, C.Y.; Zhao, M.; Wang, S.J.; Xu, H.L.; Yang, Y.M.; Liu, L.N.; Feng, Y. The Complete Mitochondrial Genome of Lepidotrigona flavibasis (Hymenoptera: Meliponini) and High Gene Rearrangement in Lepidotrigona Mitogenomes. J. Insect Sci. 2021, 21, 10–11. [Google Scholar] [CrossRef] [PubMed]
  55. Jin, J.J.; Yu, W.B.; Yang, J.B.; Song, Y.; dePamphilis, C.W.; Yi, T.S.; Li, D.Z. GetOrganelle: A fast and versatile toolkit for accurate de novo assembly of organelle genomes. Genome Biol. 2020, 21, 241. [Google Scholar] [CrossRef]
  56. Bernt, M.; Donath, A.; Jühling, F.; Externbrink, F.; Florentz, C.; Fritzsch, G.; Pütz, J.; Middendorf, M.; Stadler, P.F. MITOS: Improved de novo metazoan mitochondrial genome annotation. Mol. Phylogenetics Evol. 2013, 2, 313–319. [Google Scholar] [CrossRef] [PubMed]
  57. Standley, D.M. MAFFT multiple sequence alignment software version 7: Improvements in performance and usability. Mol. Biol. Evol. 2013, 30, 772. [Google Scholar]
  58. Gary, B. Tandem repeats finder: A program to analyze DNA sequences. Nucleic Acids Res. 1999, 27, 573–580. [Google Scholar]
  59. Perna, N.T.; Kocher, T.D. Patterns of nucleotide composition at fourfold degenerate sites of animal mitochondrial genomes. J. Mol. Evol. 1995, 41, 353–358. [Google Scholar] [CrossRef] [PubMed]
  60. Yang, Z. PAML 4: Phylogenetic analysis by maximum likelihood. Mol. Biol. Evol. 2007, 24, 1586–1591. [Google Scholar] [CrossRef] [PubMed]
  61. Grant, J.R.; Stothard, P. The CGView Server: A comparative genomics tool for circular genomes. Nucleic Acids Res. 2008, 36, 181–184. [Google Scholar] [CrossRef]
  62. Lanfear, R.; Frandsen, P.B.; Wright, A.M.; Senfeld, T.; Calcott, B. Partition Finder 2: New Methods for Selecting Partitioned Models of Evolution for Molecular and Morphological Phylogenetic Analyses. Mol. Biol. Evol. 2017, 34, 772–773. [Google Scholar] [PubMed] [Green Version]
  63. Sanderson, M.J. r8s: Inferring absolute rates of molecular evolution and divergence times in the absence of a molecular clock. Bioinformatics 2003, 19, 301–302. [Google Scholar] [CrossRef] [PubMed] [Green Version]
  64. Ronquist, F.; Huelsenbeck, J.P. MrBayes 3: Bayesian phylogenetic inference under mixed models. Bioinformatics 2003, 19, 1572–1574. [Google Scholar] [CrossRef] [PubMed] [Green Version]
  65. Zhang, D.; Gao, F.; Jakovlić, I.; Zou, H.; Zhang, J.; Li, W.X.; Wang, G.T. PhyloSuite: An integrated and scalable desktop platform for streamlined molecular sequence data management and evolutionary phylogenetics studies. Mol. Ecol. Resour. 2020, 20, 348–355. [Google Scholar] [CrossRef]
  66. Letunic, I.; Bork, P. Interactive tree of life (iTOL) v3: An online tool for the display and annotation of phylogenetic and other trees. Nucleic Acids Res. 2016, 44, 242–245. [Google Scholar] [CrossRef]
  67. Zhang, J.; Kan, X.; Miao, G.; Hu, S.; Sun, Q.; Tian, W. qMGR: A new approach for quantifying mitochondrial genome rearrangement. Mitochondrion 2020, 52, 20–23. [Google Scholar] [CrossRef] [PubMed]
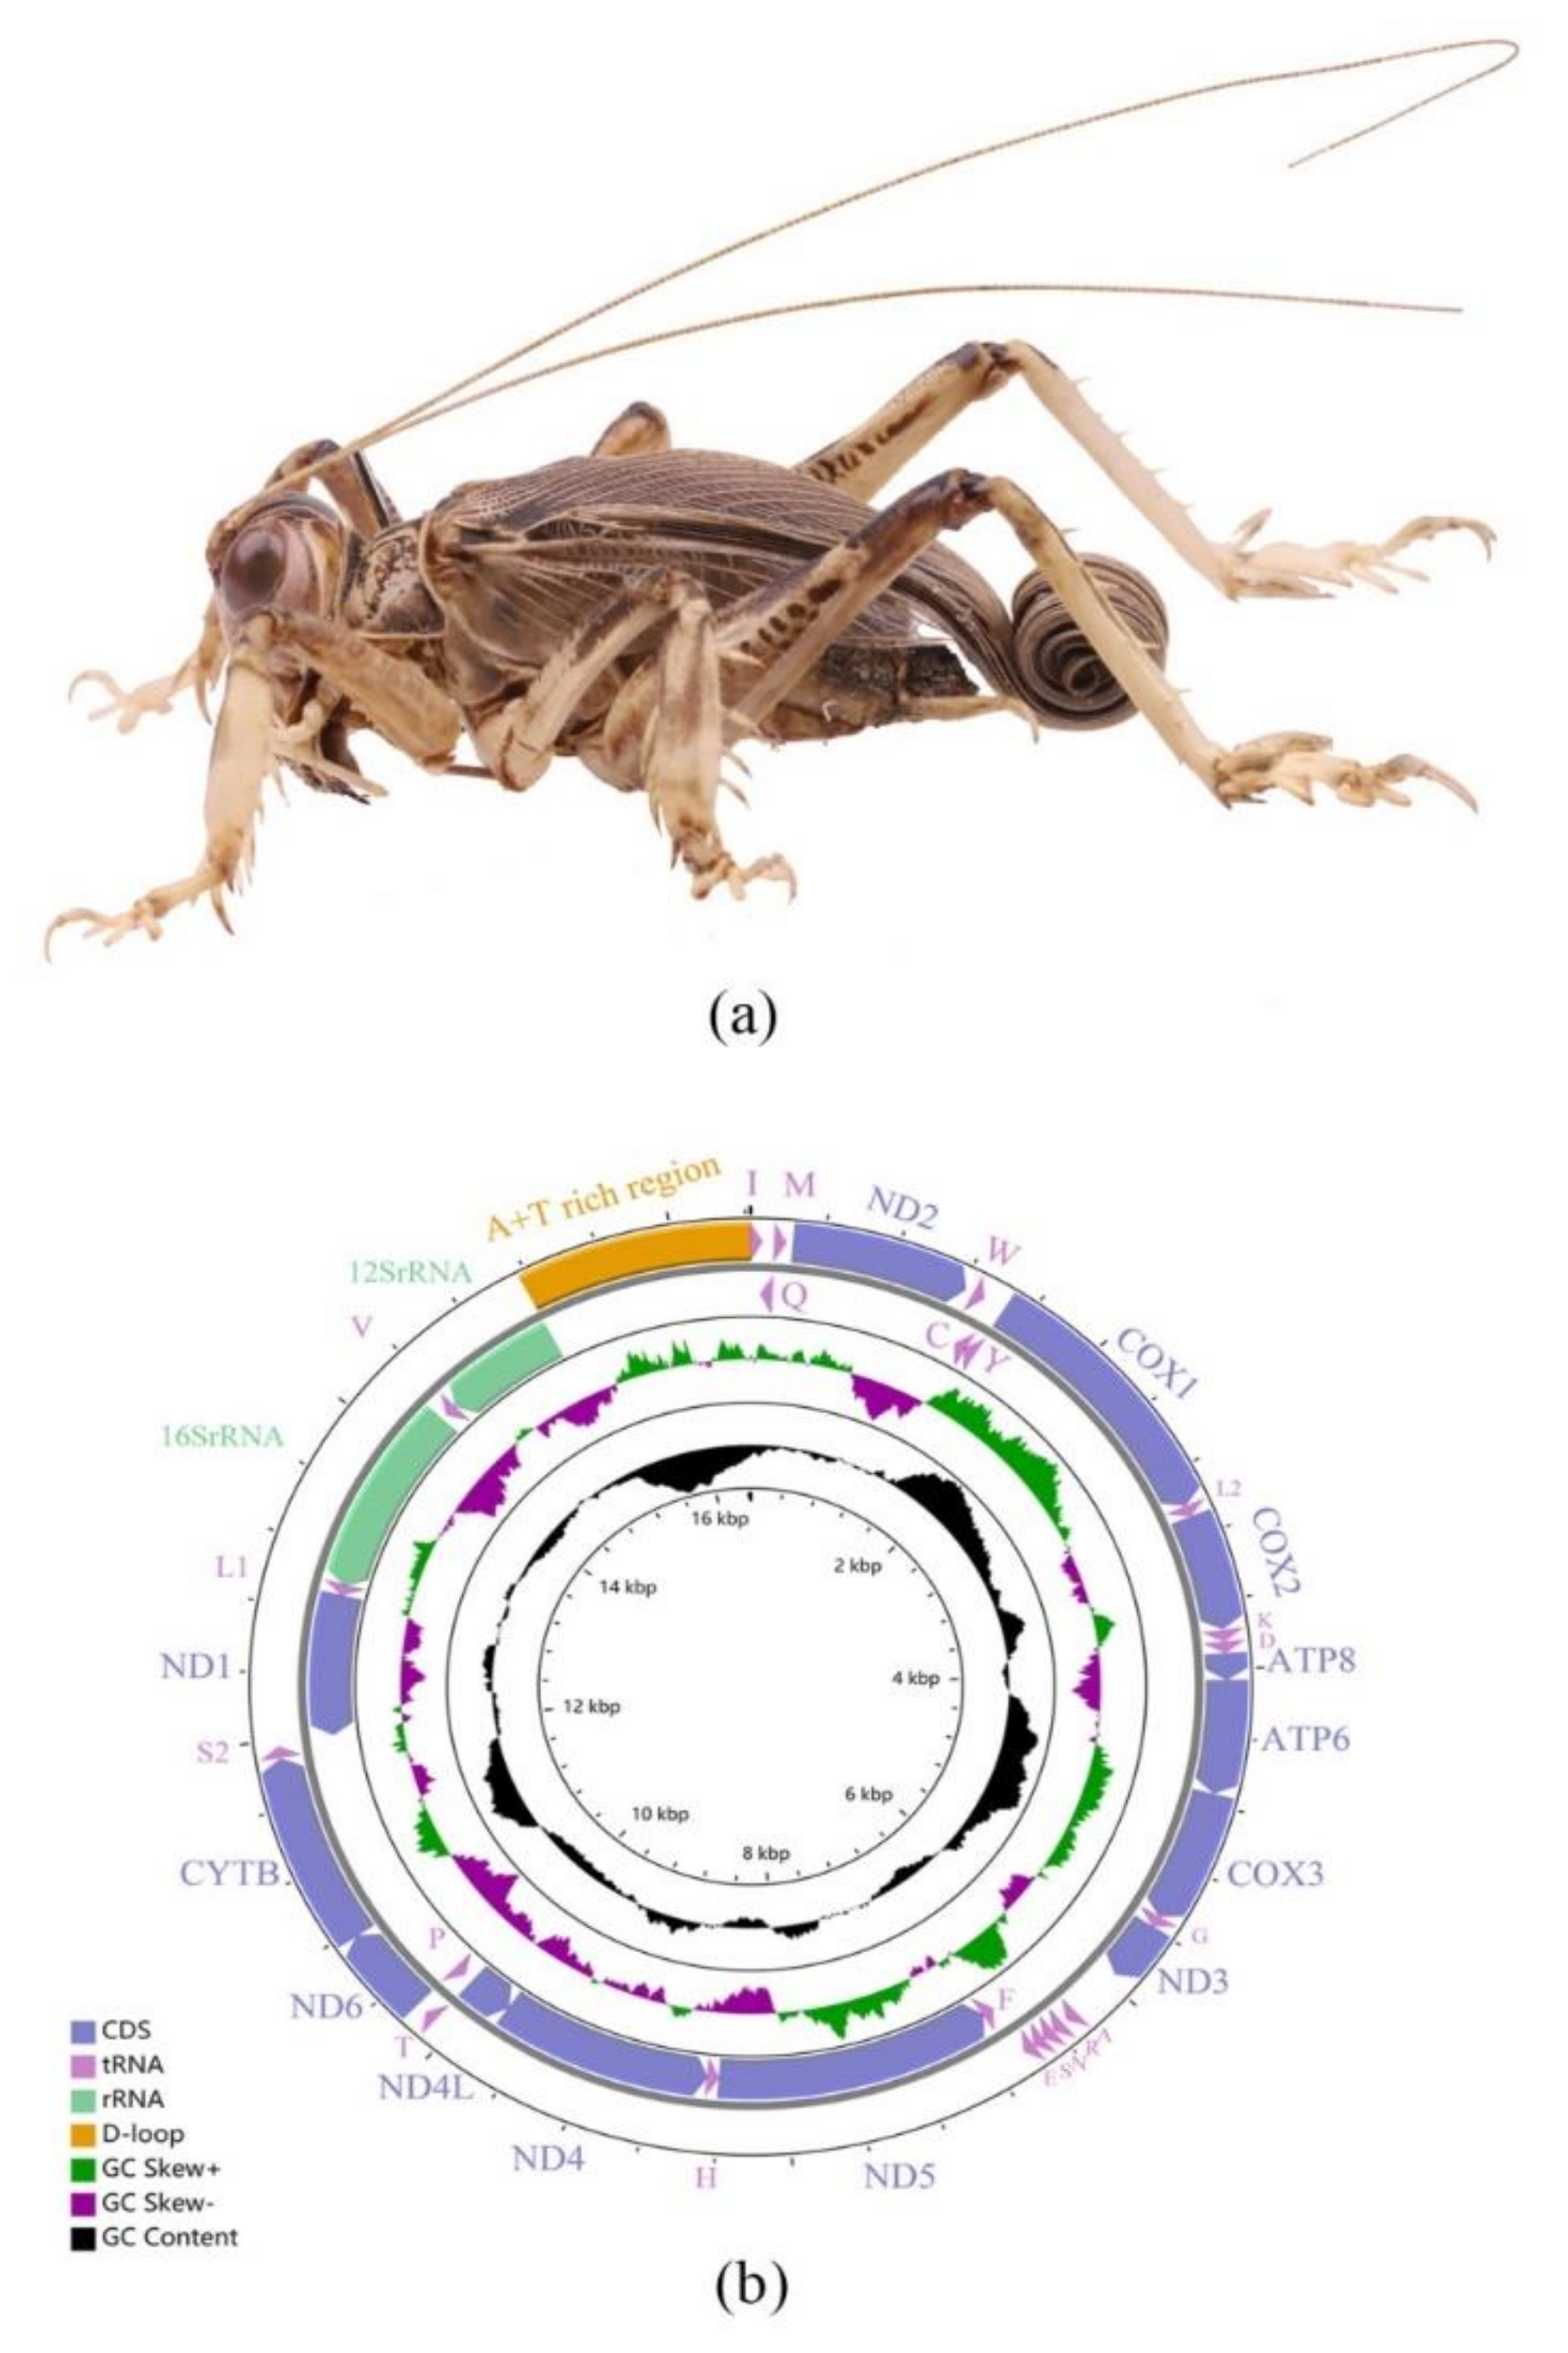
Figure 1. Mitogenome of S. jimo. (a) Morphology of S. jimo, lateral view. (b) Circular map of the mitochondrial genome.
Ijms 23 12094 g001
Figure 2. The nucleotide composition and skew of the S. jimo mitogenome. (a) Nucleotide composition (A/T/G/C percentage) of the mitogenome (indicated as complete) as well as ribosomal RNA (rRNA), transfer RNA (tRNA), and protein-coding genes. (b) AT-skew and GC-skew across the mitogenome (indicated as complete) and rRNA, tRNA, and protein-coding genes.
Ijms 23 12094 g002aIjms 23 12094 g002b
Figure 3. RSCU of the S. jimoS. jimo mitogenome. The bar length represents the accumulated scores of all codons for each amino acid (AA). The numbers on each bar represent the AA ratios of all amino acids in the mitochondrial genome.
Ijms 23 12094 g003
Figure 4. Comparison of mitochondrial gene arrangements among different Ensiferan species. (a) The phylogenetic tree was inferred from the nucleotide sequences of 13 PCGs and 2 rRNA genes using Bayesian inference (BI) and maximum likelihood (ML) methods. Values on the branches indicated Bootstrap support. Values are shown next to the nodes; ML bootstrap support values in black, BI bootstrap support values in blue, and divergence times in red. (b) Gene orders of the different mitochondrial gene arrangement types.
Ijms 23 12094 g004
Figure 5. The mechanisms for the eight gene arrangement types in the Ensiferan mitogenome. Genes encoded by the heavy strand (J-strand) have been denoted using a minus sign, whereas those encoded on the light strand (N-strand) have been denoted without one. Genes marked with an asterisk represent ones that were randomly deleted. Differently colored boxes represent different genes.
Ijms 23 12094 g005
Figure 6. Distribution of rearrangement frequencies (RFs) and rearrangement scores (RSs) for the eight gene arrangement types in Ensifera, based on the application of qMGRs. (a) The RS of each arrangement type. (b) The RF of every single mitochondrial gene in all the analyzed mitogenomes.
Ijms 23 12094 g006
Figure 7. Natural selection strength and the ratio of non-synonymous to synonymous substitutions (ω) were calculated in codeML for the 13 protein-coding mitochondrial genes of the eight Ensifera gene arrangement types. (a) ka, (b) ks, and (c) ka/ks(ω).
Ijms 23 12094 g007
Figure 8. Analysis of natural selection strength and nucleotide substitution rates. (a) Histogram of the mean ka/ks of the combined dataset of 13 protein-coding genes. (b) Nucleotide substitution rates for the eight gene arrangement types.
Ijms 23 12094 g008
Publisher’s Note: MDPI stays neutral with regard to jurisdictional claims in published maps and institutional affiliations.