Abstract
Survival and adaptation to seasonal changes are challenging for insects. Many temperate insects such as the rice stem borer (Chilo suppressalis) overcome the adverse situation by entering diapause, wherein development changes dynamically occur and metabolic activity is suppressed. The photoperiod and temperature act as major environmental stimuli of diapause. However, the physiological and molecular mechanisms that interpret the ecologically relevant environmental cues in ontogenetic development during diapause termination are poorly understood. Here, we used genome-wide high-throughput RNA-sequencing to examine the patterns of gene expression during diapause termination in C. suppressalis. Major shifts in biological processes and pathways including metabolism, environmental information transmission, and endocrine signalling were observed across diapause termination based on over-representation analysis, short time-series expression miner, and gene set enrichment analysis. Many new pathways were identified in diapause termination including circadian rhythm, MAPK signalling, Wnt signalling, and Ras signalling, together with previously reported pathways including ecdysteroid, juvenile hormone, and insulin/insulin-like signalling. Our results show that convergent biological processes and molecular pathways of diapause termination were shared across different insect species and provided a comprehensive roadmap to better understand diapause termination in C. suppressalis.
1. Introduction
The capacity to enter diapause is pervasive in insects which enables them to survive adverse seasonal environments such as harsh winters and synchronise their life cycle with favourable conditions for development and reproduction [1,2]. Diapause is not a cessation of development; instead, it is a dynamic alternate developmental process involving physiologically distinct phases: pre-diapause, diapause, and post-diapause [3]. Furthermore, diapause is a succession of three subphases: initiation, maintenance, and termination [3,4]. Insect diapause can be obligatory, with no external environmental stimuli and occur regardless of environmental conditions, or facultative, wherein specific environmental cues trigger a response and induce diapause [3]. Insects have diverse diapause timings and may occur in the egg, larva or nymph, pupa, or adult stage [4,5]. The photoperiod and temperature are the primary environmental signals for facultative diapause initiation [6]. Especially the photoperiod is the major signal through which most insects anticipate seasonal changes [7].
Environmental signals can also stimulate insects to terminate diapause. This occurs when environmental conditions are favourable with the stimuli passing a critical threshold, allowing insects to continue ontogenetic development [8]. Termination of diapause under field conditions (horotelic termination) is a relatively slow process [9]. In contrast, termination of diapause under laboratory conditions (tachytelic termination) can be rapid [9,10]. Insects can perceive various environmental signals as stimuli for diapause termination. For example, low temperature is a necessary signal to terminate diapause for some insects such as Chymomyza costata [4], whereas moisture is more important for other insects [11]. The photoperiod is the most reliable and steady environmental signal amongst signals that seasonally change. Therefore, many insects have evolved to utilise the photoperiod for not only inducing of diapause but also for terminating it [3]. Although not as steady as the photoperiod and temperature, as mentioned earlier, it also plays an important role in the termination of diapause [4,12,13].
The rice stem borer Chilo suppressalis is one of the most serious pests of rice in Asia [14] and causes significant annual damage to crop yield [15]. C. suppressalis larvae are capable of undergoing facultative diapause when the day length is shorter than the critical duration in autumn [16], even though the average temperature is still above 27 °C in the field [16]. Diapausing C. suppressalis larvae are able to endure cold and lack of food, which enables them to survive upcoming harsh winters [17]. Laboratory studies showed that C. suppressalis can be induced to enter diapause by a short photoperiod, and night length is a key component for initiating diapause [16,18,19]. In contrast, diapause can be terminated when field-collected C. suppressalis larvae (from the winter period) are exposed to long photoperiods (light:dark, 16:8) and high temperatures (15–30 °C) in the laboratory [16].
Many studies have focused on revealing the physiological and molecular mechanisms of diapause under field or laboratory conditions. Transcriptomic analysis of field-collected pre-diapausing C. suppressalis larvae revealed that pathways involving neuroactive ligand–receptor interaction, lysosomes, and glycerolipid metabolism were associated with pre-diapause [20]. Comparative transcriptomic analysis of 11 insect species revealed that a set of core genes involved in circadian rhythmicity, insulin signalling, and Wnt signalling were differentially regulated during diapause [21]. However, our current understanding of the molecular mechanisms of diapause termination is unclear.
In this study, diapausing C. suppressalis larvae and diapause-terminating larvae induced by long photoperiods (light:dark 16:8) and high temperature (25 °C) were collected at three different time points and their transcriptomes sequenced. Examination of the patterns of gene expression in C. suppressalis revealed the biological processes and molecular pathways involved in diapause termination in a panoramic manner based on over-representation analysis, short time-series expression miner, and gene set enrichment analysis.
2. Results
2.1. Characteristics, Functional Annotation, and Classification of Assembled Transcripts
Transcriptomic changes in C. suppressalis larvae during diapause termination were examined in response to long photoperiods (light:dark 16:8) and high temperature (25 °C) at 0, 4, 8, and 12 days (designated as WSG1, WSG2, WSG3, and WSG4, respectively).
A total of 85.75 Gb of clean bases (number of clean reads multiply read length, saved in Gb unit) containing 580.78 million clean reads (reads that passed quality control) was generated from these four groups with 12 samples in all, and each sample contained ≥6.42 Gb of clean bases (43.41 million clean reads) (Table 1). Between 39.93 and 51.21 million clean reads were mapped to the reference genome [22] for each sample, with total map read rates from 84.18 to 93.50%. Approximately 4.22 to 7.14% of total reads were mapped to multiple locations (Table 1). Sequence assembly and functional annotation revealed 25,913 genes, including 14,799 known genes and 11,114 newly detected genes. Together with the transcriptome coverage calculated (Table 1), all results showed that the sequencing had good depth and coverage [23].

Table 1.
Quality control and mapped results of sequencing data.
2.2. Detection of Differentially Expressed Genes (DEGs)
DEGs were identified by comparing the genes in a total of six possible pairs of diapausing C. suppressalis sample groups (WSG1) and three other treated sample groups (WSG2, WSG3, WSG4). A total of 3734 genes were differentially expressed in at least one of the six comparisons (Figure 1A). Among them, 2425 DEGs were identified in WSG1_vs_WSG2 (1385 upregulated genes and 1040 downregulated genes). This was far more than the number identified in WSG2_vs_WSG3 (70 genes) and WSG3_vs_WSG4 (54 genes). Meanwhile, 2037 DEGs (1199 upregulated genes and 838 downregulated genes) were identified in WSG1_vs_WSG4, which is close to WSG1_vs_WSG3 (2056 DEGs; 1096 upregulated genes and 960 downregulated genes). There were 1056 shared or common DEGs in the following comparisons: WSG1_vs_WSG2, WSG1_vs_WSG3, and WSG1_vs_WSG4 (Figure 1B), which represented the DEGs between the state of diapause and terminating diapause.
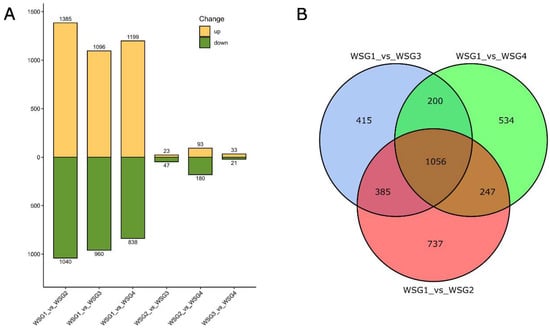
Figure 1.
Differently expressed genes (DEGs) of comparison pairs. (A) Up- and down-regulated genes in all possible comparisons of diapausing larvae (WSG1) and larvae that were exposed to 4, 8, and 12 days of long day and high temperature conditions in the laboratory (WSG2, WSG3, WSG4 respectively). The numbers on the top and bottom of each end of the bar indicate the quantities of up- and down regulated DEGs. (B) Overview of DEG comparisons of WSG1 versus WSG2, WSG1 versus WSG3, and WSG1 versus WSG4. WSG1 was regarded as the control. The numbers within the circles indicate the DEG quantities.
Shared DEGs were classified on the basis of Gene Ontology (GO) and Kyoto Encyclopaedia of Genes and Genomes (KEGG) annotations to reveal the biological processes and pathways associated with diapause termination. GO classification was performed for three major categories: biological process, molecular function, and cellular component. Most DEGs were assigned to metabolic and cellular process, followed by biological regulation in biological processes. Meanwhile, most DEGs were categorised into catalytic activity, binding, and transporter activity in the molecular function group. Finally, most DEGs were classified to membrane- and cell parts in terms of cellular components (Figure 2, Supplementary Table S1). KEGG orthology classification was applied to the shared DEGs in all top categories of the KEGG pathway maps. Lysosomes had the most DEGs in the cellular process category, while the most predominant DEGs were found in the cAMP signalling pathway, neuroactive ligand–receptor interaction, and AMPK signalling pathway in the environmental information-processing category. Protein processing in the endoplasmic reticulum contained the most DEGs for the genetic information processing category, while drug metabolism and pancreatic secretion DEGS were mostly found in metabolism and organismal systems, respectively (Figure 3, Supplementary Table S2). The category of human diseases is not shown in the figure because C. suppressalis is an insect.
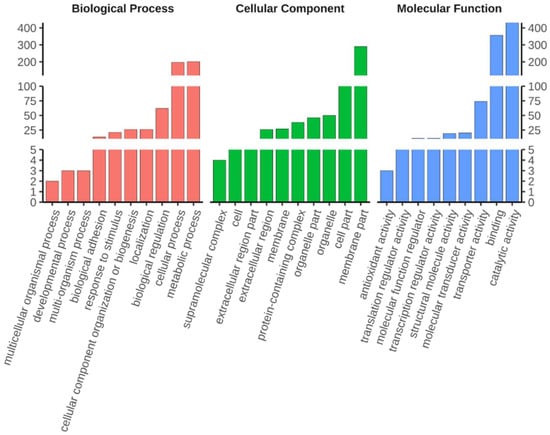
Figure 2.
Gene ontology (GO) terms that were significantly enriched in shared DEGs upon diapause termination. The GO terms containing the top ten number of DEGs (with ties) within three GO annotation categories (stated at the top of the image) are shown. The y-axis indicates the number of DEGs.
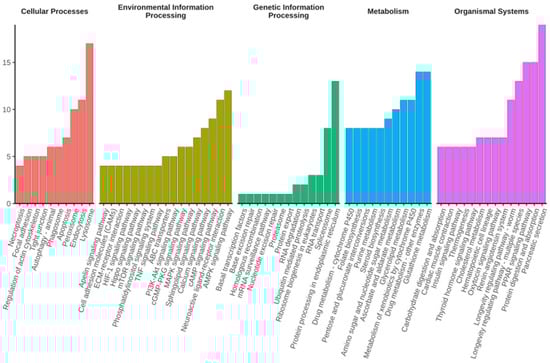
Figure 3.
Kyoto Encyclopaedia of Genes and Genomes (KEGG) pathways that were significantly enriched in shared DEGs upon diapause termination. KEGG pathways with the top 10 number of DEGs (with ties) within one KEGG category are shown. The y-axis indicates the number of DEGs.
2.3. Short Time-Series Expression Miner
A short time-series expression miner (STEM) was applied to all DEGs from all six possible comparisons of WSG1, WSG2, WSG3, and WSG4 to detect temporal differences in gene expression profiles associated with diapause termination.
Twenty profiles were clustered according to gene expression. Eight of these profiles showed significant expressional patterns in the process of diapause termination (p < 0.05) (Figure 4). Profiles 0, 2, and 6 contained clusters of genes exhibiting downregulated expression trends, whereas the genes of all other profiles showed upregulated expression trends. Profile 0 (737 genes) and profile 19 (832 genes) clustered more DEGs than the other profiles. Subsequently, GO enrichment analysis was performed on each of these clustered profiles to identify overrepresented biological pathways or processes. Profiles 0, 2, 6, 12, 13, 17, 18, and 19 had significantly enriched GO terms (q value < 0.05) (Table 2). Profile 0 showed significantly enriched genes related to biosynthetic processes (including small molecules, fatty acids, carboxylic acids, and monocarboxylic acids) and catabolic processes (including organic substances and organonitrogen compounds) (Table 2). Profile 19 only showed significantly enriched GO terms in small molecule catabolic processes and extracellular regions.
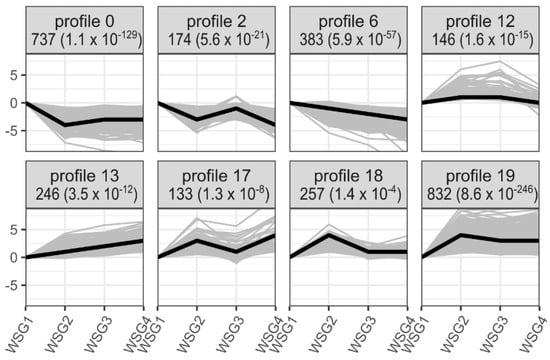
Figure 4.
Significant temporal expression patterns of DEGs from all pairwise comparisons of WSG1-WSG4. All DEGs served as input in short time-series expression miner (STEM) analysis. The eight profiles suggesting the expression patterns of clustered genes are significant (p < 0.05) are all shown. The number of DEGs for each profile are noted at the top of each panel followed by a p value in parentheses. Thin grey lines indicate expression patterns of each individual genes clustered in the profile, while thick black lines represent the expressional trend of each profile. WSG1-WSG4 on the x-axis represent 0, 4, 8, and 12 days of treatment, respectively, while the numeric values on the y-axis represent normalised expression values.
Table 2.
GO enrichment of significant profiles from the STEM analysis.
KEGG enrichment analysis was also implemented to each profile. Profiles 0, 13, 17, 18, and 19 were identified as significant KEGG pathways (q-value < 0.05) (Table 3). Profile 0 showed significantly enriched genes involved in the PPAR signalling pathway, AMPK signalling pathway, Rap1 signalling pathway, GTP-binding proteins, and proteasome. Meanwhile, steroid biosynthesis, insect hormone biosynthesis, pancreatic secretion, and PPAR signalling pathways were enriched in profile 19 (Table 3). The pathways of insulin secretion and neuroactive ligand–receptor interactions were enriched in the other profiles (Table 3).
Table 3.
KEGG enrichment of STEM analysis significant profiles.
2.4. Changes during the Onset of Diapause Termination
Gene set enrichment analysis (GSEA) using GO gene sets and KEGG pathway gene sets was applied to WSG1 vs. WSG2 to reveal the functional interaction within all expressed genes at the onset of diapause termination. There were 148 negatively enriched gene sets (normalised enrichment score (NES) with a minus sign) and 59 positively enriched gene sets (NES with a positive sign) out of the total 431 detected gene sets from the KEGG pathway (Supplementary Table S3). The top 10 negatively enriched KEGG orthology (KO) terms of each category (except Brite hierarchies and human disease) ordered by the absolute value of NES are illustrated in Figure 5. Most of these pathways (such as the Rap1 signalling pathways and MAPK signalling pathway) were also found in KEGG annotations of shared DEGs, which supported and validated the results.
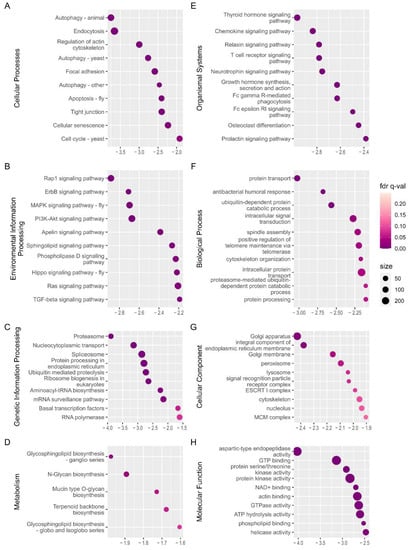
Figure 5.
Gene set enrichment analysis (GSEA) of WSG1 versus WSG2. (A–E) Significantly negatively enriched gene sets of the top categories of KEGG orthology pathways; the y-axis shows the definition from the gene set of the KEGG pathway. (F–H) Significantly enriched gene sets of GO annotation of major categories; the y-axis shows the GO terms of the enriched gene set. The normalised enrichment score (NES) is indicated on the x-axis in (A–H). A negative sign in NES demonstrates that gene sets were activated in state of WSG1. The circle size represents the number of genes in each enriched gene set.
GO gene set analysis showed that 137 out of the 2786 detected gene sets were significantly negatively enriched and 92 positively enriched (Supplementary Table S4). The top 10 negatively enriched GO terms ordered by the absolute value of NES are shown in Figure 5F–H and included protein transport, intracellular signal transduction, and GTP binding. The negative sign of NES demonstrates that the gene sets were activated in state of WSG1.
2.5. Changes Occurring in Late-Stage Diapause Termination
The first pupa appeared after 20 d of exposure to long-day photoperiods. Thus, the time point WSG4 (12th day) is likely to be in the late stage of diapause termination. Therefore, the dominant biological processes and physiological characteristics of late-stage diapause termination can be revealed by GSEA analysis applied to WSG1 and WSG4.
Seventy-four gene sets out of the total detected KEGG gene sets (431) (Supplementary Table S5) and 11 gene sets out of the total detected GO gene sets (2876) (Supplementary Table S6) were significantly negatively enriched, while these positively enriched KEGG and GO gene sets were 84 and 80, respectively (Supplementary Tables S5 and S6). The top 10 negatively enriched terms of each category for KEGG (except Brite hierarchies and human disease) ordered by the absolute value of NES are illustrated in Figure 6. There were much fewer negatively enriched KEGG gene sets or GO gene sets than those of WSG1 vs. WSG2 (148 and 137, respectively), and no gene set was negatively enriched under the GO category of cellular component. Cellular processes, autophagy, and cell cycle pathways were predominant (Figure 6A). The MAPK signalling pathway, ribosome biogenesis, terpenoid backbone biosynthesis, and circadian rhythm were ranked ahead in other KEGG categories (Figure 6B–E).
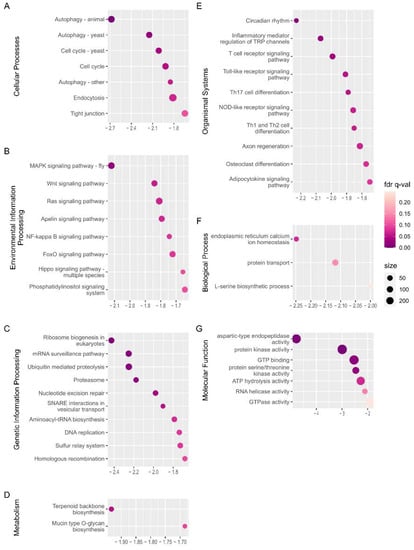
Figure 6.
GSEA analysis of WSG1 versus WSG4. (A–E) Significantly negatively enriched gene set of the top KEGG orthology pathway categories; the y-axis shows the definition of the gene set from the KEGG pathway. (F,G) Significantly negatively enriched gene set of GO annotation from the major domains; the y-axis shows the GO terms of the enriched gene set. The NES is indicated on the x-axis in (A–G). A negative sign in NES demonstrates that gene sets were activated in state of WSG1. The circle size represents the number of genes from each enriched gene set.
2.6. Verification of RNA Sequencing Data by Quantitative Polymerase Chain Reaction (qPCR)
The credibility of the RNA sequencing data was confirmed by qPCR. Six genes were selected from the DEGs and their relative expression levels were determined. Four genes were downregulated compared with WSG1 (evm.TU.scaffold97.len2227468.20, evm.TU.scaffold51.len2996135.22, evm.TU.scaffold34.len3691886.43, evm.TU.scaffold69.len2603645.54), whereas two genes were upregulated (evm.TU.scaffold33.len3817196.42, evm.TU.scaffold174.len1280571.10) (Figure 7A). These gene expression profiles were consistent with those of RNA-sequencing (Figure 7B), although the qPCR relative expression levels at WSG4 were highly variable.
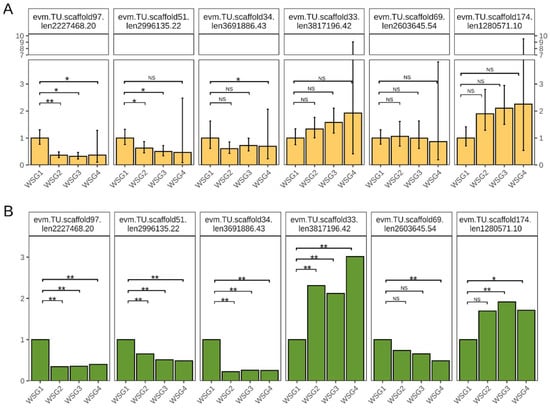
Figure 7.
Gene expression pattern verification. (A) Relative expression quantification of selected genes by qPCR. Error bars indicate the standard error among biological replicates. NS is not significant, * p-adjusted < 0.05, ** p-adjusted < 0.01 using Student’s t-test and multiple testing corrected with Benjamini–Hochberg method. (B) Gene expression fold change of selected genes using WSG1 as a control. Significance was determined by DEseq2, * p-adjusted < 0.05, ** p-adjusted < 0.01.
3. Discussion
C. suppressalis larvae exhibit facultative diapause, which is mainly affected by the photoperiod [16]. Larvae enter diapause in autumn (short photoperiods) and terminate it the following spring (long photoperiods co-occur with high temperature) when undisturbed in the field. A state of diapause allows C. suppressalis to endure and survive harsh winter conditions and prolonged periods without food to continue self-perpetuating populations when conditions are favourable. This study characterised the gene expression patterns across the developmental time course of diapause termination in C. suppressalis. Field-collected larvae were exposed to long photoperiods and high temperatures in the laboratory to terminate diapause, which contrasts with previous studies involving extreme endocrine or pharmacological manipulation. Previous studies mainly focused on comparisons of non-diapausing and diapausing states [20,24,25,26], or clarifying the threshold of environmental stimuli to induce or terminate diapause [16,19,27]. The results of our study provide a roadmap to understand the physiological and molecular mechanisms associated with insect diapause termination, especially in Lepidoptera.
When taking the order of events in diapause termination into account, it is reported that the increasing metabolic rates signal the onset of diapause termination and resumption of development. Studies in Rhagoletis pomonella demonstrated that the timing of thousands of DEGs co-occurred with increased metabolism during diapause termination [28], and an increased metabolic rate is a reliable indicator of this event [29]. In other words, differential expression of thousands of genes could be an indicator of the onset of diapause termination. Our study showed that the most differentially expressed genes were found in the comparison of WSG1 vs. WSG2 (Figure 1A). This suggests that the metabolic rates in C. suppressalis larvae dramatically increased after exposure to four long and warm days. Changes in the expression of WSG2_vs_WSG3 and WSG3_vs_WSG4 were small compared to WSG1_vs_WSG2 (Figure 1A), indicating that no dramatic change occurred between day 5–12 of the long photoperiod, high temperature treatment. This pattern suggests that C. suppressalis terminated diapause within four days of long light and high temperature at the transcriptional level. However, the precise timing of diapause termination in C. suppressalis requires further study.
A total of 1056 shared DEGs were identified when WSG2, WSG3, and WSG4 were compared to WSG1 (Figure 1B). These DEGs reflected the difference in gene expression between diapausing and diapause-terminating C. suppressalis. KEGG classification of shared DEGs showed that multiple pathways play essential roles in diapause termination (Figure 3). Many differentially expressed KEGG pathways found in C. suppressalis diapause termination were also found in R. pomonella (Diptera family member that diapauses in pupa), such as mTOR signalling, purine metabolism, and steroid biosynthesis [28]. Metabolites such as glucose, pyruvate, succinate, and malate increased during diapause termination in Helicoverpa armigera triggered by injecting 20E [30]. Interestingly, pathways such as carbohydrate metabolism, glycan biosynthesis and metabolism, and pyruvate metabolism were classified as shared DEGs (Figure 3). Enzyme activities associated with glycogen metabolism (such as phosphorylase and glycogen synthetase) were significantly altered during diapause in C. suppressalis [31], confirming the credibility of our experimental results. Furthermore, the similarity in diapause termination metabolic processes among different insect species suggests that they may share analogous mechanisms.
GSEA can provide insights into biological mechanisms in gene sets (i.e., KEGG pathways and GO categories) level between two states of interest, particularly that are subtle at the level of individual genes [32]. Accordingly, the onset and late stage of diapause termination of C. suppressalis were analysed with GSEA in this study. Since the WSG1 was set as control, negatively enriched pathways and biological processes are these that activated in the state of WSG1 and positively enriched ones are these that activated in the state of WSG2 or WSG4. In other words, negatively enriched pathways and biological processes are functioning to maintain insects in state of diapause. Therefore, they are important to explain the molecular changes of diapause termination.
Time-series analysis confirmed that major gene expression changes occurred in the first period of the time course involving diapause termination, especially profiles 0 and 19, which contained nearly half of the genes analysed (Figure 4). Many GO terms related to biosynthetic and catabolic processes were enriched in these two profiles (Table 2), suggesting consistency in the increasing metabolic rate during the initiation of diapause termination [28].
Extensive research has shown that changes in environmental cues initiate a cascade of endocrine events that control diapause [5,33]. Steroid biosynthesis and insect hormone biosynthesis pathways enriched in profile 19 showed consistency in the endocrine system in response to changes in photoperiod length (Table 3). Moreover, these endocrine events occurred in the early stages of diapause termination (Figure 4).
The ecdysteroid-, juvenile hormone (JH)-, and insulin/insulin-like signalling pathways regulate responses to environmental changes and are involved in diapause in many insects [5,34]. In pre-adult diapause, ecdysteroids (such as 20-hydroxyecdysone in insects) are generally regarded as diapause terminators [5,34]. Meanwhile, JH induces and maintains diapause in C. suppressalis [35]. In Culex pipiens, JH triggers diapause termination, and JH production is regulated by the insulin/insulin-like signalling pathway and the downstream FoxO gene [36]. Insulin-like peptides and its downstream FoxO signalling pathway increase trehalose anabolism and trigger diapause termination in Antheraea pernyi [37]. Hydrogen peroxide-induced diapause termination in Artemia cyst embryos showed that DEGs are involved in the Hippo- and MAPK signalling pathways [38]. Extracellular signal-regulated kinase (ERK) (a member of the mitogen-activated protein kinase (MAPK) family) is activated during the egg diapause-terminating process in Locusta migratoria [39]. ERK/MAPK regulates ecdysteroid and sorbitol metabolism in Bombyx mori through the transcription of key enzymes (sorbitol dehydrogenase-2 and EPPase) for embryonic diapause termination [40,41]. These pathways were also identified in this study during C. suppressalis diapause termination using STEM- or GSEA analysis. These consistencies validate the reliability of our results and demonstrate the convergence of mechanisms of diapause termination between different insects.
Currently, the links between environmental information such as the photoperiod and endocrine signals are poorly understood [42]. However, numerous studies have indicated that circadian clock genes and their regulators contribute to diapause regulation. A period gene knockout line of B. mori shows that the GABAeric pathway mediates the photoperiod information to the diapause hormone pathway [43]. Circadian transcription factors vrille and Par domain protein 1 may regulate signalling pathways underlying arrested eggs follicle development and fat accumulation in diapausing Culex pipiens females [44]. Circadian genes period and timeless promote lipid accumulation during diapause preparation in the diapause destined female Colaphellus bowringi [45]. N-acetyltransferase is considered a critical conjunction of photoperiodism between the circadian system and endocrine axis in Antheraea pernyi [46]. Our GSEA analysis of WSG1 and WSG4 pairs showed that the circadian rhythm pathway (ko04710) was the top enriched gene set (by NES) in the organismal system category (Figure 6), suggesting that this pathway also plays an important role in diapause termination of C. suppressalis. It is notable that the circadian rhythm pathway was not enriched in GSEA analysis in the comparison of WSG1_vs_WSG2. This likely indicates that only a few core genes participated in the early process of photoperiod information transmissions. This finding should be validated in future studies.
The identification of candidate genes and signalling pathways for diapause termination in C. suppressalis provides a foundation for understanding how environmental cues are transformed into endocrine events that regulate the diapause process. The key genes and pathways may be utilised to disturb the diapause process of C. suppressalis as a green strategy to control this pest insect. For instance, if C. suppressalis terminates diapause in an untimely manner, it cannot survive harsh conditions. Generally, exploring the mechanisms of diapause regulation will facilitate comparative research on regulatory factors conserved across insects [21]. Our results show that convergent biological processes and molecular pathways are shared across different insect species, although the specific genes regulating diapause termination may not be the same.
4. Materials and Methods
4.1. Insects and Collection of Samples
Diapausing C. suppressalis larvae were collected from rice straw left at the paddy side from Huai’an, Jiangsu, in January 2021. A random sample of diapausing larvae was immediately collected and designated WSG1. The remaining diapausing larvae were reared in the laboratory at 25 ± 1 °C under long photoperiod light:dark cycles (16:8 h) and a relative humidity of 70 ± 5% to terminate diapause. One sample group was collected every four days (at 9:00 a.m.) and a total of three groups (WSG2–WSG4) were collected. The remaining larvae were reared until pupation stage. The interval between the last sampling day and the day where the pupa was observed was noted. Each sample group contained three replicates, and each replicate consisted of four C. suppressalis larvae. All collected samples were frozen in liquid nitrogen and stored at −80 °C.
4.2. RNA Extraction, Library Construction, and Illumina Sequencing
RNA extraction, library construction, and sequencing were performed by Majorbio Bio-Pharm Biotechnology Co., Ltd. (Shanghai, China). Briefly, total RNA was extracted from stored C. suppressalis samples using TRIzol® reagent according to the manufacturer’s instructions (Invitrogen, Thermo Fisher Scientific, Waltham, MA, USA). The sequencing library was prepared using high-quality RNA (OD260/280 = 1.8–2.2, OD260/230 ≥ 2.0, RIN ≥ 6.5, 28S:18S ≥ 1.0) following the TruSeqTM RNA sample preparation kit (Illumina, San Diego, CA, USA) using 1 μg of the total RNA. Sequencing was performed with an Illumina NovaSeq 6000 instrument (2 × 150 bp read length) according to the manufacturer’s recommendations.
4.3. Read Mapping and Gene Functional Annotation
Raw reads were trimmed and filtered with SeqPrep (v. 1.2, https://github.com/jstjohn/SeqPrep (accessed on 29 October 2021)) and Sickle (v. 1.33, https://github.com/najoshi/sickle (accessed on 29 October 2021)) using default parameters. Then, clean reads were aligned to the reference genome in orientation mode using HISAT2 (v. 2.1.0, http://tophat.cbcb.umd.edu/ (accessed on 29 October 2021)) software, and the mapped reads were assembled using StringTie (v. 2.1.2, https://ccb.jhu.edu/software/stringtie/ (accessed on 29 October 2021)) software to obtain a full-length Unigene library. Gene functional annotation was performed using the following databases: non-redundant (NR), Swiss-Prot, Pfam, EggNOG, GO, and KEGG. To estimate transcriptome coverage, the number of annotated genes in each sample were divided by the number of annotated coding genes in the genome of C. suppressalis.
4.4. Differential Expression Gene Analysis
DEGs were identified between sample groups by calculating the expression level of each transcript according to the transcript per million (TPM) mapped reads method. RNA-sequencing by expectation-maximization (RSEM, v. 1.3.3, http://deweylab.biostat.wisc.edu/rsem/ (accessed on 29 October 2021)) was used to quantify gene abundance. The R package DESeq2 (differential expression analysis for sequence count data 2, v. 1.24.0) was used to analyse the DEGs. Genes with an absolute value fold-change ≥2 and p-adjusted value < 0.05 (using the Benjamini–Hochberg method for multiple testing correction) were considered differently expressed.
4.5. GO and KEGG Enrichment Analysis
GO and KEGG enrichment analyses were performed based on over-representation analysis (ORA) with the R package ClusterProfilter (v. 4.2.1) [47]. GO terms and KEGG pathways with p-adjusted values < 0.05 were used for subsequent analyses. Multiple testing was performed with the Benjamini–Hochberg method.
4.6. Short Time-Series Expression Miner
Short time-series expression miner (STEM) software (v. 1.3.11) was employed to cluster all DEGs from pairwise comparisons of WSG1-WSG4 to detect temporal gene expression patterns. Gene expression values were transformed into log-normalised data which served as input data. STEM analysis was performed using the STEM clustering method with default settings, except that the maximum unit change in the model profiles between time points was changed to 4. Each expression profile represented a gene set associated with the time-course of diapause termination in C. suppressalis. Gene sets with a p value < 0.05 were considered significant.
4.7. Gene Set Enrichment Analysis
Gene set enrichment analysis using GO gene sets and KEGG pathway gene sets were applied to WSG1 vs. WSG2 and WSG1 vs. WSG4, respectively, wherein WSG1 served as a control when calculating the log2 fold change of gene expression. This was performed to reveal the functional interaction within all expressed genes in different time courses involved in diapause termination. The WSG2 time point reflects transcriptional changes in the initiation of diapause termination, while the WSG4 time point shows transcriptional changes in the posterior process of diapause termination.
Genes in paired comparisons were ranked according to log2 transformed expression fold change, and the ranked gene list was analysed using GSEA package (v. 4.2.1, https://www.gsea-msigdb.org/gsea/index.jsp (accessed on 6 January 2022)). The analysis was performed using the GSEAPreranked tool with default settings except that the enrichment statistic was set to classic and min size was set to 1. KEGG and GO annotations of the C. suppressalis transcriptome were used as enrichment gene set data. Enriched gene sets with a nominal p-value < 0.05, FDR q-value < 0.25, and absolute value of normalised enrichment score (NES) > 1 were considered significant.
4.8. qPCR Verification
Six randomly selected DEGs were evaluated by qPCR to verify their expression levels in RNA sequencing. Specific primers (Supplementary Table S7) were designed using Primer3 (https://bioinfo.ut.ee/primer3-0.4.0/ (accessed on 21 February 2022 )). The qPCR template was prepared from the RNA used for transcriptomic sequencing. Total RNA (1000 ng) was reverse-transcribed to cDNA using PrimeScriptTM RT master mix (Perfect Real Time) (TaKaRa, Kusatsu, Japan). Each qPCR reaction was prepared as follows: 10 μL TB Green premix EX Taq II (Tli RNaseH plus) (TaKaRa), 2 μL cDNA template, 7.2 μL ddH2O, 0.4 μL forward primer (10 μM), and 0.4 μL reverse primer (10 μM). Each gene was analysed using three biological replicates and each biological replicate had at least three technical replicates. The reactions were carried out using a program that consisted of an initial heat activation step of 95 °C for 30 s, followed by 40 cycles of 95 °C for 5 s and 60 °C for 30 s in a LightCycler 480 II (Roche, Basel, Switzerland). Relative quantification was performed using the 2−ΔΔCt method [48] with histone 3 as a reference gene [49]. The relative expression levels of genes were compared using Student’s t-test instead of the multiple comparison test across all four time-points since all of these DEGs were obtained by pairwise comparison of the control (WSG1) and treatment (WSG2, WSG3, WSG4, respectively). The t-test p-values were corrected with the Benjamini–Hochberg method for multiple testing.
5. Conclusions
Our results provide a panoramic view of the molecular mechanisms of diapause termination in C. suppressalis in a time-series manner. The identified genes and molecular pathways associated with diapause termination validate the convergent molecular mechanisms of different insects. The new candidate genes and molecular pathways identified in this study should help integrate the understanding of the mechanisms of diapause termination.
Supplementary Materials
The following supporting information can be downloaded from https://www.mdpi.com/article/10.3390/ijms232012322/s1.
Author Contributions
Conceptualisation, J.F.; methodology, H.B. and H.Z.; software, H.B.; formal analysis, H.B.; investigation, H.Z., R.Z. and P.Y.; resources, R.Z.; writing—original draft preparation, H.B.; writing—review and editing, J.F. and H.B.; visualisation, H.B.; supervision, J.F.; project administration, G.L.; funding acquisition, J.F., G.L. and Q.Y. All authors have read and agreed to the published version of the manuscript.
Funding
This work was supported by the Jiangsu Agricultural Science and Technology Independent Innovation Fund (CX(20)3185, CX(20)1004), and the Earmarked Fund for China Agriculture Research System (CARS-01).
Institutional Review Board Statement
Not applicable.
Informed Consent Statement
Not applicable.
Data Availability Statement
RNA-seq data were deposited in the Sequence Read Archive (SRA) and are accessible under accession number PRJNA833604.
Conflicts of Interest
The authors declare no conflict of interest. The funders had no role in the study design; collection, analyses, or interpretation of data; writing of the manuscript; or decision to publish the results.
References
- Denlinger, D.L. Regulation of Diapause. Annu. Rev. Entomol. 2002, 47, 93–122. [Google Scholar] [CrossRef]
- Hahn, D.A.; Denlinger, D.L. Energetics of Insect Diapause. Annu. Rev. Entomol. 2011, 56, 103–121. [Google Scholar] [CrossRef] [PubMed]
- Koštál, V. Eco-Physiological Phases of Insect Diapause. J. Insect Physiol. 2006, 52, 113–127. [Google Scholar] [CrossRef]
- Koštál, V.; Štětina, T.; Poupardin, R.; Korbelová, J.; Bruce, A.W. Conceptual Framework of the Eco-Physiological Phases of Insect Diapause Development Justified by Transcriptomic Profiling. Proc. Natl. Acad. Sci. USA 2017, 114, 8532–8537. [Google Scholar] [CrossRef] [PubMed]
- Hutfilz, C. Endocrine Regulation of Lifespan in Insect Diapause. Front. Physiol. 2022, 13, 825057. [Google Scholar] [CrossRef] [PubMed]
- Masaki, S. Ecophysiological Consequences of Variability in Diapause Intensity. Eur. J. Entomol. 2013, 99, 143–154. [Google Scholar] [CrossRef]
- Beer, K.; Helfrich-Förster, C. Model and Non-Model Insects in Chronobiology. Front. Behav. Neurosci. 2020, 14, 601676. [Google Scholar] [CrossRef] [PubMed]
- Brent, C.S. Diapause Termination and Postdiapause in Lygus hesperus (Heteroptera: Miridae). J. Insect Sci. 2021, 21, 4. [Google Scholar] [CrossRef]
- Kostal, V.; Shimada, K.; Hayakawa, Y. Induction and Development of Winter Larval Diapause in a Drosophilid Fly, Chymomyza costata. J. Insect Physiol. 2000, 46, 417–428. [Google Scholar] [CrossRef]
- Hodek, I. Controversial Aspects of Diapause Development. Eur. J. Entomol. 2002, 99, 163–173. [Google Scholar] [CrossRef]
- Okuda, T. Significance of Water Contact as a Factor Terminating Larval Diapause in a Stem Borer, Busseola fusca. Entomol. Exp. Appl. 1990, 57, 151–155. [Google Scholar] [CrossRef]
- Zhang, X.; He, B.; Monticelli, L.S.; Du, W.; Ruan, C.; Desneux, N.; Zhang, J. Gradually Increasing the Temperature Reduces the Diapause Termination Time of Trichogramma dendrolimi while Increasing Parasitoid Performance. Insects 2022, 13, 720. [Google Scholar] [CrossRef]
- Hiroyoshi, S.; Reddy, G.V.P.; Mitsuhashi, J. Effects of Photoperiod, Temperature and Aging on Adult Diapause Termination and Post-Diapause Development in Female Asian Comma Butterflies, Polygonia c-aureum Linnaeus (Lepidoptera: Nymphalidae). J. Comp. Physiol. A Neuroethol. Sens. Neural. Behav. Physiol. 2018, 204, 849–858. [Google Scholar] [CrossRef]
- Luo, G.-H.; Yao, J.; Yang, Q.; Zhang, Z.-C.; Hoffmann, A.A.; Fang, J.-C. Variability in Development of the Striped Rice Borer, Chilo suppressalis (Lepidoptera: Pyralidae), Due to Instar Number and Last Instar Duration. Sci. Rep. 2016, 6, 35231. [Google Scholar] [CrossRef]
- Zhao, J.; Xu, L.; Sun, Y.; Song, P.; Han, Z. UDP-Glycosyltransferase Genes in the Striped Rice Stem Borer, Chilo suppressalis (Walker), and Their Contribution to Chlorantraniliprole Resistance. Int. J. Mol. Sci. 2019, 20, 1064. [Google Scholar] [CrossRef]
- Xiao, H.-J.; Mou, F.-C.; Zhu, X.-F.; Xue, F.-S. Diapause Induction, Maintenance and Termination in the Rice Stem Borer Chilo suppressalis (Walker). J. Insect Physiol. 2010, 56, 1558–1564. [Google Scholar] [CrossRef] [PubMed]
- Cho, J.R.; Lee, J.S.; Kim, J.J.; Lee, M.; Kim, H.S.; Boo, K.S. Cold Hardiness of Diapausing Rice Stem Borer, Chilo suppressalis Walker (Lepidoptera: Pyralidae). J. Asia-Pac. Entomol. 2005, 8, 161–166. [Google Scholar] [CrossRef]
- Chen, F.; Han, Y.; Hu, Q.; Hou, M. Diapause Induction and Photoperiodic Clock in Chilo suppressalis (Walker) (Lepidoptera: Crambidae). Entomol. Sci. 2011, 14, 283–290. [Google Scholar] [CrossRef]
- Zhou, Y.; Sun, D.; Quan, W.-L.; Ding, N.; Liu, W.; Ma, W.-H.; Wang, X.-P. Divergence in Larval Diapause Induction between the Rice and Water-Oat Populations of the Striped Stem Borer, Chilo suppressalis (Walker) (Lepidoptera: Crambidae). Environ. Sci. Pollut. Res. 2018, 25, 29715–29724. [Google Scholar] [CrossRef]
- Dong, C.-L.; Lu, M.-X.; Du, Y.-Z. Transcriptomic Analysis of Pre-Diapause Larvae of Chilo suppressalis (Walker) (Lepidoptera: Pyralidae) in Natural Populations. Comp. Biochem. Physiol. Part D Genom. Proteom. 2021, 40, 100903. [Google Scholar] [CrossRef]
- Ragland, G.J.; Keep, E. Comparative Transcriptomics Support Evolutionary Convergence of Diapause Responses across Insecta. Physiol. Entomol. 2017, 42, 246–256. [Google Scholar] [CrossRef]
- Ma, W.; Zhao, X.; Yin, C.; Jiang, F.; Du, X.; Chen, T.; Zhang, Q.; Qiu, L.; Xu, H.; Hull, J.J.; et al. A Chromosome-Level Genome Assembly Reveals the Genetic Basis of Cold Tolerance in a Notorious Rice Insect Pest, Chilo suppressalis. Mol. Ecol. Resour. 2020, 20, 268–282. [Google Scholar] [CrossRef]
- Wang, Y.; Ghaffari, N.; Johnson, C.D.; Braga-Neto, U.M.; Wang, H.; Chen, R.; Zhou, H. Evaluation of the Coverage and Depth of Transcriptome by RNA-Seq in Chickens. BMC Bioinform. 2011, 12, S5. [Google Scholar] [CrossRef] [PubMed]
- Atapour, M.; Moharramipour, S.; Barzegar, M. Seasonal Changes of Fatty Acid Compositions in Overwintering Larvae of Rice Stem Borer, Chilo suppressalis (Lepidoptera: Pyralidae). J. Asia-Pac. Entomol. 2007, 10, 33–38. [Google Scholar] [CrossRef]
- Izumi, Y.; Sonoda, S.; Tsumuki, H. Effects of Diapause and Cold-Acclimation on the Avoidance of Freezing Injury in Fat Body Tissue of the Rice Stem Borer, Chilo suppressalis Walker. J. Insect Physiol. 2007, 53, 685–690. [Google Scholar] [CrossRef]
- Sonoda, S.; Fukumoto, K.; Izumi, Y.; Ashfaq, M.; Yoshida, H.; Tsumuki, H. Expression Profile of Arylphorin Gene during Diapause and Cold Acclimation in the Rice Stem Borer, Chilo suppressalis Walker (Lepidoptera: Crambidae). Appl. Entomol. Zool. 2007, 42, 35–40. [Google Scholar] [CrossRef]
- Lu, M.; Cao, S.; Du, Y.; Liu, Z.; Liu, P.; Li, J. Diapause, Signal and Molecular Characteristics of Overwintering Chilo suppressalis (Insecta: Lepidoptera: Pyralidae). Sci. Rep. 2013, 3, 3211. [Google Scholar] [CrossRef] [PubMed]
- Ragland, G.J.; Egan, S.P.; Feder, J.L.; Berlocher, S.H.; Hahn, D.A. Developmental Trajectories of Gene Expression Reveal Candidates for Diapause Termination: A Key Life-History Transition in the Apple Maggot Fly Rhagoletis pomonella. J. Exp. Biol. 2011, 214, 3948–3959. [Google Scholar] [CrossRef]
- Ragland, G.J.; Fuller, J.; Feder, J.L.; Hahn, D.A. Biphasic Metabolic Rate Trajectory of Pupal Diapause Termination and Post-Diapause Development in a Tephritid Fly. J. Insect Physiol. 2009, 55, 344–350. [Google Scholar] [CrossRef]
- Lu, Y.-X.; Zhang, Q.; Xu, W.-H. Global Metabolomic Analyses of the Hemolymph and Brain during the Initiation, Maintenance, and Termination of Pupal Diapause in the Cotton Bollworm, Helicoverpa armigera. PLoS ONE 2014, 9, e99948. [Google Scholar] [CrossRef]
- Tsumuki, H.; Kanehisa, K. Enzymes Associated with Glycogen Metabolism in Larvae of the Rice Stem Borer, Chilo suppressalis WALKER: Some Properties and Changes in Activities during Hibernation. Appl. Entomol. Zool. 1979, 14, 270–277. [Google Scholar] [CrossRef]
- Subramanian, A.; Tamayo, P.; Mootha, V.K.; Mukherjee, S.; Ebert, B.L.; Gillette, M.A.; Paulovich, A.; Pomeroy, S.L.; Golub, T.R.; Lander, E.S.; et al. Gene Set Enrichment Analysis: A Knowledge-Based Approach for Interpreting Genome-Wide Expression Profiles. Proc. Natl. Acad. Sci. USA 2005, 102, 15545–15550. [Google Scholar] [CrossRef] [PubMed]
- Emerson, K.J.; Bradshaw, W.E.; Holzapfel, C.M. Complications of Complexity: Integrating Environmental, Genetic and Hormonal Control of Insect Diapause. Trends Genet. 2009, 25, 217–225. [Google Scholar] [CrossRef] [PubMed]
- Green, D.A.; Kronforst, M.R. Monarch Butterflies Use an Environmentally Sensitive, Internal Timer to Control Overwintering Dynamics. Mol. Ecol. 2019, 28, 3642–3655. [Google Scholar] [CrossRef] [PubMed]
- Yagi, S.; Fukaya, M. Juvenile Hormone As a Key Factor Regulating Larval Diapause of the Rice Stem Borer, Chilo suppressalis (Lepidoptera: Pyralidae). Appl. Entomol. Zool. 1974, 9, 247–255. [Google Scholar] [CrossRef]
- Sim, C.; Denlinger, D.L. Insulin Signaling and FOXO Regulate the Overwintering Diapause of the Mosquito Culex pipiens. Proc. Natl. Acad. Sci. USA 2008, 105, 6777–6781. [Google Scholar] [CrossRef]
- Li, Y.-N.; Ren, X.-B.; Liu, Z.-C.; Ye, B.; Zhao, Z.-J.; Fan, Q.; Liu, Y.-B.; Zhang, J.-N.; Li, W.-L. Insulin-Like Peptide and FoxO Mediate the Trehalose Catabolism Enhancement during the Diapause Termination Period in the Chinese Oak Silkworm (Antheraea pernyi). Insects 2021, 12, 784. [Google Scholar] [CrossRef]
- Chen, B.; Chu, T.-W.; Chiu, K.; Hong, M.-C.; Wu, T.-M.; Ma, J.-W.; Liang, C.-M.; Wang, W.-K. Transcriptomic Analysis Elucidates the Molecular Processes Associated with Hydrogen Peroxide-Induced Diapause Termination in Artemia-Encysted Embryos. PLoS ONE 2021, 16, e0247160. [Google Scholar] [CrossRef] [PubMed]
- Kidokoro, K.; Iwata, K.; Fujiwara, Y.; Takeda, M. Effects of Juvenile Hormone Analogs and 20-Hydroxyecdysone on Diapause Termination in Eggs of Locusta migratoria and Oxya yezoensis. J. Insect Physiol. 2006, 52, 473–479. [Google Scholar] [CrossRef] [PubMed]
- Fujiwara, Y.; Shindome, C.; Takeda, M.; Shiomi, K. The Roles of ERK and P38 MAPK Signaling Cascades on Embryonic Diapause Initiation and Termination of the Silkworm, Bombyx mori. Insect Biochem. Mol. Biol. 2006, 36, 47–53. [Google Scholar] [CrossRef] [PubMed]
- Fujiwara, Y.; Tanaka, Y.; Iwata, K.; Rubio, R.O.; Yaginuma, T.; Yamashita, O.; Shiomi, K. ERK/MAPK Regulates Ecdysteroid and Sorbitol Metabolism for Embryonic Diapause Termination in the Silkworm, Bombyx mori. J. Insect Physiol. 2006, 52, 569–575. [Google Scholar] [CrossRef] [PubMed]
- Hand, S.C.; Denlinger, D.L.; Podrabsky, J.E.; Roy, R. Mechanisms of Animal Diapause: Recent Developments from Nematodes, Crustaceans, Insects, and Fish. Am. J. Physiol. Regul. Integr. Comp. Physiol. 2016, 310, R1193–R1211. [Google Scholar] [CrossRef]
- Cui, W.-Z.; Qiu, J.-F.; Dai, T.-M.; Chen, Z.; Li, J.-L.; Liu, K.; Wang, Y.-J.; Sima, Y.-H.; Xu, S.-Q. Circadian Clock Gene Period Contributes to Diapause via GABAeric-Diapause Hormone Pathway in Bombyx mori. Biology 2021, 10, 842. [Google Scholar] [CrossRef] [PubMed]
- Chang, V.; Meuti, M.E. Circadian Transcription Factors Differentially Regulate Features of the Adult Overwintering Diapause in the Northern House Mosquito, Culex pipiens. Insect Biochem. Mol. Biol. 2020, 121, 103365. [Google Scholar] [CrossRef] [PubMed]
- Zhu, L.; Tian, Z.; Guo, S.; Liu, W.; Zhu, F.; Wang, X.-P. Circadian Clock Genes Link Photoperiodic Signals to Lipid Accumulation during Diapause Preparation in the Diapause-Destined Female Cabbage Beetles Colaphellus bowringi. Insect Biochem. Mol. Biol. 2019, 104, 1–10. [Google Scholar] [CrossRef] [PubMed]
- Mohamed, A.A.M.; Wang, Q.; Bembenek, J.; Ichihara, N.; Hiragaki, S.; Suzuki, T.; Takeda, M. N-Acetyltransferase (Nat) Is a Critical Conjunct of Photoperiodism between the Circadian System and Endocrine Axis in Antheraea pernyi. PLoS ONE 2014, 9, e92680. [Google Scholar] [CrossRef]
- Wu, T.; Hu, E.; Xu, S.; Chen, M.; Guo, P.; Dai, Z.; Feng, T.; Zhou, L.; Tang, W.; Zhan, L.; et al. ClusterProfiler 4.0: A Universal Enrichment Tool for Interpreting Omics Data. Innovation 2021, 2, 100141. [Google Scholar] [CrossRef] [PubMed]
- Livak, K.J.; Schmittgen, T.D. Analysis of Relative Gene Expression Data Using Real-Time Quantitative PCR and the 2−ΔΔCT Method. Methods 2001, 25, 402–408. [Google Scholar] [CrossRef] [PubMed]
- Xu, J.; Lu, M.-X.; Cui, Y.-D.; Du, Y.-Z. Selection and Evaluation of Reference Genes for Expression Analysis Using QRT-PCR in Chilo suppressalis (Lepidoptera: Pyralidae). J. Econ. Entomol. 2017, 110, 683–691. [Google Scholar] [CrossRef] [PubMed]


Publisher’s Note: MDPI stays neutral with regard to jurisdictional claims in published maps and institutional affiliations. |
© 2022 by the authors. Licensee MDPI, Basel, Switzerland. This article is an open access article distributed under the terms and conditions of the Creative Commons Attribution (CC BY) license (https://creativecommons.org/licenses/by/4.0/).