
DNA Penetration into a Lysozyme Layer at the Surface of Aqueous Solutions

 and
and 
Abstract
:1. Introduction
2. Results
2.1. Surface Dilational Rheology
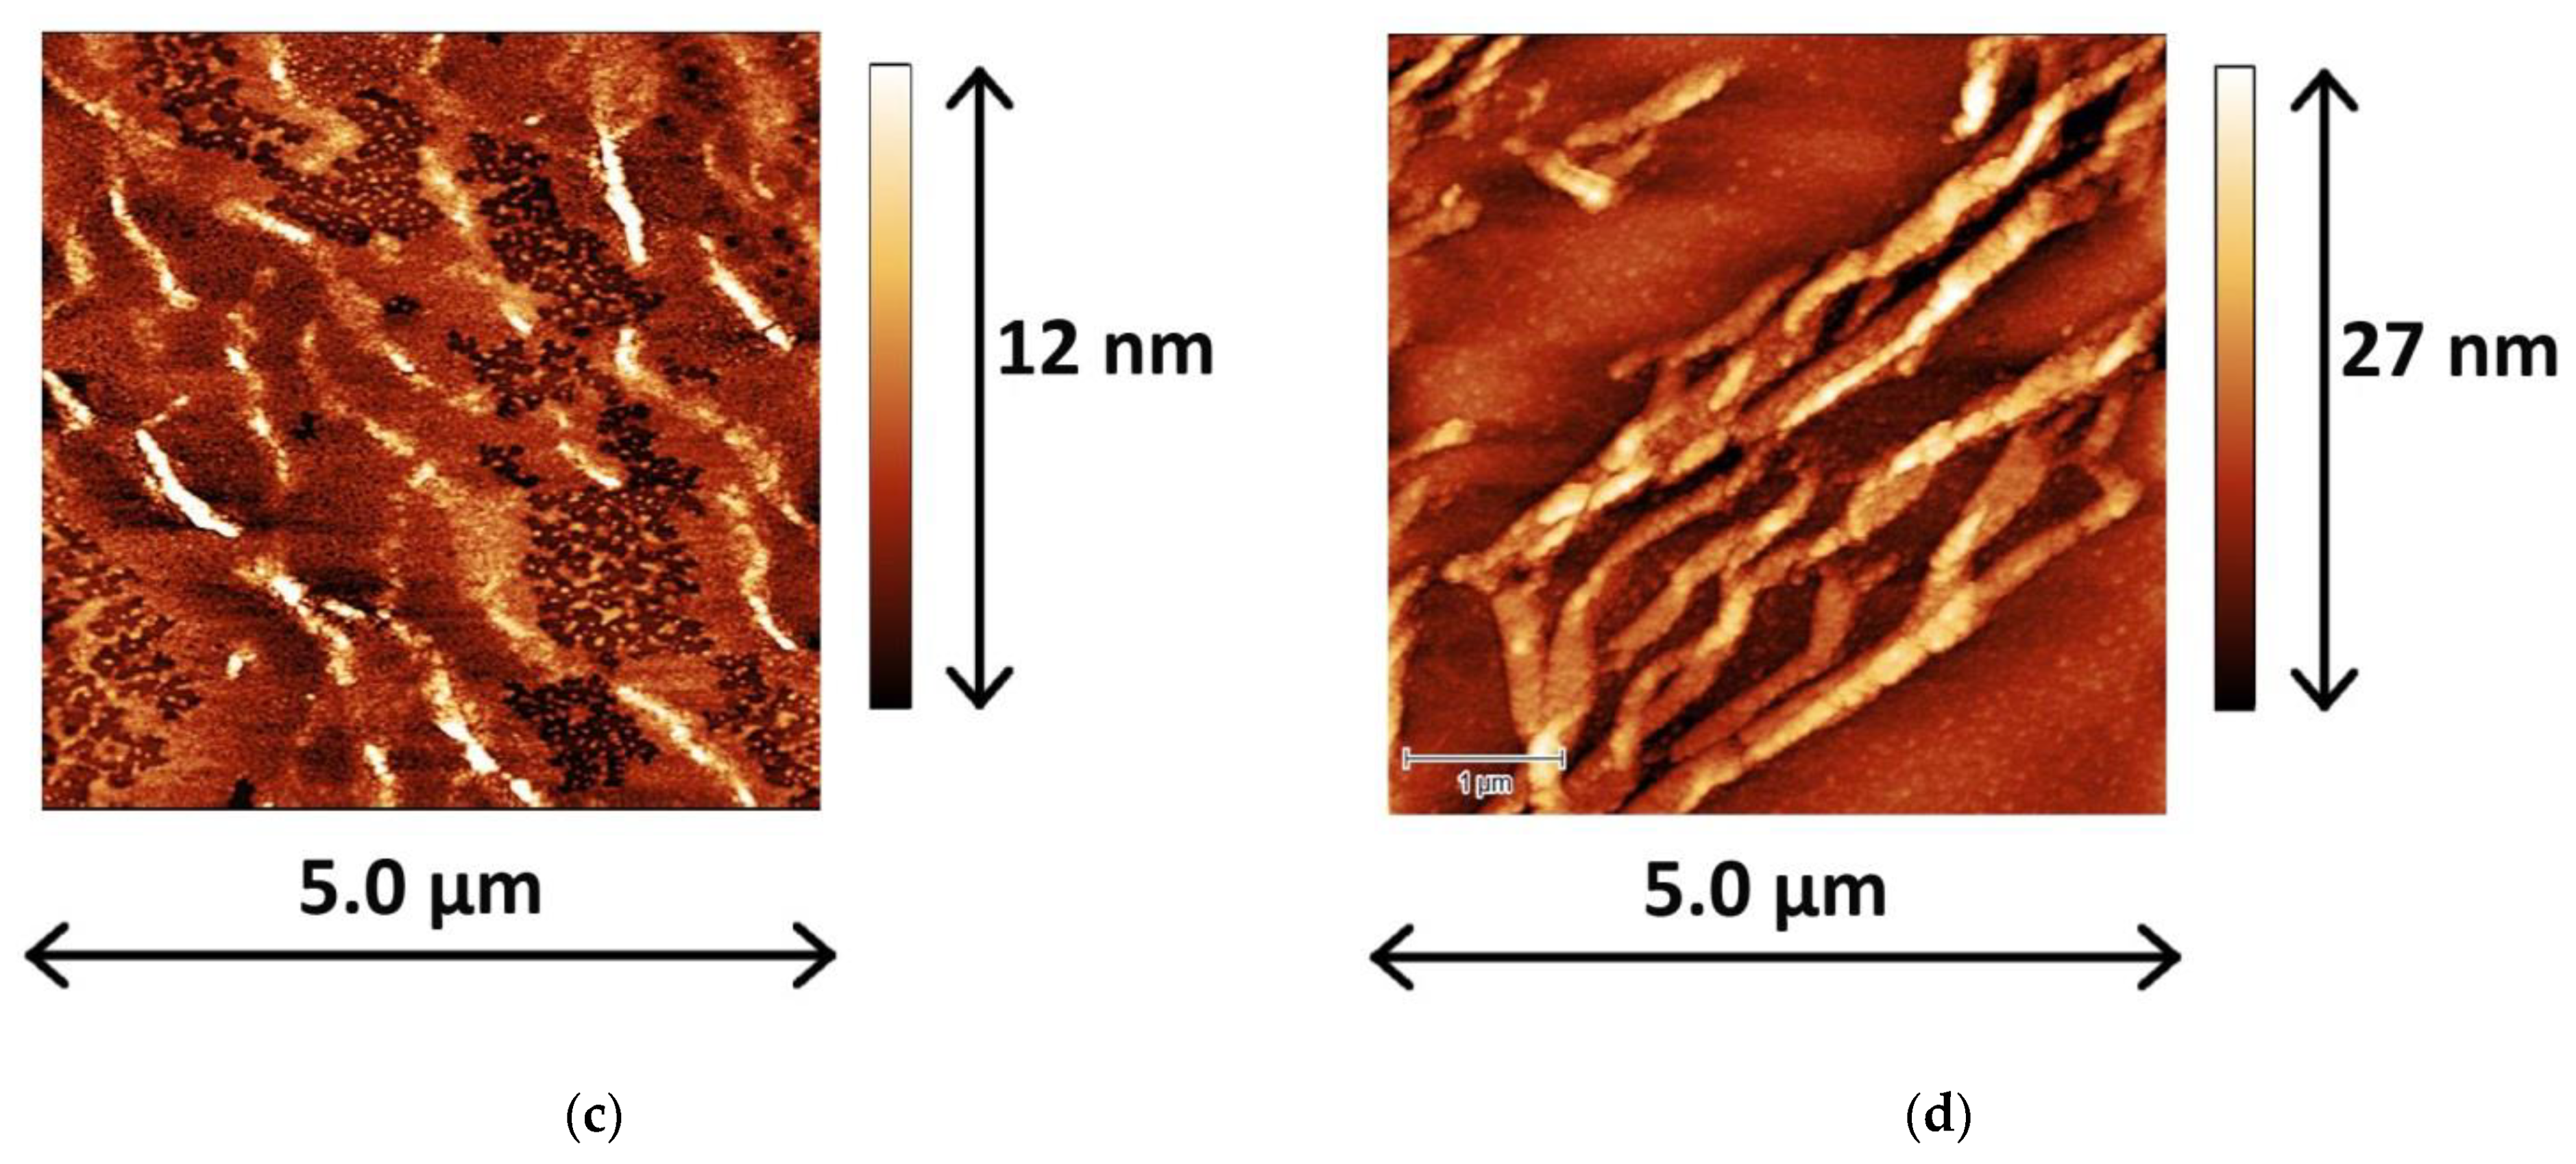
2.2. Atomic Force Microscopy
2.3. Ellipsometry
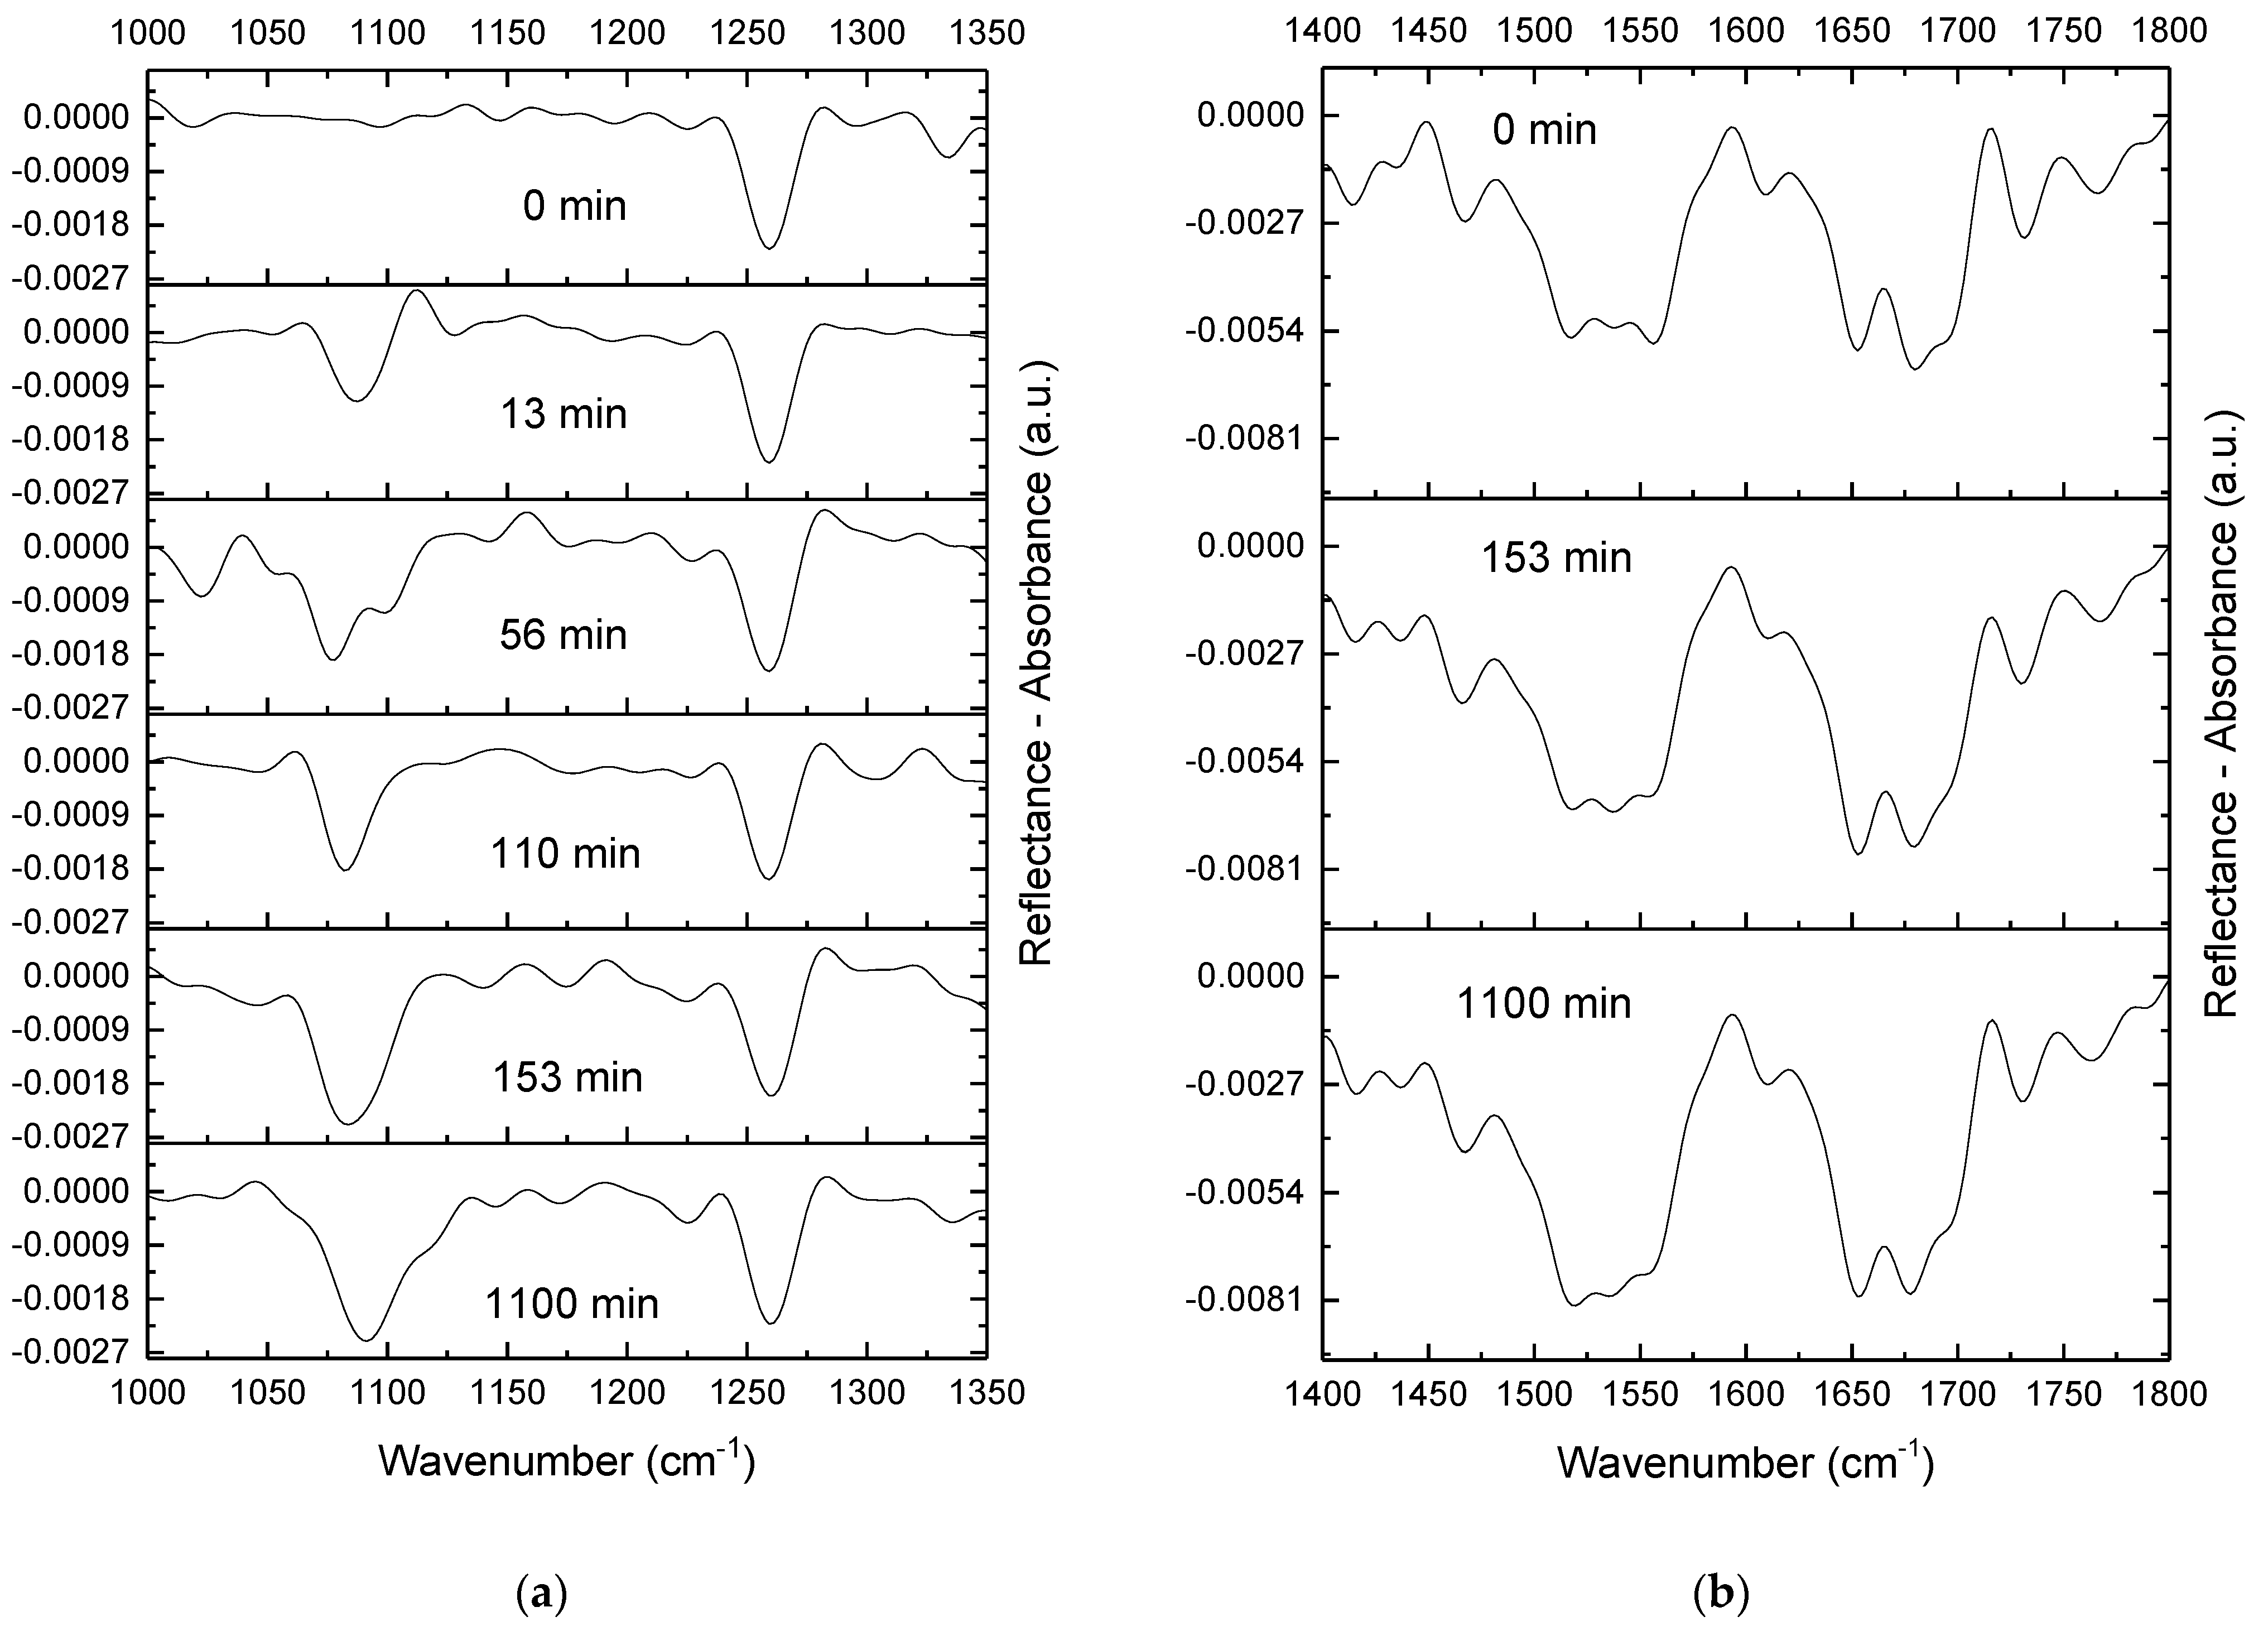
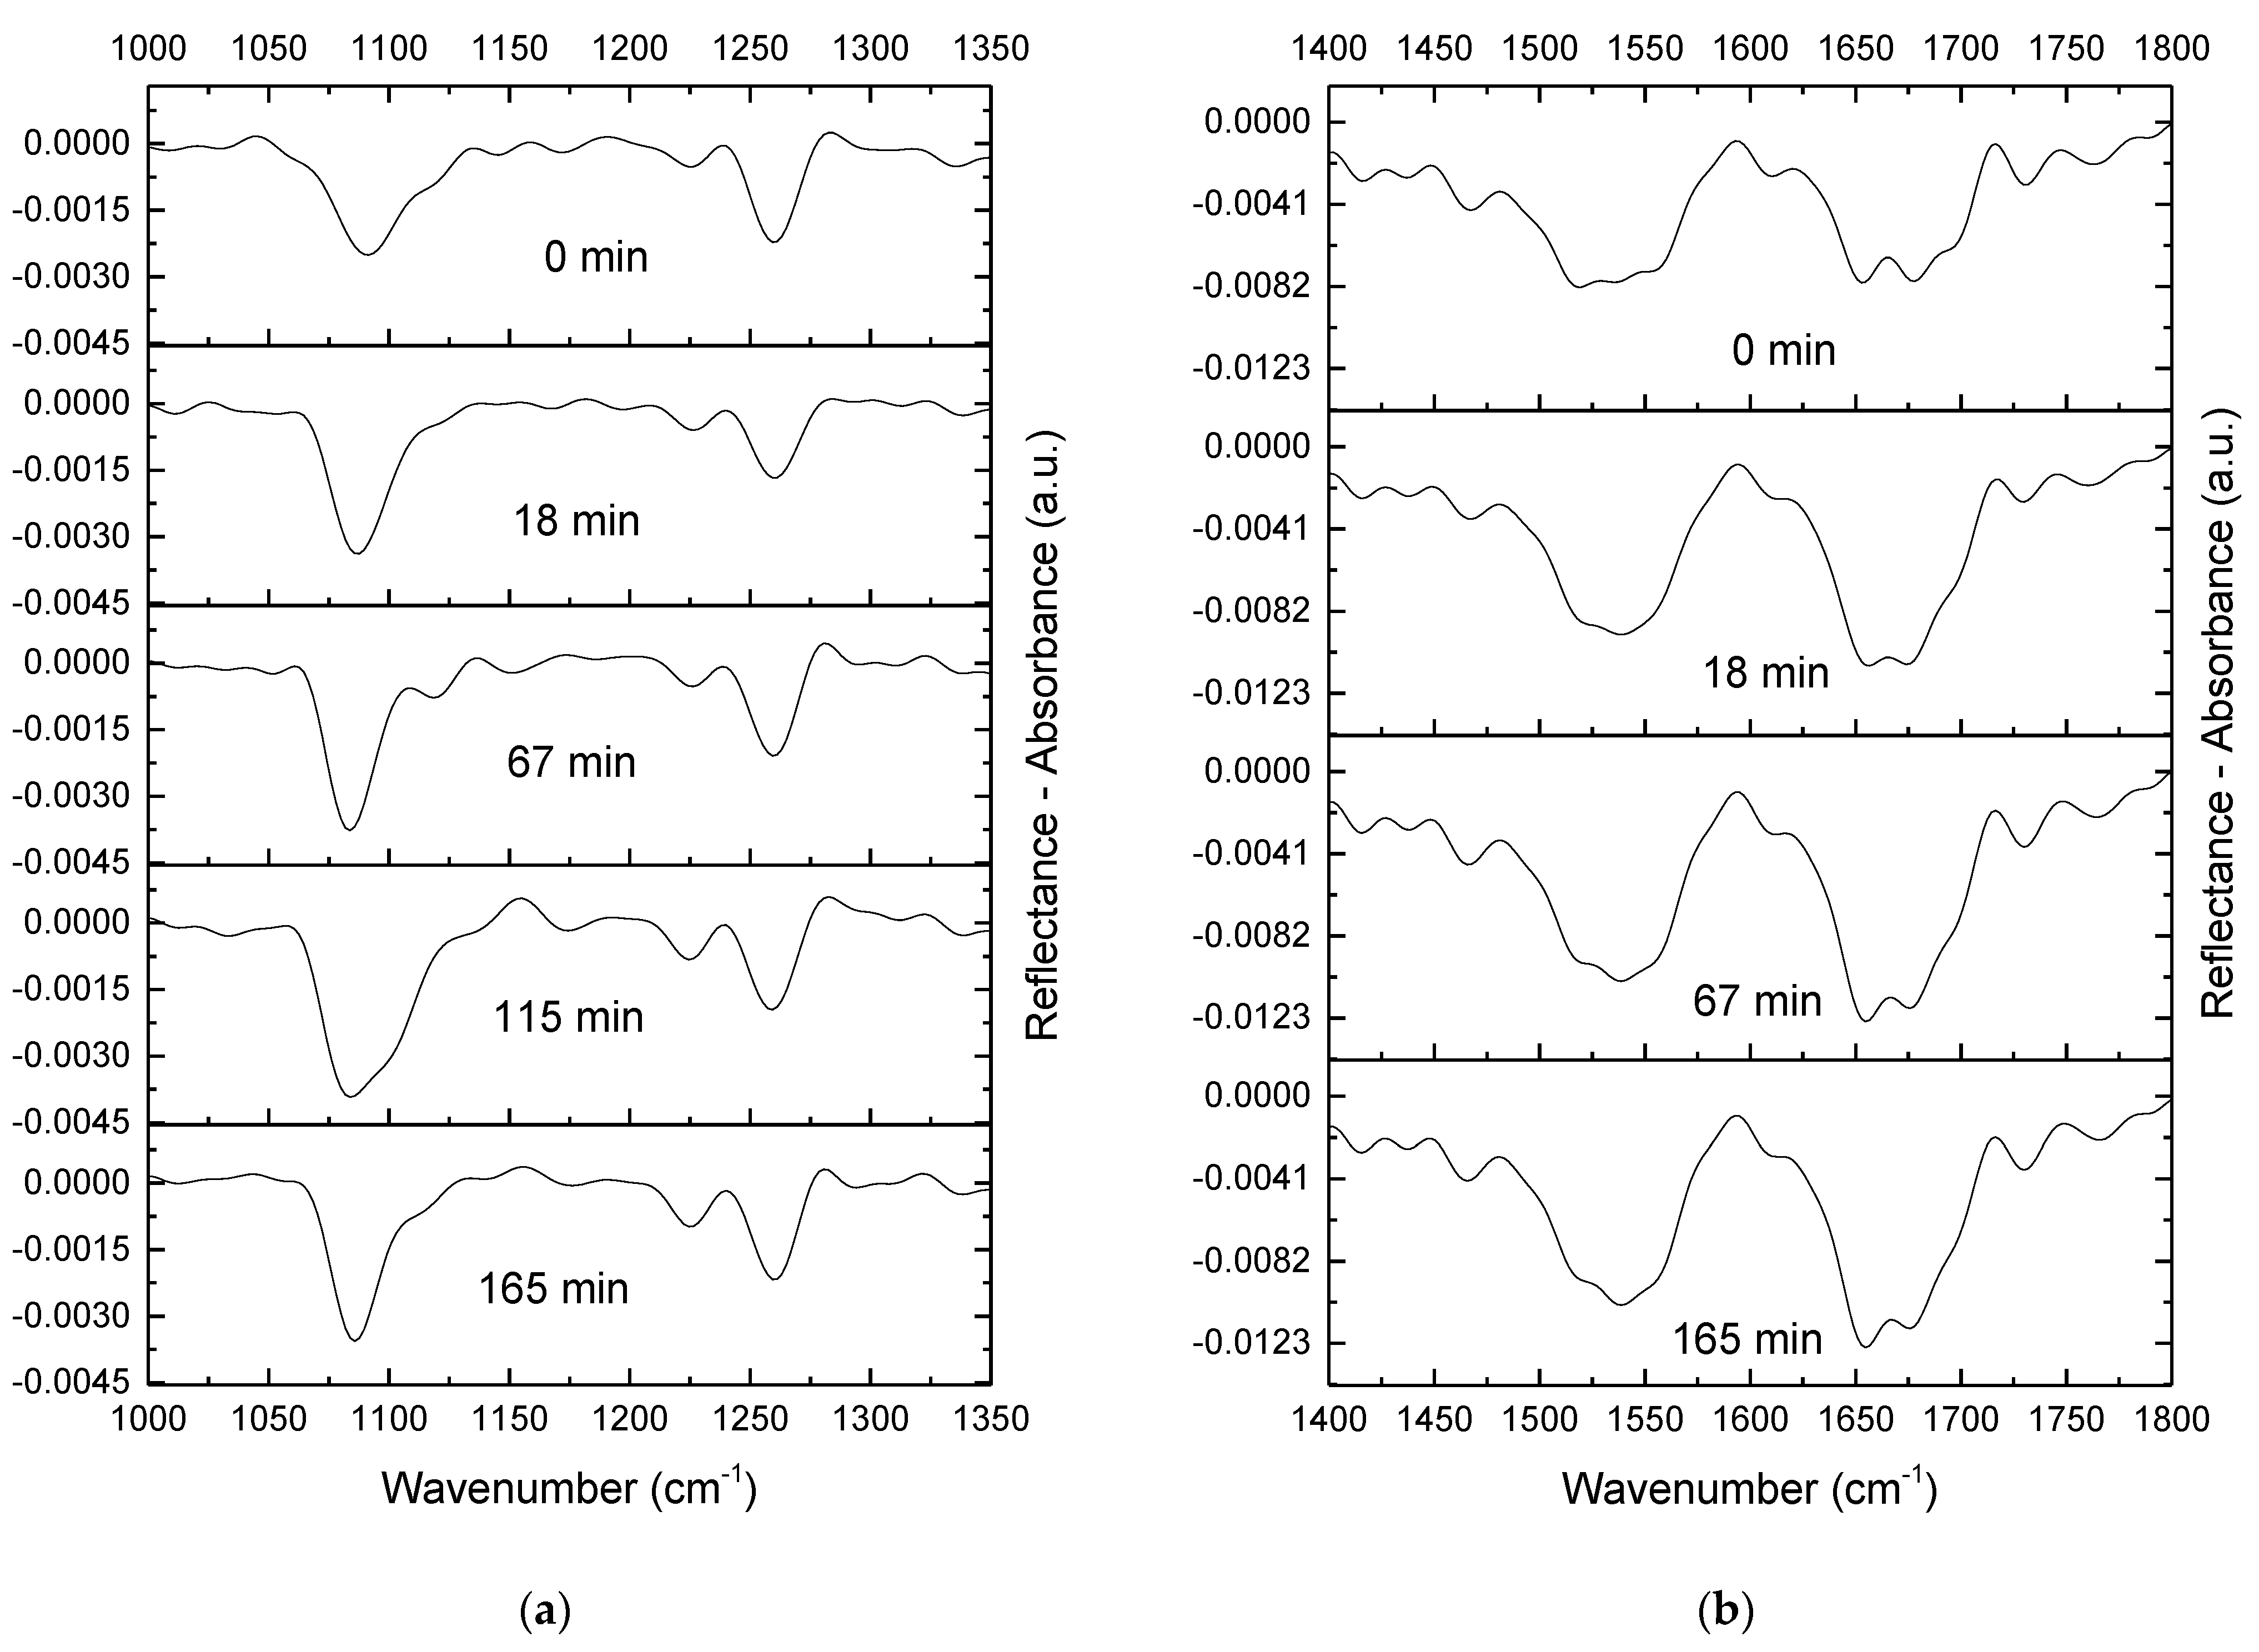
2.4. IRRAS
3. Discussion
4. Materials and Methods
4.1. Materials
4.2. Sample Preparation
4.3. Methods
4.3.1. Dilatational Surface Elasticity and Surface Tension
4.3.2. Ellipsometry
4.3.3. IRRAS
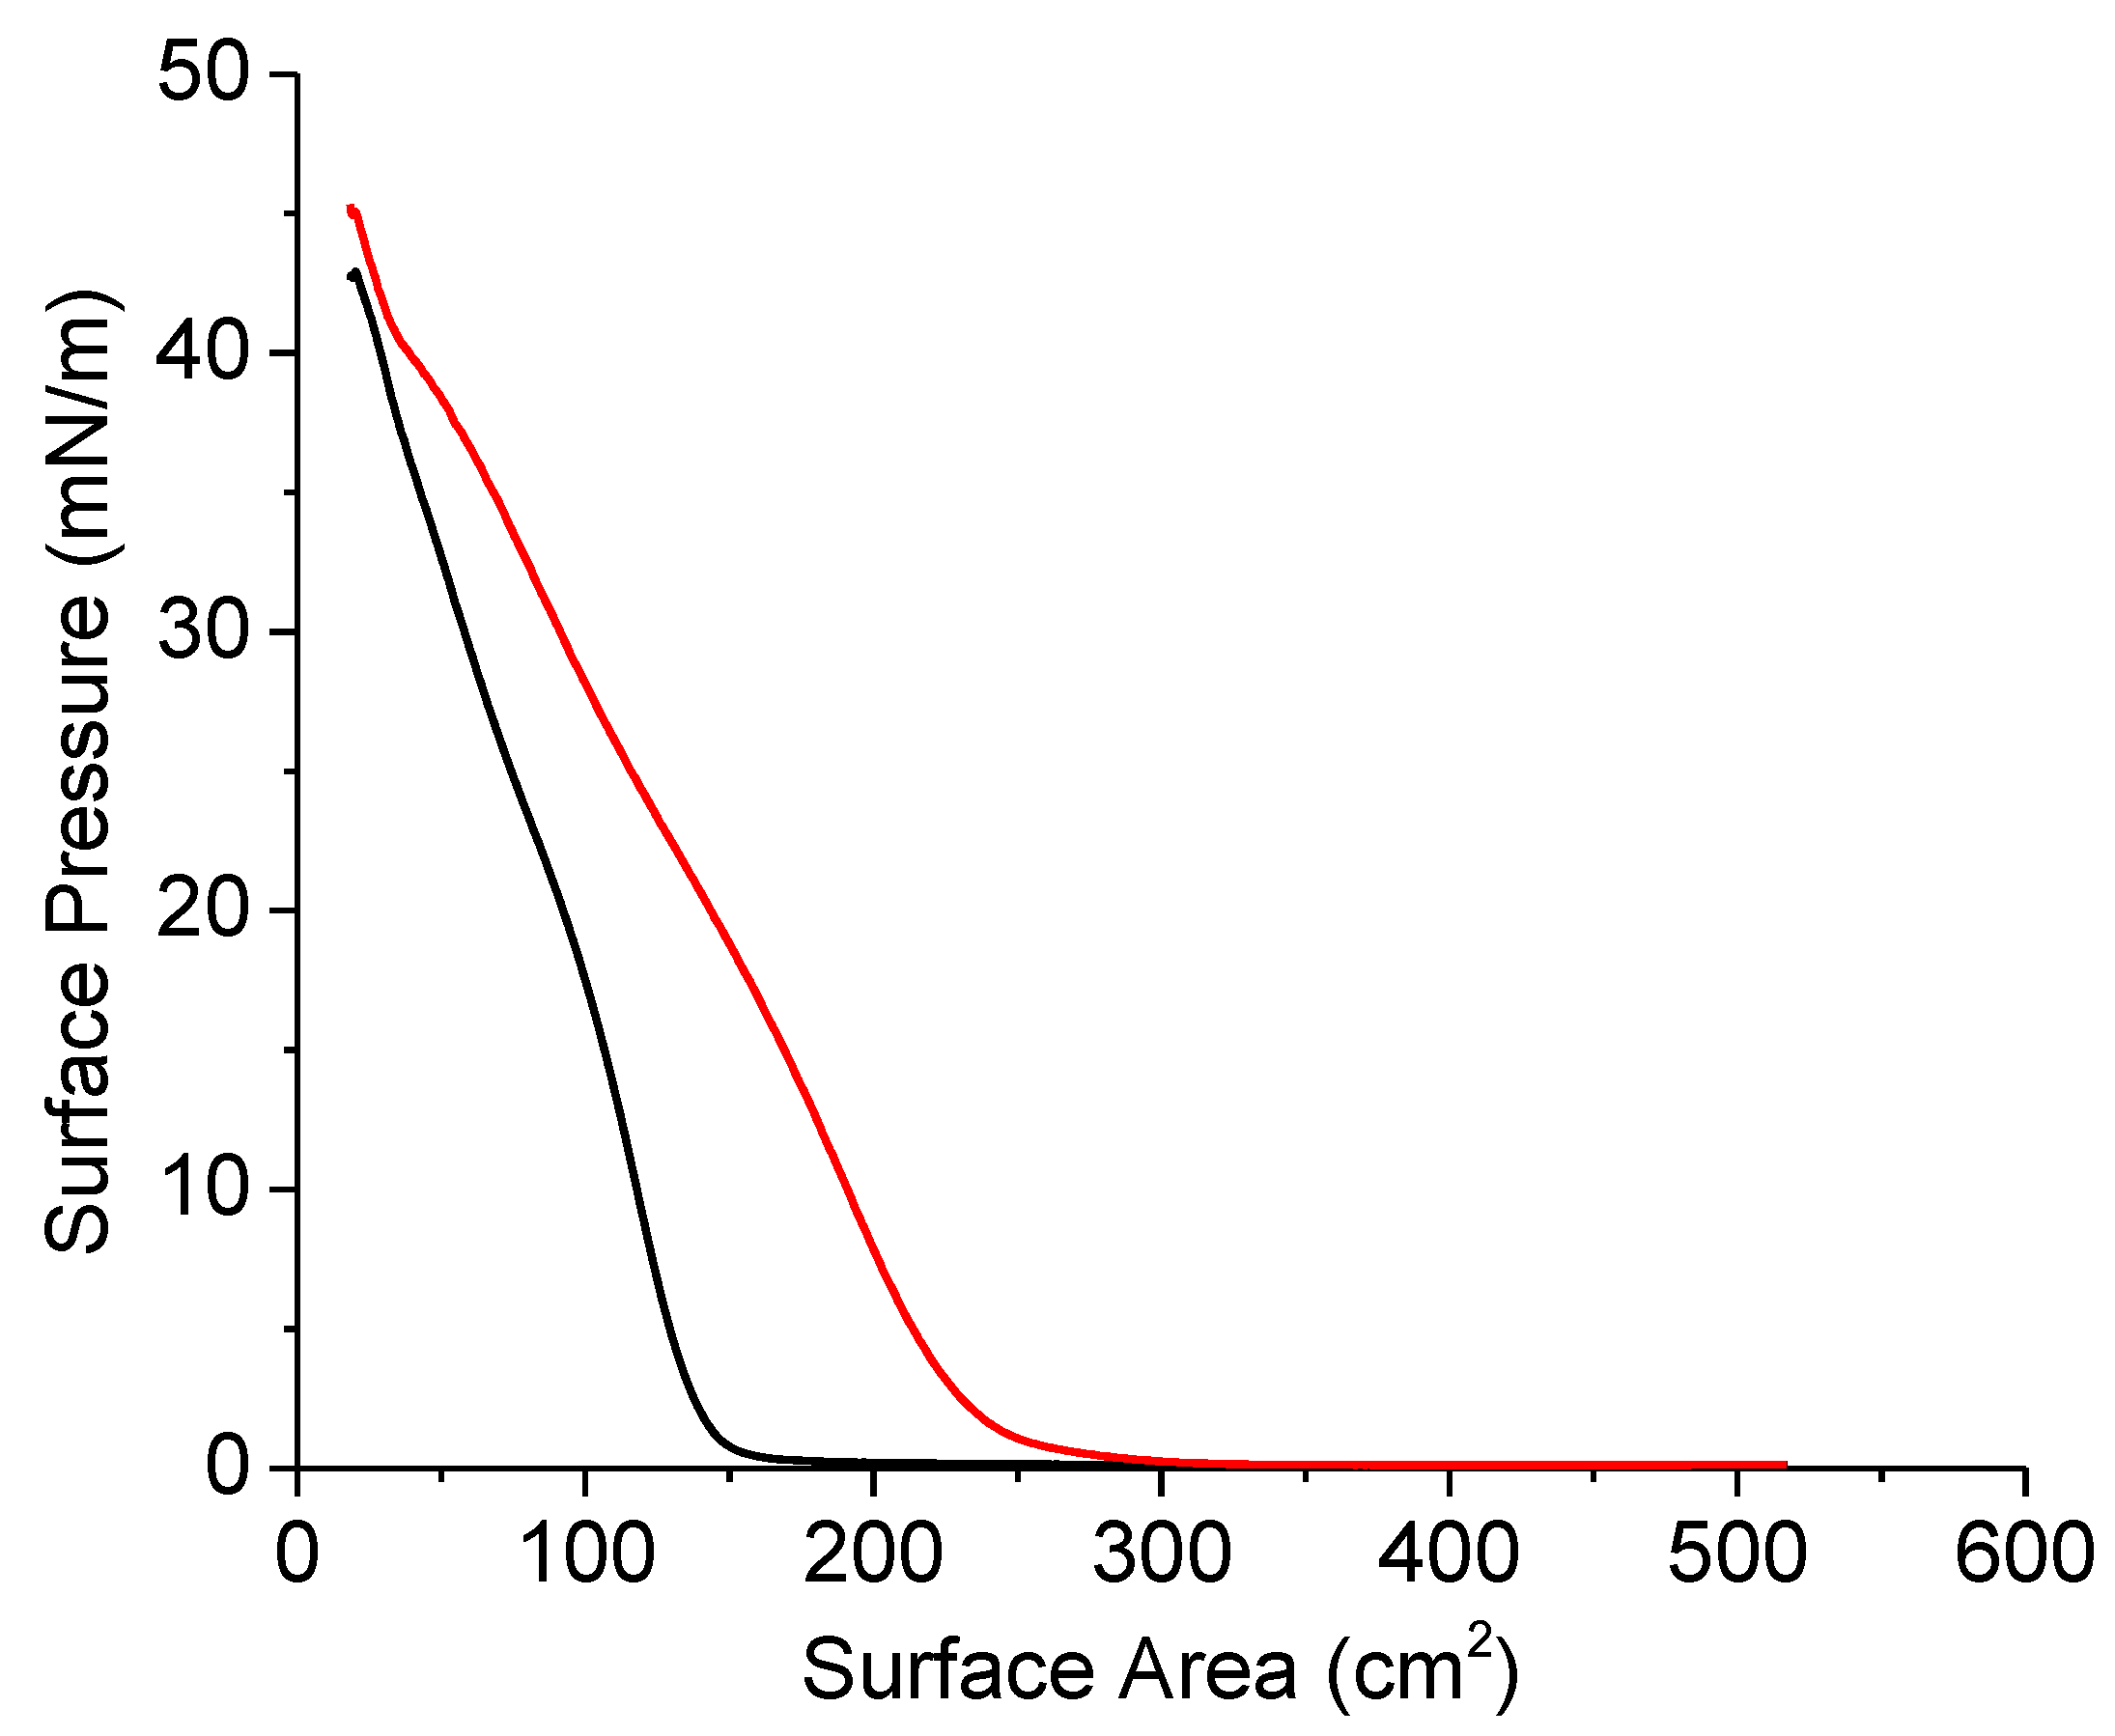
4.3.4. Surface Pressure-Area Isotherms
4.3.5. Atomic Force Microscopy
5. Conclusions
Author Contributions
Funding
Institutional Review Board Statement
Informed Consent Statement
Data Availability Statement
Acknowledgments
Conflicts of Interest
References
- Yetgin, S.; Balkose, D. Calf Thymus DNA Characterization and Its Adsorption on Different Silica Surfaces. RSC Adv. 2015, 5, 57950–57959. [Google Scholar] [CrossRef] [Green Version]
- Korolev, N.; Vorontsova, O.V.; Nordenskiöld, L. Physicochemical Analysis of Electrostatic Foundation for DNA-Protein Interactions in Chromatin Transformations. Prog. Biophys. Mol. Biol. 2007, 95, 23–49. [Google Scholar] [CrossRef] [PubMed]
- Goldwasser, E.; Putnam, F.W. Electrophoretic Study of the Interaction of Serum Albumin and Thymus Nucleic Acid1. J. Phys. Colloid Chem. 1950, 54, 79–89. [Google Scholar] [CrossRef]
- Geiduschek, E.P.; Doty, P. A Light Scattering Investigation of the Interaction of Sodium Desoxyribonucleate with Bovine Serum Albumin. BBA-Biochim. Biophys. Acta 1952, 9, 609–618. [Google Scholar] [CrossRef]
- Sokol, F. A Light Scattering Study of the Interaction of Sodium Desoxyribonucleate with Horse Serum Albumin. J. Polym. Sci. 1958, 30, 581–594. [Google Scholar] [CrossRef]
- Pathak, J.; Priyadarshini, E.; Rawat, K.; Bohidar, H.B. Complex Coacervation in Charge Complementary Biopolymers: Electrostatic versus Surface Patch Binding. Adv. Colloid Interface Sci. 2017, 250, 40–53. [Google Scholar] [CrossRef]
- Manzanera, M.; Frankel, D.J.; Li, H.; Zhou, D.; Bruckbauer, A.; Kreutzmann, P.; Blackburn, J.M.; Abell, C.; Rayment, T.; Klenerman, D.; et al. Macroscopic 2D Networks Self-Assembled from Nanometer-Sized Protein/DNA Complexes. Nano Lett. 2006, 6, 365–370. [Google Scholar] [CrossRef]
- Yang, T.; Wei, G.; Li, Z. Electrostatic Assembly of Protein Lysozyme on DNA Visualized by Atomic Force Microscopy. Appl. Surf. Sci. 2007, 253, 4311–4316. [Google Scholar] [CrossRef]
- Liu, Y.Y.; Guthold, M.; Snyder, M.J.; Lu, H.F. AFM of Self-Assembled Lambda DNA-Histone Networks. Colloids Surfaces B Biointerfaces 2015, 134, 17–25. [Google Scholar] [CrossRef] [PubMed] [Green Version]
- Song, Y.; Kadiyala, U.; Weerappuli, P.; Valdez, J.J.; Yalavarthi, S.; Louttit, C.; Knight, J.S.; Moon, J.J.; Weiss, D.S.; VanEpps, J.S.; et al. Antimicrobial Microwebs of DNA–Histone Inspired from Neutrophil Extracellular Traps. Adv. Mater. 2019, 31, 1807436. [Google Scholar] [CrossRef]
- Paul, P.K.; Che, D.C.; Hiroyuki, K.; Araki, K.; Matsumoto, T. Adsorption Characteristics of Cytochrome c/DNA Complex Langmuir Molecular Assemblies at the Airwater Interface: A Surface Area-Normalized Isotherm Study. RSC Adv. 2017, 7, 37755–37764. [Google Scholar] [CrossRef] [Green Version]
- Osserman, E.F.; Canfield, R.E.; Beychok, S. (Eds.) Lysozyme; Academic Press Inc.: Cambridge, MA, USA, 1974. [Google Scholar]
- Proctor, V.A.; Cunningham, F.E. The Chemistry of Lysozyme and Its Use as a Food Preservative and a Pharmaceutical. C R C Crit. Rev. Food Sci. Nutr. 1988, 26, 359–395. [Google Scholar] [CrossRef] [PubMed]
- Cattan, D.; Bourgoin, D. Interactions between DNA and Hen’s Egg White Lysozyme: Effects of Composition and Structural Changes of DNA, Ionic Strength and Temperature. BBA Sect. Nucleic Acids Protein Synth. 1968, 161, 56–67. [Google Scholar] [CrossRef]
- Ghosh, S.; Pandey, N.K.; Sen, S.; Tripathy, D.R.; Dasgupta, S. Binding of Hen Egg White Lysozyme Fibrils with Nucleic Acids. J. Photochem. Photobiol. B Biol. 2013, 127, 52–60. [Google Scholar] [CrossRef]
- Alves, P.S.; Mesquita, O.N.; Rocha, M.S. Model for DNA Interactions with Proteins and Other Large Ligands: Extracting Physical Chemistry from Pure Mechanical Measurements. J. Phys. Chem. B 2020, 124, 1020–1024. [Google Scholar] [CrossRef]
- Zhang, R.; Wang, Y.; Yang, G. DNA–Lysozyme Nanoarchitectonics: Quantitative Investigation on Charge Inversion and Compaction. Polymers 2022, 14, 1377. [Google Scholar] [CrossRef]
- Lundberg, D.; Carnerup, A.M.; Janiak, J.; Schillén, K.; Miguel, M.D.G.; Lindman, B. Size and Morphology of Assemblies Formed by DNA and Lysozyme in Dilute Aqueous Mixtures. Phys. Chem. Chem. Phys. 2011, 13, 3082–3091. [Google Scholar] [CrossRef]
- Morimoto, R.; Horita, M.; Yamaguchi, D.; Nakai, H.; Nakano, S. ichi Evaluation of Weak Interactions of Proteins and Organic Cations with DNA Duplex Structures. Biophys. J. 2022, 121, 2873–2881. [Google Scholar] [CrossRef]
- Lyadinskaya, V.V.; Lin, S.Y.; Michailov, A.V.; Povolotskiy, A.V.; Noskov, B.A. Phase Transitions in DNA/Surfactant Adsorption Layers. Langmuir 2016, 32, 13435–13445. [Google Scholar] [CrossRef]
- Chirkov, N.S.; Akentiev, A.V.; Campbell, R.A.; Lin, S.Y.; Timoshen, K.A.; Vlasov, P.S.; Noskov, B.A. Network Formation of DNA/Polyelectrolyte Fibrous Aggregates Adsorbed at the Water-Air Interface. Langmuir 2019, 35, 13967–13976. [Google Scholar] [CrossRef]
- Chirkov, N.S.; Campbell, R.A.; Michailov, A.V.; Vlasov, P.S.; Noskov, B.A. DNA Interaction with a Polyelectrolyte Monolayer at Solution—Air Interface. Polymers 2021, 13, 2820. [Google Scholar] [CrossRef] [PubMed]
- Krycki, M.M.; Lin, S.Y.; Loglio, G.; Michailov, A.V.; Miller, R.; Noskov, B.A. Impact of Denaturing Agents on Surface Properties of Myoglobin Solutions. Colloids Surfaces B Biointerfaces 2021, 202, 111657. [Google Scholar] [CrossRef]
- Tihonov, M.M.; Milyaeva, O.Y.; Noskov, B.A. Dynamic Surface Properties of Lysozyme Solutions. Impact of Urea and Guanidine Hydrochloride. Colloids Surfaces B Biointerfaces 2015, 129, 114–120. [Google Scholar] [CrossRef] [PubMed]
- Janich, C.; Hädicke, A.; Bakowsky, U.; Brezesinski, G.; Wölk, C. Interaction of DNA with Cationic Lipid Mixtures—Investigation at Langmuir Lipid Monolayers. Langmuir 2017, 33, 10172–10183. [Google Scholar] [CrossRef]
- Barth, A. Infrared Spectroscopy of Proteins. Biochim. Biophys. Acta-Bioenerg. 2007, 1767, 1073–1101. [Google Scholar] [CrossRef] [Green Version]
- Chen, Q.; Kang, X.; Li, R.; Du, X.; Shang, Y.; Liu, H.; Hu, Y. Structure of the Complex Monolayer of Gemini Surfactant and DNA at the Air/Water Interface. Langmuir 2012, 28, 3429–3438. [Google Scholar] [CrossRef]
- Manning, G.S. The Persistence Length of DNA Is Reached from the Persistence Length of Its Null Isomer through an Internal Electrostatic Stretching Force. Biophys. J. 2006, 91, 3607–3616. [Google Scholar] [CrossRef] [Green Version]
- Noskov, B.A.; Akentiev, A.V.; Bilibin, A.Y.; Zorin, I.M.; Miller, R. Dilational Surface Viscoelasticity of Polymer Solutions. Adv. Colloid Interface Sci. 2003, 104, 245–271. [Google Scholar] [CrossRef]
- Noskov, B.A. Protein Conformational Transitions at the Liquid-Gas Interface as Studied by Dilational Surface Rheology. Adv. Colloid Interface Sci. 2014, 206, 222–238. [Google Scholar] [CrossRef]
- Manning-Benson, S.; Bain, C.D.; Darton, R.C. Measurement of Dynamic Interfacial Properties in an Overflowing Cylinder by Ellipsometry. J. Colloid Interface Sci. 1997, 189, 109–116. [Google Scholar] [CrossRef]


Publisher’s Note: MDPI stays neutral with regard to jurisdictional claims in published maps and institutional affiliations. |
© 2022 by the authors. Licensee MDPI, Basel, Switzerland. This article is an open access article distributed under the terms and conditions of the Creative Commons Attribution (CC BY) license (https://creativecommons.org/licenses/by/4.0/).
Share and Cite
Chirkov, N.S.; Lin, S.-Y.; Michailov, A.V.; Miller, R.; Noskov, B.A. DNA Penetration into a Lysozyme Layer at the Surface of Aqueous Solutions. Int. J. Mol. Sci. 2022, 23, 12377. https://doi.org/10.3390/ijms232012377
Chirkov NS, Lin S-Y, Michailov AV, Miller R, Noskov BA. DNA Penetration into a Lysozyme Layer at the Surface of Aqueous Solutions. International Journal of Molecular Sciences. 2022; 23(20):12377. https://doi.org/10.3390/ijms232012377
Chicago/Turabian StyleChirkov, Nikolay S., Shi-Yow Lin, Alexander V. Michailov, Reinhard Miller, and Boris A. Noskov. 2022. "DNA Penetration into a Lysozyme Layer at the Surface of Aqueous Solutions" International Journal of Molecular Sciences 23, no. 20: 12377. https://doi.org/10.3390/ijms232012377