Article

Application of Spectroscopic Methods for the Identification of Superoxide Dismutases in Cyanobacteria

1
The Franciszek Górski Institute of Plant Physiology, Polish Academy of Sciences, Niezapominajek 21, 30-239 Krakow, Poland
2
Institute of Nuclear Physics, Polish Academy of Sciences, 31-342 Krakow, Poland
3
Department of Agricultural and Environmental Chemistry, University of Agriculture in Krakow, 31-120 Krakow, Poland
*
Author to whom correspondence should be addressed.
Int. J. Mol. Sci. 2022, 23(22), 13819; https://doi.org/10.3390/ijms232213819
Submission received: 4 October 2022 / Revised: 4 November 2022 / Accepted: 7 November 2022 / Published: 10 November 2022
(This article belongs to the Special Issue Chemistry towards Biology)

Abstract

:
Superoxide dismutases (SODs) belong to the group of metalloenzymes that remove superoxide anion radicals and they have been identified in three domains of life: Bacteria, Archaea and Eucarya. SODs in Synechocystis sp. PCC 6803, Gloeobacter violaceus CCALA 979, and Geitlerinema sp. ZHR1A were investigated. We hypothesized that iron (FeSOD) and/or manganese (MnSOD) dominate as active forms in these cyanobacteria. Activity staining and three different spectroscopic methods of SOD activity bands excised from the gels were used to identify a suitable metal in the separated samples. FeSODs or enzymes belonging to the Fe-MnSOD superfamily were detected. The spectroscopic analyses showed that only Fe is present in the SOD activity bands. We found FeSOD in Synechocystis sp. PCC 6803 while two forms in G. violaceus and Geitlerinema sp. ZHR1A: FeSOD1 and FeSOD2 were present. However, no active Cu/ZnSODs were identified in G. violaceus and Geitlerinema sp. ZHR1A. We have shown that selected spectroscopic techniques can be complementary to the commonly used method of staining for SOD activity in a gel. Furthermore, the occurrence of active SODs in the cyanobacteria studied is also discussed in the context of SOD evolution in oxyphotrophs.

Graphical Abstract

1. Introduction

The superoxide anion radical (O2) is one of the major reactive oxygen species (ROS) produced in living cells as a result of the one-electron reduction of molecular oxygen (O2):
O2 + e → O2
The superoxide anion radical is spontaneously generated mainly in some oxidase-dependent reactions and cellular charge-transfer processes, including the photosynthetic and respiratory electron transport chain [1,2,3,4]. O2 itself is not very toxic for cellular organic molecules, but it can be a source of other, more toxic ROS, especially hydroxyl radicals (HO), which are very harmful to most biomolecules [1,2]. To protect cells from the toxic effects of HO, superoxide dismutases (SODs, EC 1.15.1.1) scavenge O2 according to the summarized equation [5,6,7,8,9]:
2O2 + 2H+ → H2O2 + O2
SODs are found in all three domains of life: Bacteria, Archaea and Eucarya and are metalloproteins that are among the key enzymes involved in the antioxidant response system [7]. More broadly, SODs, along with other antioxidant enzymes, play a crucial role in redox regulation and maintenance of cellular homeostasis [10,11]. In general, based on a metal ion in the active site, four different classes of SOD have been identified: manganese SOD (MnSOD), iron SOD (FeSOD), copper/zinc SOD (Cu/ZnSOD) and nickel SOD (NiSOD). An exception to this typology are the SODs of some bacterial species that are active in the presence of both metals, i.e., Mn and Fe, and are referred to as cambialistic SODs [6,7,12,13]. In contrast, Co/Zn- and Fe/ZnSODs have been identified in bovine liver and the bacterium Streptomyces coelicolor, respectively [14,15]. In eukaryotic cells, the different forms of SOD are located in separate intracellular compartments. FeSOD can be found in chloroplasts and peroxisomes; MnSOD is mainly located in mitochondria and peroxisomes, while Cu/ZnSOD has been detected in chloroplasts, mitochondria, nucleus and extracellular matrix [6,7,13,16].
Although the activity of SODs is closely linked to O2-utilizing metabolism, their presence, at least at the genomic level, has been confirmed even in the majority of organisms classified as obligate anaerobes [9,17,18,19]. Therefore, phylogenetic analyses have suggested that SODs may have appeared in the very early stages of the evolution of life on Earth, long before the great oxidation event (GOE) about 2.4 Gyr ago [9,19,20]. To the best of our knowledge, cyanobacteria or cyanobacteria-like organisms were the first entities capable of oxygenic photosynthesis on Earth [21,22,23,24]. Photosynthetic O2 production was inextricably linked to ROS production, including O2 [3,25,26]. Therefore, the identification and characterization of SODs in cyanobacteria also gives us insight into the evolution of O2-utilizing metabolic pathways, including oxygenic photosynthesis.
In the studies presented here, the identification of active SOD forms in Synechocystis sp. PCC 6803 (hereafter referred to as Synechocystis), Gloeobacter violaceus CCALA 979 (hereafter referred to as G. violaceus), Geitlerinema sp. ZHR1A was performed by comparing experimental methods for identification SOD and in silico analyzes based on SOD sequencing data publicly available in biological databases. Synechocystis is a model microorganism used in studies dealing with the photosynthetic and respiratory electron transport chain in cyanobacteria [27]; G. violaceus is considered to be the most primordial cyanobacterium without thylakoid membranes and with a photosynthetic apparatus localized in the cytoplasmic membrane [28,29,30,31], while Geitlerinema sp. ZHR1A is a filamentous cyanobacterium compared to the previously mentioned species, whose genome has not yet been sequenced and whose physiology is poorly known.
The formulated hypothesis was that Fe and/or MnSODs dominate as active forms in the cyanobacteria studied. However, in addition to FeSOD/MnSOD, Cu/ZnSODs are also present in some cyanobacterial genomes. We have used selected spectroscopic techniques to identify forms of SOD that complement the method of staining SOD activity in a gel. The results showed that FeSOD and/or their isoforms are active in Synechocystis, G. violaceus, and Geitlerinema sp. ZHR1, while active Cu/ZnSODs were not identified at all. We also discuss the data based on the evolution of SODs.

2. Results

2.1. The 16S rRNA Tree and the Relationship between the Cyanobacteria Studied

A phylogenetic tree was reconstructed for a small sample of selected 16S rRNA from different organisms that perform oxygenic photosynthesis. Reconstruction of the 16S rRNA tree showed that strain G. violaceus CCALA 979 is closely related to G. violaceus PCC 7421, whose genome was sequenced (Figure 1). This result also confirms the basal phylogenetic position of G. violaceus CCALA 979 in the Gloeobacter clade together with G. kilaueensis [32]. This does not mean that the genome of G. violaceus CCALA 979 is identical to that of G. violaceus PCC 7421, but it does suggest that these genomes are very similar, which could indicate the possible presence of the same genes encoding the different forms of SOD. The 16S rRNA sequence of Geitlerinema ZHR1A was in a group with Synechocystis sp. PCC 6803, which was studied in this work, and Microcystis aeruginosa PCC 9701 (Figure 1).

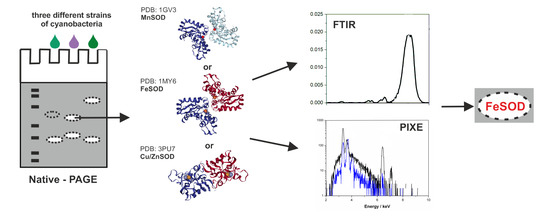
2.2. Identification of SODs

Based on sequences of SODs available in the UniProt database (www.uniprot.org, 3 November 2021), the presence of FeSOD was experimentally confirmed only in Synechocystis. In the case of G. violaceus and Geitlerinema sp. ZHR1A, we cannot identify which form SOD is present in these cyanobacteria if we use standard staining without inhibitors for selected forms of SOD. Therefore, to test this, activity staining of SOD was performed with inhibitors, i.e., H2O2 and KCN in a gel (Figure 2). In general, Cu/ZnSOD is inhibited by H2O2 and cyanide, while FeSOD is inhibited only by H2O2. MnSOD is inhibited neither by H2O2 nor by CN [7].
A single active form of FeSOD (band 1A) was identified in Synechocystis (Figure 2). The estimated molecular weight of this form was approximately 40 kDa (Figure 2, Supplementary Material Figure S1, Tables S1 and S2). The result obtained supports the data from literature showing the in-gel activity staining and protein content for FeSOD (sodB) in Synechocystis [33,34].
The inhibitor assay showed that two distinct SOD activity bands were identified in G. violaceus, designated 1B and 2B. SOD band 1B with a molecular weight of about 43 kDa was much more intense than SOD band 2B with a molecular weight of about 63 kDa (Figure 2, Supplementary Material Figure S1, Tables S1 and S2). We observed the incomplete inhibition of SOD activity of band 1B by H2O2 (Figure 2a). This could indicate that: (i) it is the most likely FeSOD isoform (1B) but not completely inhibited by H2O2, (ii) it is MnSOD that is partially sensitive to H2O2, or (iii) the band represents a form of cambialistic Fe/MnSOD. Therefore, band 1B was designated as FeSOD/MnSOD after the activity staining experiment (Figure 2). Band 2B was strongly inhibited by H2O2, and it was identified as FeSOD (Figure 2).
In the case of Geitlerinema sp. ZHR1A, two SOD bands were detected and designated as 1C and 2C. Based on activity staining with inhibitors, bands 1C (ca. 40 kDa) and 2C (ca. 85 kDa) were identified as FeSOD and MnSOD, respectively (Figure 2, Supplementary Material Figure S1, Tables S1 and S2).
It should also be emphasized that the test with inhibitors did not reveal any Cu/ZnSOD form in the cyanobacteria examined (Figure 2a). In order to exclude or confirm the presence of a specific metal in the identified SOD activity bands, especially in cases where the inhibitor assay does not give clear results, we applied selected spectroscopic methods.

2.3. Metal Identification by the Spectroscopic Methods

Spectroscopic methods were used to identify the metals present in the excised gel sections: 1A, 1B, 1C, 2B, and 2C that corresponded to the forms of SOD, which were identified in a test with inhibitors as: MnSOD and FeSOD (Figure 2).

2.3.1. Fourier Transformed Infrared (FTIR) Spectroscopy

The Fourier transformed infrared spectroscopy FTIR spectra of Synechocystis, G. violaceus and Geitlerinema sp. ZHR1A are shown in Figure 3a–c, respectively. In each of the FTIR spectra shown in Figure 3, the absorption bands at about 1400–1500 cm−1 are visible, which are attributed to asymmetric bending vibrations of the -CH2, -CH3 groups [35]. Moreover, the peaks at 1650 and 1545 cm−1 correspond to amide I (C=O stretching mode) and amide II (combination of N-H bending and C-N stretching mode) of SOD [36] and the peaks in the range 1681–1810 cm−1 and at the wavenumber 1361 cm−1 were attributed to the carbonyl (C=O) and methyl (C-H of -CH3) groups of synthetic iron-mineralized SOD (SOD-Fe0@Lapa-Z) [37]. In general, these peaks are the most sensitive to changes in the structure and chemical composition of MnSOD [38]. However, for MnSOD, the most typical band is from the amide I at 1657 cm−1 with the shoulder at 1627 cm−1, which is specific to the helical protein structure [39]. In our tested SOD samples, the MnSOD band was not found at its characteristic wavelength (1657 cm−1), and even a drop of the spectrum was visible in this band (Figure 3). The amide II band has components at 1515 cm−1, 1530 cm−1 and 1545 cm−1, which are in overlapping regions of tyrosine side-chain, random, β-sheet and α-helical motives, respectively [40]. Moreover, the IR amide III band (1200–1340 cm−1) is also visible [40,41]. In addition, the bands characteristic of CuZnSOD at 1622 cm−1, 1631 cm−1, 1669 cm−1 and 1679 cm−1 were not found [42]. The characteristic peak of NiSOD was also not detected in the FTIR spectrum [43].
FTIR spectroscopy did not clearly show which metal was present in the samples studied, as the available literature data concern FTIR spectra for MnSOD [38,39]. However, MnSOD is structurally closely related to FeSOD and both belong to the same superfamily of proteins [7]. In our opinion, the FTIR data in combination with the SOD activity staining (Figure 2) indicate that the metals in the analyzed bands of the gel are most likely iron or manganese.
In a next step, we decided to use the more precise spectroscopic methods, i.e., particle-induced X-ray emission (PIXE) and atomic emission spectroscopy (AES), to identify the metal that was present in the gel bands with SOD activity. To provide more clarity, the following designations were given to the SOD forms of each gel band: FeSOD1 for 1A, 1B, and 1C; FeSOD2 for 2B. We have designated band 2C, previously referred to as MnSOD based on the activity staining (Figure 2), as FeSOD2 (Figure 3), as further spectroscopic analysis excluded Mn ions in this band. Therefore, the same notation was used later in the paper for the PIXE and AES (see below).

2.3.2. Particle-Induced X-Ray Emission (PIXE) and Atomic Emission Spectroscopy (AES)

The techniques PIXE and AES were used to determine the microscopic quantities of elements. The sensitivity of these techniques (<µg g−1) makes it possible to measure trace values of the elements. Qualitative analysis is a simple task for PIXE because the energy of the emitted X-rays depends on the atomic number of elements according to Moseley’s law. Peaks in the spectrum occur at the energies of the characteristic X-rays of the individual elements. We measured the spectra of the individual activity bands of SOD in the gel and the spectrum of the unstained gel to determine the elemental composition of the background (see “Materials and Methods”). K and Ca were identified in the pure gel. In the investigated bands of SOD, the PIXE analysis identified only Fe (Kα—6.40 keV), while the presence of the Mn (Kα—5.90 keV) was not detected (Figure 4).
Among the tested SOD’s bands, the first form of SOD (FeSOD1) had the highest amount of Fe in the tested strains (Table 1). In Geitlerinema sp. ZHR1A and G. violaceus, the FeSOD1 band contained approximately 10 and 8 µg g−1 Fe, respectively, while the band of Synechocystis sp. PCC 6803 contained only 5 µg g−1. The second band (FeSOD2) was detected in Geitlerinema sp. ZHR1A and in G. violaceus and contained a lower amount of Fe: approx. 3 µg g−1 in Geitlerinema sp. ZHR1A and 1 µg g−1 in G. violaceus. Mn was not found in any of the gel bands examined (Table 1).
PIXE and AES methods showed that the activity bands of SOD were enriched in Fe and no other metals specific to SOD, including Mn, Cu, Zn, and Ni, were detected in the analyzed samples of all cyanobacterial species (Figure 3 and Figure 4, Table 1).

3. Discussion

Cyanobacteria-like organisms, as the first O2 producers, most likely had to be equipped with SODs [20,44]. Genes encoding different classes of SOD are present in contemporary cyanobacteria, and the relevant data are collected in publicly available biological databases. However, most proteins are classified as SODs based on orthologs that exist in closely related species or are predicted based only on automatic annotation. A minority of cyanobacterial SODs have been detected at the experimental level, e.g., by detection of appropriate transcripts and/or proteins (www.uniprot.org, 3 November 2021).
We have confirmed the presence of a single form of FeSOD (about 40 kDa) in Synechocystis by all analytical methods used here, which is consistent with both literature data and databases [33,34]. This shows that the detection methods used to identify SOD were adequate and provide reliable information. Therefore, FeSOD1 from Synechocystis can be considered as the “reference FeSOD”. In the majority of cyanobacteria: Spirulina platensis, Microcystis aeruginosa, Nostoc PCC 7120, Nostoc commune, Oscillatoria sp. the occurrence of Fe- or/and MnSOD was identified [45,46,47,48,49]. The failure of H2O2 to completely inhibit FeSOD2 in G. violaceus and particularly in Geitlerinema sp. ZHR1A may also indicate the existence of MnSOD. Although spectroscopy studies excluded Mn ions in the samples, it should be emphasized that in Propionibacterium shermanii and Methanobacterium thermoautitrophicum Fe-containing SODs were not sensitive to inhibitory effects of H2O2 [50,51].
The complete lack of detectable activity of Cu/ZnSODs in G. violaceus and Geitlerinema sp. ZHR1A was noted. One possible answer is that these Cu/ZnSODs represent inactive genes/proteins for some reason or a detection method, e.g., in a gel activity stain, is not sufficiently accurate and sensitive. However, we did not find any data in the literature that concern pseudogenes of SODs or a more accurate method for SOD identification in crude cell extracts of any organisms. Nevertheless, it cannot be excluded that sequences predicted to belong to the Cu/ZnSOD family are pseudogenes. Pseudogenes are present in the genome of cyanobacteria and their levels vary among species and strains. Many genes encoding antioxidant enzymes, such as catalase, glutathione peroxidase, and glutathione S-transferase, have been classified as pseudogenes in cyanobacteria [52]. In the case of G. violaceus CCALA 979 and Geitlerinema sp. ZHR1A, their genomes have not been sequenced. This result is particularly interesting for G. violaceus CCALA 979, as it is closely related to G. violaceus PCC 7421 and G. kilaueensis (Figure 1) [32,53]. According to the UniProt database (www.uniprot.org, 3 November 2021), both G. violaceus PCC 7421 and G. kilaueensis have genes for Cu/ZnSOD-like proteins. It is possible that the genes encoding Cu/ZnSOD (sodC) were not transcribed and translated into active CuZnSOD under the culture conditions tested. Several studies have shown that SOD genes are expressed in response to changing environmental conditions [54,55].
It has been shown that Cu/ZnSODs are rather rare SODs in cyanobacteria compared to Fe- and MnSODs. Nevertheless, a possible involvement of Cu/ZnSODs as an evolutionarily older class of SOD in cyanobacteria than FeSODs has recently been postulated [20]. Our data support previous findings that FeSODs are at least as old as Cu/ZnSODs or even older than Cu/ZnSODs among SODs [7,8,44,56]. Especially due to the basal position of the 16S rRNA of G. violaceus CCALA 979, together with other cyanobacteria from Gloeobacter clade (Figure 1) and its active FeSODs, an ancient origin of this class of SOD in cyanobacteria cannot be excluded. Moreover, the presence of iron in many other antioxidant enzymes in Archaea, Bacteria, and Eucarya may suggest that these enzymes evolved before GOE and the release of significant amounts of O2 into the environment [17,19]. In our opinion, the possible antiquity of Cu/ZnSOD in ancient cyanobacteria, such as Gloeobacter, needs further studies.
The obtained results of SOD activity staining, supported by spectroscopic analyses, provided evidence that the only active class of SODs in Synechocystis sp. PCC 6803, G. violaceus CCALA 979 and Geitlerinema sp. ZHR1A is FeSOD.

4. Materials and Methods

4.1. Cyanobacteria

Three species of cyanobacteria were analyzed: Synechocystis sp. PCC 6803, G. violaceus and Geitlerinema sp. ZHR1A, which differ in their morphology and ecological habitats. The strain Synechocystis sp. PCC 6803 was acquired from Collections des Cyanobactéries of the Institut Pasteur in Paris (France). The other two strains G. violaceus (CCALA 979) and Geitlerinema sp. ZHR1A (CCALA 1069) were acquired from the Culture Collection of Autotrophic Organisms (CCALA) of the Institute of Botany CAS in Třeboň (Czech Republic). For G. violaceus CCALA 979, the reference strain is G. violaceus PCC 7421 [53], which was first isolated as G. violaceus strain 7421 by Rippka et al. [57].

4.2. Databases Query and Phylogenetic Analysis

In contrast to Synechocystis, the genomes of G. violaceus CCALA 979 and Geitlerinema sp. ZHR1A have not been sequenced. Therefore, the relationship between the strains studied and the species whose genomes have been sequenced was analyzed using the sequenced 16S rRNA fragments of G. violaceus and Geitlerinema sp. ZHR1A as well as 16S rRNA sequences from databases.

4.2.1. Sequencing of 16S rRNA

Total RNA was isolated from 0.5 g of lyophilized cyanobacteria samples using the RNeasy Plant Mini Kit (QIAGEN) according to the manufacturer’s instructions. The RNA was then transcribed into cDNA; cDNA was obtained from 5 µg RNA using the TranScriba Kit (A&A Biotechnology), according to the manufacturer’s instructions. Universal primers for amplification of 16S rRNA in cyanobacteria were used to find the 16S rRNA fragments [58]; forward primer CYA 359F: 5′-GGGGAATYTTCCGCAATGGG-3′and reverse primer CYA 781R: 5′-GACTACWGGGGTATCTAATCCCWTT-3′. The PCR products obtained were subjected to sequencing (Genomed S.A., Warszawa, Poland). The 16S rRNA sequences (fragments) are shown in Supplementary Material Notes S1. Subsequently, the sequences were used for the reconstruction of the 16S rRNA tree.

4.2.2. The Reconstruction of 16S rRNA Tree

All 16S rRNA sequences were derived from Silva (http://www.arb-silva.de, 3 November 2021) and GenBank (www.ncbi.nlm.nih.gov, 3 November 2021) (for details see Supplementary Material Notes S2). The sequences were aligned with the default parameters of MUSCLE implemented in MEGA6 [59]. The evolutionary history was inferred by using the Maximum Likelihood (ML) method based on the Kimura 2-parameter model [60]. A discrete gamma distribution was used to model evolutionary rate differences among sites. The bootstrap consensus tree was inferred from 500 replicates [61]. The tree is drawn to scale, with branch lengths measured in the number of substitutions per site. This analysis involved 24 nucleotide sequences. The phylogenetic reconstruction was performed in MEGA6 [59].

4.3. Growth Conditions

The strains were cultured in BG11 medium [62] in 500 mL Duran bottles. The bottles were flushed with air using an aquarium membrane pump (SERA Air 550 R Plus, Heinsberg, Germany). For culture, 16 mL of the cyanobacterial suspension was added to the 400 mL of medium. The cultures of Synechocystis sp. PCC 6803 and Geitlerinema sp. ZHR1A were grown for 15 days, while the culture of G. violaceus was cultured for 30 days at a photoperiod of 16h:8h, light:dark at 25 ± 1 °C under white light from LED lamps. The LED’s light intensity was established at 70 μmol photons m−2 s−1. On these days, the cyanobacteria culture had a maximum increase in biomass, the measure of which was the OD (optical density) at 730 nm (OD730) between about 1.0 and 2.0. Samples for SOD analyses were taken between the 4th and 5th hour of the photoperiod.

4.4. Preparation of Soluble Proteins from Cyanobacteria

In total, 15 mL of the culture was centrifuged at 1800 g for 10 min and the pellet was lyophilized. The resulting pellet was then frozen in liquid nitrogen and thawed in a sonic bath, allowing the cells to partially break down. This was done three times. Metal beads were added to the pellet and triturated at a frequency of 25 s−1 for 3 min. Then, 500 μL of homogenization buffer consisting of 100 mM Tricine-Tris, 3 mM MgSO4 7H2O, 1 mM DTT, 3 mM EGTA, pH 8.0, and cOmplete™ Protease Inhibitor Cocktail tablets (Roche) were added to ca. 50 mg of the biomass powder. The suspension was again triturated with metal beads and centrifuged at 22,000 g for 10 min and the supernatant fraction was collected. Protein concentration was determined according to Bradford [63] using the Bio-Rad Protein Assay according to the manufacturer’s instructions. The protein extract was loaded directly onto a native polyacrylamide gel.

4.5. SOD Assay

The SOD forms were separated by native electrophoresis on 12% (w:v) polyacrylamide gels at a constant voltage of 180 V for about 1 h [64]. A total of 30 µg of protein was loaded onto each lane. The gels were stained for SOD activity according to the method described by Beauchamp and Fridovich [65]. After electrophoresis and incubation for 20–25 min in the dark at room temperature in the standard staining buffer: 50 mM phosphate buffer, pH 7.8, 10 mM EDTA, 28 mM TEMED, 30 µM riboflavin and 245 µM nitro blue tetrazolium chloride (NBT), the gels were exposed to the artificial white light until the SOD activity bands became visible. To inhibit Cu/ZnSOD and FeSOD, the gels were stained in a standard buffer containing 5 mM H2O2. Inhibition of Cu/ZnSOD was achieved in the presence of 2 mM KCN. In addition, a protein mass ladder (PageRuler™ Prestained Protein Ladder, Thermo Scientific, Waltham, MA, USA) was used to estimate the molecular weight (MW) of the separated SOD forms (see also Supplementary Material Figure S1, Tables S1 and S2).

4.6. Quantitative Analysis

Images of SOD staining on native gels were acquired by photographic documentation using the GeneSnap system (Cambridge, UK) and densitometric analysis of bands was performed using ImageJ software (NIH, Bethesda, MD, USA) for semi-quantitative determination of SOD activity.

4.7. Metal Identification in SOD Activity Bands by Spectroscopic Methods

In order to additionally verify which type of metal is present in the identified SODs, the SOD activity bands were cut out of a gel (Figure 5) and subsequently analyzed using various spectroscopic methods described below.

4.8. Fourier Transformed Infrared (FTIR) Spectroscopy

For spectroscopic measurements, Vertex 70v from Bruker was used. The samples detection was made with liquid-nitrogen cooled mercury cadmium telluride (MCT) and diamond attenuated total reflection (ATR) crystal plate. IR spectral resolution were acquired at 2 cm−1 with 32 scans within the ranges 4000 cm−1 to 400 cm−1. Prior to each sample measurement, the empty diamond/MCT of the ATR unit was recorded as background and repeatedly subtracted via the appropriate software to eliminate water in the sample and air. To measure the FTIR spectrum, the sample was placed directly on the diamond crystal of the ATR device. The crystal of the instrument was cleaned and dried before and after each sample’s measurements. After waiting for approximately 5 min (the water evaporated from the sample), the measurement was taken. The FTIR spectra were measured for five samples. For each sample, three spectra were recorded. Thus, 15 spectra were obtained. Then, the three spectra were averaged for each sample. After pre-processing, the selected spectral band regions were analyzed using the OPUS setup to detect the changes in the samples. For all spectra, the baseline correction vector was normalized, 7 points were smoothed with Savitzky–Golay and ATR correction was applied.

4.9. Particle-Induced X-ray Emission (PIXE)

The trace elements in the investigated samples were analyzed by detecting of characteristic X-ray radiation (PIXE—particle-induced X-ray emission technique) at the proton microprobe [66] at the Van de Graaff accelerator.
For the elemental analysis, the individual SOD bands cut from the gel (Figure 5) were deposited on carbon tape and dried. The samples were then placed in a vacuum experimental chamber and the location of the beam spot on a sample was determined using an optical microscope. A 2 MeV proton beam with a diameter of about 30 µm was applied and all samples were analyzed with a typical beam current of 200–300 pA with a collection time of 5 min per sample. The employed X-ray Amptek SDD detector (Si crystal 500 µm thick) was positioned at a distance of 3 cm from the sample. Its active area was 70 mm2, internally collimated to 50 mm2, and the input beryllium window (12.5 µm thick) enabled quantitative elemental analysis for elements from sodium (Na) upwards with an energy resolution of 125–135 eV. However, the low energy X–rays were suppressed by a Kapton filter (280 µm thick), therefore only elements of interest (roughly speaking, heavier than potassium (K)) were analyzed.
The X-ray spectra were acquired using the proprietary software and analyzed using the GUPIX code [67], which allowed quantification of the results. For this study, the most important information was to reliably confirm the presence of a detected element. Therefore, a positive detection was approved only if the calculated element concentration value exceeded the theoretical minimal detection limit (MDL) plus three single standard deviation values.

4.10. Atomic Emission Spectroscopy (AES)

The samples of a gel (Figure 5) were subjected to wet mineralization in a closed system using microwave energy. An Anton Paar Multiwave 3000 microwave system was used for mineralization. The samples were mineralized in a mixture of nitric acid (V) solution and H2O2 in a volume ratio of 1:3. The concentration of iron (Fe) and manganese (Mn) in the solutions obtained was determined by the atomic emission spectroscopy method using a Perkin Elmer Optima 7600 instrument. The wavelengths used to determine the concentration of the elements analyzed and the detection limits in relation to the methods used are listed in Table 2. To control the accuracy of the element analyses, a certified reference material, IAEA-V-10, was used. Table 2 shows the results of the analyses of the reference material and the recovery value based on the analyses performed in 3 replicates.

4.11. Statistical Analysis

The results presented in the study represent the means of three independent biological repetitions. The comparison of the significance of differences in mean values between the activity of SOD was performed using Tukey’s HSD test procedure at the level of significance p ≤ 0.01. The statistical analysis was performed using GraphPad v. 7.01 software (San Diego, CA, USA).

5. Conclusions

The obtained results of SOD activity staining, supported by spectroscopic analyses, provided evidence that the only active class of SODs in Synechocystis sp. PCC 6803, G. violaceus CCALA 979, and Geitlerinema sp. ZHR1A is FeSOD. In our opinion, the possible occurrence of Cu/ZnSOD in cyanobacteria, such as Gloeobacter, requires further studies.

Supplementary Materials

The following supporting information can be downloaded at: https://www.mdpi.com/article/10.3390/ijms232213819/s1.

Author Contributions

Conceptualization, M.K.-M. and I.Ś.; methodology, M.K.-M., J.D., J.L. and M.N.; validation, M.K.-M. and I.Ś.; formal analysis, M.K.-M.; investigation, M.K.-M., K.J.Z., J.D., J.L. and M.N.; resources, M.K.-M., K.J.Z., J.D., J.L., M.N. and I.Ś.; data curation, K.J.Z., J.D., J.L. and M.N.; writing—original draft preparation, M.K.-M. and I.Ś.; writing part of methods, K.J.Z.; writing part on FTIR spectroscopy, J.D.; writing part on PIXE spectroscopy, J.L.; writing part on AES spectroscopy, M.N.; writing—review and editing, M.K.-M. and I.Ś.; visualization, M.K.-M. and I.Ś.; supervision, I.Ś.; project administration, M.K.-M. All authors have read and agreed to the published version of the manuscript.

Funding

This research was funded by The Franciszek Górski Institute of Plant Physiology Polish Academy of Sciences in Kraków, Poland.

Institutional Review Board Statement

Not applicable.

Informed Consent Statement

Not applicable.

Data Availability Statement

Data sharing not applicable.

Conflicts of Interest

The authors declare no conflict of interest.

References

  1. Halliwell, B.; Gutteridge, J.M.C. Free Radicals in Biology and Medicine; Oxford University Press: New York, NY, USA, 2015; ISBN 9780198717478. [Google Scholar]
  2. Hayyan, M.; Hashim, M.A.; Alnashef, I.M. Superoxide ion: Generation and chemical implications. Chem. Rev. 2016, 116, 3029–3085. [Google Scholar] [CrossRef] [Green Version]
  3. Szymańska, R.; Ślesak, I.; Orzechowska, A.; Kruk, J. Physiological and biochemical responses to high light and temperature stress in plants. Environ. Exp. Bot. 2017, 139, 165–177. [Google Scholar] [CrossRef]
  4. Taverne, Y.J.; Merkus, D.; Bogers, A.J.; Halliwell, B.; Duncker, D.J.; Lyons, T.W. Reactive oxygen species: Radical factors in the evolution of animal life. BioEssays 2018, 40, 1700158. [Google Scholar] [CrossRef] [PubMed]
  5. Asada, K.; Takahashi, M. Production and Scavenging of Active Oxygen in Photosynthesis; Kyle, C.D.J., Ed.; Elsevier: Amsterdam, The Netherlands, 1987. [Google Scholar]
  6. Miller, A.F. Superoxide dismutases: Ancient enzymes and new insights. FEBS Lett. 2012, 586, 585–595. [Google Scholar] [CrossRef] [PubMed] [Green Version]
  7. Sheng, Y.; Abreu, I.A.; Cabelli, D.E.; Maroney, M.J.; Miller, A.-F.; Teixeira, M.; Valentine, J.S. Superoxide dismutases and superoxide reductases. Chem. Rev. 2014, 114, 3854–3918. [Google Scholar] [CrossRef] [PubMed]
  8. Case, A.J. On the origin of superoxide dismutase: An evolutionary perspective of superoxide-mediated redox signaling. Antioxidants 2017, 6, 82. [Google Scholar] [CrossRef] [PubMed] [Green Version]
  9. Ślesak, I.; Kula, M.; Ślesak, H.; Miszalski, Z.; Strzałka, K. How to define obligatory anaerobiosis? An evolutionary view on the antioxidant response system and the early stages of the evolution of life on Earth. Free Radic. Biol. Med. 2019, 140, 61–73. [Google Scholar] [CrossRef] [PubMed]
  10. Ray, P.D.; Huang, B.-W.; Tsuji, Y. Reactive oxygen species (ROS) homeostasis and redox regulation in cellular signaling. Cell. Signal. 2012, 24, 981–990. [Google Scholar] [CrossRef] [Green Version]
  11. Sies, H.; Jones, D.P. Reactive oxygen species (ROS) as pleiotropic physiological signalling agents. Nat. Rev. Mol. Cell Biol. 2020, 21, 363–383. [Google Scholar] [CrossRef]
  12. Priya, B.; Premanandh, J.; Dhanalakshmi, R.T.; Seethalakshmi, T.; Uma, L.; Prabaharan, D.; Subramanian, G. Comparative analysis of cyanobacterial superoxide dismutases to discriminate canonical forms. BMC Genomics 2007, 8, 435. [Google Scholar] [CrossRef]
  13. del Río, L.A.; Corpas, F.J.; López-Huertas, E.; Palma, J.M. Plant Superoxide Dismutases: Function under abiotic stress conditions. In Antioxidants and Antioxidant Enzymes in Higher Plants; Gupta, D.K., Palma, J.M., Corpas, F.J., Eds.; Springer International Publishing: Cham, Switzerland, 2018; pp. 1–26. ISBN 978-3-319-75088-0. [Google Scholar]
  14. Fridovich, I. Superoxide dismutases. Adv. Enzymol. Relat. Areas Mol. Biol. 1986, 58, 61–97. [Google Scholar] [CrossRef] [PubMed]
  15. Kim, E.J.; Kim, H.P.; Hah, Y.C.; Roe, J.H. Differential expression of superoxide dismutases containing Ni and Fe/Zn in Streptomyces coelicolor. Eur. J. Biochem. 1996, 241, 178–185. [Google Scholar] [CrossRef] [PubMed]
  16. Alscher, R.G.; Erturk, N.; Heath, L.S. Role of superoxide dismutases (SODs) in controlling oxidative stress in plants. J. Exp. Bot. 2002, 53, 1331–1341. [Google Scholar] [CrossRef]
  17. Ślesak, I.; Ślesak, H.; Zimak-Piekarczyk, P.; Rozpądek, P. Enzymatic antioxidant systems in early anaerobes: Theoretical considerations. Astrobiology 2016, 16, 348–358. [Google Scholar] [CrossRef] [PubMed] [Green Version]
  18. Johnson, L.A.; Hug, L.A. Distribution of reactive oxygen species defense mechanisms across domain bacteria. Free Radic. Biol. Med. 2019, 140, 93–102. [Google Scholar] [CrossRef] [PubMed]
  19. Jabłońska, J.; Tawfik, D.S. The evolution of oxygen-utilizing enzymes suggests early biosphere oxygenation. Nat. Ecol. Evol. 2021, 5, 442–448. [Google Scholar] [CrossRef]
  20. Boden, J.S.; Konhauser, K.O.; Robbins, L.J.; Sánchez-Baracaldo, P. Timing the evolution of antioxidant enzymes in cyanobacteria. Nat. Commun. 2021, 12, 1–12. [Google Scholar] [CrossRef]
  21. Schirrmeister, B.E.; Sanchez-Baracaldo, P.; Wacey, D. Cyanobacterial evolution during the Precambrian. Int. J. Astrobiol. 2016, 15, 187–204. [Google Scholar] [CrossRef] [Green Version]
  22. Hamilton, T.L.; Bryant, D.A.; Macalady, J.L. The role of biology in planetary evolution: Cyanobacterial primary production in low-oxygen Proterozoic oceans. Environ. Microbiol. 2016, 18, 325–340. [Google Scholar] [CrossRef]
  23. Dick, G.J.; Grim, S.L.; Klatt, J.M. Controls on O2 production in cyanobacterial mats and implications for Earth’s oxygenation. Annu. Rev. Earth Planet. Sci. 2018, 46, 123–147. [Google Scholar] [CrossRef]
  24. Sánchez-Baracaldo, P.; Cardona, T. On the origin of oxygenic photosynthesis and cyanobacteria. New Phytol. 2020, 225, 1440–1446. [Google Scholar] [CrossRef] [PubMed]
  25. Ślesak, I.; Libik, M.; Karpinska, B.; Karpinski, S.; Miszalski, Z. The role of hydrogen peroxide in regulation of plant metabolism and cellular signalling in response to environmental stresses. Acta Biochim. Pol. 2007, 54, 39–50. [Google Scholar] [CrossRef] [PubMed]
  26. Foyer, C.H.; Noctor, G. Redox regulation in photosynthetic organisms: Signaling, acclimation, and practical implications. Antioxid. Redox Signal. 2009, 11, 861–905. [Google Scholar] [CrossRef] [PubMed] [Green Version]
  27. Lea-Smith, D.J.; Bombelli, P.; Vasudevan, R.; Howe, C.J. Photosynthetic, respiratory and extracellular electron transport pathways in cyanobacteria. Biochim. Biophys. Acta-Bioenerg. 2016, 1857, 247–255. [Google Scholar] [CrossRef] [Green Version]
  28. Nakamura, Y.; Kaneko, T.; Sato, S.; Mimuro, M.; Miyashita, H.; Tsuchiya, T.; Sasamoto, S.; Watanabe, A.; Kawashima, K.; Kishida, Y.; et al. Complete genome structure of Gloeobacter violaceus PCC 7421, a cyanobacterium that lacks thylakoids. DNA Res. 2003, 10, 137–145. [Google Scholar] [CrossRef]
  29. Gupta, R.S. Protein signatures (molecular synapomorphies) that are distinctive characteristics of the major cyanobacterial clades. Int. J. Syst. Evol. Microbiol. 2009, 59, 2510–2526. [Google Scholar] [CrossRef] [PubMed]
  30. Mareš, J.; Strunecký, O.; Bučinská, L.; Wiedermannová, J. Evolutionary patterns of thylakoid architecture in cyanobacteria. Front. Microbiol. 2019, 10, 1–22. [Google Scholar] [CrossRef]
  31. Raven, J.A.; Sánchez-Baracaldo, P. Gloeobacter and the implications of a freshwater origin of Cyanobacteria. Phycologia 2021, 60, 402–418. [Google Scholar] [CrossRef]
  32. Mareš, J.; Hrouzek, P.; Kaňa, R.; Ventura, S.; Strunecký, O.; Komárek, J. The primitive thylakoid-less cyanobacterium Gloeobacter is a common rock-dwelling organism. PLoS ONE 2013, 8, 1–11. [Google Scholar] [CrossRef] [Green Version]
  33. Kim, J.H.; Suh, K.H. Light-dependent expression of superoxide dismutase from cyanobacterium Synechocystis sp. strain PCC 6803. Arch. Microbiol. 2005, 183, 218–223. [Google Scholar] [CrossRef]
  34. Ke, W.T.; Dai, G.Z.; Jiang, H.B.; Zhang, R.; Qiu, B.S. Essential roles of iron superoxide dismutase in photoautotrophic growth of Synechocystis sp. PCC 6803 and heterogeneous expression of marine Synechococcus sp. CC9311 copper/zinc superoxide dismutase within its sodB knockdown mutant. Microbiology 2014, 160, 228–241. [Google Scholar] [CrossRef] [PubMed] [Green Version]
  35. Duygu, D.Y.; Udoh, A.U.; Ozer, T.B.; Akbulut, A.; Erkaya, I.A.; Yildiz, K.; Guler, D. Fourier transform infrared (FTIR) spectroscopy for identification of Chlorella vulgaris Beijerinck 1890 and Scenedesmus obliquus (Turpin) Kützing 1833. AFRICAN J. Biotechnol. 2012, 11, 3817–3824. [Google Scholar] [CrossRef]
  36. Wang, X.; Han, M.; Bao, J.; Tu, W.; Dai, Z. A superoxide anion biosensor based on direct electron transfer of superoxide dismutase on sodium alginate sol–gel film and its application to monitoring of living cells. Anal. Chim. Acta 2012, 717, 61–66. [Google Scholar] [CrossRef] [PubMed]
  37. Liu, W.; Wu, J.; Ji, X.; Ma, Y.; Liu, L.; Zong, X.; Yang, H.; Dai, J.; Chen, X.; Xue, W. Advanced biomimetic nanoreactor for specifically killing tumor cells through multi-enzyme cascade. Theranostics 2020, 10, 6245–6260. [Google Scholar] [CrossRef]
  38. Ayala, I.; Perry, J.J.P.; Szczepanski, J.; Tainer, J.A.; Vala, M.T.; Nick, H.S.; Silverman, D.N. Hydrogen bonding in human manganese superoxide dismutase containing 3-fluorotyrosine. Biophys. J. 2005, 89, 4171–4179. [Google Scholar] [CrossRef] [Green Version]
  39. David, C.; D’Andrea, C.; Lancelot, E.; Bochterle, J.; Guillot, N.; Fazio, B.; Maragò, O.M.; Sutton, A.; Charnaux, N.; Neubrech, F.; et al. Raman and IR spectroscopy of manganese superoxide dismutase, a pathology biomarker. Vib. Spectrosc. 2012, 62, 50–58. [Google Scholar] [CrossRef]
  40. Cooper, E.A.; Knutson, K. Fourier Transform Infrared spectroscopy investigations of protein structure. Pharm. Biotechnol. 1995, 7, 101–143. [Google Scholar]
  41. Vedantham, G.; Sparks, H.G.; Sane, S.U.; Tzannis, S.; Przybycien, T.M. A holistic approach for protein secondary structure estimation from infrared spectra in H2O solutions. Anal. Biochem. 2000, 285, 33–49. [Google Scholar] [CrossRef]
  42. Sun, W.; Fang, J.; Cheng, M.; Xia, P.; Tang, W. Secondary structure dependent on metal ions of copper, zinc superoxide dismutase investigated by Fourier Transform IR spectroscopy. Biopolymers 1997, 42, 297–303. [Google Scholar] [CrossRef]
  43. Chatterjee, S.K.; Maji, R.C.; Barman, S.K.; Olmstead, M.M.; Patra, A.K. Hexacoordinate nickel(II)/(III) complexes that mimic the catalytic cycle of nickel superoxide dismutase. Angew. Chemie Int. Ed. 2014, 53, 10184–10189. [Google Scholar] [CrossRef]
  44. Harada, M.; Akiyama, A.; Furukawa, R.; Yokobori, S.I.; Tajika, E.; Yamagishi, A. Evolution of superoxide dismutases and catalases in cyanobacteria: Occurrence of the antioxidant enzyme genes before the rise of atmospheric oxygen. J. Mol. Evol. 2021, 89, 527–543. [Google Scholar] [CrossRef] [PubMed]
  45. Canini, A.; Leonardi, D.; Caiola, M.G. Superoxide dismutase activity in the cyanobacterium Microcystis aeruginosa after surface bloom formation. New Phytol. 2001, 152, 107–116. [Google Scholar] [CrossRef] [PubMed]
  46. Regelsberger, G.; Laaha, U.; Dietmann, D.; Rüker, F.; Canini, A.; Grilli-Caiola, M.; Furtmüller, P.G.; Jakopitsch, C.; Peschek, G.A.; Obinger, C. The iron superoxide dismutase from the filamentous cyanobacterium Nostoc PCC 7120: Localization, overexpression, and biochemical characterization. J. Biol. Chem. 2004, 279, 44384–44393. [Google Scholar] [CrossRef] [PubMed] [Green Version]
  47. Ismaiel, M.M.S.; El-Ayouty, Y.M.; Loewen, P.C.; Piercey-Normore, M.D. Characterization of the iron-containing superoxide dismutase and its response to stress in cyanobacterium Spirulina (Arthrospira) platensis. J. Appl. Phycol. 2014, 26, 1649–1658. [Google Scholar] [CrossRef]
  48. Kesheri, M.; Kanchan, S.; Richa; Sinha, R.P. Isolation and in silico analysis of Fe-superoxide dismutase in the cyanobacterium Nostoc commune. Gene 2014, 553, 117–125. [Google Scholar] [CrossRef]
  49. Kesheri, M.; Kanchan, S.; Sinha, R.P. Isolation and in silico analysis of antioxidants in response to temporal variations in the cyanobacterium Oscillatoria sp. Gene Rep. 2021, 23, 101023. [Google Scholar] [CrossRef]
  50. Takao, M.; Yasui, A.; Oikawa, A. Unique characteristics of superoxide dismutase of a strictly anaerobic archaebacterium Methanobacterium thermoautotrophicum. J. Biol. Chem. 1991, 266, 14151–14154. [Google Scholar] [CrossRef]
  51. Meier, B.; Sehn, A.P.; Christa, M.; Manfred, S. Reactions of hydrogen peroxide with superoxide dismutase from Propionibacterium shermanii-an enzyme which is equally active with iron or manganese-are independent of the prosthetic metal. Arch. Biochem. Biophys. 1994, 313, 296–303. [Google Scholar] [CrossRef]
  52. Mohanta, T.K.; Pudake, R.N.; Bae, H. Genome-wide identification of major protein families of cyanobacteria and genomic insight into the circadian rhythm. Eur. J. Phycol. 2017, 52, 149–165. [Google Scholar] [CrossRef]
  53. Mareš, J.; Komárek, J.; Compère, P.; Oren, A. Validation of the generic name Gloeobacter Rippka et al. 1974, Cyanophyceae. Cryptogam. Algol. 2013, 34, 255–262. [Google Scholar] [CrossRef]
  54. Liang, W.; Wang, L.; Shi, J.; Lei, X.; Yang, J.; Wu, S.; Chen, W. Differential expression of antioxidant proteins in the drought-tolerant cyanobacterium Nostoc flagelliforme under desiccation. Plant Omics 2014, 7, 205–212. [Google Scholar]
  55. Wang, H.; Ki, J.S. Molecular characterization and expression analysis of copper-zinc superoxide dismutases from the freshwater alga Closterium ehrenbergii under metal stress. Environ. Toxicol. 2020, 35, 5–14. [Google Scholar] [CrossRef] [PubMed]
  56. Asada, K.; Allen, J.; Foyer, C.H.; Matthijs, H.C.P. The water-water cycle as alternative photon and electron sinks. Philos. Trans. R. Soc. B Biol. Sci. 2000, 355, 1419–1431. [Google Scholar] [CrossRef] [PubMed] [Green Version]
  57. Rippka, R.; Waterbury, J.; Cohen-Bazire, G. A cyanobacterium which lacks thylakoids. Arch. Microbiol. 1974, 100, 419–436. [Google Scholar] [CrossRef]
  58. Nübel, U.; Garcia-Pichel, F.; Muyzer, G. PCR primers to amplify 16S rRNA genes from cyanobacteria. Appl. Environ. Microbiol. 1997, 63, 3327–3332. [Google Scholar] [CrossRef] [PubMed] [Green Version]
  59. Tamura, K.; Stecher, G.; Peterson, D.; Filipski, A.; Kumar, S. MEGA6: Molecular Evolutionary Genetics Analysis version 6.0. Mol. Biol. Evol. 2013, 30, 2725–2729. [Google Scholar] [CrossRef] [Green Version]
  60. Kimura, M. A simple method for estimating evolutionary rates of base substitutions through comparative studies of nucleotide sequences. J. Mol. Evol. 1980, 16, 111–120. [Google Scholar] [CrossRef]
  61. Felsenstein, J. Confidence limits on phylogenies: An approach using the bootstrap. Evolution 1985, 39, 783–791. [Google Scholar] [CrossRef]
  62. Rippka, R.; Herdman, M. Pasteur culture collection of cyanobacterial strains in axenic culture. In Catalogue of Strains; Institut Pasteur: Paris, France, 1992; p. 103. ISBN 9783440126349. [Google Scholar]
  63. Bradford, M.M. A rapid and sensitive method for the quantitation of microgram quantities of protein utilizing the principle of protein-dye binding. Anal. Biochem. 1976, 72, 248–254. [Google Scholar] [CrossRef]
  64. Miszalski, Z.; Ślesak, I.; Niewiadomska, E.; Baczek-Kwinta, R.; Lüttge, U.; Ratajczak, R. Subcellular localization and stress responses of superoxide dismutase isoforms from leaves in the C3-CAM intermediate halophyte Mesembryanthemum crystallinum L. Plant Cell Environ. 1998, 21, 169–179. [Google Scholar] [CrossRef]
  65. Beauchamp, C.; Fridovich, I. Superoxide dismutase: Improved assays and an assay applicable to acrylamide gels. Anal. Biochem. 1971, 44, 276–287. [Google Scholar] [CrossRef]
  66. Lekki, J.; Lebed, S.; Paszkowski, M.L.; Kusiak, M.; Vogt, J.; Hajduk, R.; Polak, W.; Potempa, A.; Stachura, Z.; Styczeń, J. Age determination of monazites using the new experimental chamber of the Cracow proton microprobe. Nucl. Instrum. Methods Phys. Res. Sect. B Beam Interact. Mater. At. 2003, 210, 472–477. [Google Scholar] [CrossRef]
  67. Campbell, J.L.; Boyd, N.I.; Grassi, N.; Bonnick, P.; Maxwell, J.A. The Guelph PIXE software package IV. Nucl. Instrum. Methods Phys. Res. Sect. B Beam Interact. Mater. At. 2010, 268, 3356–3363. [Google Scholar] [CrossRef]
Figure 1. The 16S rRNA tree reconstructed for selected phototrophs performing oxygenic photosynthesis. The tree is rooted with 16S rRNA from Rhodospirillum rubrum. Blue-green circles denote cyanobacteria analyzed here, i.e., Synechocystis sp. PCC 6803, Gloeobacter violaceus CCALA 979 and Geitlerinema sp. ZHR1A (for details see Materials and Methods and Supplementary Material Notes S2). Numbers at nodes show bootstrap values (based on 500 replicates). The scale represents the expected number of substitutions per nucleotide position.
Ijms 23 13819 g001
Figure 2. Activity of SOD forms in three species of cyanobacteria: Synechocystis sp. PCC 6803 (Syne.), Gloeobacter violaceus (Gloeo.), and Geitlerinema sp. ZHR1A (Geit.). (a) Identification of the different SOD forms in the assay with inhibitors: KCN and H2O2; “standard” denotes a standard staining buffer without inhibitors (see also “Materials and Methods”). 30 µg of protein was loaded on each lane. The in-gel activity bands of SOD from a standard staining buffer: 1A, 1B, 1C, 2B and 2C cut for spectroscopic analysis are shown. The lane with a protein-mass ladder is shown on the left. (b) Activity of the SOD forms without inhibitors expressed in arbitrary units (a.u.). Data represent means ± SD (n = 3). Statistical significance between means at least at p < 0.01 is indicated by different letters above the bars and was calculated by Tukey’s HSD test.
Ijms 23 13819 g002
Figure 3. Fourier transformed infrared (FTIR) spectroscopy spectra of the bands of SOD, excised from the gel (see “Materials and Methods” and Figure 2). (a) Band 1A of Synechocystis sp. PCC 6803, (b) Bands 1B and 2B of Gloeobacter violaceus, and (c) Bands 1C and 2C of Geitlerinema sp. ZHR1A. These spectra are representative of three independent measurements.
Ijms 23 13819 g003
Figure 4. Particle-induced X-ray emission (PIXE) spectra with identified Kα peaks of the bands of SOD, excised from the gel (see “Materials and Methods” and Figure 2). (a) Band 1A of Synechocystis sp. PCC 6803, (b,c) Bands 1B and 2B of Gloeobacter violaceus, and (d,e) Bands 1C and 2C of Geitlerinema sp. ZHR1A. These spectra are representative of three independent measurements.
Ijms 23 13819 g004
Figure 5. The scheme of preparation of SOD activity bands in a gel for spectroscopic analysis: Fourier transformed infrared (FTIR) spectroscopy, particle-induced X-ray emission (PIXE), atomic emission spectroscopy (AES). For the spectroscopic analyses, a pure gel without SOD activity was used as background.
Ijms 23 13819 g005
Table 1. Content of iron (Fe) and manganese (Mn) in the bands of SOD of the analyzed cyanobacteria using the atomic emission spectroscopy (AES) method. The data represent means ± SD (n = 3).
Band of SODStrainFe
(µg g−1)
Mn
(µg g−1)
Identified Form of SOD
1ASynechocystis sp. PCC 68035.0 ± 1.0LOQ aFeSOD1
1BG. violaceus CCALA 9797.9 ± 2.7LOQFeSOD1
2B1.0 ± 0.4LOQFeSOD2
1CGeitlerinema sp. ZHR1A9.6 ± 1.8LOQFeSOD1
2C2.6 ± 1.0LOQFeSOD2
a Limit of quantification (LOQ).
Table 2. Parameters of the applied atomic emission spectroscopy (AES) method.
ElementWavelengths
(nm)
Detection Limit
(mg dm−3)
Content
in Certificated Material
(mg kg−1)
Measured
(mg kg−1)
Recovery
(%)
Fe238.20.005185201.2108.8
Mn257.60.0014748.6103.3
Publisher’s Note: MDPI stays neutral with regard to jurisdictional claims in published maps and institutional affiliations.

