Article

Genome-Scale Identification, Classification, and Expression Profiling of MYB Transcription Factor Genes in Cinnamomum camphora

1
Co-Innovation Center for Sustainable Forestry in Southern China, Key Laboratory of Forest Genetics and Biotechnology of Ministry of Education, Nanjing Forestry University, Nanjing 210037, China
2
Key Laboratory of Horticultural Plant Genetics and Improvement of Jiangxi Province, Institute of Biological Resources, Jiangxi Academy of Sciences, Nanchang 330096, China
*
Authors to whom correspondence should be addressed.
Int. J. Mol. Sci. 2022, 23(22), 14279; https://doi.org/10.3390/ijms232214279
Submission received: 20 October 2022 / Revised: 10 November 2022 / Accepted: 15 November 2022 / Published: 18 November 2022

Abstract

:
The camphor tree (Cinnamomum camphora (L.) Presl.) is the representative species of subtropical evergreen broadleaved forests in eastern Asia and an important raw material for essential oil production worldwide. Although MYBs have been comprehensively characterized and their functions have been partially resolved in many plants, it has not been explored in C. camphora. In this study, 121 CcMYBs were identified on 12 chromosomes in the whole genome of C. camphora and found that CcMYBs were mainly expanded by segmental duplication. They were divided into 28 subgroups based on phylogenetic analysis and gene structural characteristics. In the promoter regions, numerous cis-acting elements were related to biological processes. Analysis of RNA sequencing data from seven tissues showed that CcMYBs exhibited different expression profiles, suggesting that they have various roles in camphor tree development. In addition, combined with the correlation analysis of structural genes in the flavonoid synthesis pathway, we identified CcMYBs from three subgroups that might be related to the flavonoid biosynthesis pathway. This study systematically analyzed CcMYBs in C. camphora, which will set the stage for subsequent research on the functions of CcMYBs during their lifetime and provide valuable insights for the genetic improvement of camphor trees.

1. Introduction

The V-Myb avian myeloblastosis viral oncogene family, known as MYB transcription factors (TFs), comprises a large superfamily in plants and is characterized by highly conserved DNA-binding domain repeats [1]. MYB proteins can be divided into four subfamilies according to their number of repeats. Those containing only one or part of the repeat, called 1R-MYB or MYB-related proteins [2], mediate the oscillation of target genes involved in secondary metabolism, cell and organ morphogenesis, antioxidant defense systems, and regulation of various signaling pathways [3,4,5,6]. The R2R3-MYB subfamily, which contains two repeats, has the largest number of MYB members. R2R3-MYB proteins may have evolved through the R1 deletion of 3R-MYB [2] and are related to plant secondary metabolism, growth and development, and various abiotic stresses [7,8]. The 3R-MYB subfamily is composed of three adjacent repeats that are highly homologous to the 3R-MYB protein in animals and fungi. It participates in the control of the cell cycle and regulates cell differentiation by recognizing M-specific activator (MSA) elements and regulating G2/M phase transcription. The smallest subfamily is 4R-MYB, consisting of four R1/R2-like repeats, which have been found in Homo sapiens, Drosophila melanogaster, and some plants [9,10,11,12]. Some studies have found that 4R-MYBs are essential for gametophyte and zygote development [10]. Previous research has shown that the size of MYBs in plants is mainly due to the rapid expansion of the R2R3-MYB subfamily [1,13].
MYB proteins are widely involved in various biological processes, including cell differentiation, cell cycle regulation, responses to abiotic stresses, and secondary metabolite synthesis [1,5,14]. Abiotic stress can adversely affect plant growth. MYB TFs have been reported to participate in the response of Arabidopsis thaliana (L.) Heynh to biotic and abiotic stresses. AtMYB30 can be targeted by the Xanthomonas type III effector XopD, which suppresses AtMYB30-mediated plant defense, showing the critical role of AtMYB30 in the regulation of plant disease resistance [15]. The overexpression of AtMYB60, AtMYB96, and AtMYB44 proved that they enhanced the plants sensitivity to drought stress [16,17,18]. In apple plants (Malus sieversii f. niedzwetzkyana), MdMYB94 can improve tolerance to water-deficit stress and promote waxy biosynthesis in the leaf cuticle [19]. Additionally, MYB TFs can participate in regulating secondary metabolites, which can assist plants in adapting to changing environments. Flavonoids (bioflavonoids) are polyphenolic secondary metabolites found in the vacuoles of plant cells. They are the most important plant pigments for flower coloration and play an important role in signaling and light protection [20]. MYB TFs can regulate the expression of structural genes that affect flavonoid accumulation. GMYB10 specifically promotes the enrichment of cyanidin in callus and vegetative tissues by activating DFR and increasing pelargonidin content in the stamens of Gerbera hybrida [21,22]. GtMYB3 facilitates the accumulation of delphinidin in petals by inducing the expression of the F3’5’H gene in Gentiana trifloral [23]. Oncidium gower MYB TFs are widely involved in regulating anthocyanin synthesis by activating CHI and DFR, which significantly stimulates the accumulation of various pigments, such as cyanidin, delphinidin, malvidin, and pelargonidin, in petals [24]. Some MYB TFs have been shown to regulate plant organogenesis. For example, AtMYB103, WER, AtMYBGL1, and AtMYB23 play vital roles in the development of the tapetum, trichomes, and root hairs in Arabidopsis [25,26].
Currently, the functions of MYB TFs have been identified in Arabidopsis, apples, grapevine (Vitis vinifera ‘Shiraz’), and other tree species [27,28,29,30,31,32], but there are few reports on camphor trees. C. camphora is a representative species of the genus Cinnamomum in the Lauraceae family and is native to eastern Asia. It is an important native and landscaping tree species in China, with a long history of cultivation. C. camphora plays an important role in the chemical industry because it is rich in secondary metabolites. It is an economically important tree species of the Lauraceae family and is widely distributed in southern China. In 2021, a genome sequencing of C. camphora was completed [33]. As an economically important tree species, C. camphora is rich in secondary metabolites and is commonly used as a raw material in the chemical and medicinal industries [34,35,36]. With the completion of the whole genome sequencing of C. camphora and the progress of omics technology [33], the synthetic pathway of essential oils and related synthases in C. camphora, such as the terpene synthase (TPS) family and the trans-isopentenyl diphosphate synthase (TIDS) gene family, have been analyzed [37,38,39,40]. However, a study of the camphor MYB TFs (CcMYB) family has not been reported.
In this study, 121 CcMYBs were identified based on the high-quality chromosome level of the C. camphora genome sequenced previously [33], and then phylogenetic analysis was performed on them and the motif composition was analyzed. We also analyzed the exon–intron distributions and duplication events of the CcMYBs. Using RNA-seq data, we analyzed and visualized the expression profiles of CcMYBs in roots, fruits, leaves, phloem, flowers, xylem, and stems of C. camphora. In addition, combined with correlation analysis of structural genes in the flavonoid synthesis pathway, we identified some CcMYBs that may have important roles in C. camphora growth and flavonoid synthesis. The results are not only conducive to the analysis of the functions of CcMYB TFs at the genome-wide level in C. camphora but also set the stage for subsequent research on the functions of CcMYBs during the lifetime of the camphor tree.

2. Results

2.1. Identification and Classification of MYBs in C. camphora

Based on the number of CcMYB domains, twenty-one 1R-MYBs (MYB-related), ninety-six R2R3-MYBs, and four 3R-MYBs were identified, but no 4R-MYBs were found (Table 1). In all, 121 CcMYB genes were named CcMYB1 to CcMYB121 according to their location on the chromosome. The CcMYB genes encoded proteins with amino acid residues, ranging in length from 121 aa (CcMYB45) to 1121 aa (CcMYB3), with an average length of 339. The molecular weights (MWs) ranged from 12.83 kDa (CcMYB3) to 113.49 kDa (CcMYB60), with an average of 37.14 kDa. The average theoretical isoelectric point was 6.92 and ranged from 4.93 (CcMYB6) to 11.16 (CcMYB45). The instability coefficients ranged from 29.64 for CcMYB52 to 71.79 for CcMYB121. Only four proteins had instability coefficient values under 40, suggesting that most MYBs might be unstable. Grand average of hydropathicity (GRAVY) had an average value of −0.68, ranging from −0.967 (CcMYB14) to −0.334 (CcMYB82) (Table S1).

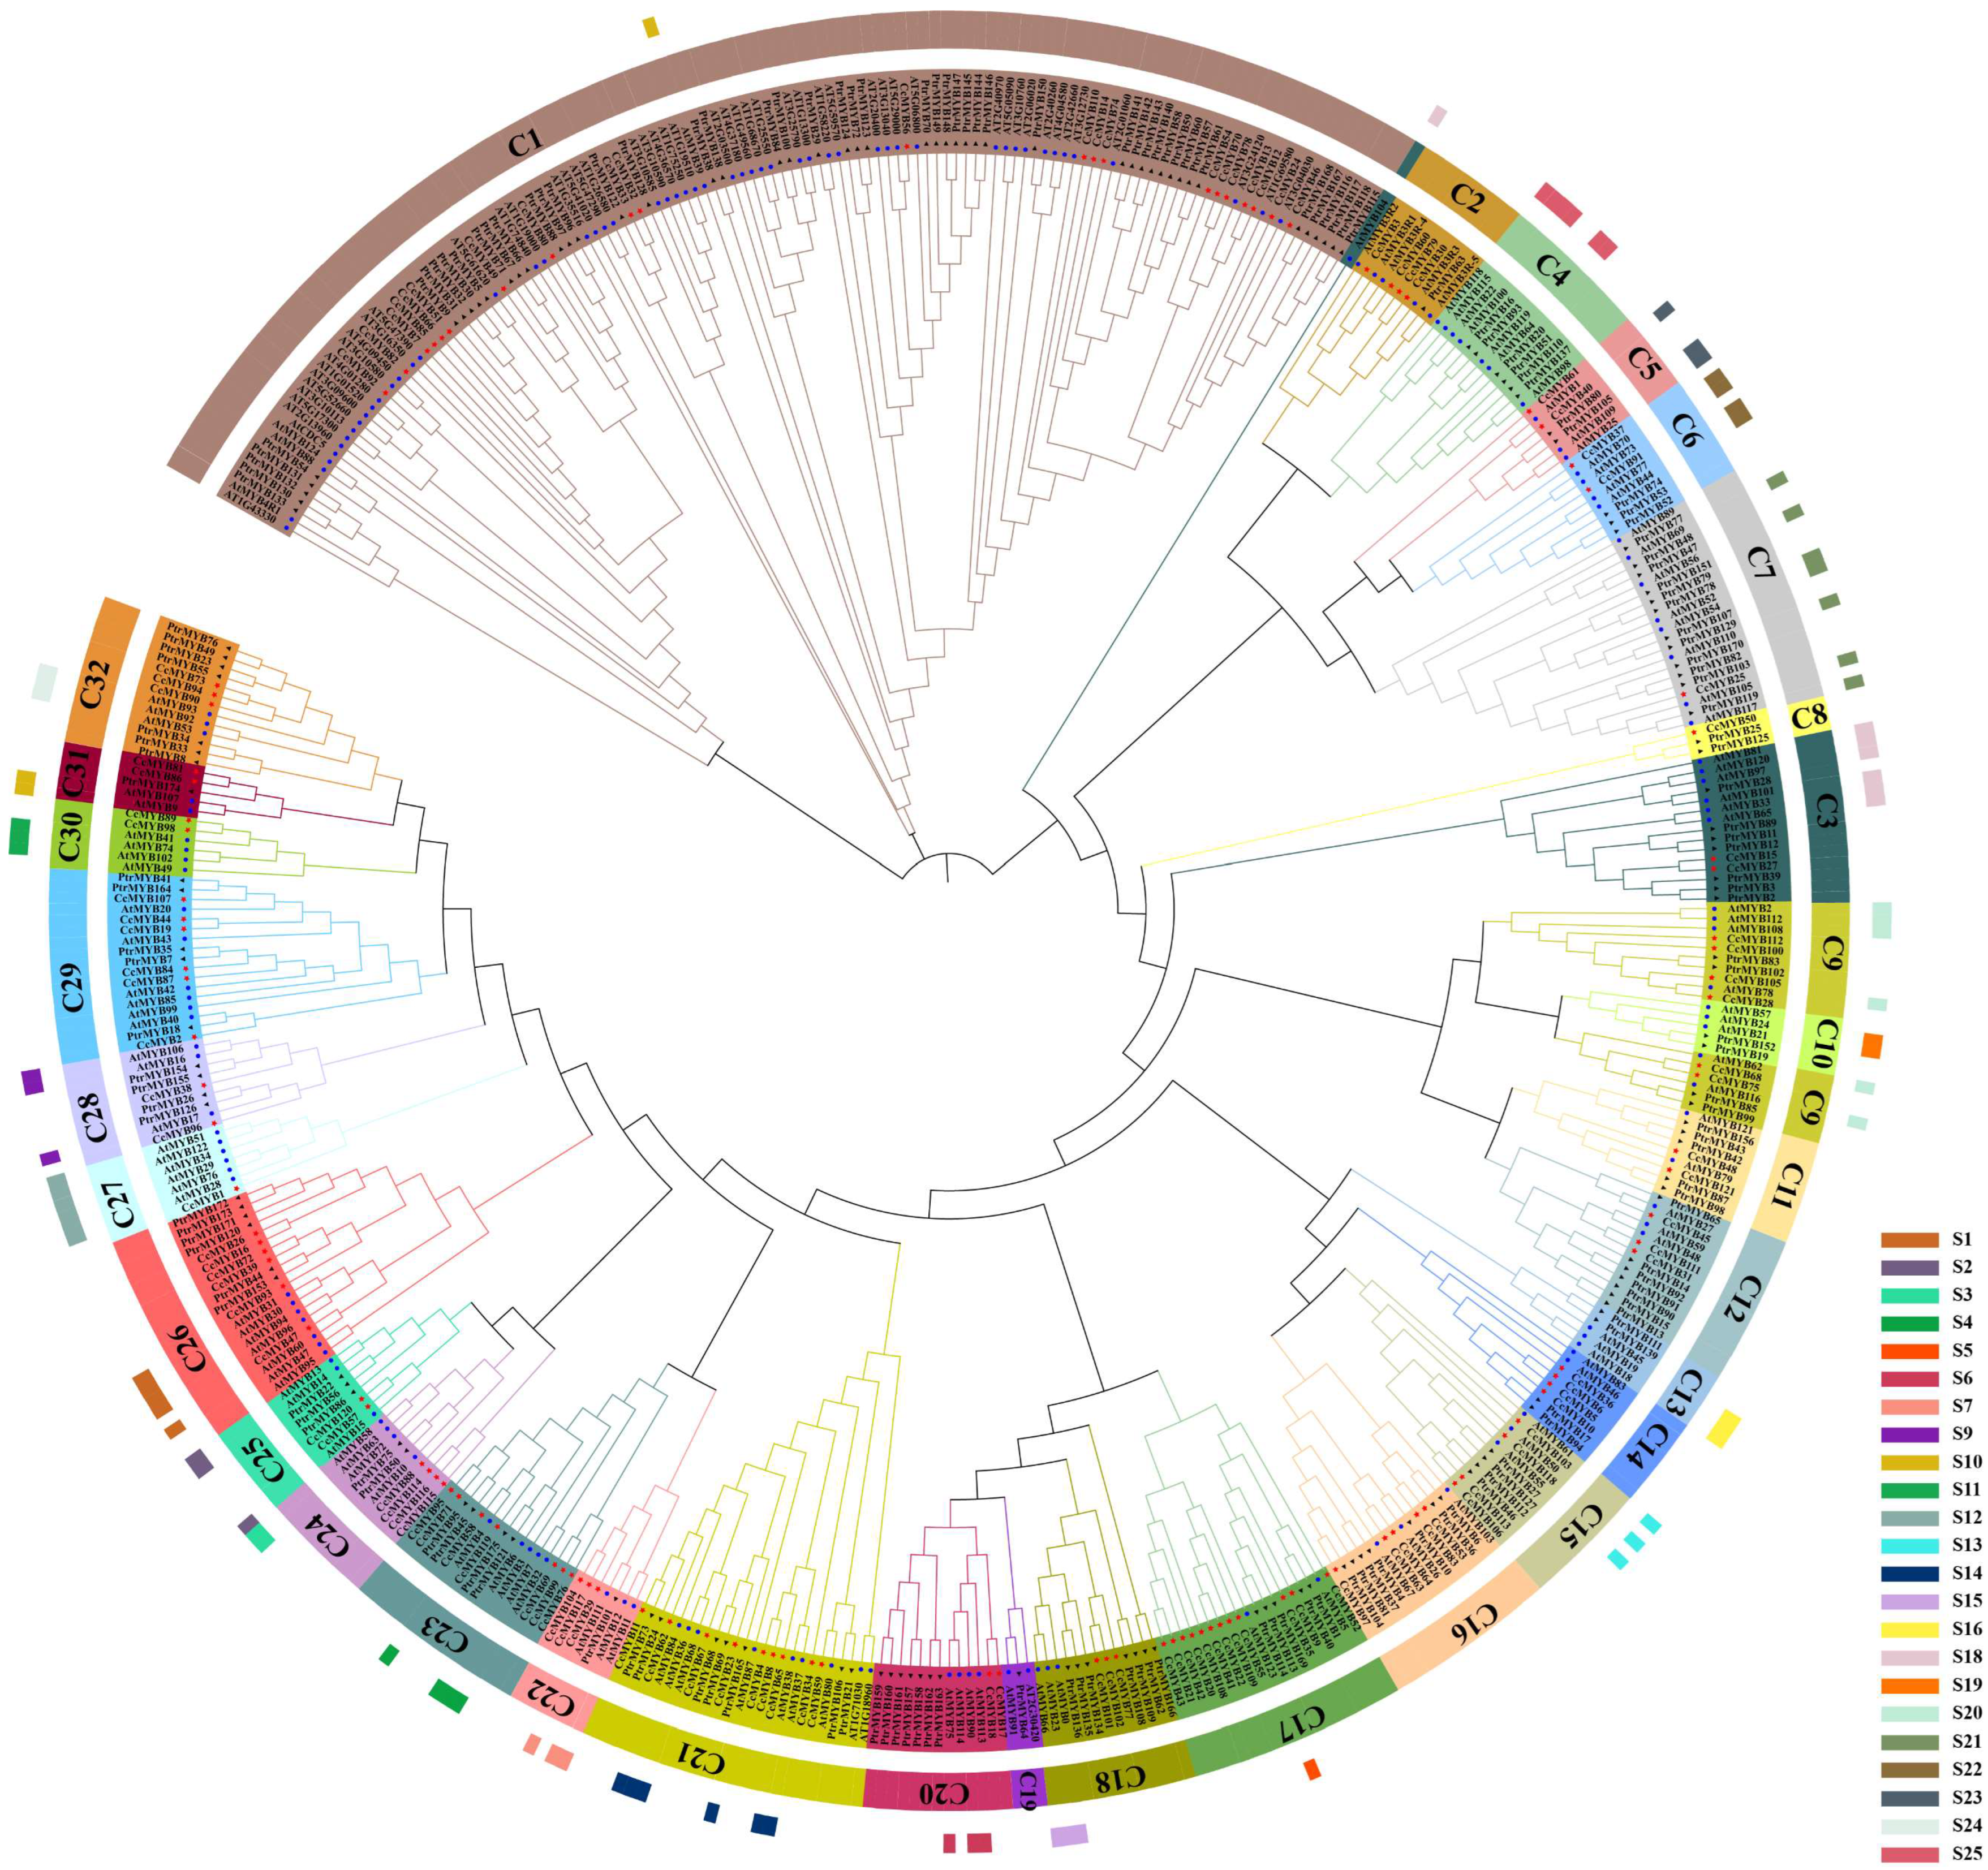
2.2. Conserved Domain and Phylogeny

In this study, the phylogenetics of CcMYBs in camphor tree was analyzed with reference to 179 A. thaliana MYBs and 175 Populus trichocarpa MYBs (Table S2). The phylogenetic tree revealed that the CcMYBs could be divided into 28 subgroups (C4, C10, C13, and C19 subgroups did not contain CcMYBs), and each subgroup contained different proportions of members (Figure 1). The C1 subgroup had the most members, with 21 CcMYBs (17.36%), followed by the subgroup C17, which had 12 CcMYBs (9.92%), but C7, C8, and C27 each contained only 1 CcMYB (0.83%). The R2R3-MYB family in Arabidopsis is divided into 23 subgroups (S) based on conserved domains and accessory motifs [41]. Through the phylogenetic relationship analysis, we found that S7, S5, and S6 subgroups were clustered with the C22, C17, and C20 subgroups of camphor trees, respectively, as shown in Figure 1.
Multiple sequence alignments of 1R-MYB, R2R3-MYB, and 3R-MYB were performed separately to characterize the DNA-binding domain of CcMYBs in camphor. The DNA-binding domains in the three CcMYB subfamilies were visualized individually using WebLogo 3 (Figure 2). The results showed that Trp (W-2) was relatively conserved, despite the large variation in the 1R-MYB amino acid residues (Figure 2A), as in previous studies [1]. In the DNA-binding domain of R2R3-MYB, there were five highly conserved Trp (W) residues (W-2, W-22, and W-42 in R2 repeats; W-81 and W-100 in R3 repeats), and the first W in R3 was often replaced by Phe (F), Ile (I), Leu (L), or Tyr (Y). In addition, some other amino acids were also relatively conserved (Figure 2B). The 3R-MYBs displayed three highly conserved and complete DNA-binding domains: R1, R2, and R3. Each R repeat contained each of the 19–20 amino acid residues, and there were 100% conserved W residues (R1: W-9, W-29, W-48; R2: W-61, W-81, W -100; R3: W-113, W-132, W-151, Figure 2C). These conserved W residues play an important role in sequence-specific DNA binding [41,42].
Based on the sequence alignment results, we analyzed and visualized the conserved motifs of CcMYBs (Figure 3A). Figure 3B shows the distribution of the CcMYB motifs. A high concordance was found within each subgroup and subfamily. Subgroup C1 was identified with the 1R-MYB subfamily; the C2 subgroup was classified as 3R-MYB, and the remaining subgroups were members of R2R3-MYB (except CcMYB65 of the C21 subgroup, which belonged to 1R-MYB). It was not difficult to find that all 121 MYB members contained motif 3. Except for 1R-MYB, which lacks motif 1, all other CcMYBs contain motif 1. Interestingly, although CcMYB65 clustered with R2R3-MYB in the C21 subgroup, it lacked motif 1 as a 1R-MYB. In 3R-MYBs, all proteins had the same motif composition and shared two motif 3. In R2R3-MYBs, all the proteins contained motifs 3, 1, and 2. Across the motif distribution of all subgroups, the auxiliary motifs in the same subgroup were relatively consistent. The similarities of these motifs in the same subgroup and the differences in different subgroups suggest that CcMYB proteins in the same subgroup have similar functions, indicating that CcMYBs have undergone duplication and fragment loss during evolution, resulting in different orientations.

2.3. Exon–Intron Structure and Cis-Elements of CcMYB Genes

To study the similarities and differences between CcMYBs in C. camphora, we studied the CcMYB structure. The exon–intron structure is shown in Figure 3C. We found that the exon–intron structure of R2R3-MYBs was relatively consistent, mostly in the form of three exons and two introns, except that CcMYB90 had seven introns, eight exons, and five MYB repeats. This is consistent with the previous results for other species [43]. However, the number of introns in the C1 subgroup was highly variable, ranging from 2 to 11, and the number of introns in the C3 subgroup was generally higher, including five or more introns.
Upstream of DNA, there are many promoters containing many cis-acting elements that are specific binding sites for regulatory proteins. We analyzed cis-elements in the promoter region located from −2000 to −1 bp upstream of the coding sequence of CcMYBs. As shown in Figure 4 and Table S4, cis-acting elements related to biological processes were screened for analysis, and these cis-acting elements were divided into 3 groups, including 19 categories according to their functions, and involving 53 cis-acting elements. The first group comprised plant development-related elements (PDE), the second group was of stress-responsive elements (SE), and the third group was of hormone-responsive elements (HE). The SE group had the largest number of cis-acting elements, with 35 cis-acting elements in seven categories. Light is essential for plant growth, and some studies have shown that it can boost flavonoid biosynthesis [30]. In this study, we found that light-responsive cis-elements were the most common type of cis-elements, with 1425 of the 121 CcMYBs, and the promoter of each CcMYB contained part of a light-responsive element or several light-responsive elements. Among these 53 cis-acting elements, the G-box, which appeared 327 times and involved 100 CcMYBs, was the most common cis-acting element.

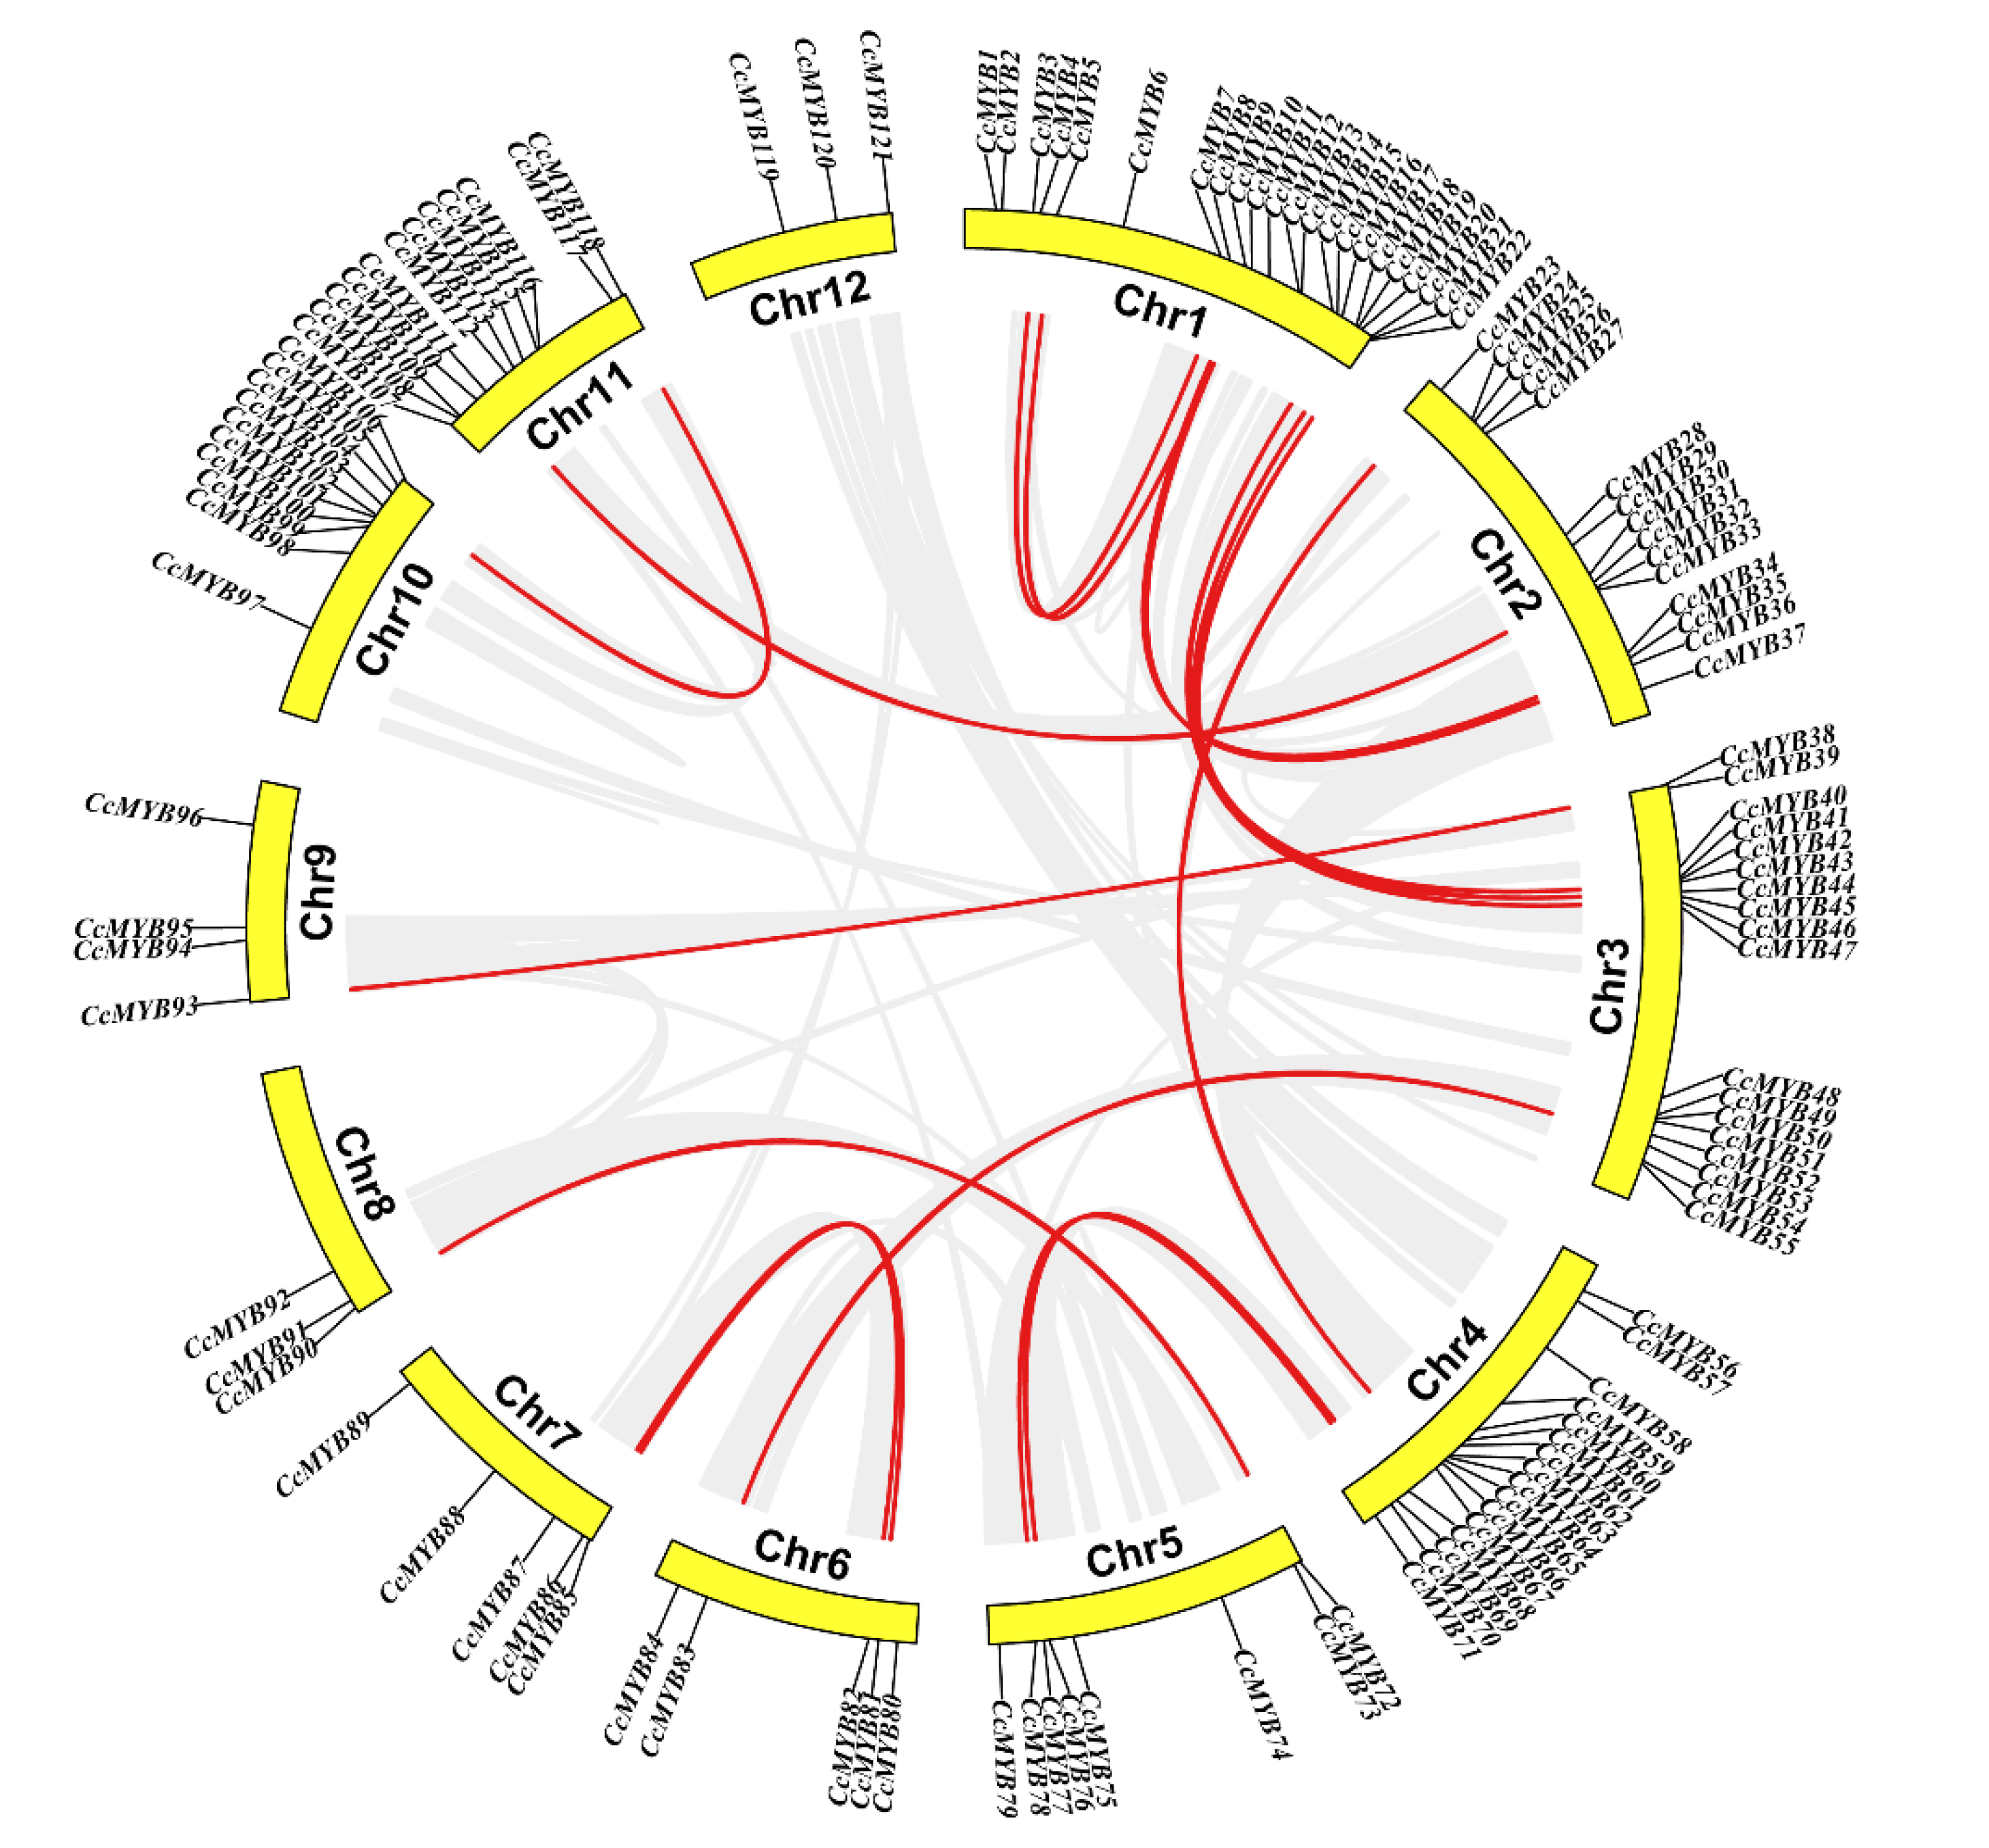
2.4. Chromosome Distribution and Collinearity of CcMYB Genes

In C. camphora, most of the CcMYB genes were located on the two ends of the 12 chromosomes, of which 121 CcMYB genes were randomly distributed (Figure 5). As many as 22 CcMYBs were distributed on chromosome 1, and the two most distant genes were more than 70 Mb apart. These 22 CcMYBs contained four 1R-MYBs, seven R2R3-MYBs, and one 3R-MYB. Among these, R2R3-MYBs involved eight subgroups, with four genes in the C17 subgroup and two genes in the C20 subgroup, which clustered with the S5 and S6 subgroups of Arabidopsis, respectively. However, chromosomes 8 and 12 had the fewest genes, with only three each.
We parsed the duplication events of the CcMYBs (Figure 5). Of these duplicated genes, only chromosome 12 had no duplicated CcMYBs, whereas chromosome 1 had the most duplicated CcMYBs, with nine different duplicated CcMYBs. According to these criteria, 18 genes involved in 35 CcMYBs (28.93%) were segmentally duplicated gene pairs. However, no tandem-duplicated genes were found, indicating that segmental duplication may be the main duplication mode of CcMYB family expansion and that some CcMYBs have undergone functional diversification and family expansion during evolution. In this study, we also calculated nonsynonymous mutations (Ka), synonymous mutations (Ks), and their ratio (Ka/Ks) to estimate selection pressure in duplicated gene pairs. The Ks value of 49 duplicated gene pairs were between 0.39 and 3.70, and the Ka/Ks ratios were between 0.04 and 0.52, which indicated that, during evolution, CcMYB duplicated gene pairs have undergone purification selection. The minimum Ks and maximum Ka/Ks were observed in the CcMYB33CcMYB60 pair, suggesting that these two genes may have undergone a more purifying selection.

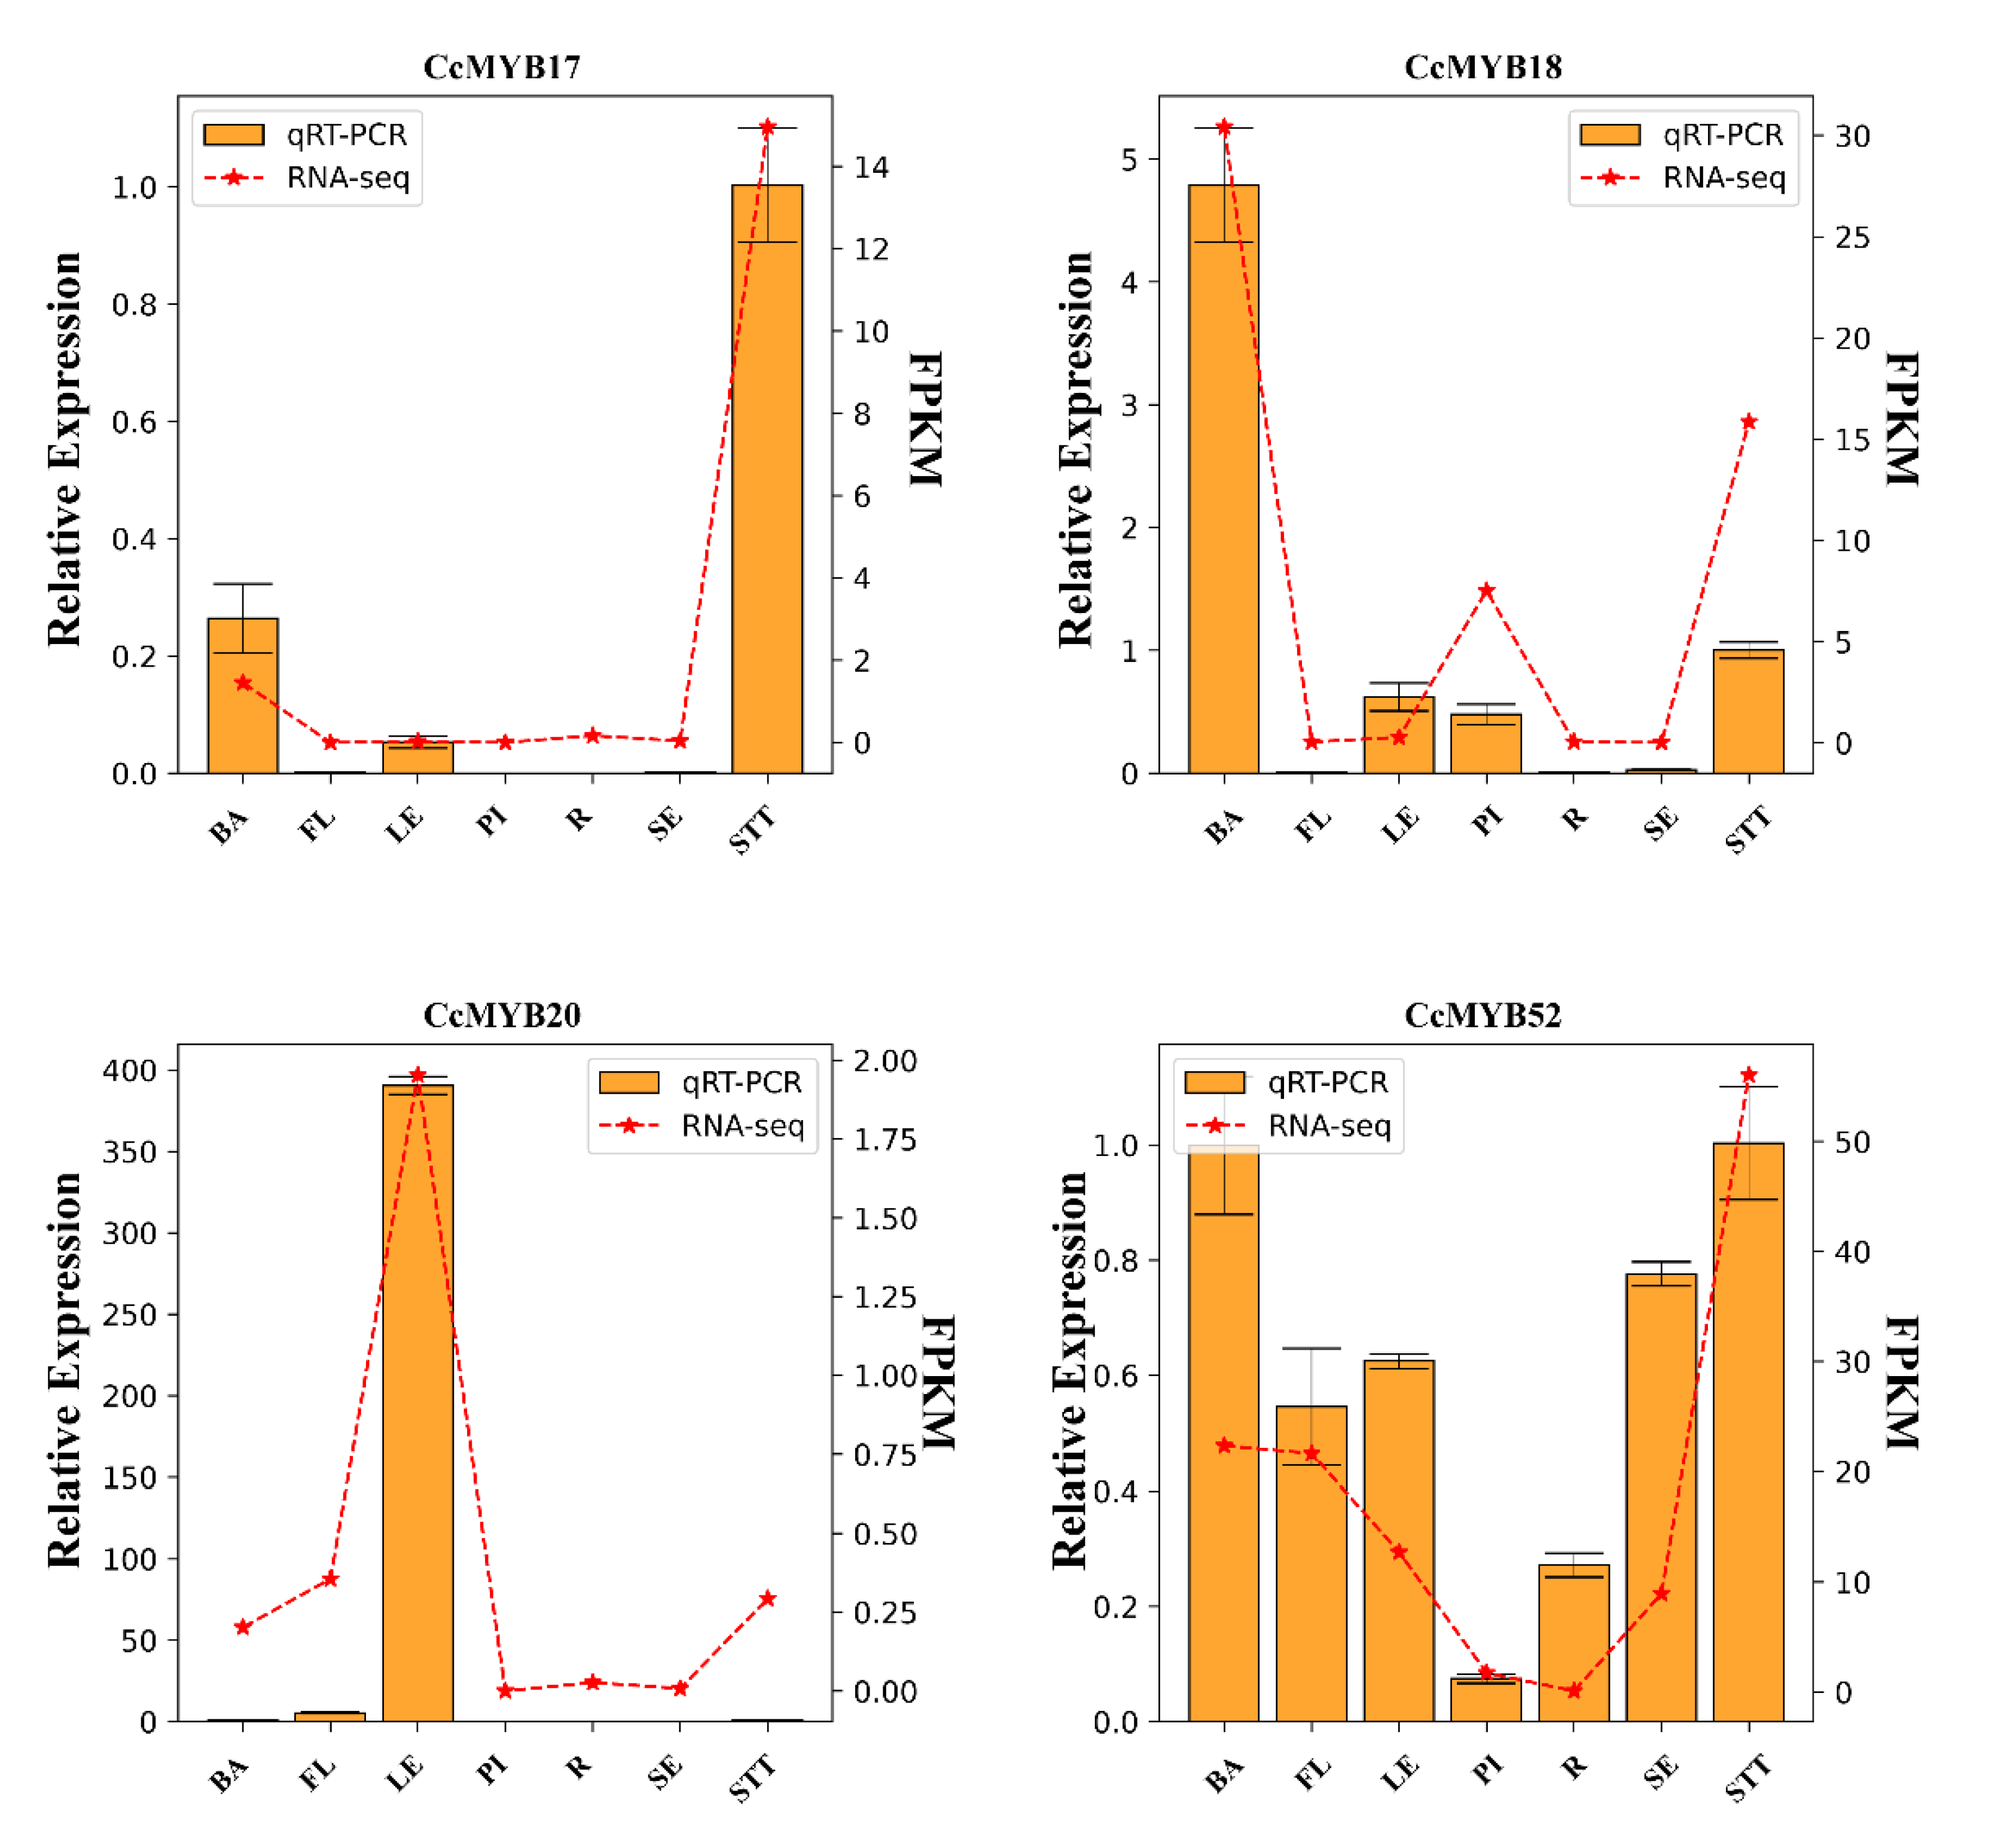
2.5. Tissue-Specific Expression Profiles

To investigate the spatial expression profiles of CcMYBs in C. camphora, we analyzed the expression of CcMYBs in the phloem (BA), flower (FL), leaf (LE), xylem (Pl), root (R), fruit (SE), and stem (STT) in ‘Gantong 1’. In the transcription data of seven tissues of C. camphora, four CcMYBs (CcMYB1, CcMYB9, CcMYB61, and CcMYB114) were not expressed in any tissue of C. camphora, which may be because they were pseudogenes or not expressed in our selected samples. The transcription levels of CcMYB37, CcMYB66, and CcMYB80 were higher in all tissues than most of the other genes (Table S3). Cluster analysis of the expressed data was performed and a heat map of CcMYB expression was generated, as shown in Figure 6. Thirty CcMYBs had higher FPKM values in the roots than in the other tested tissues, but only four CcMYBs had the highest expression levels in fruits. To explore whether CcMYBs in the C17, C20, and C22 subgroups were also tissue-specific, the expression of 16 CcMYBs were analyzed that did not count CcMYB9 because of the lack of expression in each tissue. Eight CcMYBs were found to have higher expression levels in the stem than in other tissues, and there were two CcMYBs with the highest expression in the phloem, suggesting that C. camphora flavonoids may mainly accumulate in the bark.
Expression correlation analysis of 16 CcMYBs in the C17, C20, and C22 subgroups showed that these CcMYBs were significantly associated with structural genes involved in flavonoid synthesis (Figure 7). CcMYB21 and CcMYB52 were significantly associated with the majority of structural genes in this pathway. Some genes, such as CcMYB21, CcMYB43, and CcMYB52, were significantly correlated with the DFR and LDOX, which are the late biosynthetic genes (LBGs) of the anthocyanin synthesis pathway. Four CcMYBs were selected to study their expression profiles in seven different tissues by quantitative real-time PCR (Figure 8). The results showed that their expression profiles were consistent with transcriptome data and showed notable tissue specificity. Quantitative data showed that these CcMYBs were markedly downregulated in the flowers, xylem, and roots. The expression levels of CcMYB20 were higher in the leaves than in the other six tested tissues and were hardly expressed in the seeds and xylem, while other CcMYBs had a relatively high expression in the stems of C. camphora.

3. Discussion

The MYB transcription factor family is a protein superfamily with a large number of members and diverse functions. Based on the whole genome, ninety-six R2R3-MYBs, twenty-one 1R-MYBs, and four 3R-MYBs were identified and no 4R-MYBs were identified. The different amounts of CcMYBs of the same species identified in other studies can be attributed to advancements in technology and different identification standards; however, the fact that R2R3-MYB dominates the plant MYB family has not changed. In contrast, the proportions of 3R-MYB and 4R-MYB were previously found to be very small; the same results were obtained in this study. Further research on the DNA-binding domain of R2R3-MYB found that there were five highly conserved Trp (W) residues but the first W in R3 was often replaced by Phe (F), Ile (I), Leu (L), or Tyr (Y) and some other amino acids were also relatively conserved, suggesting that the repeats of the DNA-binding domains of 121 CcMYBs shared characteristics with those of the other species [43,44], while there were nine 100% conserved W residues in 3R-MYB. The auxiliary motifs of MYB TFs are also important features for MYB classification [41,45]. A previous report study has put forward insight on the composition and evolutionary history of plant R2R3-MYBs based on the analysis of multiple levels and aspects, such as auxiliary motifs and phylogenetic analysis [46]. In this study, across the motif distribution of all subgroups, the characteristics of auxiliary motifs suggest that CcMYB proteins in the same subgroup have similar functions, indicating that CcMYBs have undergone duplication and fragment loss during evolution, resulting in different orientations. Chromosome mapping showed that 121 CcMYBs were unevenly distributed on 12 chromosomes. Tandem and segmental duplication events are thought to be the main reasons for the expansion of gene families in the genome [47]. A previous report found that C. camphora has undergone two genome-wide duplication events, and 1110 gene families have expanded [33]. As suggested in another previous report on analyzing the duplication events of genes in camphor trees, both of the two duplication events promoted the expansion of the TPS gene family in the C. camphora genome significantly [33,48]. Therefore, we explored duplication events in the CcMYB gene family. Segmental duplication events occurred in 18 gene pairs on 11 chromosomes. Similarly, many segmental duplication events occurred in potato (Solanum tuberosum L.), Pistacia chinensis, poplar, and other species [46,49,50,51], implying that segmental duplication events may be vital factors in the expansion of the MYB TF family.
The R2R3-MYB of Arabidopsis was divided into 23 subgroups according to the auxiliary motif [41]. It is well known that there are large differences between herbaceous and woody plants during the evolutionary process, but only a few herbaceous species have been compared in previous studies. In addition, there were some MYB genes that had not been classified, so this classification method is not universal, and there is no unified classification method for R2R3-MYB [46,52,53]. Referring to the grouping of Arabidopsis and poplar, MYBs were roughly divided into 32 subgroups according to the protein sequence alignment results, of which four subgroups did not contain CcMYBs. In this study, we also classified some genes that were not grouped in previous reports according to their later reported functions. It has been reported that AtMYB5, which may be homologous to TT2 (AtMYB123) in terms of function, can also form MBW complexes with bHLH and WD40 [54], so we combined TT2 and AtMYB5 into one group. Although we did not further the understanding of group 1R-MYB, there have been reports on the classification of 1R-MYB [31]. As shown in Figure 2, gene structures and conserved motifs of CcMYBs in the same subgroup were mostly similar, which strongly confirmed the reliability of our classification of CcMYBs.
There is ample evidence proving that MYB TFs play a crucial role in the direct or indirect response to stress. AtMYB72 affects signaling pathways induced by these beneficial microorganisms [55]. AtMYB15 is involved in the cold regulation of C-repeat binding transcription factor genes and in the development of freezing tolerance [56]. To date, some studies have focused on the functions of MYBs in flavonoid synthesis because flavonoids are widely involved in abiotic stress and floral pigmentation in higher plants. Interestingly, in this work, it was found that the C22, C17, and C20 subgroups of the camphor tree clustered together with S7, S5, and S6 subgroups in A. thaliana, respectively. It has been confirmed that S7 increases flavonoid biosynthesis in Arabidopsis [40], S5 regulates pro-anthocyanidin synthesis in the seed coat [41], and S6 regulates anthocyanin biosynthesis [42]. In addition, the results of the correlation analysis between 16 CcMYBs, including CcMYB17 and CcMYB18, and structural genes in the flavonoid biosynthesis pathway revealed that they were significantly correlated. F3H, F3’5’H, and F3’H lead to the synthesis of different anthocyanins, which are catalyzed by DFR and ANS (anthocyanidin synthase)/LDOX, resulting in the formation of pelargonidin, cyanidin, and delphinidin, respectively [57,58]. Moreover, correlation analysis showed that some of these 16 genes were significantly correlated with DFR and LDOX (Figure 8). Sequence alignment analysis revealed that the R3 structures of the 16 CcMYBs, except for the C22 subgroup (which clustered a branch with the Arabidopsis S7 subgroup), contained the motif LX2X3LX6LX3R (CcMYB20 and CcMYB22 were incompletely consistent) [59], which can bind to bHLH (Figure 9). This observation is consistent with findings in Arabidopsis, suggesting that these genes have the potential to form MBW complexes [54] (Figure 3). Four genes (CcMYB17, CcMYB18, CcMYB20, and CcMYB52) were selected for real-time quantification in different tissues, and the results showed significant differential tissue expression. Some MYBs in Hypericum perforatum, Dendrobium catenatum, and tea plants (Camellia sinensis) showed similar results [60,61,62]. Although the expression patterns of these genes are different, they all seem to have relatively high expression in the phloem and stem, which is mutually confirmed by the previous results that the stem of ‘Gantong 1′ is red and the bark of cinnamon has a unique scent [63,64]. In addition, MYB TFs are useful for plant development, cell shape, and tissue morphogenesis [26,65].
This study revealed the basic characteristics of the CcMYB gene family and predicted the related CcMYBs that may regulate the flavonoid synthesis pathway, which provides valuable information for studying the synthesis of secondary metabolites and the growth and development of C. camphora.

4. Materials and Methods

4.1. Plant Materials

A 3-year-old clonal cutting seedling of ‘Gantong 1′, which is a new national plant variety of camphor tree cultivated by the Jiangxi Academy of Sciences, was used as the experimental material. Compared with common camphor, the content of anthocyanins, such as pelargonidin, cyanidin, and peonidin, in ‘Gantong 1’ demonstrated a prominent increase [63]. All the materials were planted in Huangma Township, Nanchang City, Jiangxi Province, China. Roots, flowers, phloem, leaves, xylem, and stem were collected in April 2020, whereas fruits were collected in November 2020 for a total of seven tissues. Three biological replicates were used for each experiment.

4.2. Bioinformatics Analysis of MYB Transcription Factor Genes in C. comphora

The MYB domain seed file (PF00249) was downloaded from the Pfam 31.0 database, then HMMER 3.2.1 software was used to create a profile hidden Markov model (HMM), before the candidate MYB protein sequence of C. camphora was obtained [66,67]. Based on the genome data of C. camphora published previously, the MYB domains of candidate C. camphora were checked by setting an E value ≤ 1 × 10⁻¹⁰, alignment length >100, and alignment rate >50%. After excluding redundant sequences and incomplete sequences, NCBI-Conserved Domain Data (CDD) and SMRT online websites were used to screen out MYB members in C. camphora.
Amino acid residues, molecular weight (MW), isoelectric point (PI), stability coefficient, and grand average of hydropathicity (GRAVY) of MYB protein in C. camphora were identified using the ProtParam tool on the ExPASy online website [68].
The MYB protein sequences of A. thaliana and poplar were queried from the TAIR and JGI databases, respectively. MYB proteins in C. camphora and P. trichocarpa were named according to their chromosomal locations, whereas those in Arabidopsis were named according to the TAIR database. The conserved domains of MYB proteins from C. camphora, Arabidopsis, and P. trichocarpa were aligned multiple times with ClustalW. Phylogenetic trees were constructed using the neighbor-joining method of MEGA X. Using the bootstrap test method, the number of replicates was set to 1000 [69]. The phylogenetic tree was annotated and visualized using the ITOL v6.6 online tool.
Python was used to analyze the exon–intron of the gene structure, and TBtools v1.0987663 was used to visualize it [70]. The cis-acting elements of the CcMYB promoter region were analyzed using the PlantCare website.
The conserved motifs of CcMYB were analyzed according to their amino acid sequences using the MEME program. The motif site distribution in the sequences was 0 or 1 per sequence. The number of motifs was set to 15, and the width ranged from six to 50 amino acids. Only the motif with an E < 0.05 was retained for further analysis. The results were visualized and enhanced using TBTools. The amino acid sequences of R1, R2, and R3 repeats in CcMYB were extracted, and ClustalW was used for multiple sequence alignment. Sequence logos were generated using WebLogo3 [71].
TBtools were used to construct a Circos map that displays the relationship between chromosomes and the position and relative distance of genes on chromosomes. Confirmation of CcMYB gene duplication was based on two criteria: (a) the length of the shorter sequence exceeding 70% of the longer sequence, and (b) the similarity between the two aligned sequences being greater than 70% [71,72]. All CcMYBs with duplicated segments were selected to generate a resonance map with putative duplicated gene pairs connected by connecting lines.
The paralogous gene pair of C. camphora was defined as a sequence length >300 bp and homology ≥50%. The amino acid sequences of these gene pairs were aligned using Clustal W. Ks and Ka substitution rates were calculated using the aligned file and corresponding coding nucleotide sequences using the PAL2NAL program [73].

4.3. Gene Expression Analysis

We analyzed the expression profiles of CcMYBs in different tissues of C. camphora using transcriptome data. Transcriptome data of all seven C. camphora tissues were obtained from our laboratory and uploaded to the NCBI database [33]. FPKM for each gene was calculated based on the length of the gene and mapped to the read count for that gene. The expression data of CcMYBs in seven C. camphora tissues were extracted and analyzed using Python.
Total RNA was extracted according to the instructions of the RNAprep Pure Plant Plus Kit (polysaccharides and polyphenolics-rich) (Tiangen Biotech, Beijing, China). RNA degradation and contamination were monitored on a 1% agarose gel. Total RNA was reverse-transcribed using a 5× PrimeScript RT Master Mix (TaKaRa). Quantitative primers for the selected CcMYB gene were designed using Beacon Designer 8 software (Table S1). Semi-quantitative PCR experiments were performed to verify the primer specificity. The fluorescent dye used in the real-time quantitative experiment was PowerUpTM SYBRTM Green Master Mix (TaKaRa), and analysis was performed using the Applied Biosystems ViiA 7 system. CcActin was used as the reference gene for qRT-PCR. The relative expression levels of the CcMYBs were calculated using the 2−ΔΔct method and TBtools was used to construct a heatmap to visualize the results. Statistical differences were determined by one-way ANOVA variance using Python.

Supplementary Materials

The following supporting information can be downloaded at: https://www.mdpi.com/article/10.3390/ijms232214279/s1.

Author Contributions

Conceptualization, M.X. (Meng Xu), Y.Z., C.C. and M.X. (Mengli Xi); methodology, X.L.; software, W.X.; validation, X.L. and J.Z.; formal analysis, X.L. and W.X.; data curation, T.S.; writing—original draft preparation, X.L.; writing—review and editing, M.X. (Meng Xu) and Y.Z.; visualization, X.L. and W.X.; supervision, M.X. (Meng Xu), Y.Z. and M.X. (Mengli Xi); project administration, M.X. (Meng Xu); funding acquisition, Y.Z., C.C. and M.X. (Mengli Xi). All authors have read and agreed to the published version of the manuscript.

Funding

This research was funded by the National Natural Science Foundation of China (Nos. 32060354, 31860079, and 32160397), the Opening Fund of the Key Laboratory of Horticultural Plant Genetic and Improvement of Jiangxi Province (2021KFJJ005), the Key R&D Project of Jiangxi Academy of Sciences (2021YSBG22015), and the Key Industrial Technology Research Project of Jiangxi Academy of Sciences (2021YSBG10002).

Institutional Review Board Statement

Not applicable.

Informed Consent Statement

Not applicable.

Data Availability Statement

All the data are shown in the main manuscript and in the Supplementary Materials.

Acknowledgments

We would like to thank Key Laboratory of Horticultural Plant Genetics and Improvement of Jiangxi Province for their support to the research.

Conflicts of Interest

The authors declare no conflict of interest.

References

  1. Dubos, C.; Stracke, R.; Grotewold, E.; Weisshaar, B.; Martin, C.; Lepiniec, L. MYB transcription factors in Arabidopsis. Trends Plant Sci. 2010, 15, 573–581. [Google Scholar] [CrossRef]
  2. Rosinski, J.A.; Atchley, W.R. Molecular Evolution of the Myb Family of Transcription Factors: Evidence for Polyphyletic Origin. J. Mol. Evol. 1998, 46, 74–83. [Google Scholar] [CrossRef]
  3. Kuno, N.; Møller, S.G.; Shinomura, T.; Xu, X.; Chua, N.H.; Furuya, M. The novel MYB protein EARLY-PHYTOCHROME-RESPONSIVE1 is a component of a slave circadian oscillator in Arabidopsis. Plant Cell 2003, 15, 2476–2488. [Google Scholar] [CrossRef] [Green Version]
  4. Ramalingam, A.; Kudapa, H.; Pazhamala, L.T.; Garg, V.; Varshney, R.K. Gene Expression and Yeast Two-Hybrid Studies of 1R-MYB Transcription Factor Mediating Drought Stress Response in Chickpea (Cicer arietinum L.). Front. Plant Sci. 2015, 6, 1117. [Google Scholar] [CrossRef] [Green Version]
  5. Roy, S. Function of MYB domain transcription factors in abiotic stress and epigenetic control of stress response in plant genome. Plant Signal. Behav. 2016, 11, e1117723. [Google Scholar] [CrossRef] [Green Version]
  6. Jiang, W.; Liu, T.; Nan, W.; Diddugodage, C.J.; Niu, Y.; Li, C.; Wang, Y.; Shi, X.; Wang, C.; Wang, J.; et al. Two transcription factors TaPpm1 and TaPpb1 co-regulate anthocyanin biosynthesis in purple pericarps of wheat. J. Exp. Bot. 2018, 69, 2555–2567. [Google Scholar] [CrossRef] [Green Version]
  7. Marie, A.M.; Komivi, D.; Linhai, W.; Rong, Z.; Yanyan, W.; Ndiaga, C.; Mame, O.S.; Zhang, X. Functional Characterization of the Versatile MYB Gene Family Uncovered Their Important Roles in Plant Development and Responses to Drought and Waterlogging in Sesame. Genes 2017, 8, 362. [Google Scholar] [CrossRef] [Green Version]
  8. Peter, S.M.; Konrad, W.; Birthe, B.K.; Meike, B. Specificity of MYB interactions relies on motifs in ordered and disordered contexts. Nucleic Acids Res. 2019, 47, 9592–9608. [Google Scholar] [CrossRef] [Green Version]
  9. Yanhui, C.; Xiaoyuan, Y.; Kun, H.; Meihua, L.; Jigang, L.; Zhaofeng, G.; Zhiqiang, L.; Yunfei, Z.; Xiaoxiao, W.; Xiaoming, Q.; et al. The MYB transcription factor superfamily of Arabidopsis : Expression analysis and phylogenetic comparison with the rice MYB family. Plant Mol. Biol. 2006, 60, 107–124. [Google Scholar] [CrossRef]
  10. Thiedig, K.; Weisshaar, B.; Stracke, R. Functional and evolutionary analysis of the Arabidopsis 4R-MYB protein SNAPc4 as part of the SNAP complex. Plant Physiol. 2021, 185, 1002–1020. [Google Scholar] [CrossRef]
  11. Wong, M.W.; Henry, R.W.; Ma, B.; Kobayashi, R.; Klages, N.; Matthias, P.; Strubin, M.; Hernandez, N. The large subunit of basal transcription factor SNAPc is a Myb domain protein that interacts with Oct-1. Mol. Cell. Biol. 1998, 18, 368–377. [Google Scholar] [CrossRef] [Green Version]
  12. Li, C.; Harding, G.A.; Parise, J.; McNamara-Schroeder, K.J.; Stumph, W.E. Architectural arrangement of cloned proximal sequence element-binding protein subunits on Drosophila U1 and U6 snRNA gene promoters. Mol. Cell. Biol. 2004, 24, 1897–1906. [Google Scholar] [CrossRef] [PubMed] [Green Version]
  13. Riechmann, J.L.; Ratcliffe, O.J. A genomic perspective on plant transcription factors. Curr. Opin. Plant Biol. 2000, 3, 423–434. [Google Scholar] [CrossRef]
  14. Ito, M.; Araki, S.; Matsunaga, S.; Itoh, T.; Nishihama, R.; Machida, Y.; Doonan, J.H.; Watanabe, A. G2/M-phase-specific transcription during the plant cell cycle is mediated by c-Myb-like transcription factors. Plant Cell 2001, 13, 1891–1905. [Google Scholar] [CrossRef] [PubMed] [Green Version]
  15. Raffaele, S.; Rivas, S. Regulate and be regulated: Integration of defense and other signals by the AtMYB30 transcription factor. Front. Plant Sci. 2013, 4, 98. [Google Scholar] [CrossRef] [Green Version]
  16. Oh, J.E.; Kwon, Y.; Kim, J.H.; Noh, H.; Hong, S.-W.; Lee, H. A dual role for MYB60 in stomatal regulation and root growth of Arabidopsis thaliana under drought stress. Plant Mol. Biol. 2011, 77, 91–103. [Google Scholar] [CrossRef]
  17. Jung, C.; Seo, J.S.; Han, S.W.; Koo, Y.J.; Kim, C.H.; Song, S.I.; Nahm, B.H.; Choi, Y.D.; Cheong, J.J. Overexpression of AtMYB44 Enhances Stomatal Closure to Confer Abiotic Stress Tolerance in Transgenic Arabidopsis. Plant Physiol. 2008, 146, 323–324. [Google Scholar] [CrossRef] [PubMed] [Green Version]
  18. Seo, P.J.; Xiang, F.; Qiao, M.; Park, J.-Y.; Lee, Y.N.; Kim, S.-G.; Lee, Y.-H.; Park, W.J.; Park, C.-M. The MYB96 Transcription Factor Mediates Abscisic Acid Signaling during Drought Stress Response in Arabidopsis. Plant Physiol. 2009, 151, 275–289. [Google Scholar] [CrossRef] [Green Version]
  19. Jiang, L.; Zhang, D.; Liu, C.; Shen, W.; He, J.; Yue, Q.; Niu, C.; Yang, F.; Li, X.; Shen, X.; et al. MdGH3.6 is targeted by MdMYB94 and plays a negative role in apple water-deficit stress tolerance. Plant J. 2022, 109, 1271–1289. [Google Scholar] [CrossRef] [PubMed]
  20. Xu, P.; Marsafari, M.; Zha, J.; Koffas, M. Microbial Coculture for Flavonoid Synthesis. Trends Biotechnol. 2020, 38, 686–688. [Google Scholar] [CrossRef]
  21. Elomaa, P.; Uimari, A.; Mehto, M.; Albert, V.A.; Laitinen, R.A.E.; Teeri, T.H. Activation of Anthocyanin Biosynthesis in Gerbera hybrida (Asteraceae) Suggests Conserved Protein-Protein and Protein-Promoter Interactions between the Anciently Diverged Monocots and Eudicots. Plant Physiol. 2003, 133, 1831–1842. [Google Scholar] [CrossRef] [PubMed] [Green Version]
  22. Laitinen, R.A.E.; Ainasoja, M.; Broholm, S.K.; Teeri, T.H.; Elomaa, P. Identification of target genes for a MYB-type anthocyanin regulator in Gerbera hybrida. J. Exp. Bot. 2008, 59, 3691–3703. [Google Scholar] [CrossRef] [PubMed] [Green Version]
  23. Nakatsuka, T.; Haruta, K.S.; Pitaksutheepong, C.; Abe, Y.; Kakizaki, Y.; Yamamoto, K.; Shimada, N.; Yamamura, S.; Nishihara, M. Identification and Characterization of R2R3-MYB and bHLH Transcription Factors Regulating Anthocyanin Biosynthesis in Gentian Flowers. Plant Cell Physiol. 2008, 49, 1818–1829. [Google Scholar] [CrossRef] [PubMed] [Green Version]
  24. Chiou, C.-Y.; Yeh, K.-W. Differential expression of MYB gene (OgMYB1) determines color patterning in floral tissue of Oncidium Gower Ramsey. Plant Mol. Biol. 2008, 66, 379–388. [Google Scholar] [CrossRef] [PubMed]
  25. Higginson, T.; Li, S.F.; Parish, R.W. AtMYB103 regulates tapetum and trichome development in Arabidopsis thaliana. Plant J. 2003, 35, 177–192. [Google Scholar] [CrossRef]
  26. Tominaga, R.; Iwata, M.; Okada, K.; Wada, T. Functional Analysis of the Epidermal-Specific MYB Genes CAPRICE and WEREWOLF in Arabidopsis. Plant Cell 2007, 19, 2264–2277. [Google Scholar] [CrossRef] [Green Version]
  27. Stracke, R.; Jahns, O.; Keck, M.; Tohge, T.; Niehaus, K.; Fernie, A.R.; Weisshaar, B. Analysis of production of flavonol glycosides-dependent flavonol glycoside accumulation in Arabidopsis thaliana plants reveals MYB11-, MYB12- and MYB111-independent flavonol glycoside accumulation. New Phytol. 2010, 188, 985–1000. [Google Scholar] [CrossRef] [PubMed]
  28. Wang, N.; Xu, H.; Jiang, S.; Zhang, Z.; Lu, N.; Qiu, H.; Qu, C.; Wang, Y.; Wu, S.; Chen, X. MYB12 and MYB22 play essential roles in proanthocyanidin and flavonol synthesis in red-fleshed apple (Malus sieversii f. niedzwetzkyana). Plant J. 2017, 90, 276–292. [Google Scholar] [CrossRef] [PubMed] [Green Version]
  29. Czemmel, S.; Stracke, R.; Weisshaar, B.; Cordon, N.; Harris, N.N.; Walker, A.R.; Robinson, S.P.; Bogs, J. The Grapevine R2R3-MYB Transcription Factor VvMYBF1 Regulates Flavonol Synthesis in Developing Grape Berries. Plant Physiol. 2009, 151, 1513–1530. [Google Scholar] [CrossRef] [PubMed] [Green Version]
  30. Wang, Y.; Gao, L.; Shan, Y.; Liu, Y.; Tian, Y.; Xia, T. Influence of shade on flavonoid biosynthesis in tea (Camellia sinensis (L.) O. Kuntze). Sci. Hortic. 2012, 141, 7–16. [Google Scholar] [CrossRef]
  31. Yang, X.; Guo, T.; Li, J.; Chen, Z.; Guo, B.; An, X. Genome-wide analysis of the MYB-related transcription factor family and associated responses to abiotic stressors in Populus. Int. J. Biol. Macromol. 2021, 191, 359–376. [Google Scholar] [CrossRef]
  32. MacMillan, C.P.; Birke, H.; Chuah, A.; Brill, E.; Tsuji, Y.; Ralph, J.; Dennis, E.S.; Llewellyn, D.; Pettolino, F.A. Tissue and cell-specific transcriptomes in cotton reveal the subtleties of gene regulation underlying the diversity of plant secondary cell walls. BMC Genom. 2017, 18, 539. [Google Scholar] [CrossRef] [PubMed] [Green Version]
  33. Shen, T.F.; Qi, H.R.; Luan, X.Y.; Xu, W.L.; Yu, F.X.; Zhong, Y.D.; Xu, M. The chromosome-level genome sequence of the camphor tree provides insights into Lauraceae evolution and terpene biosynthesis. Plant Biotechnol. J. 2022, 20, 244–246. [Google Scholar] [CrossRef] [PubMed]
  34. Chen, J.; Tang, C.; Zhang, R.; Ye, S.; Zhao, Z.; Huang, Y.; Xu, X.; Lan, W.; Yang, D. Metabolomics analysis to evaluate the antibacterial activity of the essential oil from the leaves of Cinnamomum camphora (Linn.). Presl. J. Ethnopharmacol. 2020, 253, 112652. [Google Scholar] [CrossRef]
  35. Singh, R.; Jawaid, T. Cinnamomum camphora (Kapur): Review. Pharmacogn. J. 2012, 4, 1–5. [Google Scholar] [CrossRef] [Green Version]
  36. Zhou, Y.; Yan, W. Conservation and applications of camphor tree (Cinnamomum camphora) in China: Ethnobotany and genetic resources. Genet. Resour. Crop Evol. 2016, 63, 1049–1061. [Google Scholar] [CrossRef]
  37. Hou, J.; Zhang, J.; Zhang, B.; Jin, X.; Zhang, H.; Jin, Z. Transcriptional Analysis of Metabolic Pathways and Regulatory Mechanisms of Essential Oil Biosynthesis in the Leaves of Cinnamomum camphora (L.). Presl. Front. Genet. 2020, 11, 598714. [Google Scholar] [CrossRef] [PubMed]
  38. Chen, C.; Zheng, Y.; Zhong, Y.; Wu, Y.; Li, Z.; Xu, L.-A.; Xu, M. Transcriptome analysis and identification of genes related to terpenoid biosynthesis in Cinnamomum camphora. BMC Genom. 2018, 19, 550. [Google Scholar] [CrossRef] [PubMed] [Green Version]
  39. Yang, Z.; Xie, C.; Huang, Y.; An, W.; Liu, S.; Huang, S.; Zheng, X. Metabolism and transcriptome profiling provides insight into the genes and transcription factors involved in monoterpene biosynthesis of borneol chemotype of Cinnamomum camphora induced by mechanical damage. PeerJ 2021, 9, e11465. [Google Scholar] [CrossRef] [PubMed]
  40. Yang, Z.; Xie, C.; Zhan, T.; Li, L.; Liu, S.; Huang, Y.; An, W.; Zheng, X.; Huang, S. Genome-Wide Identification and Functional Characterization of the Trans-Isopentenyl Diphosphate Synthases Gene Family in Cinnamomum camphora. Front. Plant Sci. 2021, 12, 708697. [Google Scholar] [CrossRef] [PubMed]
  41. Ralf, S.; Martin, W.; Bernd, W. The R2R3-MYB gene family in Arabidopsis thaliana. Curr. Opin. Plant Biol. 2001, 4, 447–456. [Google Scholar] [CrossRef]
  42. Wilkins, O.; Nahal, H.; Foong, J.; Provart, N.J.; Campbell, M.M. Expansion and Diversification of the Populus R2R3-MYB Family of Transcription Factors. Plant Physiol. 2009, 149, 981–993. [Google Scholar] [CrossRef] [Green Version]
  43. Zhou, F.; Chen, Y.; Wu, H.; Yin, T. Genome-Wide Comparative Analysis of R2R3 MYB Gene Family in Populus and Salix and Identification of Male Flower Bud Development-Related Genes. Front. Plant Sci. 2021, 12, 721558. [Google Scholar] [CrossRef] [PubMed]
  44. He, Q.; Jones, D.C.; Li, W.; Xie, F.; Ma, J.; Sun, R.; Wang, Q.; Zhu, S.; Zhang, B. Genome-Wide Identification of R2R3-MYB Genes and Expression Analyses During Abiotic Stress in Gossypium raimondii. Sci. Rep. 2016, 6, 22980. [Google Scholar] [CrossRef] [PubMed] [Green Version]
  45. Kranz, H.D.; Denekamp, M.; Greco, R.; Jin, H.; Leyva, A.; Meissner, R.C.; Petroni, K.; Urzainqui, A.; Bevan, M.; Martin, C.; et al. Towards functional characterisation of the members of the R2R3-MYB gene family from Arabidopsis thaliana. Plant J. 1998, 16, 263–276. [Google Scholar] [CrossRef] [PubMed]
  46. Jiang, C.K.; Rao, G.Y. Insights into the Diversification and Evolution of R2R3-MYB Transcription Factors in Plants. Plant Physiol. 2020, 183, 637–655. [Google Scholar] [CrossRef] [PubMed]
  47. Achaz, G.; Coissac, E.; Viari, A.; Netter, P. Analysis of Intrachromosomal Duplications in Yeast Saccharomyces cerevisiae: A Possible Model for Their Origin. Mol. Biol. Evol. 2000, 17, 1268–1275. [Google Scholar] [CrossRef] [PubMed] [Green Version]
  48. Wang, X.D.; Xu, C.Y.; Zheng, Y.J.; Wu, Y.F.; Zhang, Y.T.; Zhang, T.; Xiong, Z.Y.; Yang, H.K.; Li, J.; Fu, C.; et al. Chromosome-level genome assembly and resequencing of camphor tree (Cinnamomum camphora) provides insight into phylogeny and diversification of terpenoid and triglyceride biosynthesis of Cinnamomum. Hortic. Res. 2022, uhac216. [Google Scholar] [CrossRef]
  49. Li, Y.; Lin, W.; Liu, Z.; Allan, A.C.; Qin, S.; Zhang, J.; Liu, Y. Genome-wide analysis and expression profiles of the StR2R3-MYB transcription factor superfamily in potato (Solanum tuberosum L.). Int. J. Biol. Macromol. 2020, 148, 817–832. [Google Scholar] [CrossRef] [PubMed]
  50. Song, X.H.; Yang, Q.S.; Liu, Y.; Li, J.J.; Chang, X.C.; Xian, L.H.; Zhang, J. Genome-wide identification of Pistacia R2R3-MYB gene family and function characterization of PcMYB113 during autumn leaf coloration in Pistacia chinensis. Int. J. Biol. Macromol. 2021, 192, 16–27. [Google Scholar] [CrossRef]
  51. Zhao, K.; Cheng, Z.; Guo, Q.; Yao, W.; Liu, H.; Zhou, B.; Jiang, T. Characterization of the Poplar R2R3-MYB Gene Family and Over-Expression of PsnMYB108 Confers Salt Tolerance in Transgenic Tobacco. Front. Plant Sci. 2020, 11, 571881. [Google Scholar] [CrossRef] [PubMed]
  52. Klempnauer, K.H.; Gonda, T.J.; Bishop, J.M. Nucleotide sequence of the retroviral leukemia gene v-myb and its cellular progenitor c-myb: The architecture of a transduced oncogene. Cell 1982, 31, 453–463. [Google Scholar] [CrossRef]
  53. Du, H.; Liang, Z.; Zhao, S.; Nan, M.G.; Lam-Son, P.T.; Lu, K.; Huang, Y.B.; Jia-Na, L. The Evolutionary History of R2R3-MYB Proteins Across 50 Eukaryotes: New Insights Into Subfamily Classification and Expansion. Sci. Rep. 2015, 5, 11037. [Google Scholar] [CrossRef] [Green Version]
  54. Xu, W.; Dubos, C.; Lepiniec, L. Transcriptional control of flavonoid biosynthesis by MYB–bHLH–WDR complexes. Trends Plant Sci. 2015, 20, 176–185. [Google Scholar] [CrossRef] [PubMed]
  55. Segarra, G.; Van der Ent, S.; Trillas, I.; Pieterse, C.M.J. MYB72, a node of convergence in induced systemic resistance triggered by a fungal and a bacterial beneficial microbe. Plant Biol. 2009, 11, 90–96. [Google Scholar] [CrossRef] [PubMed] [Green Version]
  56. Agarwal, M.; Hao, Y.; Kapoor, A.; Dong, C.-H.; Fujii, H.; Zheng, X.; Zhu, J.-K. A R2R3 Type MYB Transcription Factor Is Involved in the Cold Regulation of CBF Genes and in Acquired Freezing Tolerance. J. Biol. Chem. 2006, 281, 37636–37645. [Google Scholar] [CrossRef] [PubMed] [Green Version]
  57. Jaakola, L. New insights into the regulation of anthocyanin biosynthesis in fruits. Trends Plant Sci. 2013, 18, 477–483. [Google Scholar] [CrossRef] [PubMed] [Green Version]
  58. Mekapogu, M.; Vasamsetti, B.M.; Kwon, O.K.; Ahn, M.S.; Lim, S.H.; Jung, J.A. Anthocyanins in Floral Colors: Biosynthesis and Regulation in Chrysanthemum Flowers. Int. J. Mol. Sci. 2020, 21, 6537. [Google Scholar] [CrossRef] [PubMed]
  59. Zimmermann, I.M.; Heim, M.A.; Weisshaar, B.; Uhrig, J.F. Comprehensive identification of Arabidopsis thaliana MYB transcription factors interacting with R/B-like BHLH proteins. Plant J. 2004, 40, 22–34. [Google Scholar] [CrossRef]
  60. Zhou, W.; Zhang, Q.; Sun, Y.; Yang, L.; Wang, Z. Genome-wide identification and characterization of R2R3-MYB family in Hypericum perforatum under diverse abiotic stresses. Int. J. Biol. Macromol. 2020, 145, 341–354. [Google Scholar] [CrossRef]
  61. Zhang, T.; Cui, Z.; Li, Y.; Kang, Y.; Song, X.; Wang, J.; Zhou, Y. Genome-Wide Identification and Expression Analysis of MYB Transcription Factor Superfamily in Dendrobium catenatum. Front Genet. 2021, 12, 714696. [Google Scholar] [CrossRef] [PubMed]
  62. Chen, X.; Wang, P.; Gu, M.; Lin, X.; Hou, B.; Zheng, Y.; Sun, Y.; Jin, S.; Ye, N. R2R3-MYB transcription factor family in tea plant (Camellia sinensis): Genome-wide characterization, phylogeny, chromosome location, structure and expression patterns. Genomics 2021, 113, 1565–1578. [Google Scholar] [CrossRef]
  63. Zhong, Y.; Chen, C.; Gong, X.; Luan, X.; Wu, Z.; Li, H.; Liu, Q.; Xu, M.; Yu, F. Transcriptome and metabolome analyses reveal a key role of the anthocyanin biosynthetic pathway cascade in the pigmentation of a Cinnamomum camphora red bark mutant (‘Gantong 1’). Ind. Crops Prod. 2022, 175, 114236. [Google Scholar] [CrossRef]
  64. Chen, L.; Sun, P.; Wang, T.; Chen, K.; Jia, Q.; Wang, H.; Li, Y. Diverse Mechanisms of Antidiabetic Effects of the Different Procyanidin Oligomer Types of Two Different Cinnamon Species on db/db Mice. J. Agric. Food Chem. 2012, 60, 9144–9150. [Google Scholar] [CrossRef] [PubMed]
  65. Brownfield, L.; Hafidh, S.; Borg, M.; Sidorova, A.; Mori, T.; Twell, D. A Plant Germline-Specific Integrator of Sperm Specification and Cell Cycle Progression. PLoS Genet. 2009, 5, e1000430. [Google Scholar] [CrossRef] [PubMed] [Green Version]
  66. Eddy, S.R. Accelerated Profile HMM Searches. PLoS Comput. Biol. 2011, 7, e1002195. [Google Scholar] [CrossRef] [PubMed] [Green Version]
  67. Potter, S.C.; Luciani, A.; Eddy, S.R.; Park, Y.; Lopez, R.; Finn, R.D. HMMER web server: 2018 update. Nucleic Acids Res. 2018, 46, W200–W204. [Google Scholar] [CrossRef] [Green Version]
  68. Duvaud, S.; Gabella, C.; Lisacek, F.; Stockinger, H.; Ioannidis, V.; Durinx., C. Expasy, the Swiss Bioinformatics Resource Portal, as designed by its users. Nucleic Acids Res. 2021, 49, W216–W227. [Google Scholar] [CrossRef]
  69. Kumar, S.; Stecher, G.; Li, M.; Knyaz, C.; Tamura, K. MEGA X: Molecular Evolutionary Genetics Analysis across Computing Platforms. Mol. Biol. Evol. 2018, 35, 1547–1549. [Google Scholar] [CrossRef]
  70. Chen, C.; Chen, H.; Zhang, Y.; Thomas, H.R.; Frank, M.H.; He, Y.; Xia, R. TBtools: An Integrative Toolkit Developed for Interactive Analyses of Big Biological Data. Mol. Plant 2020, 13, 1194–1202. [Google Scholar] [CrossRef] [PubMed]
  71. Crooks, G.E.; Hon, G.; Chandonia, J.M.; Brenner, S.E. WebLogo: A sequence logo generator. Genome Res. 2004, 14, 1188–1190. [Google Scholar] [CrossRef] [PubMed] [Green Version]
  72. Gu, Z.; Cavalcanti, A.; Chen, F.-C.; Bouman, P.; Li, W.-H. Extent of Gene Duplication in the Genomes of Drosophila, Nematode, and Yeast. Mol. Biol. Evol. 2002, 19, 256–262. [Google Scholar] [CrossRef] [PubMed] [Green Version]
  73. Suyama, M.; Torrents, D.; Bork, P. PAL2NAL: Robust conversion of protein sequence alignments into the corresponding codon alignments. Nucleic Acids Res. 2006, 34, W609–W612. [Google Scholar] [CrossRef] [PubMed]
Figure 1. Phylogenetic analysis of MYB proteins. Phylogenetic trees of MYB proteins were constructed using MEGA X with default parameters. The 32 subgroups are indicated in different colors. Red stars represent C. camphora MYB proteins, blue circles represent Arabidopsis MYB proteins, and black triangles represent P. trichocarpa MYB proteins. The inner circle indicated the 32 groups, called C1–C32, of the three species, and the outer colored bars indicated the groups S1–S25 of Arabidopsis.
Ijms 23 14279 g001
Figure 2. DNA-binding domains in CcMYBs. (A). The sequence logos of the 1R-MYB in C. camphora; (B). The sequence logos of the R2R3-MYB in C. camphora, R2 repeat in the first row, R3 repeat in the second row; (C). The sequence logos of the 3R-MYB in C. camphora, R1 repeat in the first row, R2 repeat in the second row, and R3 repeat in the third row. The bit score represents the information content at each position in sequences. G: Glycine; A: Alanine; V: Valine; L: Leucine; I: Isoleucine; P: Proline; F: Phenylalanine; Y: Tyrosine; W: Tryptophan; S: Serine; T: Threonine; C: Cystine; M: Methionine; N: Asparagine; Q: Glutarnine; D: Asparticacid; E: Glutamicacid; K: Lysine; R: Arginine; H: Histidine.
Ijms 23 14279 g002
Figure 3. Phylogenetic relationships, motifs and exon–intron structures of CcMYB family members. (A) A phylogenetic tree of 121 CcMYB proteins was constructed using the neighbor-joining method. Different subgroups were indicated with different background colors and labels; (B) Conserved motifs of CcMYB proteins. Different motifs were indicated by different colored squares; (C) exon–intron structure of CcMYB genes. Exons, introns, and UTRs are indicated by yellow boxes, black lines, and green boxes, respectively.
Ijms 23 14279 g003
Figure 4. The number of various cis-acting elements. Different colors represent different functions. Each color group represents a different kind. The abbreviations in the above color group block, PDE: plant development-related elements; SE: stress-related elements; HE: hormone-related elements. The figure above each column represents the number of cis-acting elements.
Ijms 23 14279 g004
Figure 5. Chromosomal localization and intraspecific collinearity of CcMYBs. The location of the CcMYB gene in the camphor genome was marked on the chromosome. The middle red line represents the duplicated gene pairs for CcMYBs, the gray line represents the genomic duplicated gene pair, and Chr represents the chromosome.
Ijms 23 14279 g005
Figure 6. The expression of CcMYBs in different tissues by RNA-Seq. Expression of different CcMYBs in phloem (BA), flower (FL), leaf (LE), xylem (Pl), root (R), seed (SE), and stem (STT), with the vertical axis showing gene names and the horizontal axis showing different tissues. The different colors correspond to fold changes in log2, with green and red indicating downregulation and upregulation, respectively.
Ijms 23 14279 g006
Figure 7. Correlation between CcMYB genes expression and the expression of structural genes in the flavonoid biosynthesis pathway. PAL, Phenylalanine ammonia lyase; C4H, Cinnamate 4-hydroxylase; 4CL, 4-coumarate:coenzyme A ligase; CHS, Chalcone synthase; CHI, Chalcone isomerase; F3H, Flavanone 3-hydroxylase; F3′H, Flavonoid 3′-hydroxylase; F3′5′H, Flavonoid 3′,5′-hydroxylase; DFR, Dihydroflavonol 4-reductase; LDOX, Leucoanthocyanidin dioxygenase. ***: p < 0.001, **: p < 0.01, *: p < 0.05.
Ijms 23 14279 g007
Figure 8. Expression validation of MYB genes related to flavonoid synthesis in different tissues and qRT-PCR and RNA-Seq results for four CcMYB genes in seven tissues of C. camphora. The abscissa represents seven tissues, in the following order: phloem (BA), flower (FL), leaf (LE), xylem (Pl), root (R), seed (SE), and stem (STT). The left ordinate represents the relative expression and the right ordinate represents FPKM. Orange bars: Expression data were normalized to CcActin gene expression levels, and the amount of expression in stems was normalized to “1”. Mean expression values were calculated from three replicates, and the vertical bars indicate the standard error of the mean. Red line graph: RNA-Seq expression results.
Ijms 23 14279 g008
Figure 9. Multiple sequence alignment of R3 structures in subgroups C17, C20, and C22.
Ijms 23 14279 g009
Table 1. Nomenclature and classification of MYB family genes in C. camphora.
Gene IDMYB NameNo. of DomainsAT HitGene IDMYB NameNo. of DomainsAT Hit
Ccam01T000258.1CcMYB12AtMYB29Ccam04T001684.1CcMYB622AtMYB84
Ccam01T000296.1CcMYB22AtMYB40Ccam04T001846.1CcMYB632AtMYB26
Ccam01T000688.1CcMYB33AtMYB3R1Ccam04T001846.2CcMYB642AtMYB26
Ccam01T000754.1CcMYB42AtMYB38Ccam04T001876.1CcMYB651AT2G36890
Ccam01T000934.1CcMYB52AtMYB46Ccam04T001898.1CcMYB661AT5G47390
Ccam01T001469.1CcMYB62AtMYB46Ccam04T001984.1CcMYB672AtMYB36
Ccam01T001922.1CcMYB71AT5G47390Ccam04T002420.1CcMYB682AtMYB116
Ccam01T001979.1CcMYB82AtMYB38Ccam04T002616.1CcMYB692AtMYB4
Ccam01T002141.1CcMYB92AtMYB5Ccam04T002681.1CcMYB70partAT3G24120
Ccam01T002197.1CcMYB102AtMYB46Ccam04T002944.1CcMYB712AtMYB4
Ccam01T002391.1CcMYB112AtMYB84Ccam05T000046.1CcMYB722AtMYB94
Ccam01T002796.1CcMYB12partAT3G24120Ccam05T000101.1CcMYB732AtMYB93
Ccam01T002796.2CcMYB13partAT3G24120Ccam05T000964.2CcMYB74partAT2G01060
Ccam01T003262.1CcMYB14partAT2G01060Ccam05T001874.1CcMYB752AtMYB116
Ccam01T003298.1CcMYB152AtMYB33Ccam05T002107.1CcMYB762AtMYB4
Ccam01T003334.1CcMYB162AtMYB60Ccam05T002146.1CcMYB772AtMYB66
Ccam01T003511.1CcMYB172AtMYB113Ccam05T002218.1CcMYB78partAT3G24120
Ccam01T003512.1CcMYB182AtMYB113Ccam05T002668.1CcMYB793AtMYB3R5
Ccam01T003530.1CcMYB192AtMYB43Ccam06T000233.1CcMYB801AT5G61620
Ccam01T003681.1CcMYB202AtMYB123Ccam06T000471.1CcMYB812AtMYB9
Ccam01T003682.1CcMYB212AtMYB123Ccam06T000579.1CcMYB821AT5G47390
Ccam01T003684.1CcMYB222AtMYB123Ccam06T001498.1CcMYB832AtMYB103
Ccam02T000146.1CcMYB232AtMYB36Ccam06T001794.1CcMYB842AtMYB42
Ccam02T000623.1CcMYB240AT3G04030Ccam07T000059.1CcMYB851AT5G47390
Ccam02T000634.1CcMYB252AtMYB105Ccam07T000142.1CcMYB862AtMYB9
Ccam02T000715.1CcMYB262AtMYB60Ccam07T000603.1CcMYB872AtMYB42
Ccam02T000749.1CcMYB272AtMYB65Ccam07T001311.1CcMYB882AtMYB58
Ccam02T001376.1CcMYB282AtMYB78Ccam07T002058.1CcMYB892AtMYB102
Ccam02T001462.2CcMYB292AtMYB111Ccam08T000090.1CcMYB905AtMYB93
Ccam02T001819.1CcMYB303AtMYB3R5Ccam08T000196.1CcMYB912AtMYB73
Ccam02T001906.1CcMYB312AtMYB59Ccam08T000630.1CcMYB922AT3G10580
Ccam02T001944.1CcMYB321AT1G15720Ccam09T000028.1CcMYB932AtMYB30
Ccam02T001944.2CcMYB331AT1G15720Ccam09T000765.1CcMYB942AtMYB93
Ccam02T002770.1CcMYB342AtMYB35Ccam09T000873.1CcMYB952AtMYB4
Ccam02T002809.1CcMYB352AtMYB5Ccam09T001430.1CcMYB962AtMYB17
Ccam02T002880.1CcMYB362AtMYB46Ccam10T000428.1CcMYB972AtMYB67
Ccam02T003202.1CcMYB372AtMYB44Ccam10T000876.1CcMYB982AtMYB102
Ccam03T000003.1CcMYB382AtMYB106Ccam10T001218.1CcMYB992AtMYB4
Ccam03T000033.1CcMYB392AtMYB94Ccam10T001249.1CcMYB1002AtMYB21
Ccam03T001088.1CcMYB402AtMYB109Ccam10T001299.1CcMYB1012AtMYB23
Ccam03T001159.1CcMYB412AtMYB5Ccam10T001299.2CcMYB1022AtMYB23
Ccam03T001160.1CcMYB422AtMYB123Ccam10T001421.1CcMYB1032AtMYB55
Ccam03T001161.1CcMYB432AtMYB123Ccam10T001628.1CcMYB1042AtMYB111
Ccam03T001249.1CcMYB442AtMYB20Ccam10T001729.1CcMYB1052AtMYB78
Ccam03T001287.1CcMYB452AtMYB59Ccam10T001828.1CcMYB1062AtMYB61
Ccam03T001320.1CcMYB46partAT3G04030Ccam11T000037.1CcMYB1072AtMYB43
Ccam03T001354.1CcMYB472AtMYB60Ccam11T000138.1CcMYB1082AtMYB123
Ccam03T002316.1CcMYB482AtMYB71Ccam11T000141.1CcMYB1092AtMYB5
Ccam03T002477.1CcMYB491AT5G47390Ccam11T000460.1CcMYB110partAT2G01060
Ccam03T002495.1CcMYB502AtMYB33Ccam11T000608.1CcMYB1112AtMYB59
Ccam03T002497.1CcMYB511AT5G47390Ccam11T000931.1CcMYB1122AtMYB78
Ccam03T002631.1CcMYB522AtMYB5Ccam11T001000.1CcMYB1132AtMYB61
Ccam03T002754.1CcMYB532AtMYB103Ccam11T001081.1CcMYB1142AtMYB15
Ccam03T002940.1CcMYB54partAT3G24120Ccam11T001150.1CcMYB1152AtMYB15
Ccam03T002949.1CcMYB552AtMYB123Ccam11T001151.1CcMYB1162AtMYB15
Ccam04T000335.1CcMYB56partAT5G29000Ccam11T001744.1CcMYB1172AtMYB12
Ccam04T000453.1CcMYB572AtMYB15Ccam11T001870.1CcMYB1182AtMYB61
Ccam04T000811.1CcMYB582AtMYB4Ccam12T000355.1CcMYB1192AtMYB4
Ccam04T001106.1CcMYB592AtMYB80Ccam12T000791.1CcMYB1202AtMYB15
Ccam04T001450.1CcMYB603AtMYB3R4Ccam12T001449.1CcMYB1212AtMYB71
Ccam04T001597.1CcMYB612AtMYB109
AT: Arabidopsis thaliana.
Publisher’s Note: MDPI stays neutral with regard to jurisdictional claims in published maps and institutional affiliations.

