
A Simple and Efficient Method for the Substrate Identification of Amino Acid Decarboxylases


Abstract
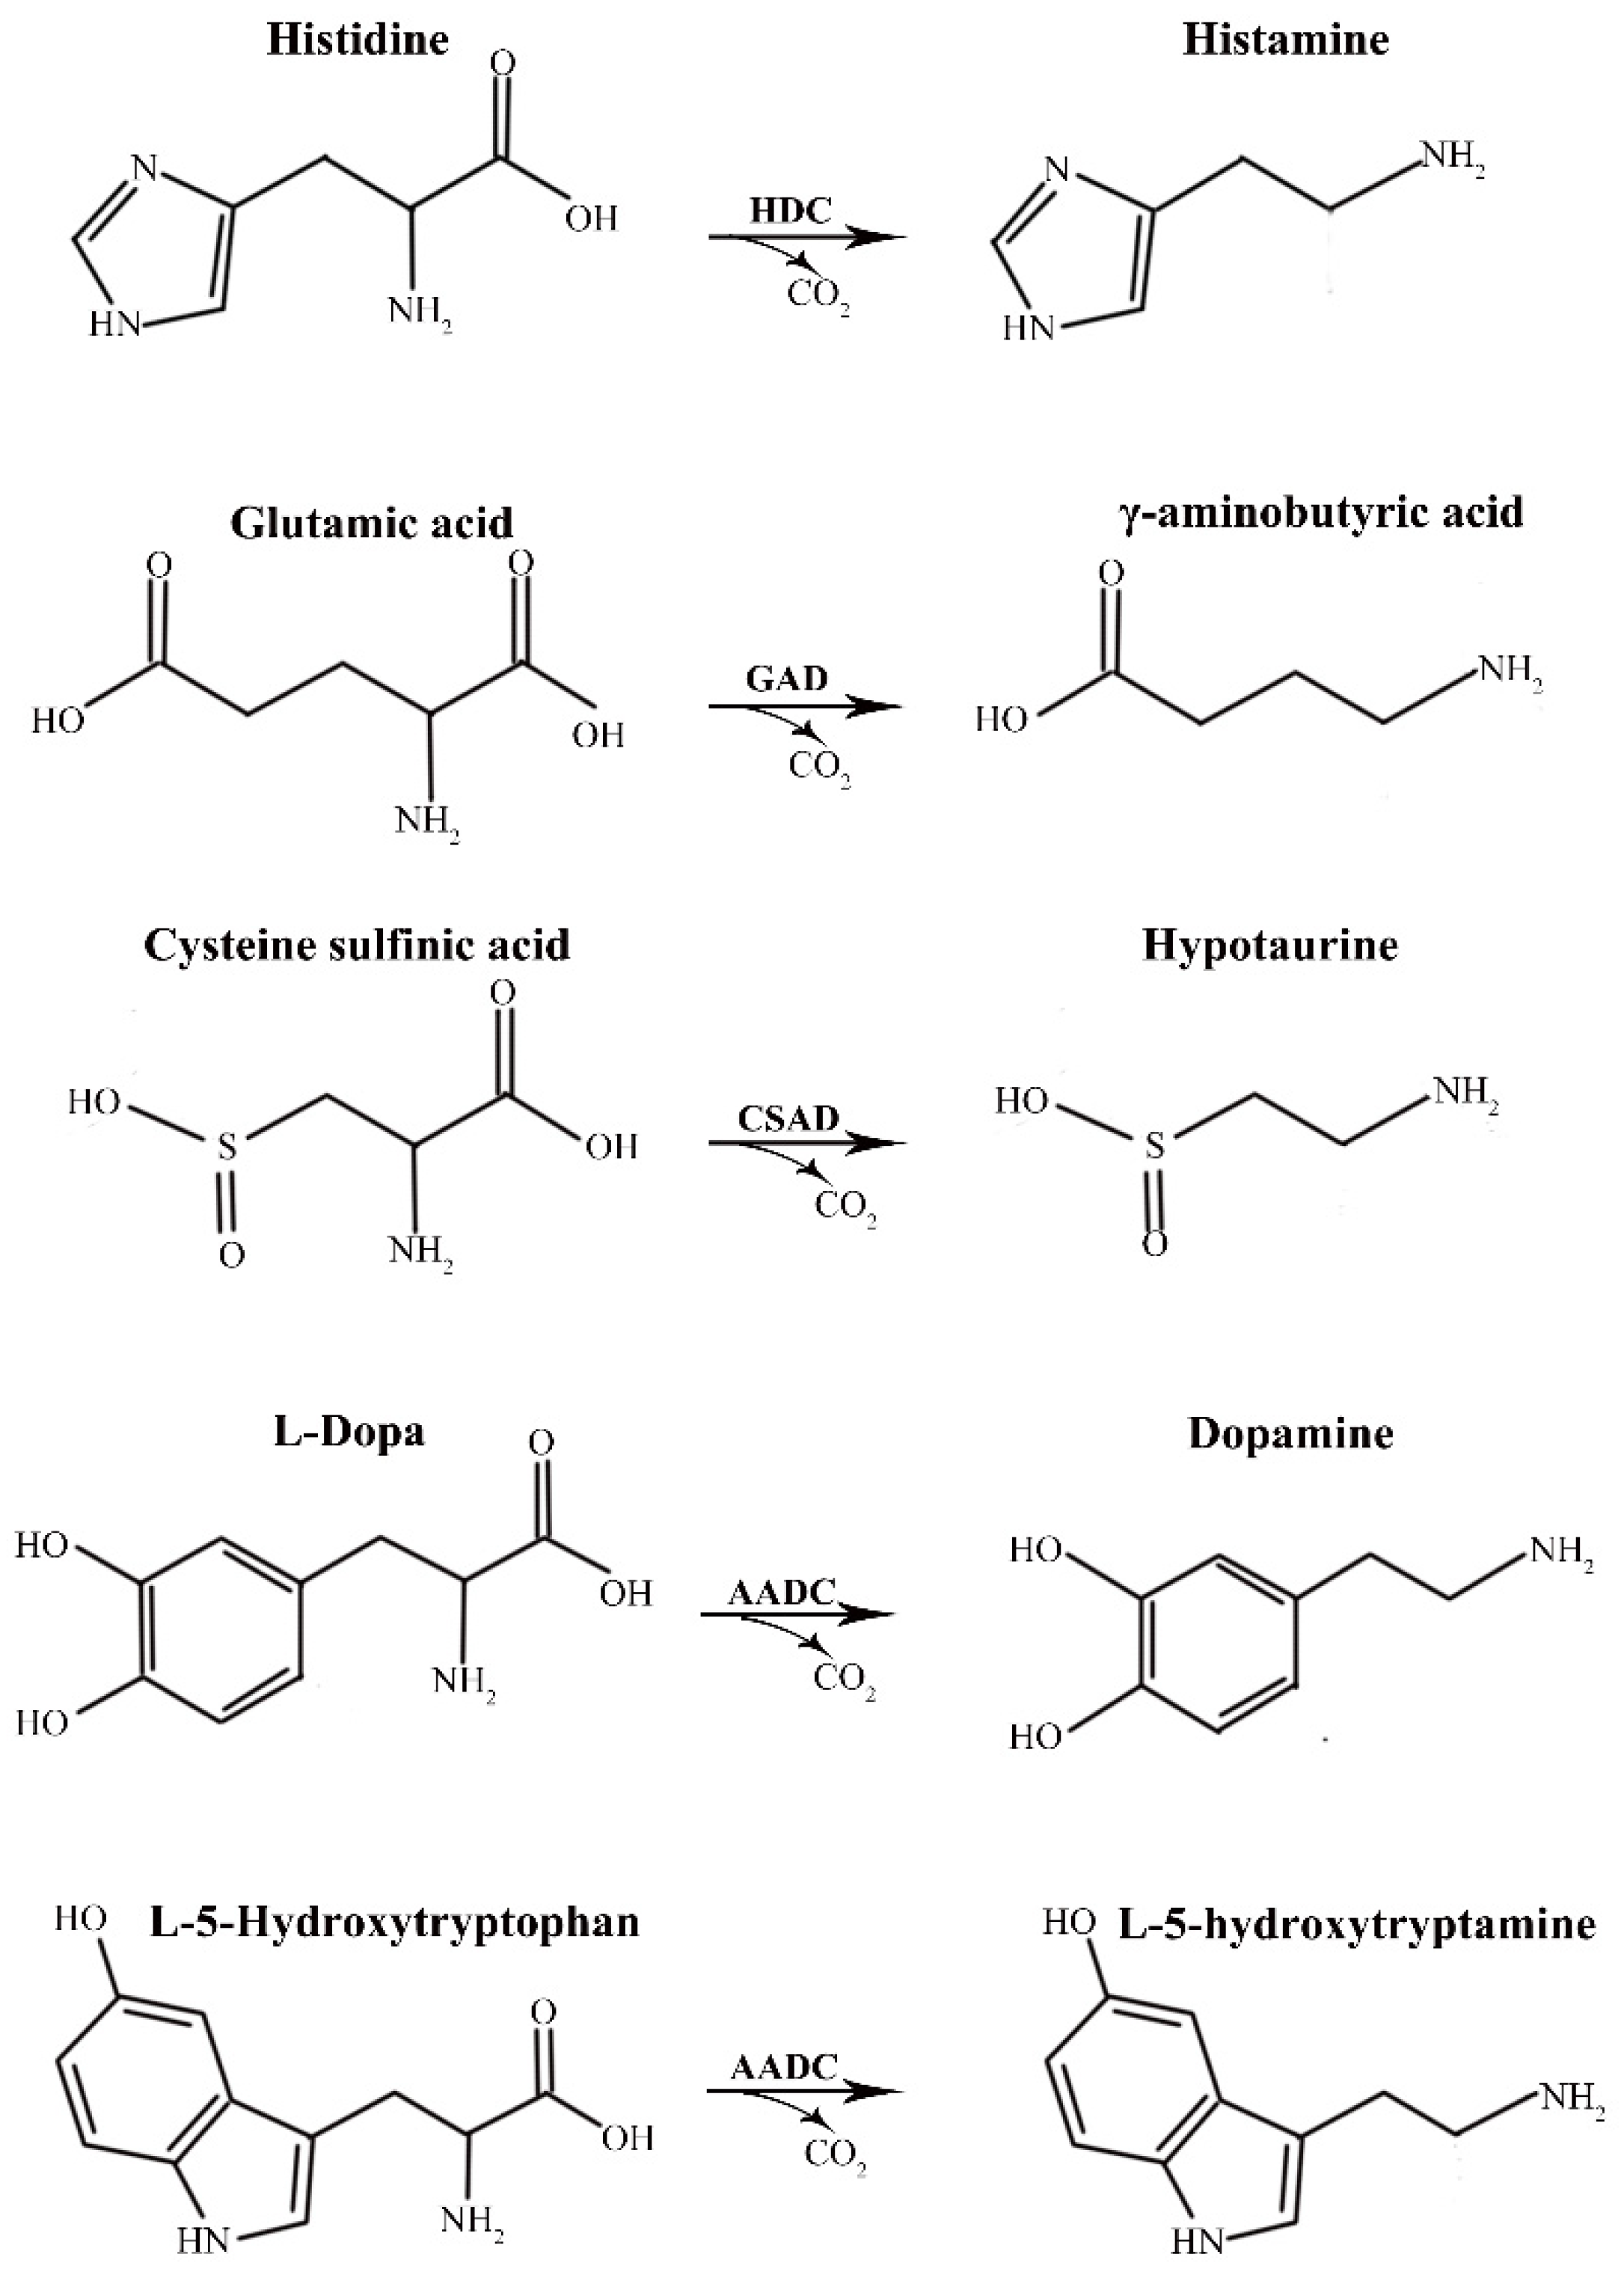
:1. Introduction
2. Results
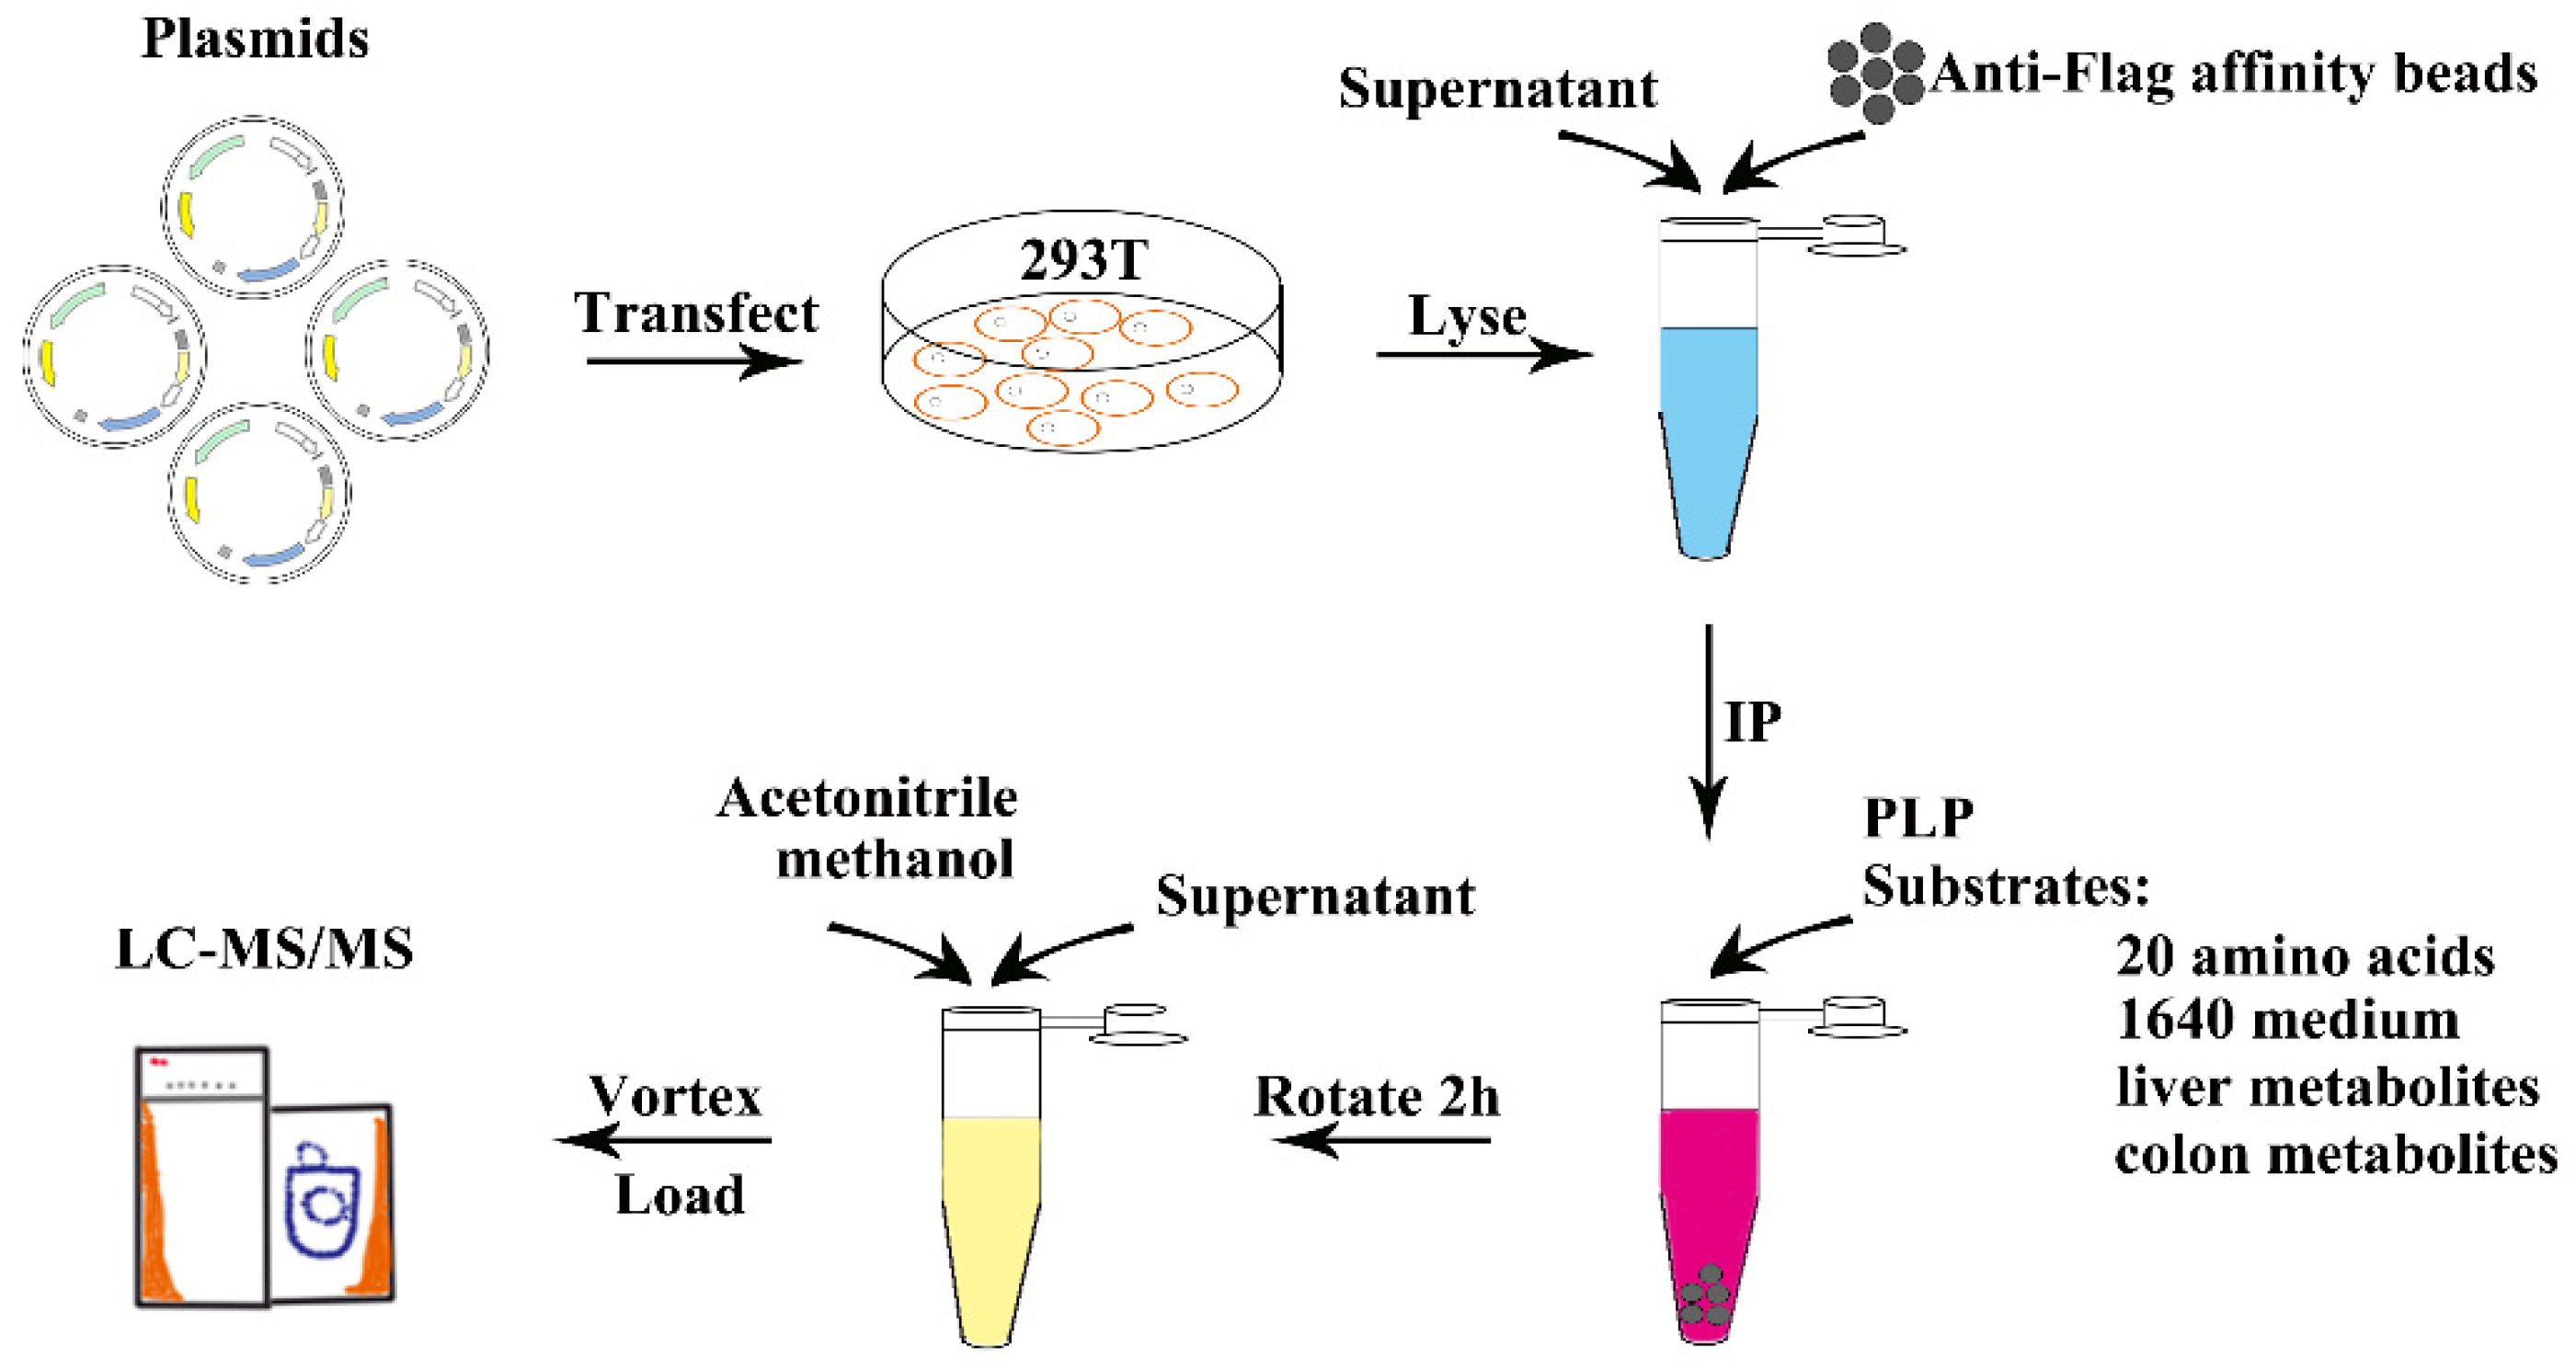
2.1. Experimental Procedure for the Substrate Identification of Amino Acid Decarboxylases
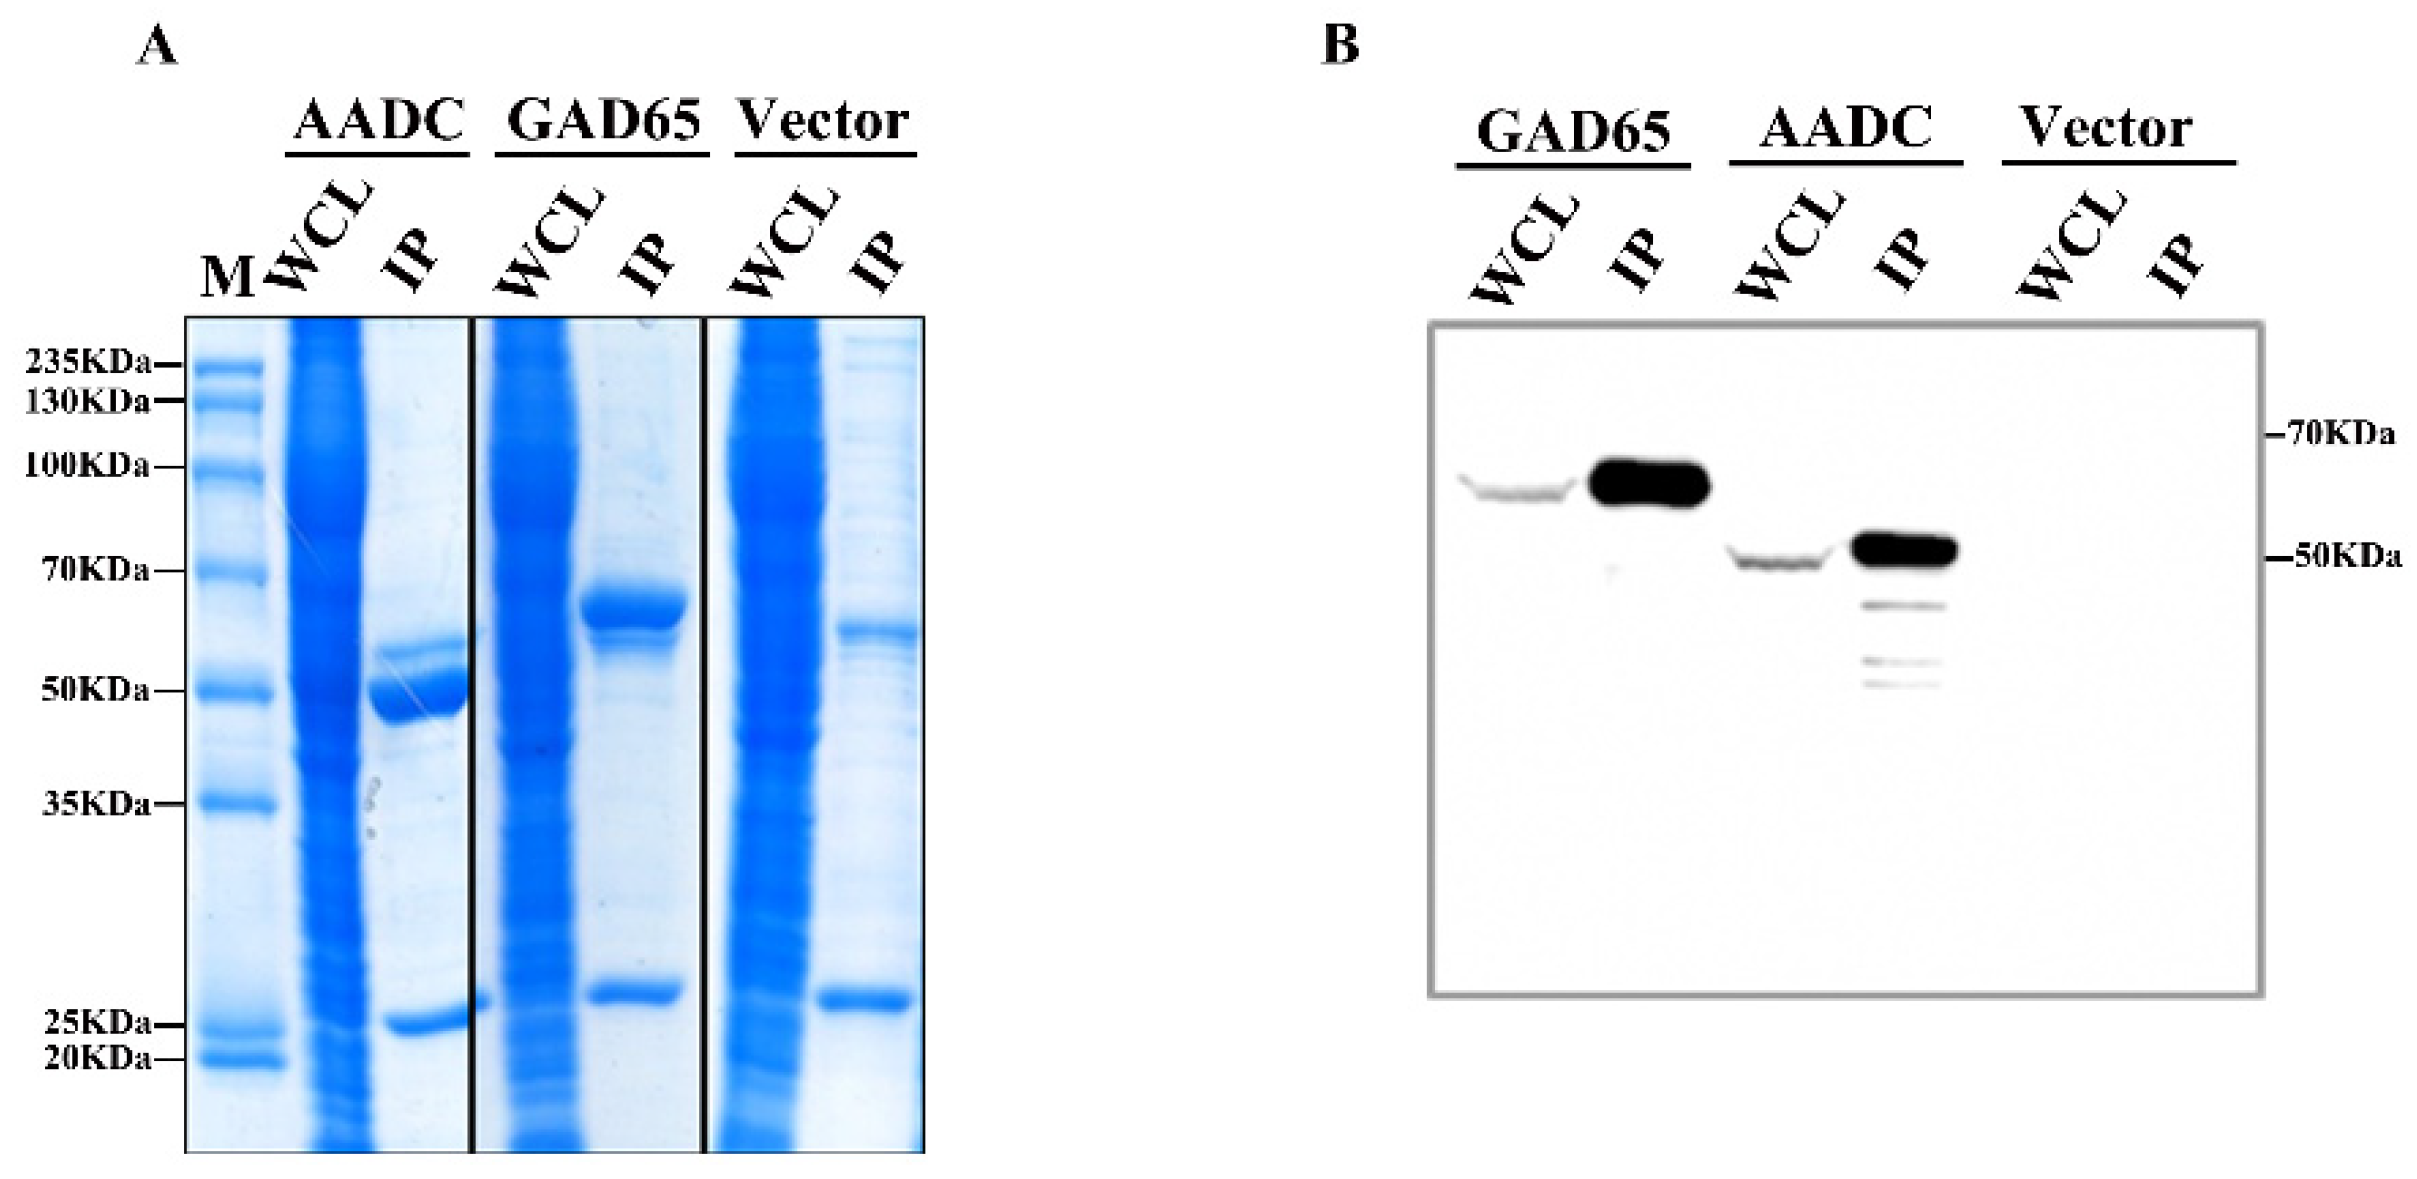
2.2. Purification of GAD65 and AADC
2.3. Detecting the Enzymatic Activities of GAD65 and AADC in a Simple System
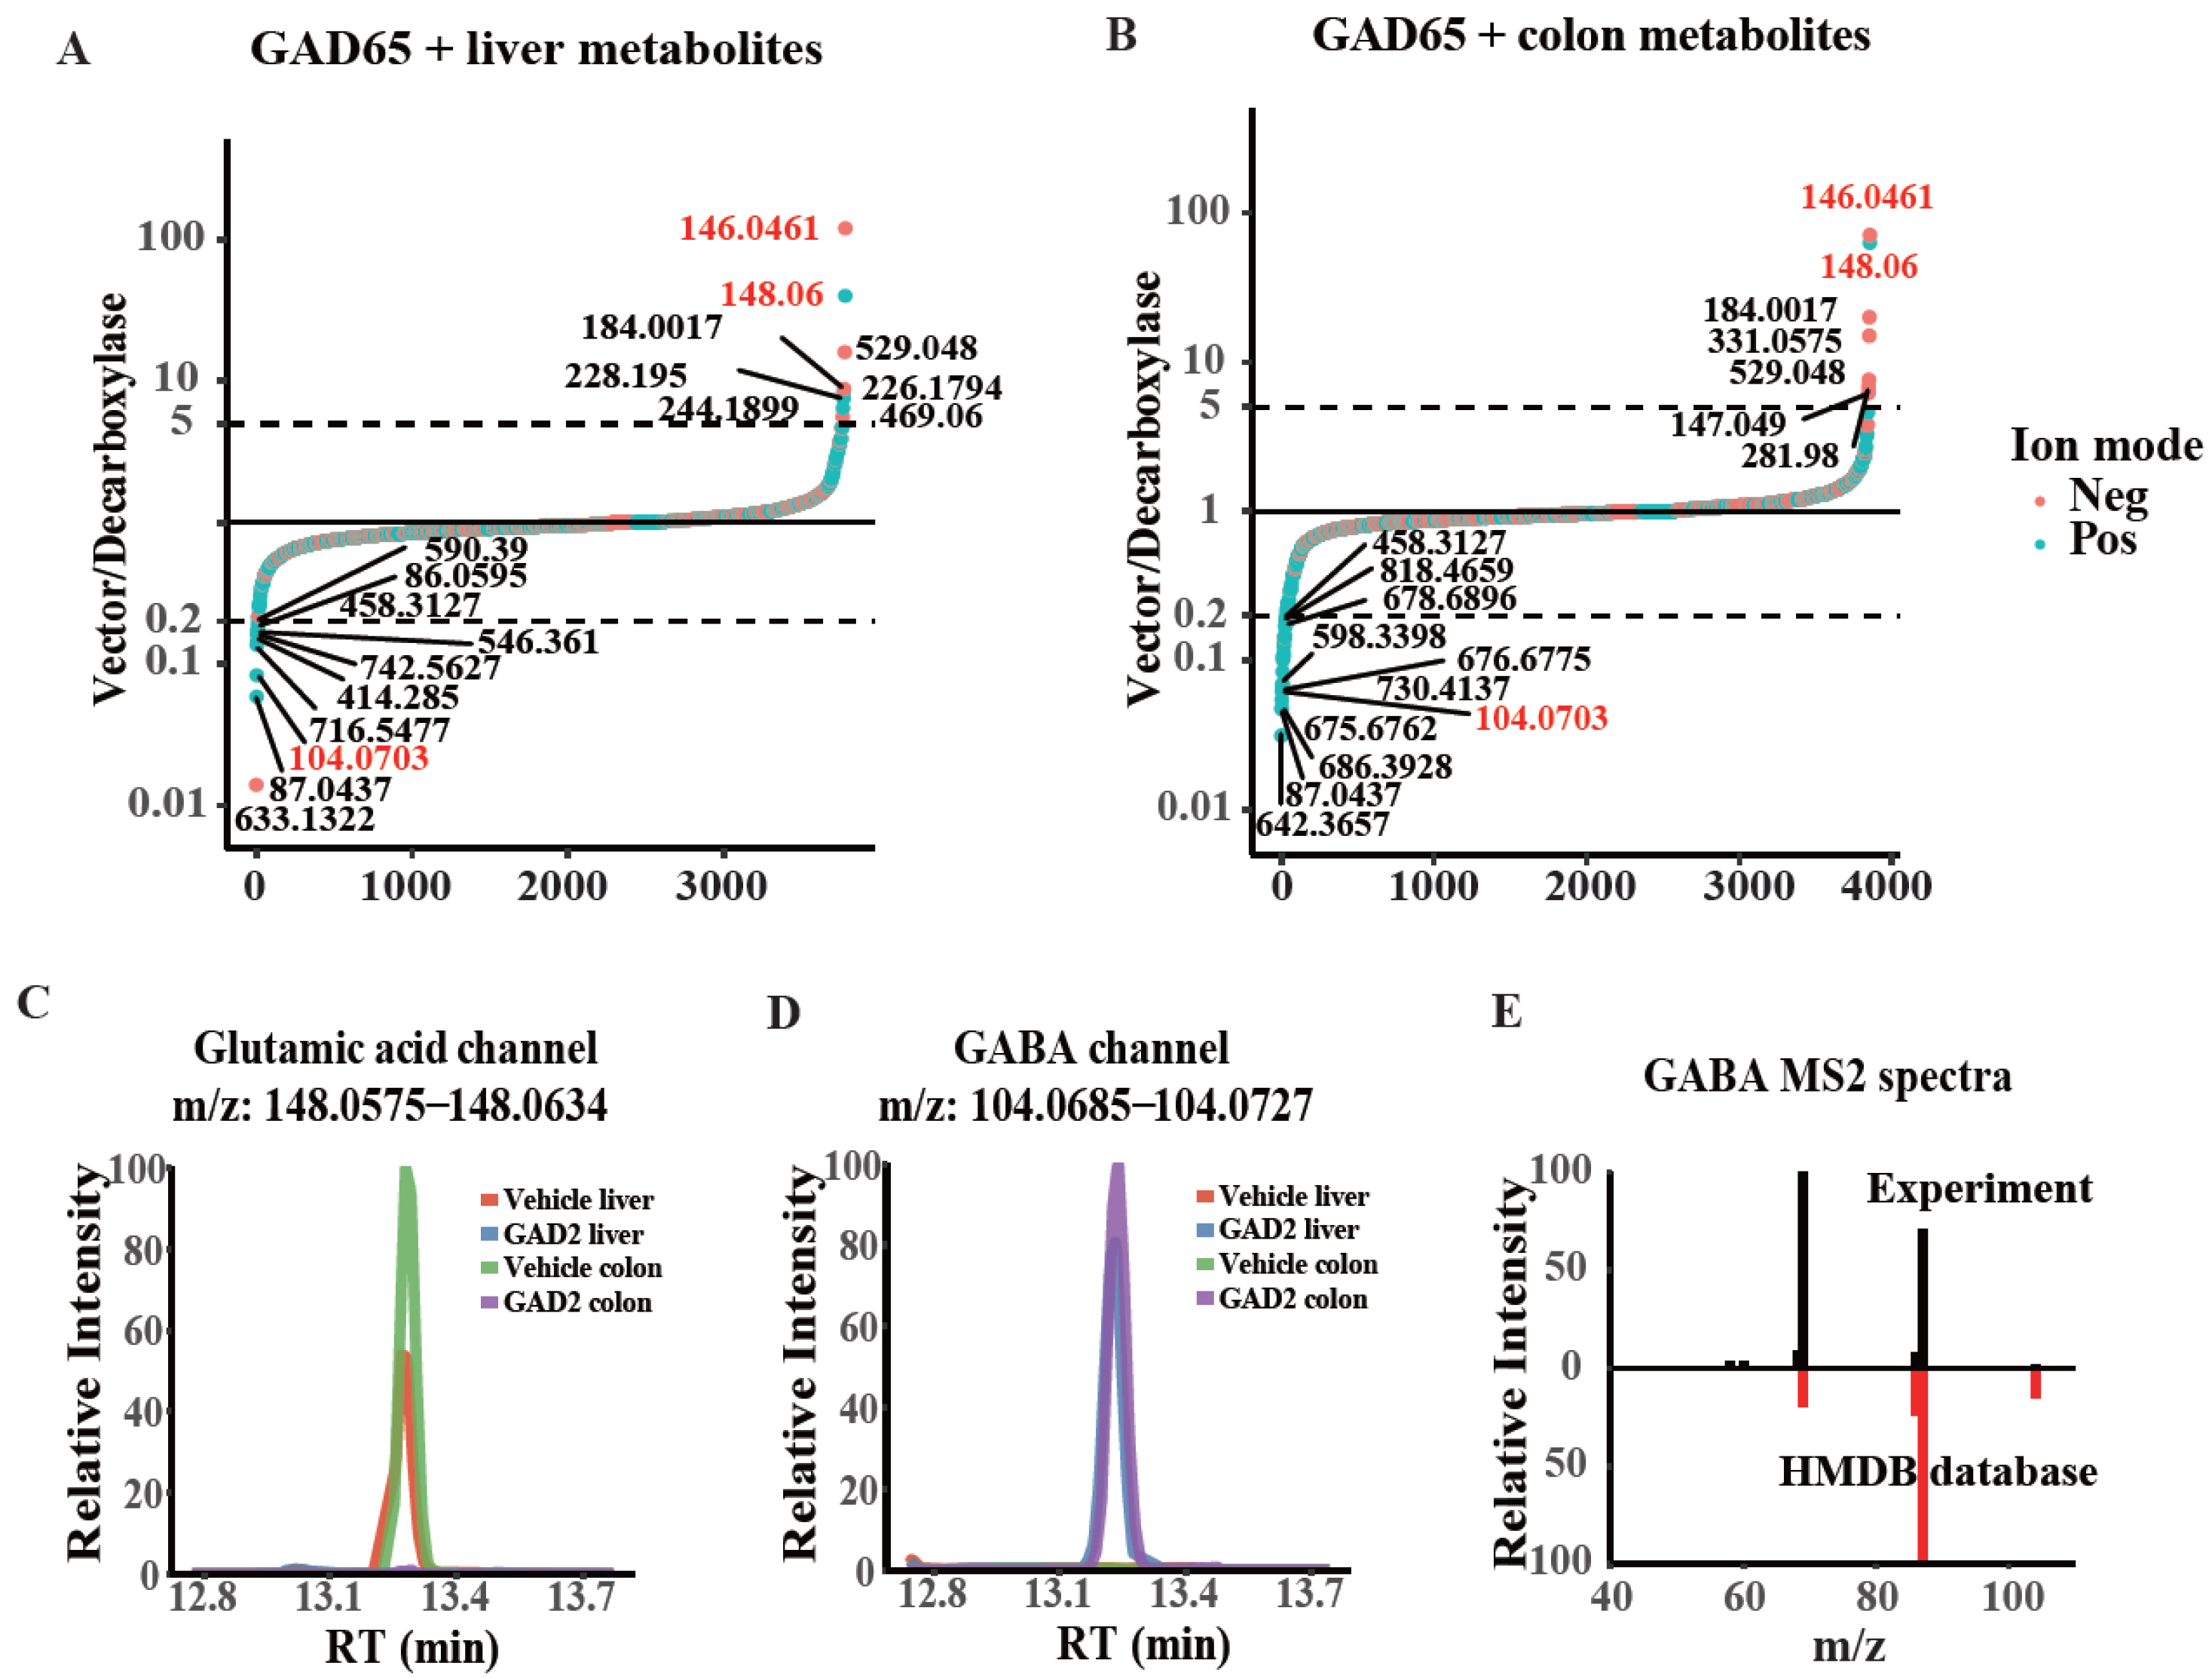
2.4. Detecting the Substrate and Enzymatic Activity of GAD65 in a Complex System
3. Discussion
4. Materials and Methods
4.1. Materials
4.2. Extraction of Tissue Metabolites for Enzymatic Assay
4.3. Protein Expression and Purification
4.4. Enzymatic Activity Assay of GAD2 and AADC with Substrates from Different Sources
4.5. Extraction of Metabolites for LC-MS Analysis
4.6. Targeted LC-MS Measurement
4.7. Untargeted LC-MS Measurement
4.8. LC-MS Data Analysis
Author Contributions
Funding
Institutional Review Board Statement
Informed Consent Statement
Data Availability Statement
Acknowledgments
Conflicts of Interest
References
- Alexander, F.W.; Sandmeier, E.; Mehta, P.K.; Christen, P. Evolutionary relationships among pyridoxal-5′-phosphate-dependent enzymes. Regio-specific alpha, beta and gamma families. JBIC J. Biol. Inorg. Chem. 1994, 219, 953–960. [Google Scholar] [CrossRef] [PubMed]
- Gerner, E.W.; Meyskens, F.L., Jr. Polyamines and cancer: Old molecules, new understanding. Nature reviews. Cancer 2004, 4, 781–792. [Google Scholar] [PubMed] [Green Version]
- Shi, C.; Cooper, T.K.; McCloskey, D.E.; Glick, A.B.; Shantz, L.M.; Feith, D.J. S -adenosylmethionine decarboxylase overexpression inhibits mouse skin tumor promotion. Carcinogenesis 2012, 33, 1310–1318. [Google Scholar] [CrossRef] [PubMed] [Green Version]
- Huang, D.; Alexander, P.B.; Li, Q.-J.; Wang, X.-F. GABAergic signaling beyond synapses: An emerging target for cancer therapy. Trends Cell Biol. 2022. [Google Scholar] [CrossRef] [PubMed]
- Musio, S.; Gallo, B.; Scabeni, S.; Lapilla, M.; Poliani, P.L.; Matarese, G.; Ohtsu, H.; Galli, S.J.; Mantegazza, R.; Steinman, L.; et al. A Key Regulatory Role for Histamine in Experimental Autoimmune Encephalomyelitis: Disease Exacerbation in Histidine Decarboxylase-Deficient Mice. J. Immunol. 2005, 176, 17–26. [Google Scholar] [CrossRef] [Green Version]
- De la Casa-Fages, B.; Anaya, F.; Gabriel-Ortemberg, M.; Grandas, F. Treatment of stiff-person syndrome with chronic plasmapheresis. Mov. Disord. Off. J. Mov. Disord. Soc. 2013, 28, 396–397. [Google Scholar] [CrossRef]
- Pehrson, A.L.; Bondi, C.O.; Totah, N.K.; Moghaddam, B. The influence of NMDA and GABA(A) receptors and glutamic acid decarboxylase (GAD) activity on attention. Psychopharmacology 2013, 225, 31–39. [Google Scholar] [CrossRef] [Green Version]
- Cleret de Langavant, L.; Fénelon, G.; Benisty, S.; Boissé, M.F.; Jacquemot, C.; Bachoud-Lévi, A.C. Awareness of memory deficits in early stage Huntington’s disease. PLoS ONE 2013, 8, e61676. [Google Scholar] [CrossRef] [Green Version]
- Lee, S.-E.; Lee, Y.; Lee, G.H. The regulation of glutamic acid decarboxylases in GABA neurotransmission in the brain. Arch. Pharmacal Res. 2019, 42, 1031–1039. [Google Scholar] [CrossRef]
- Dohm, C.P.; Gröschel, S.; Liman, J.; Bähr, M.; Kermer, P. Dropped head sign induced by transdermal application of the dopamine agonist rotigotine in parkinsonian syndrome: A case report. J. Med. Case Rep. 2013, 7, 174. [Google Scholar] [CrossRef]
- Xu, H.; Yang, F. The interplay of dopamine metabolism abnormalities and mitochondrial defects in the pathogenesis of schizophrenia. Transl. Psychiatry 2022, 12, 464. [Google Scholar] [CrossRef] [PubMed]
- Hoyer, D.; Fellow, H.P. Adjunct Targeting the 5-HT system: Potential side effects. Neuropharmacology 2020, 179, 108233. [Google Scholar] [CrossRef] [PubMed]
- Xu, L.; Zhang, C.; Zhong, M.; Che, F.; Guan, C.; Zheng, X.; Liu, S. Role of histidine decarboxylase gene in the pathogenesis of Tourette syndrome. Brain Behav. 2022, 12, e2511. [Google Scholar] [CrossRef] [PubMed]
- Amagase, Y.; Mizukawa, Y.; Urushidani, T. Peroxisome proliferator-activated receptor α agonist-induced histidine decarboxylase gene expression in the rat and mouse liver. J. Toxicol. Sci. 2020, 45, 475–492. [Google Scholar] [CrossRef]
- Juang, Y.-C.; Fradera, X.; Han, Y.; Partridge, A.W. Repurposing a Histamine Detection Platform for High-Throughput Screening of Histidine Decarboxylase. SLAS Discov. Adv. Sci. Drug Discov. 2018, 23, 974–981. [Google Scholar] [CrossRef]
- Prinz, C.; Zanner, R.; Gratzl, M. Physiology of Gastric Enterochromaffin-Like Cells. Annu. Rev. Physiol. 2003, 65, 371–382. [Google Scholar] [CrossRef]
- Funayama, H.; Huang, L.; Asada, Y.; Endo, Y.; Takada, H. Enhanced induction of a histamine-forming enzyme, histidine decarboxylase, in mice primed with NOD1 or NOD2 ligand in response to various Toll-like receptor agonists. Innate Immun. 2009, 16, 265–272. [Google Scholar] [CrossRef]
- Chen, C.; Xia, S.; He, J.; Lu, G.; Xie, Z.; Han, H. Roles of taurine in cognitive function of physiology, pathologies and toxication. Life Sci. 2019, 231, 116584. [Google Scholar] [CrossRef]
- Schaffer, S.W.; Shimada-Takaura, K.; Jong, C.J.; Ito, T.; Takahashi, K. Impaired energy metabolism of the taurine-deficient heart. Amino Acids 2015, 48, 549–558. [Google Scholar] [CrossRef]
- Wen, C.; Li, F.; Zhang, L.; Duan, Y.; Guo, Q.; Wang, W.; He, S.; Li, J.; Yin, Y. Taurine is Involved in Energy Metabolism in Muscles, Adipose Tissue, and the Liver. Mol. Nutr. Food Res. 2018, 63, e1800536. [Google Scholar] [CrossRef]
- Abebe, W. Effects of taurine on the reactivity of aortas from diabetic rats. Life Sci. 2008, 82, 279–289. [Google Scholar] [CrossRef] [PubMed]
- Hyland, K.; Clayton, P.T. Aromatic L-amino acid decarboxylase deficiency: Diagnostic methodology. Clin. Chem. 1992, 38, 2405–2410. [Google Scholar] [CrossRef] [PubMed]
- Stevenson, D.E.; Akhtar, M.; Gani, D. L-Methionine decarboxylase from Dryopteris filix-mas: Purification, characterization, substrate specificity, abortive transamination of the coenzyme, and stereochemical courses of substrate decarboxylation and coenzyme transamination. Biochemistry 1990, 29, 7631–7647. [Google Scholar] [CrossRef] [PubMed]
- Charteris, A.; John, R. An investigation of the assay of dopamine using trinitrobenzensulphonic acid. Anal. Biochem. 1975, 66, 365–371. [Google Scholar] [CrossRef]
- Pluskal, T.; Castillo, S.; Villar-Briones, A.; Orešič, M. MZmine 2: Modular framework for processing, visualizing, and analyzing mass spectrometry-based molecular profile data. BMC Bioinform. 2010, 11, 395. [Google Scholar] [CrossRef] [PubMed] [Green Version]
- Myers, O.D.; Sumner, S.J.; Li, S.; Barnes, S.; Du, X. One Step Forward for Reducing False Positive and False Negative Compound Identifications from Mass Spectrometry Metabolomics Data: New Algorithms for Constructing Extracted Ion Chromatograms and Detecting Chromatographic Peaks. Anal. Chem. 2017, 89, 8696–8703. [Google Scholar] [CrossRef]

Publisher’s Note: MDPI stays neutral with regard to jurisdictional claims in published maps and institutional affiliations. |
© 2022 by the authors. Licensee MDPI, Basel, Switzerland. This article is an open access article distributed under the terms and conditions of the Creative Commons Attribution (CC BY) license (https://creativecommons.org/licenses/by/4.0/).
Share and Cite
Fang, M.; Wang, X.; Jia, Z.; Qiu, Q.; Li, P.; Chen, L.; Yang, H. A Simple and Efficient Method for the Substrate Identification of Amino Acid Decarboxylases. Int. J. Mol. Sci. 2022, 23, 14551. https://doi.org/10.3390/ijms232314551
Fang M, Wang X, Jia Z, Qiu Q, Li P, Chen L, Yang H. A Simple and Efficient Method for the Substrate Identification of Amino Acid Decarboxylases. International Journal of Molecular Sciences. 2022; 23(23):14551. https://doi.org/10.3390/ijms232314551
Chicago/Turabian StyleFang, Mingyu, Xing Wang, Zhikun Jia, Qiongju Qiu, Peng Li, Li Chen, and Hui Yang. 2022. "A Simple and Efficient Method for the Substrate Identification of Amino Acid Decarboxylases" International Journal of Molecular Sciences 23, no. 23: 14551. https://doi.org/10.3390/ijms232314551
APA StyleFang, M., Wang, X., Jia, Z., Qiu, Q., Li, P., Chen, L., & Yang, H. (2022). A Simple and Efficient Method for the Substrate Identification of Amino Acid Decarboxylases. International Journal of Molecular Sciences, 23(23), 14551. https://doi.org/10.3390/ijms232314551