
Exploring Highly Conserved Regions of SARS-CoV-2 Spike S2 Subunit as Targets for Fusion Inhibition Using Chimeric Proteins

 ,
,  , , and
Abstract
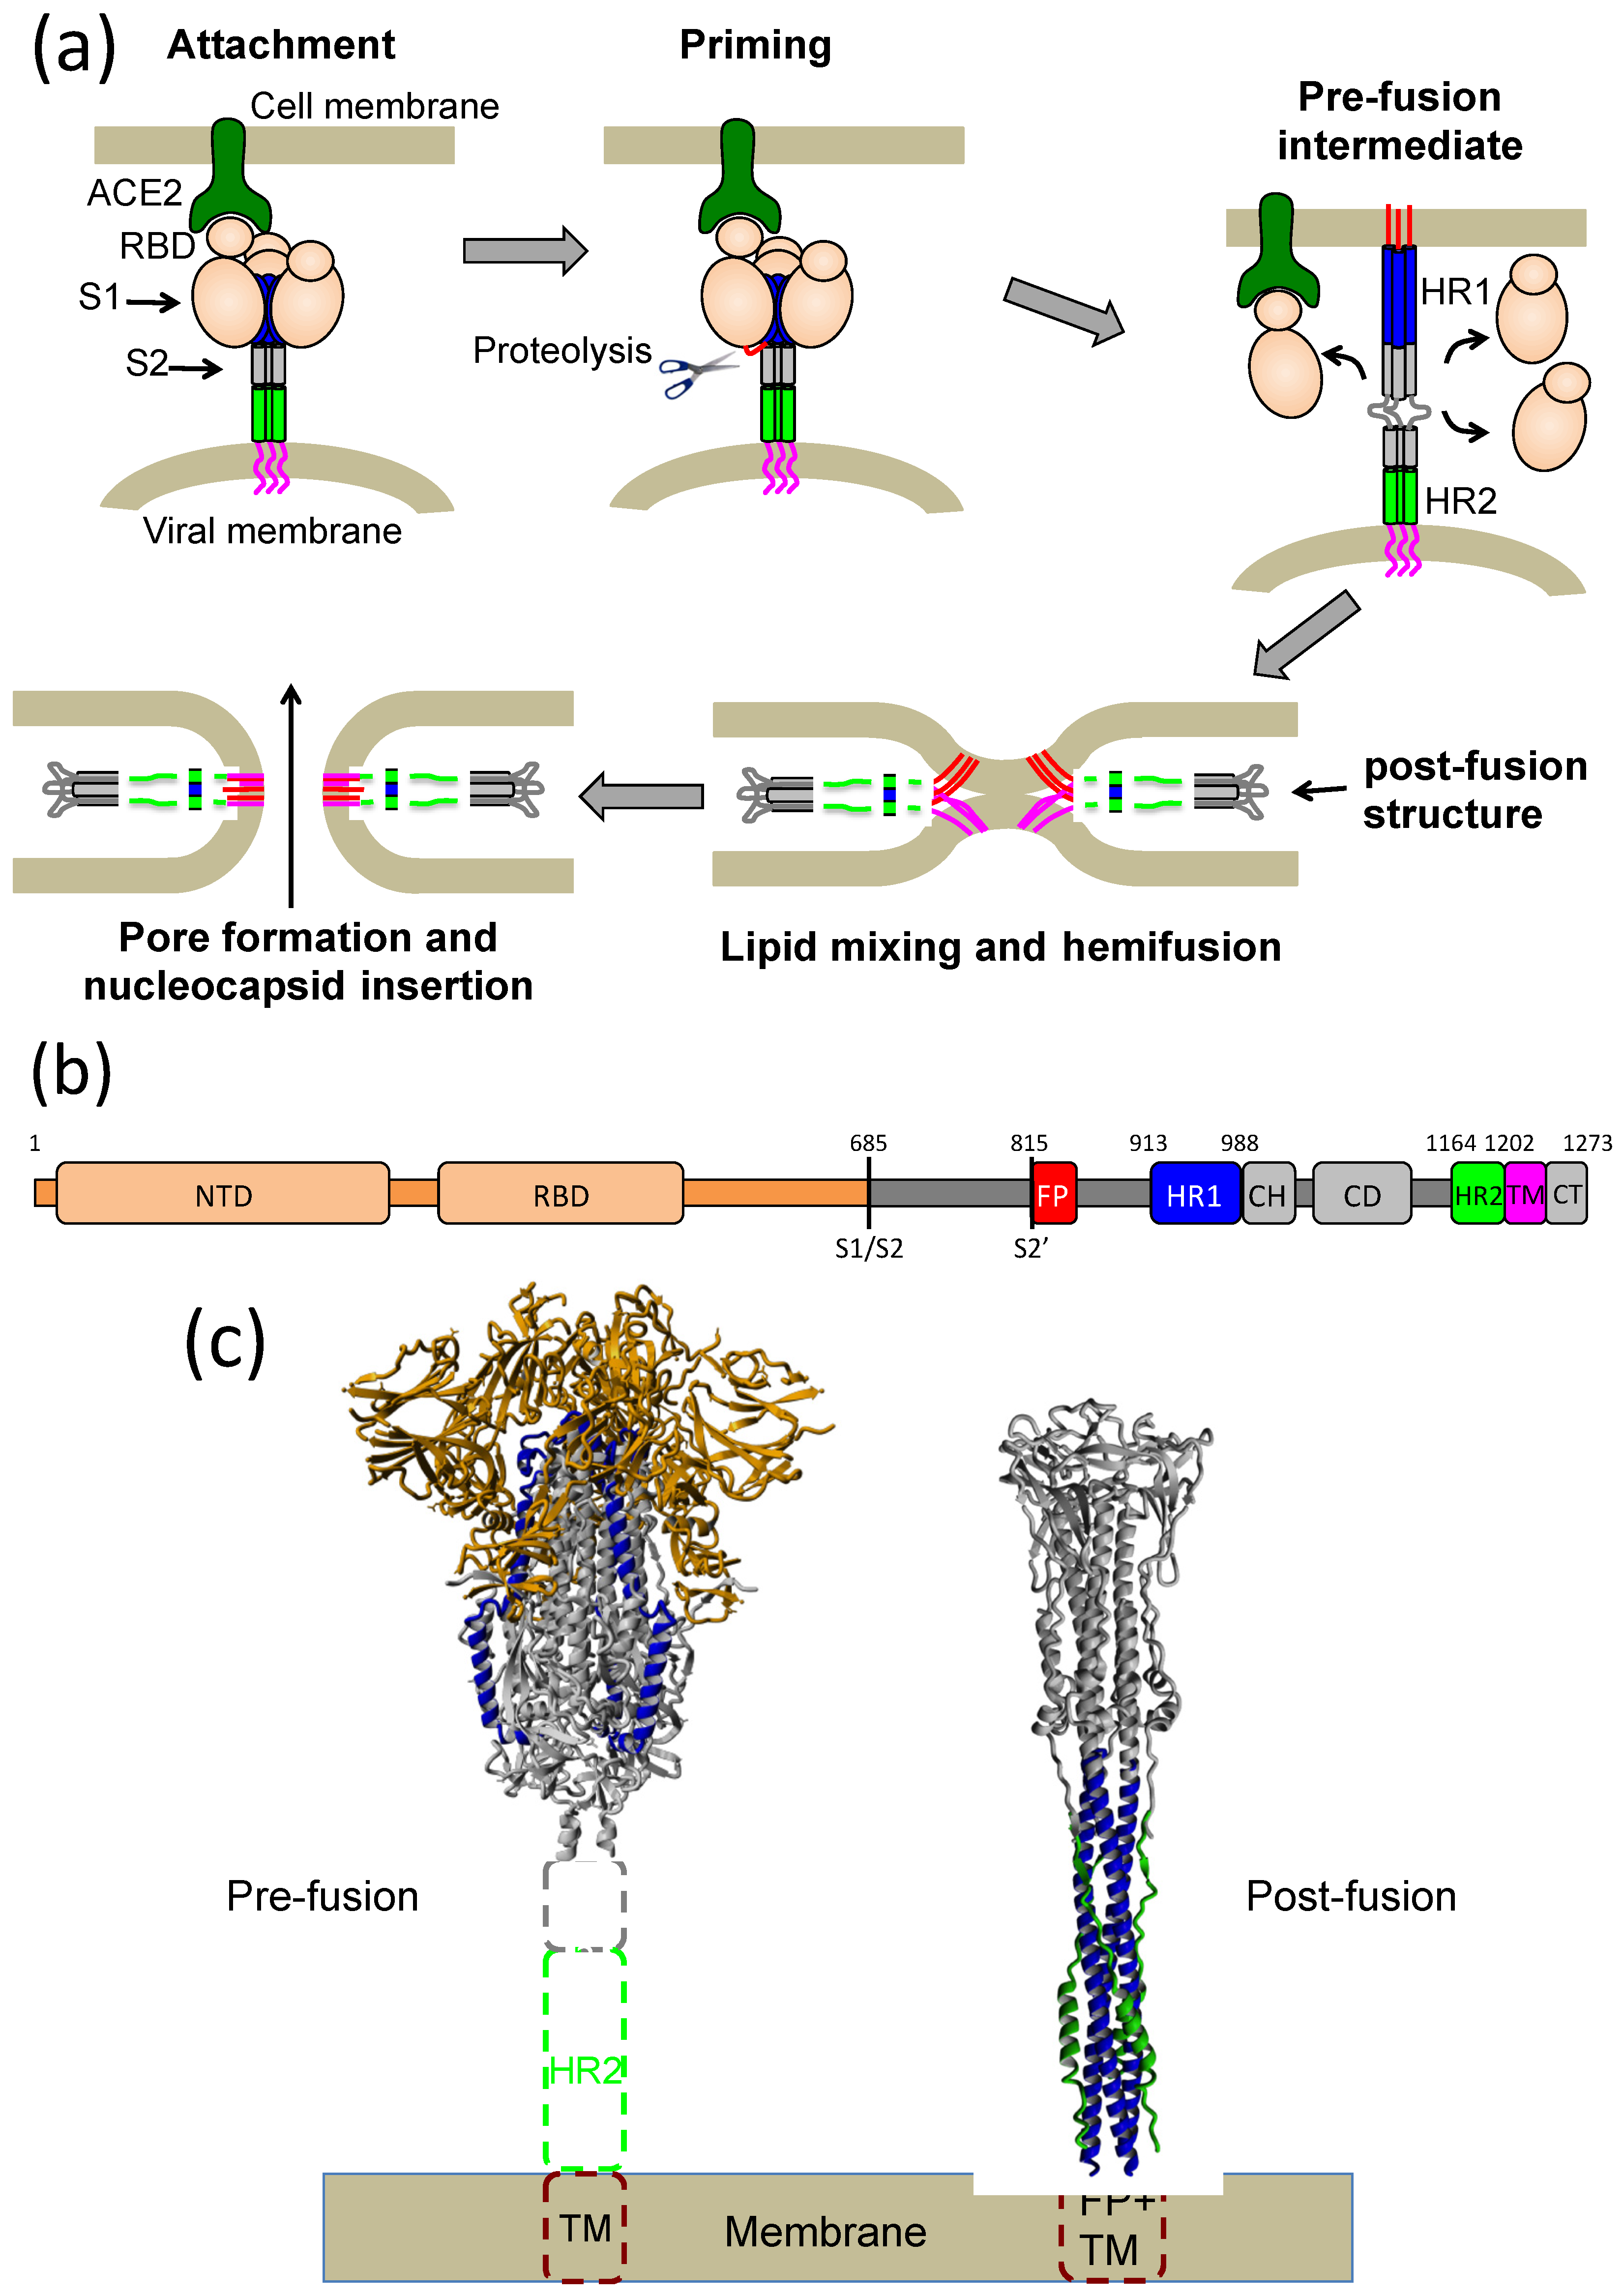
1. Introduction
2. Results
2.1. Design of an Antiparallel Trimeric Coiled-Coil Protein Mimicking the S2 HR1 Trimer
2.2. Biophysical Characterization of the CoVS-HR1 Proteins
2.3. Binding of the CoVS-HR1 Proteins to HR2-Derived Peptides
2.4. Design of Shortened CoVS-HR1 Proteins Mimicking HR1 Subdomains
2.5. Biophysical Characterization of the HR1 Short Miniproteins
2.6. Binding of HR2 to HR1 Subdomains
2.7. In Vitro SARS-CoV-2 Inhibition
3. Discussion
4. Materials and Methods
4.1. Computational Modelling
4.2. Proteins and Peptides
4.3. Circular Dichroism (CD)
4.4. Light Scattering
4.5. Differential Scanning Calorimetry
4.6. Isothermal Titration Calorimetry
4.7. Virus Inhibition Assays
Supplementary Materials
Author Contributions
Funding
Institutional Review Board Statement
Informed Consent Statement
Data Availability Statement
Acknowledgments
Conflicts of Interest
References
- Altmann, D.M.; Boyton, R.J. COVID-19 vaccination: The road ahead. Science 2022, 375, 1127–1132. [Google Scholar] [CrossRef]
- Fathizadeh, H.; Afshar, S.; Masoudi, M.R.; Gholizadeh, P.; Asgharzadeh, M.; Ganbarov, K.; Kose, S.; Yousefi, M.; Kafil, H.S. SARS-CoV-2 (Covid-19) vaccines structure, mechanisms and effectiveness: A review. Int. J. Biol. Macromol. 2021, 188, 740–750. [Google Scholar] [CrossRef] [PubMed]
- Dolgin, E. COVID vaccine immunity is waning—How much does that matter? Nature 2021, 597, 606–607. [Google Scholar] [CrossRef]
- Gupta, R.K. Will SARS-CoV-2 variants of concern affect the promise of vaccines? Nat. Rev. Immunol. 2021, 21, 340–341. [Google Scholar] [CrossRef] [PubMed]
- Karim, S.S.A.; Karim, Q.A. Omicron SARS-CoV-2 variant: A new chapter in the COVID-19 pandemic. Lancet 2021, 398, 2126–2128. [Google Scholar] [CrossRef] [PubMed]
- Lusvarghi, S.; Pollett, S.D.; Neerukonda, S.N.; Wang, W.; Wang, R.; Vassell, R.; Epsi, N.J.; Fries, A.C.; Agan, B.K.; Lindholm, D.A.; et al. SARS-CoV-2 BA.1 variant is neutralized by vaccine booster-elicited serum, but evades most convalescent serum and therapeutic antibodies. Sci. Transl. Med. 2022, 14, eabn8543. [Google Scholar] [CrossRef] [PubMed]
- Wahl, A.; Gralinski, L.E.; Johnson, C.E.; Yao, W.; Kovarova, M.; Dinnon, K.H., III; Liu, H.; Madden, V.J.; Krzystek, H.M.; De, C.; et al. SARS-CoV-2 infection is effectively treated and prevented by EIDD-2801. Nature 2021, 591, 451. [Google Scholar] [CrossRef] [PubMed]
- Owen, D.R.; Allerton, C.M.N.; Anderson, A.S.; Aschenbrenner, L.; Avery, M.; Berritt, S.; Boras, B.; Cardin, R.D.; Carlo, A.; Coffman, K.J.; et al. An oral SARS-CoV-2 M-pro inhibitor clinical candidate for the treatment of COVID-19. Science 2021, 374, 1586–1593. [Google Scholar] [CrossRef] [PubMed]
- Fernandes, Q.; Inchakalody, V.P.; Merhi, M.; Mestiri, S.; Taib, N.; El-Ella, D.M.A.; Bedhiafi, T.; Raza, A.; Al-Zaidan, L.; Mohsen, M.O.; et al. Emerging COVID-19 variants and their impact on SARS-CoV-2 diagnosis, therapeutics and vaccines. Ann. Med. 2022, 54, 524–540. [Google Scholar] [CrossRef] [PubMed]
- Corti, D.; Purcell, L.A.; Snell, G.; Veesler, D. Tackling COVID-19 with neutralizing monoclonal antibodies. Cell 2021, 184, 3086–3108. [Google Scholar] [CrossRef]
- Wrapp, D.; Wang, N.S.; Corbett, K.S.; Goldsmith, J.A.; Hsieh, C.L.; Abiona, O.; Graham, B.S.; McLellan, J.S. Cryo-EM structure of the 2019-nCoV spike in the prefusion conformation. Science 2020, 367, 1260–1263. [Google Scholar] [CrossRef] [PubMed]
- Cai, Y.F.; Zhang, J.; Xiao, T.S.; Peng, H.Q.; Sterling, S.M.; Walsh, R.M.; Rawson, S.; Rits-Volloch, S.; Chen, B. Distinct conformational states of SARS-CoV-2 spike protein. Science 2020, 369, 1586–1592. [Google Scholar] [CrossRef]
- Tortorici, M.A.; Veesler, D. Structural insights into coronavirus entry. In Complementary Strategies to Understand Virus Structure and Function; Rey, F.A., Ed.; Advances in Virus Research; Academic Press: Cambridge, MA, USA, 2019; Volume 105, pp. 93–116. [Google Scholar]
- Hoffmann, M.; Kleine-Weber, H.; Schroeder, S.; Krueger, N.; Herrler, T.; Erichsen, S.; Schiergens, T.S.; Herrler, G.; Wu, N.-H.; Nitsche, A.; et al. SARS-CoV-2 Cell Entry Depends on ACE2 and TMPRSS2 and Is Blocked by a Clinically Proven Protease Inhibitor. Cell 2020, 181, 271–280. [Google Scholar] [CrossRef]
- Xia, S.; Liu, M.; Wang, C.; Xu, W.; Lan, Q.; Feng, S.; Qi, F.; Bao, L.; Du, L.; Liu, S.; et al. Inhibition of SARS-CoV-2 (previously 2019-nCoV) infection by a highly potent pan-coronavirus fusion inhibitor targeting its spike protein that harbors a high capacity to mediate membrane fusion. Cell Res. 2020, 30, 343–355. [Google Scholar] [CrossRef] [PubMed]
- Schuetz, D.; Ruiz-Blanco, Y.B.; Muench, J.; Kirchhoff, F.; Sanchez-Garcia, E.; Mueller, J.A. Peptide and peptide-based inhibitors of SARS-CoV-2 entry. Adv. Drug Deliv. Rev. 2020, 167, 47–65. [Google Scholar] [CrossRef] [PubMed]
- Xia, S.; Yan, L.; Xu, W.; Agrawal, A.S.; Algaissi, A.; Tseng, C.-T.K.; Wang, Q.; Du, L.; Tan, W.; Wilson, I.A.; et al. A pan-coronavirus fusion inhibitor targeting the HR1 domain of human coronavirus spike. Sci. Adv. 2019, 5, eaav4580. [Google Scholar] [CrossRef] [PubMed]
- Xia, S.; Zhu, Y.; Liu, M.; Lan, Q.; Xu, W.; Wu, Y.; Ying, T.; Liu, S.; Shi, Z.; Jiang, S.; et al. Fusion mechanism of 2019-nCoV and fusion inhibitors targeting HR1 domain in spike protein. Cell. Mol. Immunol. 2020, 17, 765–767. [Google Scholar] [CrossRef]
- Bosch, B.J.; Martina, B.E.E.; van der Zee, R.; Lepault, J.; Haijema, B.J.; Versluis, C.; Heck, A.J.R.; de Groot, R.; Osterhaus, A.; Rottier, P.J.M. Severe acute respiratory syndrome coroavirus (SARS-CoV) infection inhibition using spike protein heptad repeat-derived peptides. Proc. Natl. Acad. Sci. USA 2004, 101, 8455–8460. [Google Scholar] [CrossRef]
- Kilby, J.M.; Hopkins, S.; Venetta, T.M.; DiMassimo, B.; Cloud, G.A.; Lee, J.Y.; Alldredge, L.; Hunter, E.; Lambert, D.; Bolognesi, D.; et al. Potent suppression of HIV-1 replication in humans by T-20, a peptide inhibitor of gp41-mediated virus entry. Nat. Med. 1998, 4, 1302–1307. [Google Scholar] [CrossRef]
- Wang, C.; Xia, S.; Wang, X.; Li, Y.; Wang, H.; Xiang, R.; Jiang, Q.; Lan, Q.; Liang, R.; Li, Q.; et al. Supercoiling Structure-Based Design of a Trimeric Coiled-Coil Peptide with High Potency against HIV-1 and Human beta-Coronavirus Infection. J. Med. Chem. 2021, 65, 2809–2819. [Google Scholar] [CrossRef]
- Xing, L.; Xu, X.; Xu, W.; Liu, Z.; Shen, X.; Zhou, J.; Xu, L.; Pu, J.; Yang, C.; Huang, Y.; et al. A Five-Helix-Based SARS-CoV-2 Fusion Inhibitor Targeting Heptad Repeat 2 Domain against SARS-CoV-2 and Its Variants of Concern. Viruses 2022, 14, 597. [Google Scholar] [CrossRef]
- Bi, W.; Chen, G.; Dang, B. Novel Engineered SARS-CoV-2 HR1 Trimer Exhibits Improved Potency and Broad-Spectrum Activity against SARS-CoV-2 and Its Variants. J. Virol. 2022, 96, e00681-22. [Google Scholar] [CrossRef] [PubMed]
- Crespillo, S.; Camara-Artigas, A.; Casares, S.; Morel, B.; Cobos, E.S.; Mateo, P.L.; Mouz, N.; Martin, C.E.; Roger, M.G.; El Habib, R.; et al. Single-chain protein mimetics of the N-terminal heptad-repeat region of gp41 with potential as anti-HIV-1 drugs. Proc. Natl. Acad. Sci. USA 2014, 111, 18207–18212. [Google Scholar] [CrossRef] [PubMed]
- Eckert, D.M.; Kim, P.S. Design of potent inhibitors of HIV-1 entry from the gp41 N-peptide region. Proc. Natl. Acad. Sci. USA 2001, 98, 11187–11192. [Google Scholar] [CrossRef] [PubMed]
- Root, M.J.; Kay, M.S.; Kim, P.S. Protein design of an HIV-1 entry inhibitor. Science 2001, 291, 884–888. [Google Scholar] [CrossRef]
- Lupas, A.N.; Bassler, J.; Dunin-Horkawicz, S. The Structure and Topology of alpha-Helical Coiled Coils. In Fibrous Proteins: Structures and Mechanisms; Parry, D.A.D., Squire, J.M., Eds.; Subcellular Biochemistry; Springer: Cham, Switzerland, 2017; Volume 82, pp. 95–129. [Google Scholar]
- Woolfson, D.N. The design of coiled-coil structures and assemblies. Fibrous Proteins Coiled-Coils Collagen Elastomers 2005, 70, 79. [Google Scholar] [CrossRef]
- Woolfson, D.N. Coiled-Coil Design: Updated and Upgraded. In Fibrous Proteins: Structures and Mechanisms; Parry, D.A.D., Squire, J.M., Eds.; Subcellular Biochemistry; Springer: Cham, Switzerland, 2017; Volume 82, pp. 35–61. [Google Scholar]
- Jurado, S.; Cano-Munoz, M.; Morel, B.; Standoli, S.; Santarossa, E.; Moog, C.; Schmidt, S.; Laumond, G.; Camara-Artigas, A.; Conejero-Lara, F. Structural and Thermodynamic Analysis of HIV-1 Fusion Inhibition Using Small gp41 Mimetic Proteins. J. Mol. Biol. 2019, 431, 3091–3106. [Google Scholar] [CrossRef]
- Jurado, S.; Moog, C.; Cano-Munoz, M.; Schmidt, S.; Laumond, G.; Ruocco, V.; Standoli, S.; Polo-Megias, D.; Conejero-Lara, F.; Morel, B. Probing Vulnerability of the gp41 C-Terminal Heptad Repeat as Target for Miniprotein HIV Inhibitors. J. Mol. Biol. 2020, 432, 5577–5592. [Google Scholar] [CrossRef]
- Cano-Munoz, M.; Cesaro, S.; Morel, B.; Lucas, J.; Moog, C.; Conejero-Lara, F. Extremely Thermostabilizing Core Mutations in Coiled-Coil Mimetic Proteins of HIV-1 gp41 Produce Diverse Effects on Target Binding but Do Not Affect Their Inhibitory Activity. Biomolecules 2021, 11, 566. [Google Scholar] [CrossRef]
- Cano-Munoz, M.; Lucas, J.; Lin, L.-Y.; Cesaro, S.; Moog, C.; Conejero-Lara, F. Conformational Stabilization of Gp41-Mimetic Miniproteins Opens Up New Ways of Inhibiting HIV-1 Fusion. Int. J. Mol. Sci. 2022, 23, 2794. [Google Scholar] [CrossRef]
- Krieger, E.; Vriend, G. YASARA View—Molecular graphics for all devices—From smartphones to workstations. Bioinformatics 2014, 30, 2981–2982. [Google Scholar] [CrossRef] [PubMed]
- Luo, P.; Baldwin, R.L. Mechanism of helix induction by trifluoroethanol: A framework for extrapolating the helix-forming properties of peptides from trifluoroethanol/water mixtures back to water. Biochemistry 1997, 36, 8413–8421. [Google Scholar] [CrossRef] [PubMed]
- Conejerolara, F.; Defilippis, V.; Fontana, A.; Mateo, P.L. The thermodynamics of the unfolding of an isolated protein subdomain—The 255-316-C-terminal fragment of thermolysin. Febs. Lett. 1994, 344, 154–156. [Google Scholar] [CrossRef] [PubMed]
- Ortega, A.; Amoros, D.; Garcia de la Torre, J. Prediction of Hydrodynamic and Other Solution Properties of Rigid Proteins from Atomic- and Residue-Level Models. Biophys. J. 2011, 101, 892–898. [Google Scholar] [CrossRef]
- ConejeroLara, F.; Mateo, P.L. Presence of a slow dimerization equilibrium on the thermal unfolding of the 205–316 thermolysin fragment at neutral pH. Biochemistry 1996, 35, 3477–3486. [Google Scholar] [CrossRef][Green Version]
- Casares, S.; Ab, E.; Eshuis, H.; Lopez-Mayorga, O.; van Nuland, N.A.J.; Conejero-Lara, F. The high-resolution NMR structure of the R21A Spc-SH3: P41 complex: Understanding the determinants of binding affinity by comparison with Abl-SH3. Bmc. Struct. Biol. 2007, 7, 22. [Google Scholar] [CrossRef]
- Bianchi, E.; Joyce, J.G.; Miller, M.D.; Finnefrock, A.C.; Liang, X.; Finotto, M.; Ingallinella, P.; McKenna, P.; Citron, M.; Ottinger, E.; et al. Vaccination with peptide mimetics of the gp41 prehairpin fusion intermediate yields neutralizing antisera against HIV-1 isolates. Proc. Natl. Acad. Sci. USA 2010, 107, 10655–10660. [Google Scholar] [CrossRef]
- Corti, D.; Langedijk, J.P.M.; Hinz, A.; Seaman, M.S.; Vanzetta, F.; Fernandez-Rodriguez, B.M.; Silacci, C.; Pinna, D.; Jarrossay, D.; Balla-Jhagjhoorsingh, S.; et al. Analysis of Memory B Cell Responses and Isolation of Novel Monoclonal Antibodies with Neutralizing Breadth from HIV-1-Infected Individuals. PLoS ONE 2010, 5, e8805. [Google Scholar] [CrossRef]
- Chiliveri, S.C.; Louis, J.M.; Ghirlando, R.; Bax, A. Transient lipid-bound states of spike protein heptad repeats provide insights into SARS-CoV-2 membrane fusion. Sci. Adv. 2021, 7, eabk2226. [Google Scholar] [CrossRef]
- Cano-Munoz, M.; Jurado, S.; Morel, B.; Conejero-Lara, F. Conformational flexibility of the conserved hydrophobic pocket of HIV-1 gp41. Implications for the discovery of small-molecule fusion inhibitors. Int. J. Biol. Macromol. 2021, 192, 90–99. [Google Scholar] [CrossRef]
- Jurado, S.; Cano-Munoz, M.; Polo-Megias, D.; Conejero-Lara, F.; Morel, B. Thermodynamic dissection of the interface between HIV-1 gp41 heptad repeats reveals cooperative interactions and allosteric effects. Arch. Biochem. Biophys. 2020, 688, 108401. [Google Scholar] [CrossRef] [PubMed]
- Bychkova, V.E.; Semisotnov, G.V.; Balobanov, V.A.; Finkelstein, A.V. The Molten Globule Concept: 45 Years Later. Biochemistry-Moscow 2018, 83, S33–S47. [Google Scholar] [CrossRef] [PubMed]
- Kuroda, Y.; Endo, S.; Nakamura, H. How A Novel Scientific Concept Was Coined the “Molten Globule State”. Biomolecules 2020, 10, 269. [Google Scholar] [CrossRef] [PubMed]
- Nakamura, S.; Saotome, T.; Nakazawa, A.; Fukuda, M.; Kuroda, Y.; Kidokoro, S.-i. Thermodynamics of the Thermal Denaturation of Acid Molten Globule State of Cytochrome c Indicate a Reversible High-Temperature Oligomerization Process. Biochemistry 2017, 56, 2372–2378. [Google Scholar] [CrossRef]
- Casares, S.; Sadqi, M.; Lopez-Mayorga, O.; Conejero-Lara, F.; van Nuland, N.A.J. Detection and characterization of partially unfolded oligomers of the SH3 domain of alpha-spectrin. Biophys. J. 2004, 86, 2403–2413. [Google Scholar] [CrossRef]
- Johnson, L.M.; Horne, W.S.; Gellman, S.H. Broad distribution of energetically important contacts across an extended protein interface. J. Am. Chem Soc. 2011, 133, 10038–10041. [Google Scholar] [CrossRef]
- Lee, J.H.; Ozorowski, G.; Ward, A.B. Cryo-EM structure of a native, fully glycosylated, cleaved HIV-1 envelope trimer. Science 2016, 351, 1043–1048. [Google Scholar] [CrossRef]
- Ahn, K.W.; Root, M.J. Complex interplay of kinetic factors governs the synergistic properties of HIV-1 entry inhibitors. J. Biol. Chem. 2017, 292, 16498–16510. [Google Scholar] [CrossRef]
- Steger, H.K.; Root, M.J. Kinetic dependence to HIV-1 entry inhibition. J. Biol. Chem. 2006, 281, 25813–25821. [Google Scholar] [CrossRef]
- Casalino, L.; Gaieb, Z.; Goldsmith, J.A.; Hjorth, C.K.; Dommer, A.C.; Harbison, A.M.; Fogarty, C.A.; Barros, E.P.; Taylor, B.C.; McLellan, J.S.; et al. Beyond Shielding: The Roles of Glycans in the SARS-CoV-2 Spike Protein. ACS Cent. Sci. 2020, 6, 1722–1734. [Google Scholar] [CrossRef]
- Zhou, J.; Xu, W.; Liu, Z.; Wang, C.; Xia, S.; Lan, Q.; Cai, Y.; Su, S.; Pu, J.; Xing, L.; et al. A highly potent and stable pan-coronavirus fusion inhibitor as a candidate prophylactic and therapeutic for COVID-19 and other coronavirus diseases. Acta Pharm. Sin. B 2022, 12, 1652–1661. [Google Scholar] [CrossRef] [PubMed]
- Xia, S.; Chan, J.F.W.; Wang, L.J.; Jiao, F.K.; Chik, K.K.H.; Chu, H.; Lan, Q.S.; Xu, W.; Wang, Q.; Wang, C.; et al. Peptide-based pan-CoV fusion inhibitors maintain high potency against SARS-CoV-2 Omicron variant. Cell Res. 2022, 32, 404–406. [Google Scholar] [CrossRef] [PubMed]
- Guex, N.; Peitsch, M.C. SWISS-MODEL and the Swiss-PdbViewer: An environment for comparative protein modeling. Electrophoresis 1997, 18, 2714–2723. [Google Scholar] [CrossRef] [PubMed]
- Gasteiger, E.; Gattiker, A.; Hoogland, C.; Ivanyi, I.; Appel, R.D.; Bairoch, A. ExPASy: The proteomics server for in-depth protein knowledge and analysis. Nucleic Acids Res. 2003, 31, 3784–3788. [Google Scholar] [CrossRef] [PubMed]


| Protein | Peptide | Kd (μM) | ΔHb (kJ·mol−1) | n |
|---|---|---|---|---|
| CoVS-HR1-L1 | V39E (a) | 1.03 ± 0.24 (c) | −33.5 ± 2.3 | 0.74 |
| CoVS-HR1-L2 | V39E | 0.13 ± 0.04 | −43.6 ± 1.8 | 0.66 |
| CoVS-HR1-L1 | V27E (b) | 4.1 ± 0.7 | −37 ± 8 | 0.25 |
| CoVS-HR1-N | V27E | 28 ± 3 | −7.7 ± 0.6 | 0.5 (d) |
Publisher’s Note: MDPI stays neutral with regard to jurisdictional claims in published maps and institutional affiliations. |
© 2022 by the authors. Licensee MDPI, Basel, Switzerland. This article is an open access article distributed under the terms and conditions of the Creative Commons Attribution (CC BY) license (https://creativecommons.org/licenses/by/4.0/).
Share and Cite
Polo-Megías, D.; Cano-Muñoz, M.; Berruezo, A.G.; Laumond, G.; Moog, C.; Conejero-Lara, F. Exploring Highly Conserved Regions of SARS-CoV-2 Spike S2 Subunit as Targets for Fusion Inhibition Using Chimeric Proteins. Int. J. Mol. Sci. 2022, 23, 15511. https://doi.org/10.3390/ijms232415511
Polo-Megías D, Cano-Muñoz M, Berruezo AG, Laumond G, Moog C, Conejero-Lara F. Exploring Highly Conserved Regions of SARS-CoV-2 Spike S2 Subunit as Targets for Fusion Inhibition Using Chimeric Proteins. International Journal of Molecular Sciences. 2022; 23(24):15511. https://doi.org/10.3390/ijms232415511
Chicago/Turabian StylePolo-Megías, Daniel, Mario Cano-Muñoz, Alberto G. Berruezo, Géraldine Laumond, Christiane Moog, and Francisco Conejero-Lara. 2022. "Exploring Highly Conserved Regions of SARS-CoV-2 Spike S2 Subunit as Targets for Fusion Inhibition Using Chimeric Proteins" International Journal of Molecular Sciences 23, no. 24: 15511. https://doi.org/10.3390/ijms232415511
APA StylePolo-Megías, D., Cano-Muñoz, M., Berruezo, A. G., Laumond, G., Moog, C., & Conejero-Lara, F. (2022). Exploring Highly Conserved Regions of SARS-CoV-2 Spike S2 Subunit as Targets for Fusion Inhibition Using Chimeric Proteins. International Journal of Molecular Sciences, 23(24), 15511. https://doi.org/10.3390/ijms232415511