Article

Molecular Mechanisms Underlying Metabolic Resistance to Cyflumetofen and Bifenthrin in Tetranychus urticae Koch on Cowpea

Key Laboratory of Natural Pesticide & Chemical Biology, Ministry of Education, South China Agricultural University, Guangzhou 510642, China
*
Authors to whom correspondence should be addressed.
Int. J. Mol. Sci. 2022, 23(24), 16220; https://doi.org/10.3390/ijms232416220
Submission received: 10 October 2022 / Revised: 10 December 2022 / Accepted: 12 December 2022 / Published: 19 December 2022
(This article belongs to the Section Molecular Biology)

Abstract

:
Tetranychus urticae Koch (T. urticae) is one of the most tremendous herbivores due to its polyphagous characteristics, and is resistant to most acaricides. In this study, enzyme-linked immunosorbent assay (ELISA), transcriptome sequencing (RNA-seq) and quantitative real-time PCR (qRT-PCR) were carried out to analyze the mechanisms of T. urticae metabolic resistance to cyflumetofen and bifenthrin on cowpea. The enzyme activity of UDP-glucuronosyltransferases (UGTs) and carboxylesterases (CarEs) in the cyflumetofen-resistant (R_cfm) strain significantly decreased, while that of cytochrome P450 monooxygenases (P450s) significantly increased. Meanwhile, the activities of glutathione-S-transferases (GSTs), CarEs and P450s in the bifenthrin-resistant (R_bft) strain were significantly higher than those in the susceptible strain (Lab_SS). According to the Kyoto Encyclopedia of Genes and Genomes (KEGG) and Gene Ontology (GO) analyses, in the R_cfm mite strain, two carboxyl/cholinesterase (CCE) genes and two P450 genes were upregulated and one gene was downregulated, namely CYP392E7; in the R_bft mite strain, eleven CCE, nine UGT, two P450, four GST and three ABC genes were upregulated, while four CCE and three P450 genes were downregulated. Additionally, 94 differentially expressed genes (DEGs) were common to the two resistant groups. Specifically, TuCCE46 and TuCCE70 were upregulated in both resistant groups. Furthermore, the qRT-PCR validation data were consistent with those from the transcriptome sequencing analysis. Specifically, TuCCE46 (3.37-fold) was significantly upregulated in the R_cfm strain, while in the R_bft strain, TeturUGT22 (5.29-fold), teturUGT58p (1.74-fold), CYP392A11 (2.89-fold) and TuGSTd15 (5.12-fold) were significantly upregulated and TuCCE01 (0.13-fold) and CYP392A2p (0.07-fold) were significantly downregulated. Our study indicates that TuCCE46 might play the most important role in resistance to cyflumetofen, and TuCCE01, teturUGT58p, teturUGT22, CYP392A11, TuGSTd15, TuGSTm09 and TuABCG-13 were prominent in the resistance to bifenthrin. These findings provide further insight into the critical genes involved in the metabolic resistance of T. urticae to cyflumetofen and bifenthrin.

1. Introduction

Tetranychus urticae Koch (T. urticae), the two-spotted spider mite, is recognized as one of the most tremendous herbivores because of its polyphagous characteristic. The mite has a wide range of hosts, including more than 1400 vegetation types, among them various agricultural crops [1,2]. Yield reductions of 40–60% were reported due to the attack of T. urticae on soybean plants [3]. Grain losses ranging from 6–48% caused by mites have also been reported [4]. Sood et al. [5] reported the yield reduction of cucumber in different growth stages caused by mites varying from 3.2 to 62.5%. Recently, mite damage on cowpea (Vigna unguiculata L. Walp.) has become more and more serious [6]. Cowpeas are cultivated as an important vegetable crop in many countries. Cowpea is a grain legume that is grown extensively as an alternate protein and income source for many farmers [7,8]. Presently, the control of this mite on cowpeas is still primarily conducted using acaricides. However, the two-spotted spider mite has developed high resistance to most acaricides due to its unique traits, such as rapid development, short lifecycle, high fecundity and arrhenotokous parthenogenesis [2,9,10].
Cyflumetofen [2-methoxyethyl (R,S)-2-(4-tert-butylphenyl)-2-cyano-3-oxo-3-(α,α,α-trifluoro-O-tolyl)-propionate] is the first acaricide of complex II inhibitors which acts on the mitochondrial electron transport (MET) chain [2,11,12,13,14]. This acaricide is a pro-pesticide and can form an active de-esterified metabolite to decrease the activity of succinate dehydrogenase and promote the oxidation process of succinate to fumarate in the Krebs cycle [2,15]. Recently, studies have shown that increased detoxification is pertinent to the resistance of the two-spotted spider mite to cyflumetofen [14]. Khalighi et al. [15] reported that glutathione-S-transferases (GSTs) may contribute to resistance to cyflumetofen, and thus the synergists piperonyl butoxide (PBO) and S,S,S-tributyl phosphorotrithioate (DEF) did not enhance the toxicity of cyflumetofen. Furthermore, Pavlidi et al. [12] demonstrated that GSTd05 could directly metabolize cyflumetofen. Recently, Sugimoto et al. [16] reported that TuGSTd05 in the SoOm1_CflR strain of T. urticae was upregulated. Moreover, downregulated carboxyl/cholinesterase (CCE) genes were also related to cyflumetofen resistance [16]. Bifenthrin, a broad-spectrum pyrethroid acaricide, plays an important role in the control of T. urticae [17,18]. The metabolic mechanisms of pyrethroid resistance have been increasingly studied since the first report of the bifenthrin resistance of T. urticae in 1992 [19]. Of these resistance mechanisms, cytochrome P450 monooxygenases (P450s) and carboxylesterases (CarEs) are crucial for increasing metabolic detoxification, while glutathione-S-transferase exerts a negligible influence on pyrethroid resistance [16,19,20]. Ay and Gürkan [20] found that esterase activity was closely related to the high resistance to bifenthrin in T. urticae. In addition, Van Leeuwen et al. [19] demonstrated that the toxicity of bifenthrin was obviously promoted when adding the esterase inhibitor DEF.
Overall, the specific metabolic resistance mechanism is still unclear in T. urticae, though there are various studies addressing the metabolic resistance mechanism and the detoxification genes related to cyflumetofen and bifenthrin [14,19,21,22,23]. Therefore, we selected cyflumetofen- and bifenthrin-resistant strains from the same parent strain (a colony reared in the laboratory for more than 6 years without exposure to any acaricide) and then performed enzyme activity assays by using the enzyme-linked immunosorbent assay (ELISA) method, and transcriptome sequencing (RNA-seq) together with validation by quantitative real-time PCR (qRT-PCR) to explore their metabolic resistance mechanism.

2. Results

2.1. Selection of the Cyflumetofen- and Bifenthrin-Resistant Strains

The initial median lethal concentration (LC50) values of the strain to cyflumetofen and bifenthrin were 6.02 and 125.04 mg/L, respectively. After 16 generations of selection by spraying with cyflumetofen, the LC50 value of the cyflumetofen-resistant (R_cfm) strain was 707.95 mg/L, and its resistance ratio (RR) was 117.60. After spraying with bifenthrin for 20 consecutive generations, the LC50 value of the bifenthrin-resistant (R_bft) strain was higher than 20000 mg/L, and the RR was greater than 159.95 (Table 1).

2.2. The Enzyme Activity in the Cyflumetofen- and Bifenthrin-Resistant Strains

The standard curve of the content of protein was y = 6.1900x + 0.0201. The correlation coefficient (R2) was 0.9980 (Figure 1a). Based on this, the standard curves of the contents of UGTs, CarEs, GSTs and P450s were determined (Figure 1b–e).
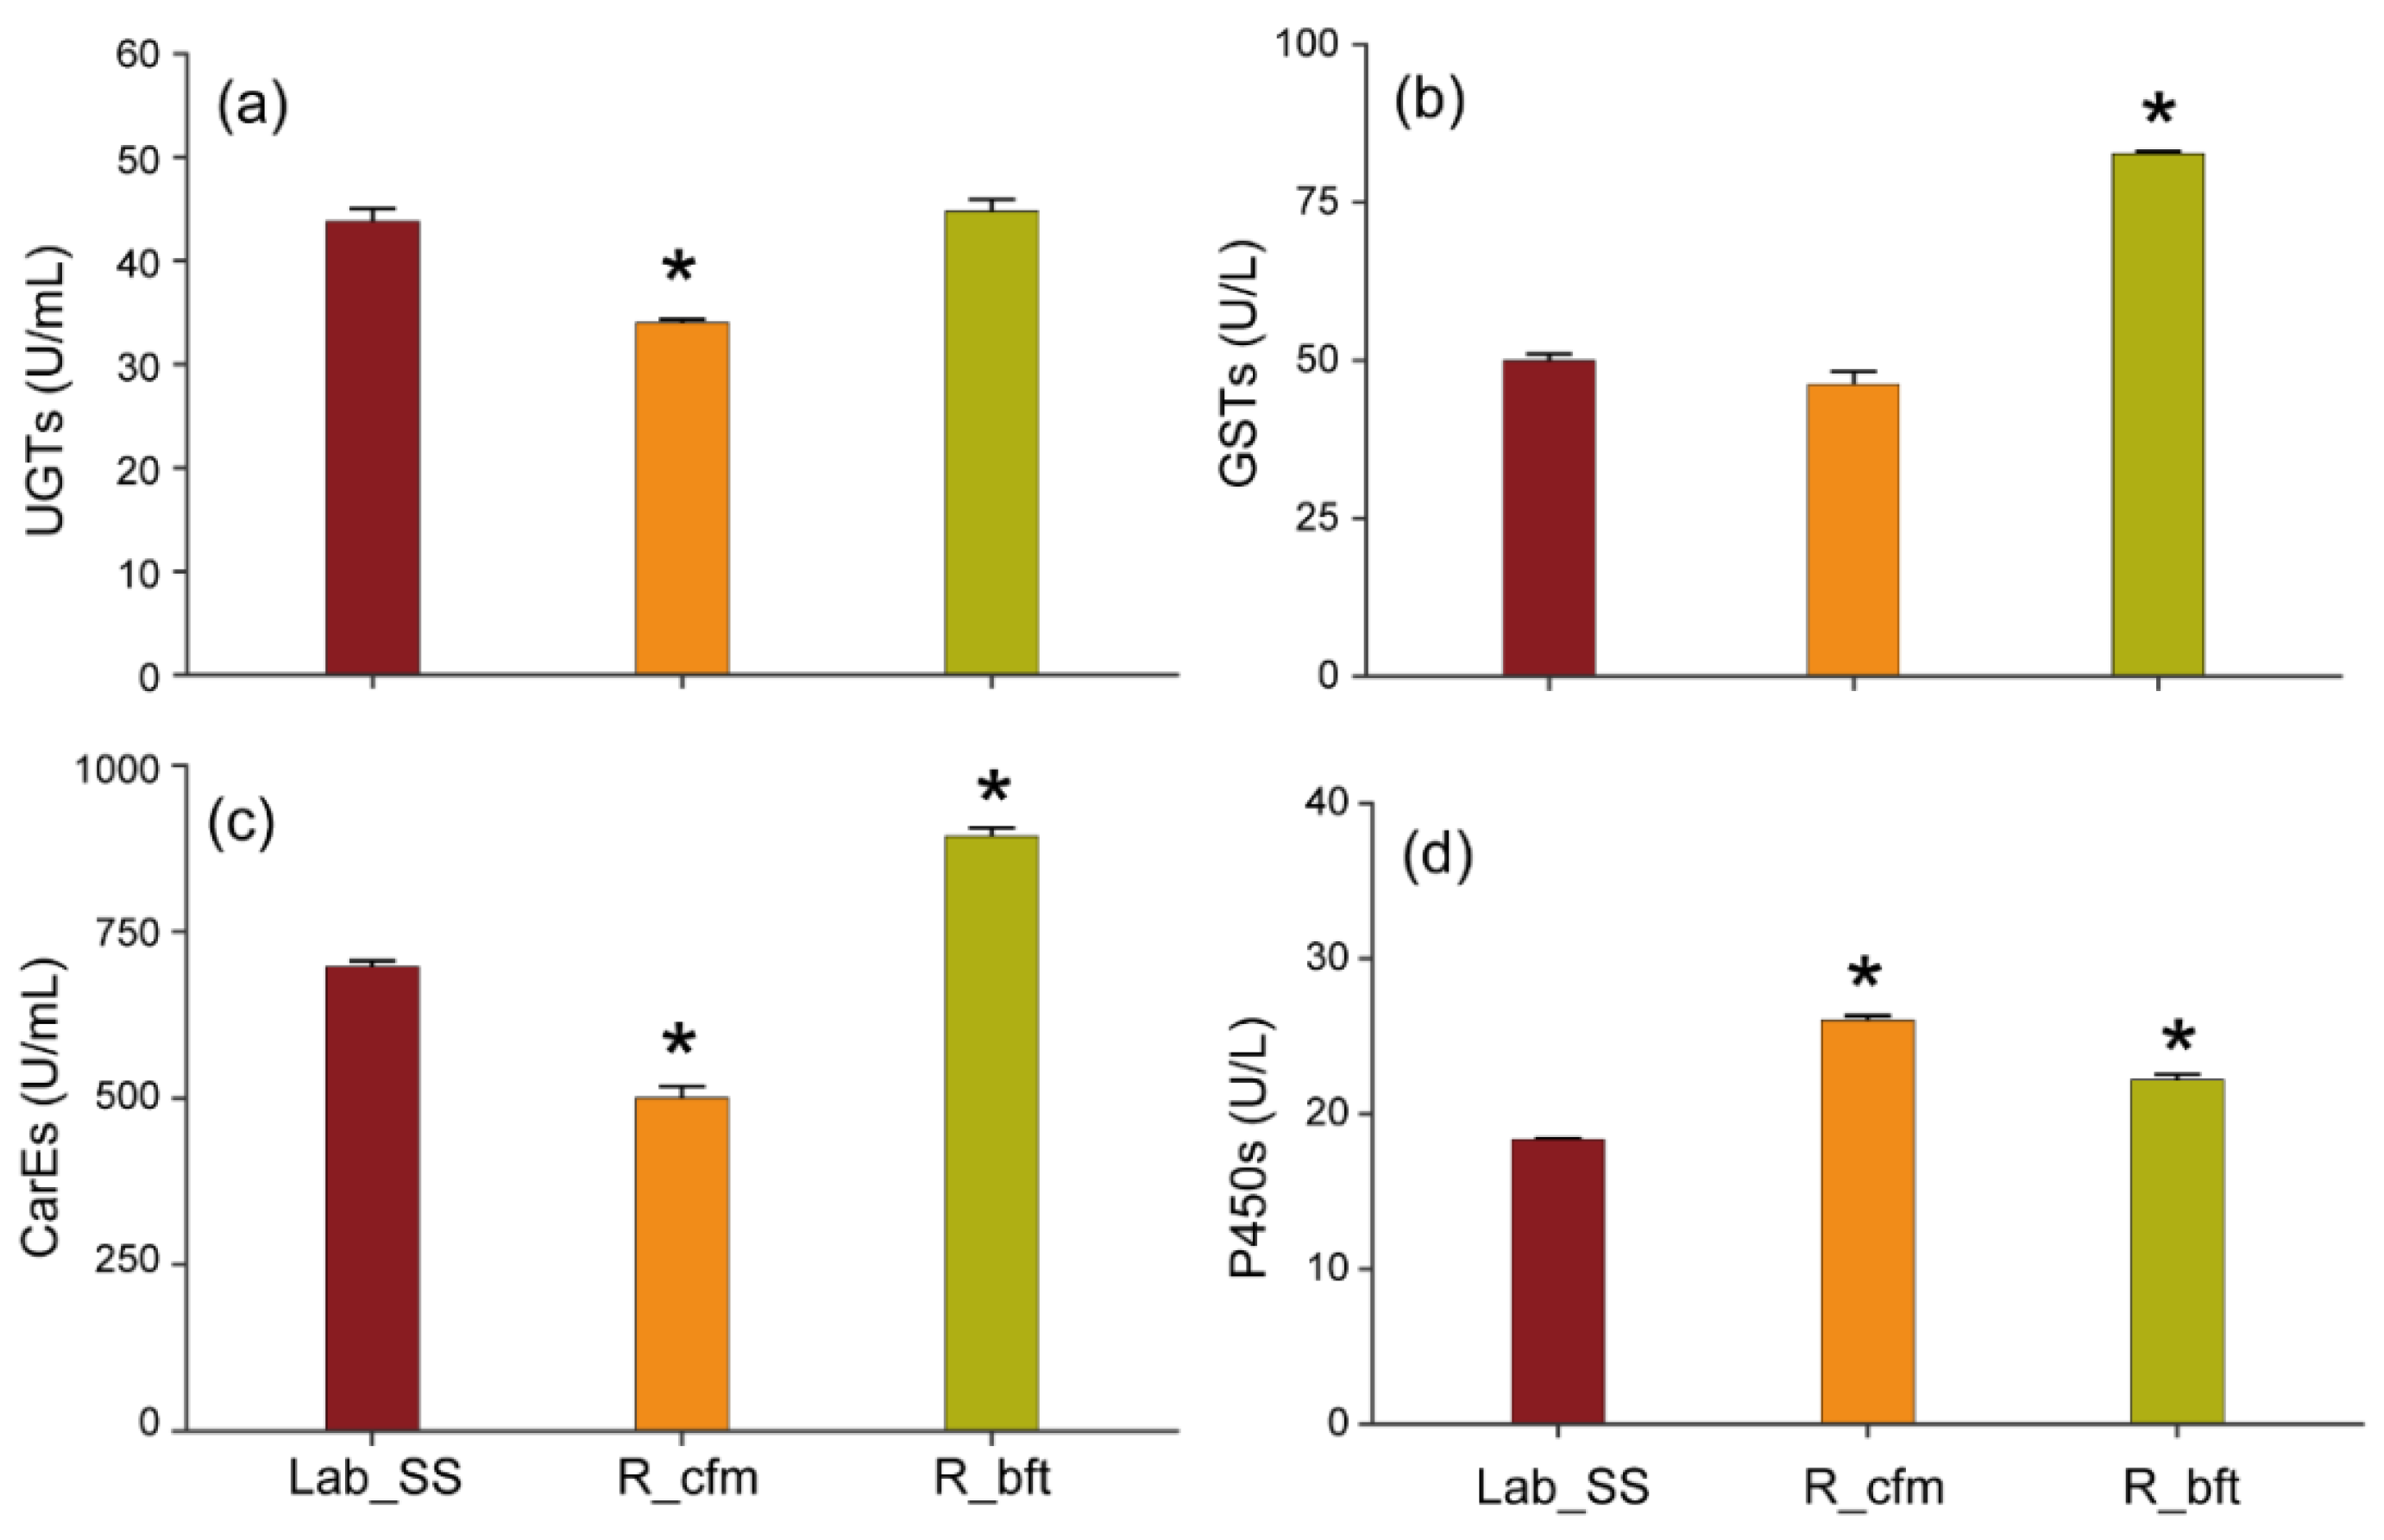
Compared with the susceptible strain (Lab_SS), the activities of UGTs and CarEs in the cyflumetofen-resistant strain were significantly decreased, with activity values of 34.02 and 500.52 U/mL, respectively (p < 0.05, Figure 2a,c). In contrast, the activity of P450s was significantly increased and the value was 26.01 U/L (p < 0.05, Figure 2d). However, the activities of GSTs, CarEs and P450s in the bifenthrin-resistant strain were significantly higher than those in the susceptible strain and the activity values were 82.71 U/L, 893.69 U/mL and 22.19 U/L, respectively (p < 0.05, Figure 2b–d).

2.3. Transcriptome Sequencing, Data Processing and Differential Gene Expression Analysis

A comparative transcriptome analysis of Lab_SS vs R_bft and Lab_SS vs R_cfm was used to elucidate the patterns of the gene expression. Six cDNA libraries were prepared for transcriptome sequencing (BGISEQ-50 platform). In total, 127.33 million clean reads for the Lab_SS strain, 124.72 million clean reads for the R_cfm strain and 128.13 million clean reads for R_bft strain were obtained. The values of Q20 and Q30 were more than 94% and 88%, respectively, denoting the sufficiency of the data in the transcriptome analysis (Table 2).
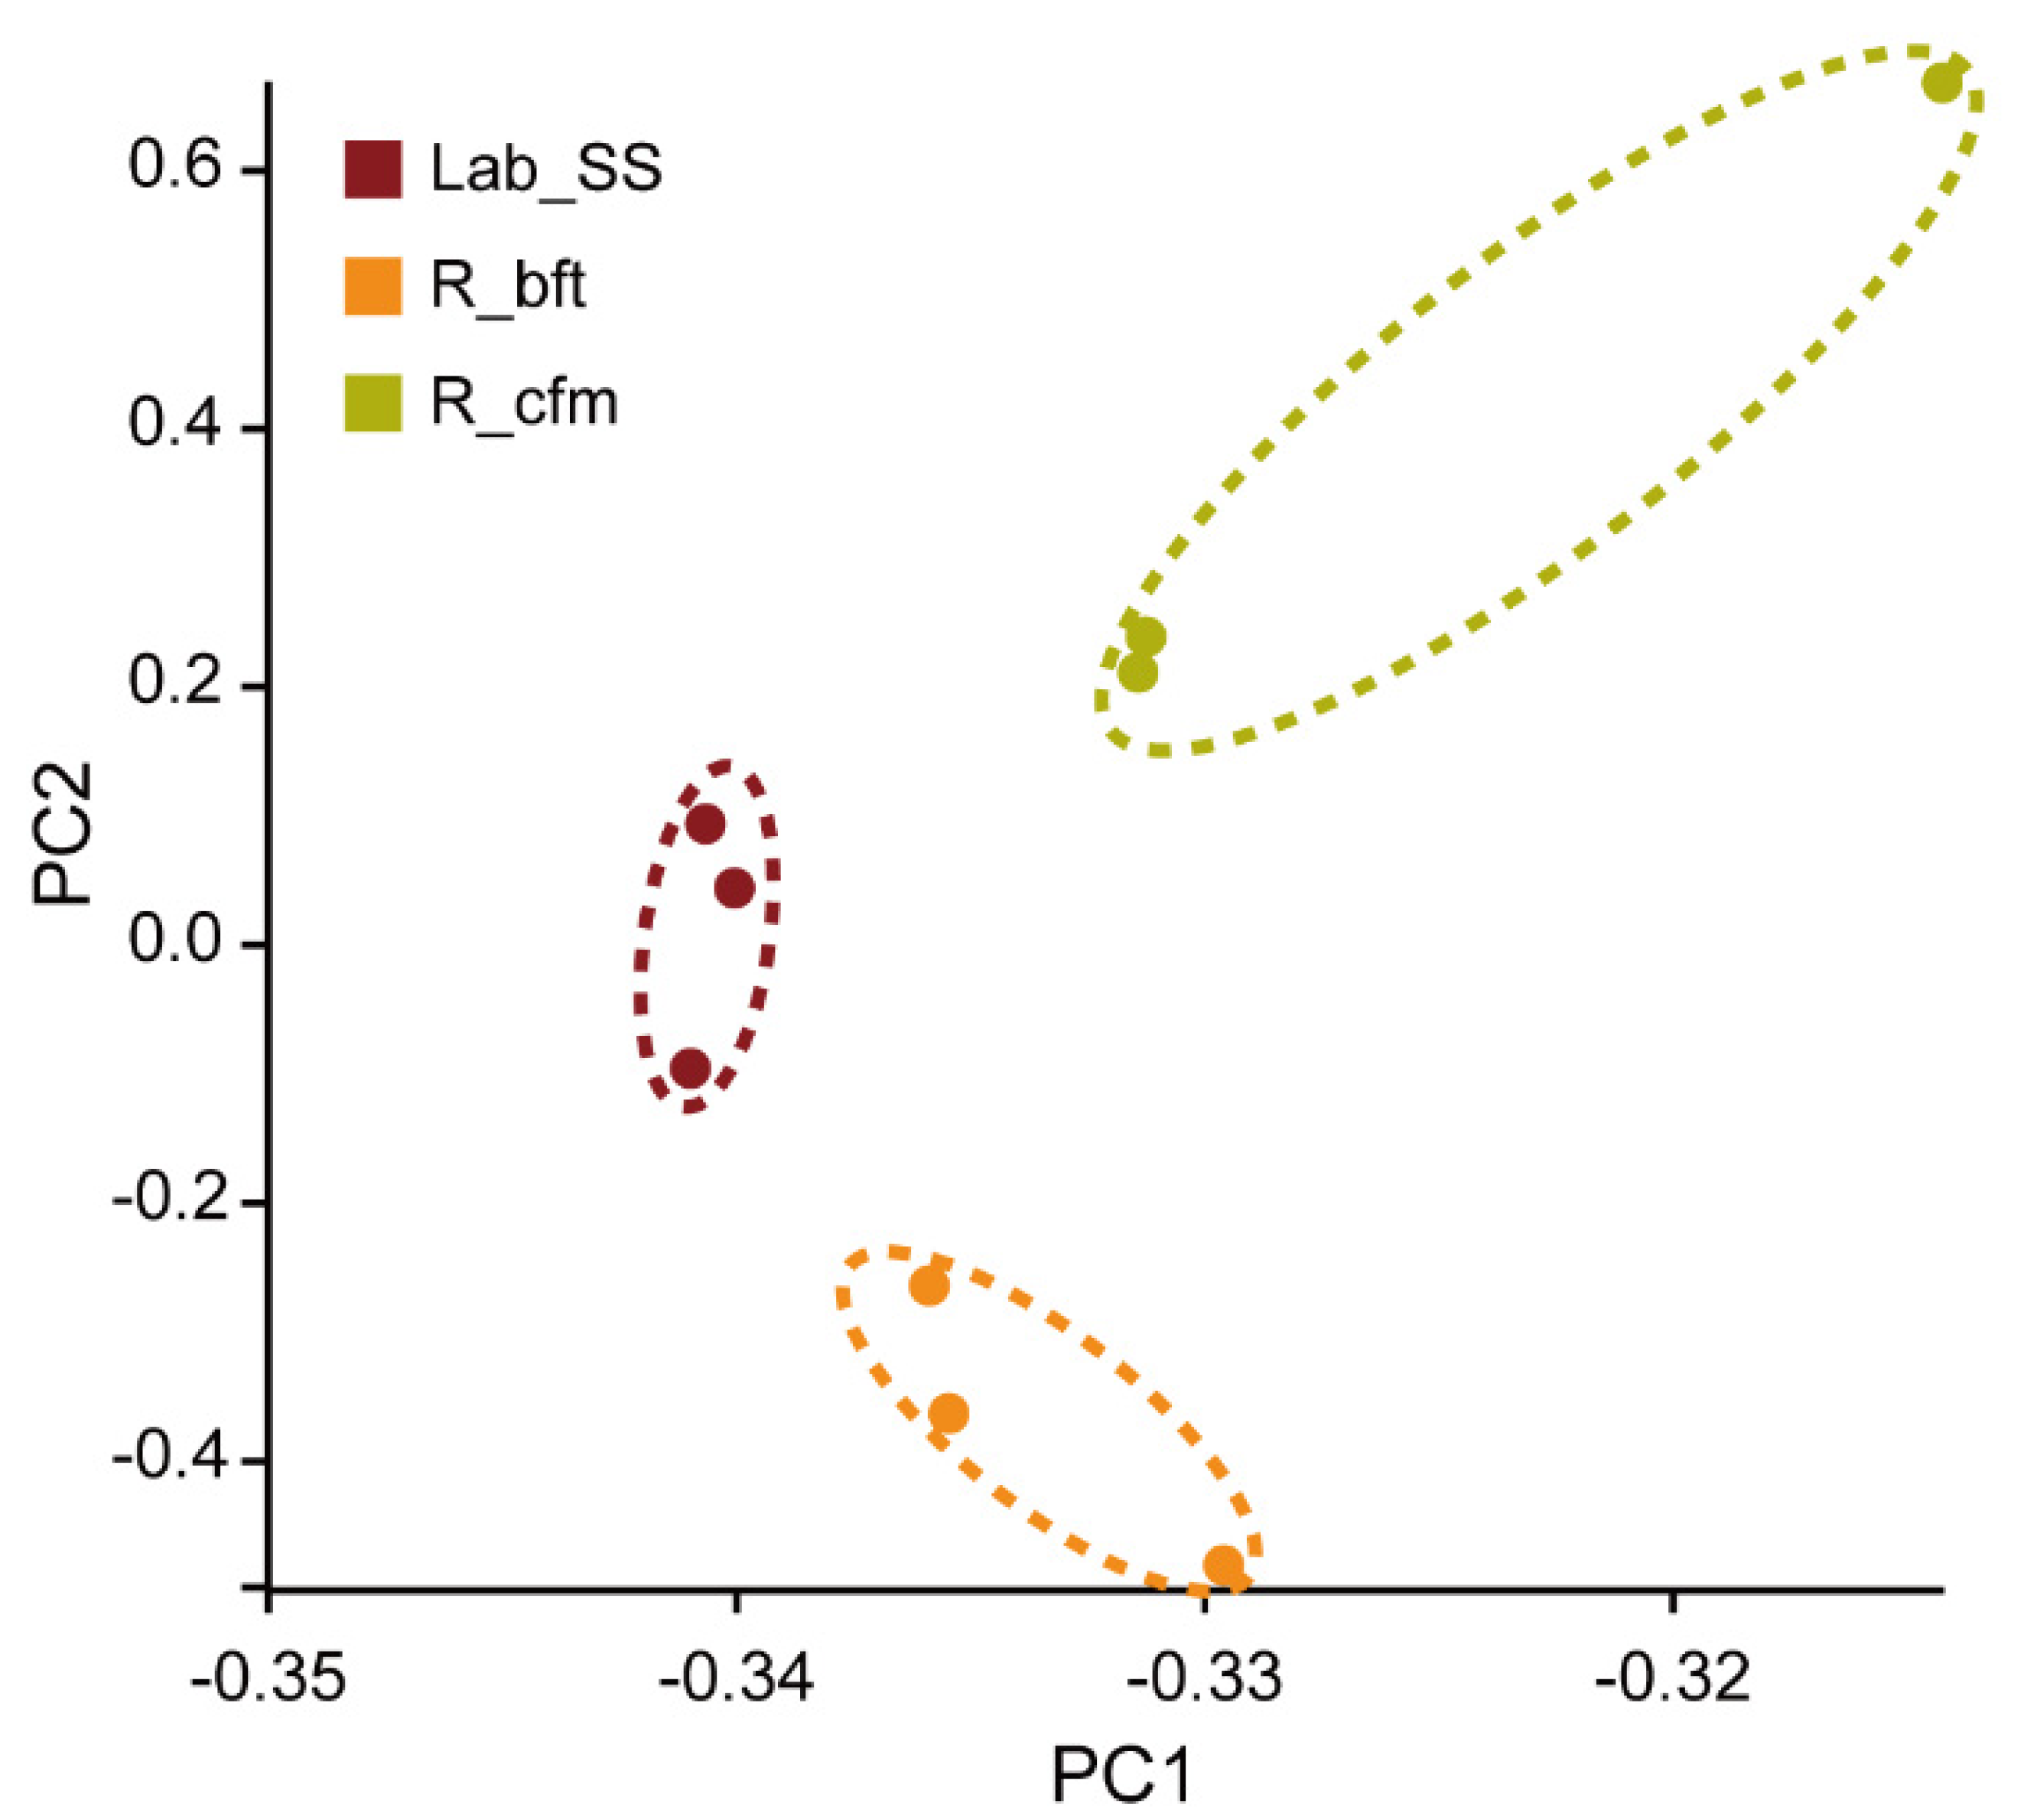
Furthermore, the principal component analysis (PCA) indicated that the gene expression in the R_cfm and R_bft strains obviously differed from that of the Lab_SS strain (Figure 3). Then, 551 and 179 differentially expressed genes (DEGs) were filtered out in the groups of Lab_SS vs R_bft and Lab_SS vs R_cfm, respectively, based on the criteria of |log2FC| ≥ 1 and FDR < 0.05 in the differential expression (DE) analysis (Figure 4).
For the Lab_SS vs R_cfm group, 109 genes were upregulated (fold change ≥ 2.00 and adjusted p value < 0.05) and 70 genes were downregulated, which was presented in the scatter plot showing the distribution of the DEGs (Figure S1a,b). Similarly, For the Lab_SS vs R_bft group, 316 genes were upregulated (fold change ≥ 2.00 and adjusted p value < 0.05) and 235 genes were downregulated, which is presented in the scatter plot showing the distribution of the DEGs (Figure S1c,d).

2.4. Functional Annotation

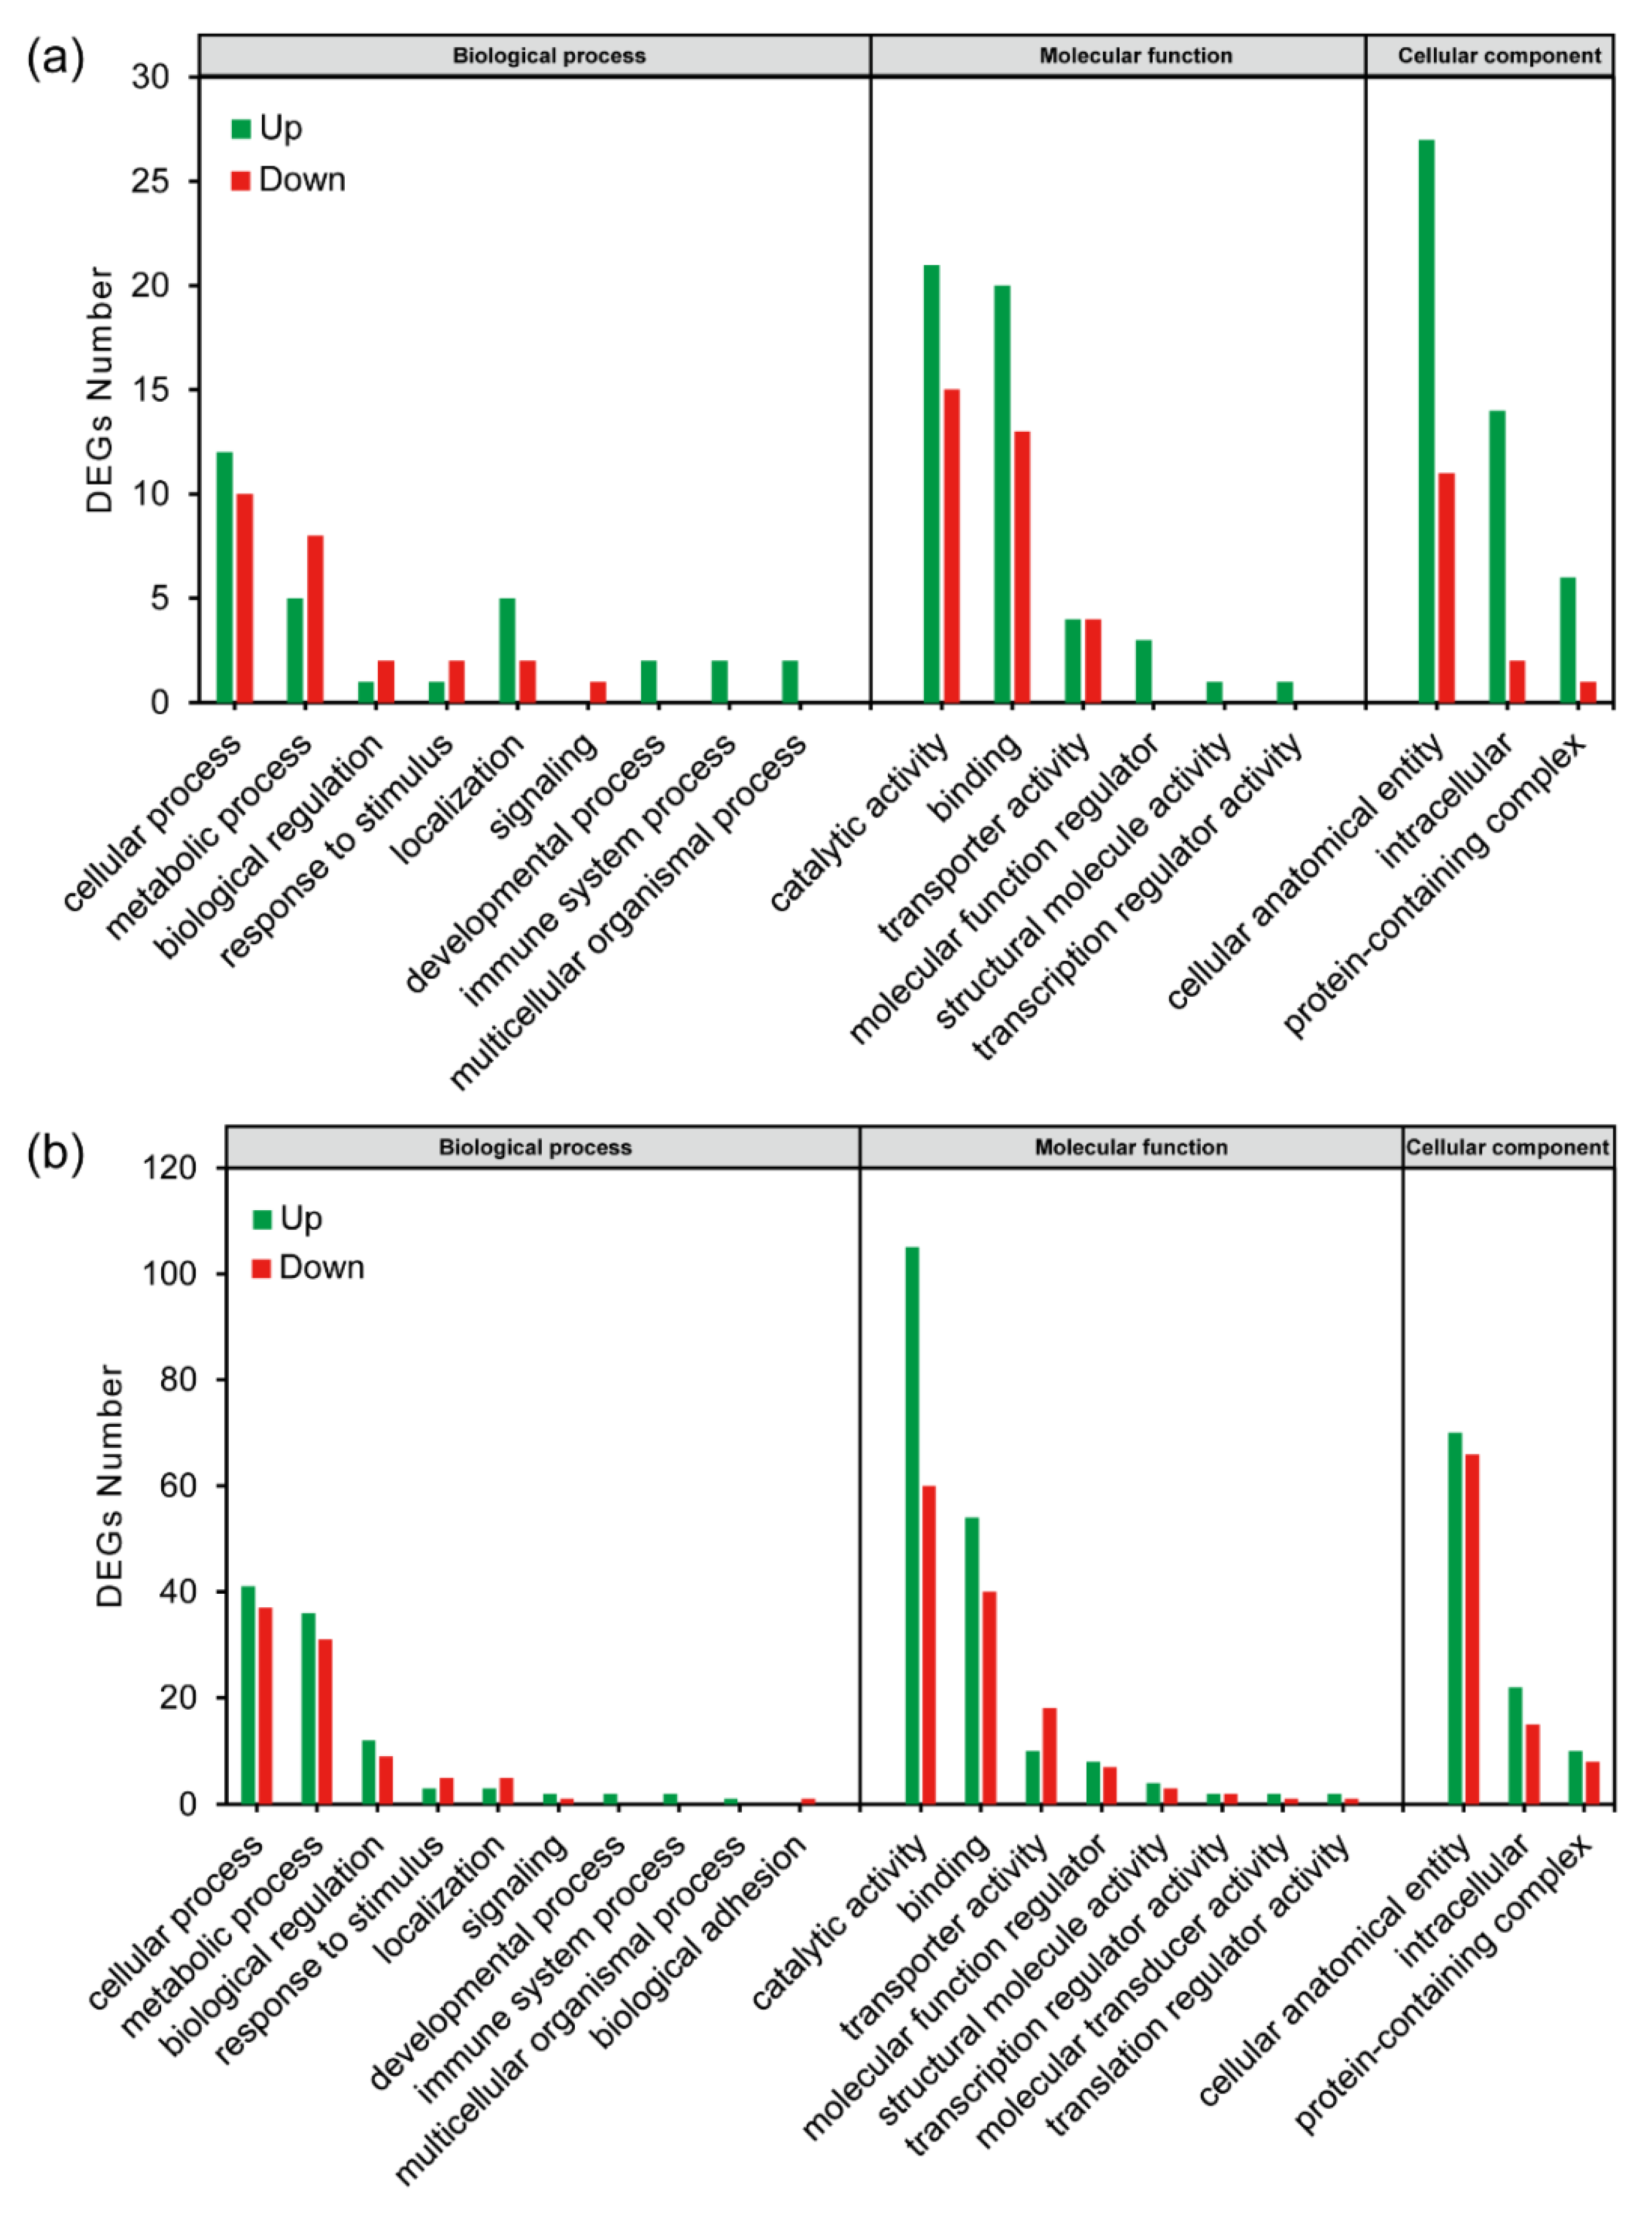
The DEGs were classified by Gene Ontology (GO) analysis. With the threshold of |log2FC| ≥ 1 and FDR < 0.05, 78 and 299 genes that were significantly differentially expressed were annotated in Lab_SS vs R_cfm and Lab_SS vs R_bft, respectively (Figure 5a,b).

2.4.1. Functional Annotation of the Lab_SS vs R_cfm Group

For the Lab_SS vs R_cfm group, the results indicated that the DEGs could be associated with 15 biological processes, 3 cellular components and 13 molecular functions (Table S1). There were 15 significantly enriched GO terms in the biological process category. Among them, four significantly enriched GO terms (DNA integration, DNA metabolic process, autophagy and process utilizing autophagic mechanism) accounted for 19.23%, 23.08%, 11.54% and 11.54%, respectively. In the cellular component category, three GO terms (nucleosome, DNA packaging complex and protein-DNA complex) were significantly enriched and accounted for the same rate of 7.89%. Furthermore, in the molecular function category, 13 GO terms were significantly enriched. In this category, endopeptidase activity, peptidase activity and peptidase activity (acting on L-amino acid peptides) were significantly enriched and accounted for 15.38%, 20.00% and 16.92%, respectively (Table S1).

2.4.2. Functional Annotation of the Lab_SS vs R_bft Group

For the Lab_SS vs R_bft group, the results indicated that the DEGs could be related to 21 biological processes, 2 cellular components and 10 molecular functions (Table S2). There were 21 GO terms significantly enriched in the biological process category. Among them, four significantly enriched GO terms accounted for more than 10.00%. They were sphingolipid metabolic process (10.48%), membrane lipid metabolic process (11.43%), cellular lipid metabolic process (16.19%) and lipid metabolic process (20.00%). However, in the cellular component category, only two GO terms were significantly enriched, which were the integral component of the membrane and intrinsic component of the membrane, respectively, and each of them accounted for the same rate of 72.46%. Meanwhile, in the molecular function category, 10 GO terms were significantly enriched. Of these 10 GO terms, four of them accounted for more than 10.00%. They were catalytic activity (67.35%), peptidase activity (13.88%), hydrolase activity (34.29%) and peptidase activity, acting on L-amino acid peptides (11.84%) (Table S2).
Overall, the multiple biological processes involved in the DEGs, the functional variety of the cellular components and the variety of molecular functions indicate that the resistance mechanism of the mites to cyflumetofen or bifenthrin is related to complicated physiological and biochemical processes.

2.4.3. Functional Annotation of the Common DEGs between the Lab_SS vs R_cfm Group and the Lab_SS vs R_bft Group

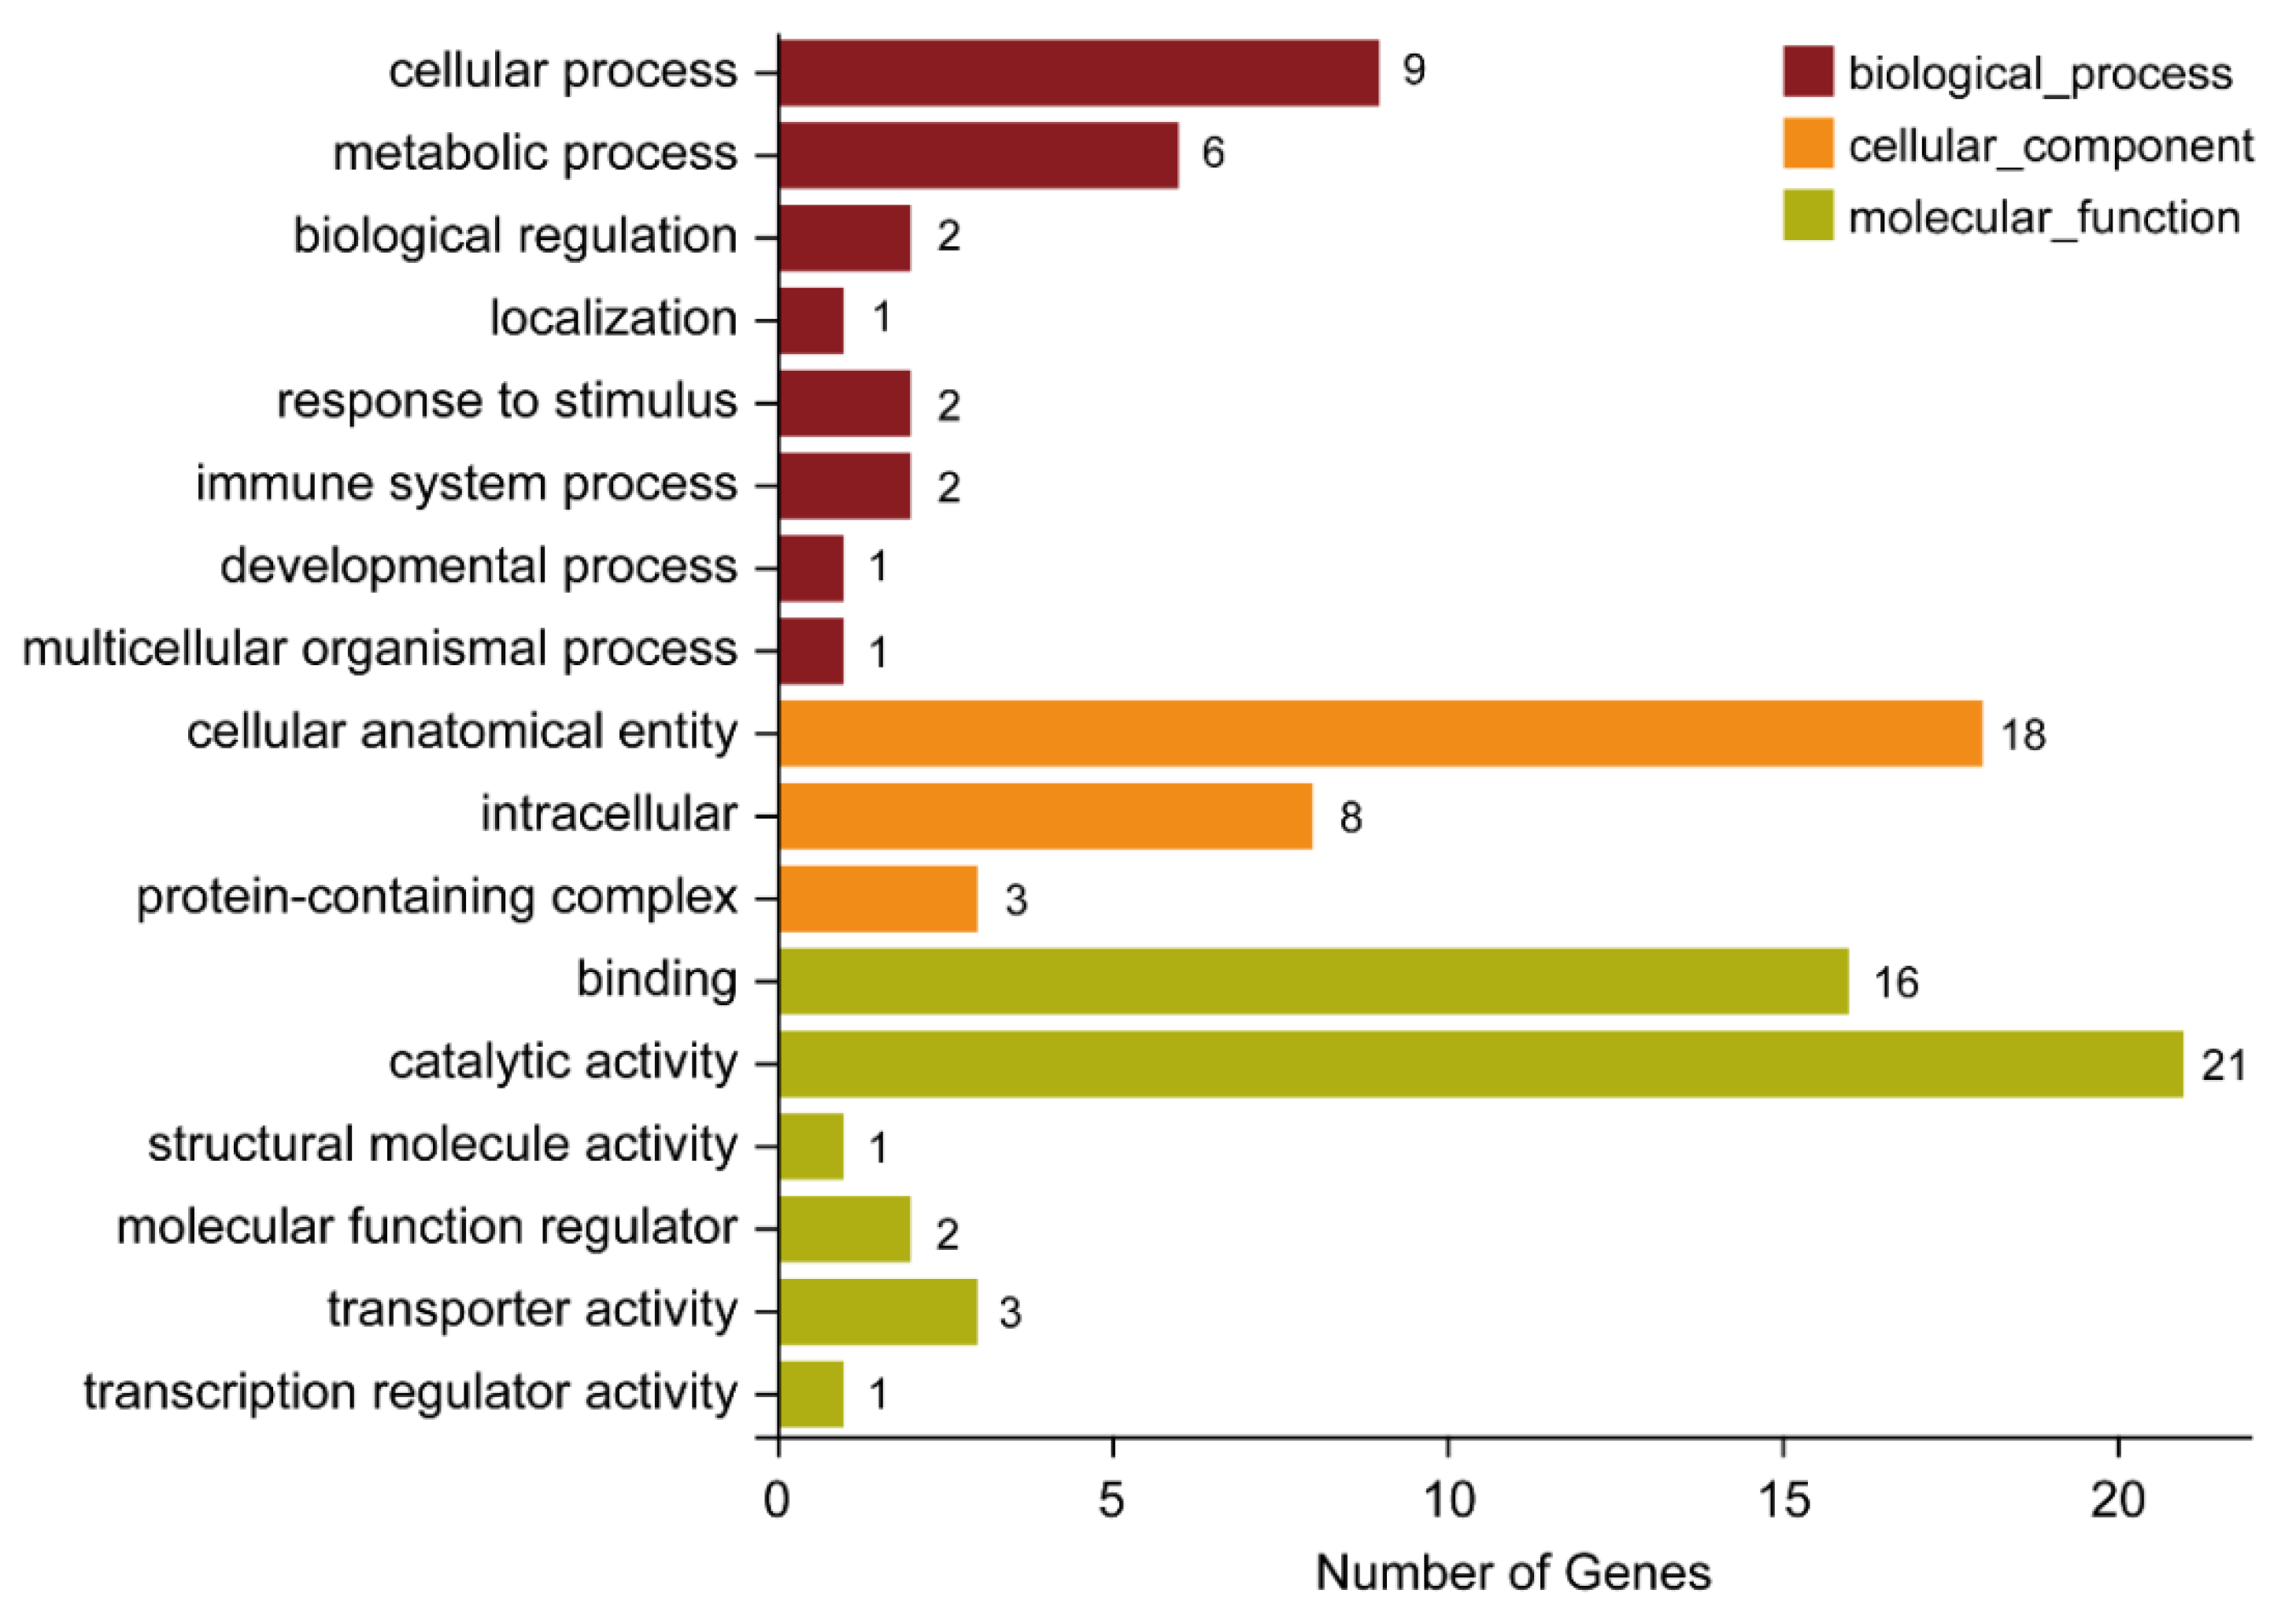
The results in Figure 4 indicated that the number of the common DEGs between the two groups (the Lab_SS vs R_cfm group and the Lab_SS vs R_bft group) was 94 (Figure 4). Among these 94 DEGs, 69 of them were significantly enriched, which could be associated with 58 biological processes, 6 molecular functions and 3 cellular components (Table S3). And among these 94 DEGs, 45 of them were classified and annotated. In the biological process category, the common DEGs of the two groups were primarily associated with cellular process and metabolic process. In detail, 9 DEGs were associated with the cellular process, while 6 DEGs were associated with the metabolic process. Regarding the molecular functions category, the common DEGs of the two groups were mainly associated with binding and catalytic activity. In detail, 16 DEGs were associated with binding, while 21 DEGs were associated with catalytic activity. In the cellular components category, the number of the common DEGs was 18 and they were associated with a cellular anatomical entity (Figure 6).

2.5. Kyoto Encyclopedia of Genes and Genomes (KEGG) Pathway Analysis

With the threshold of |log2FC| ≥ 1 and FDR < 0.05, the top 20 biological metabolic pathways were obtained in the KEGG database (Figure S2a,b).

2.5.1. KEGG Pathway Analysis of the Lab_SS vs R_cfm Group

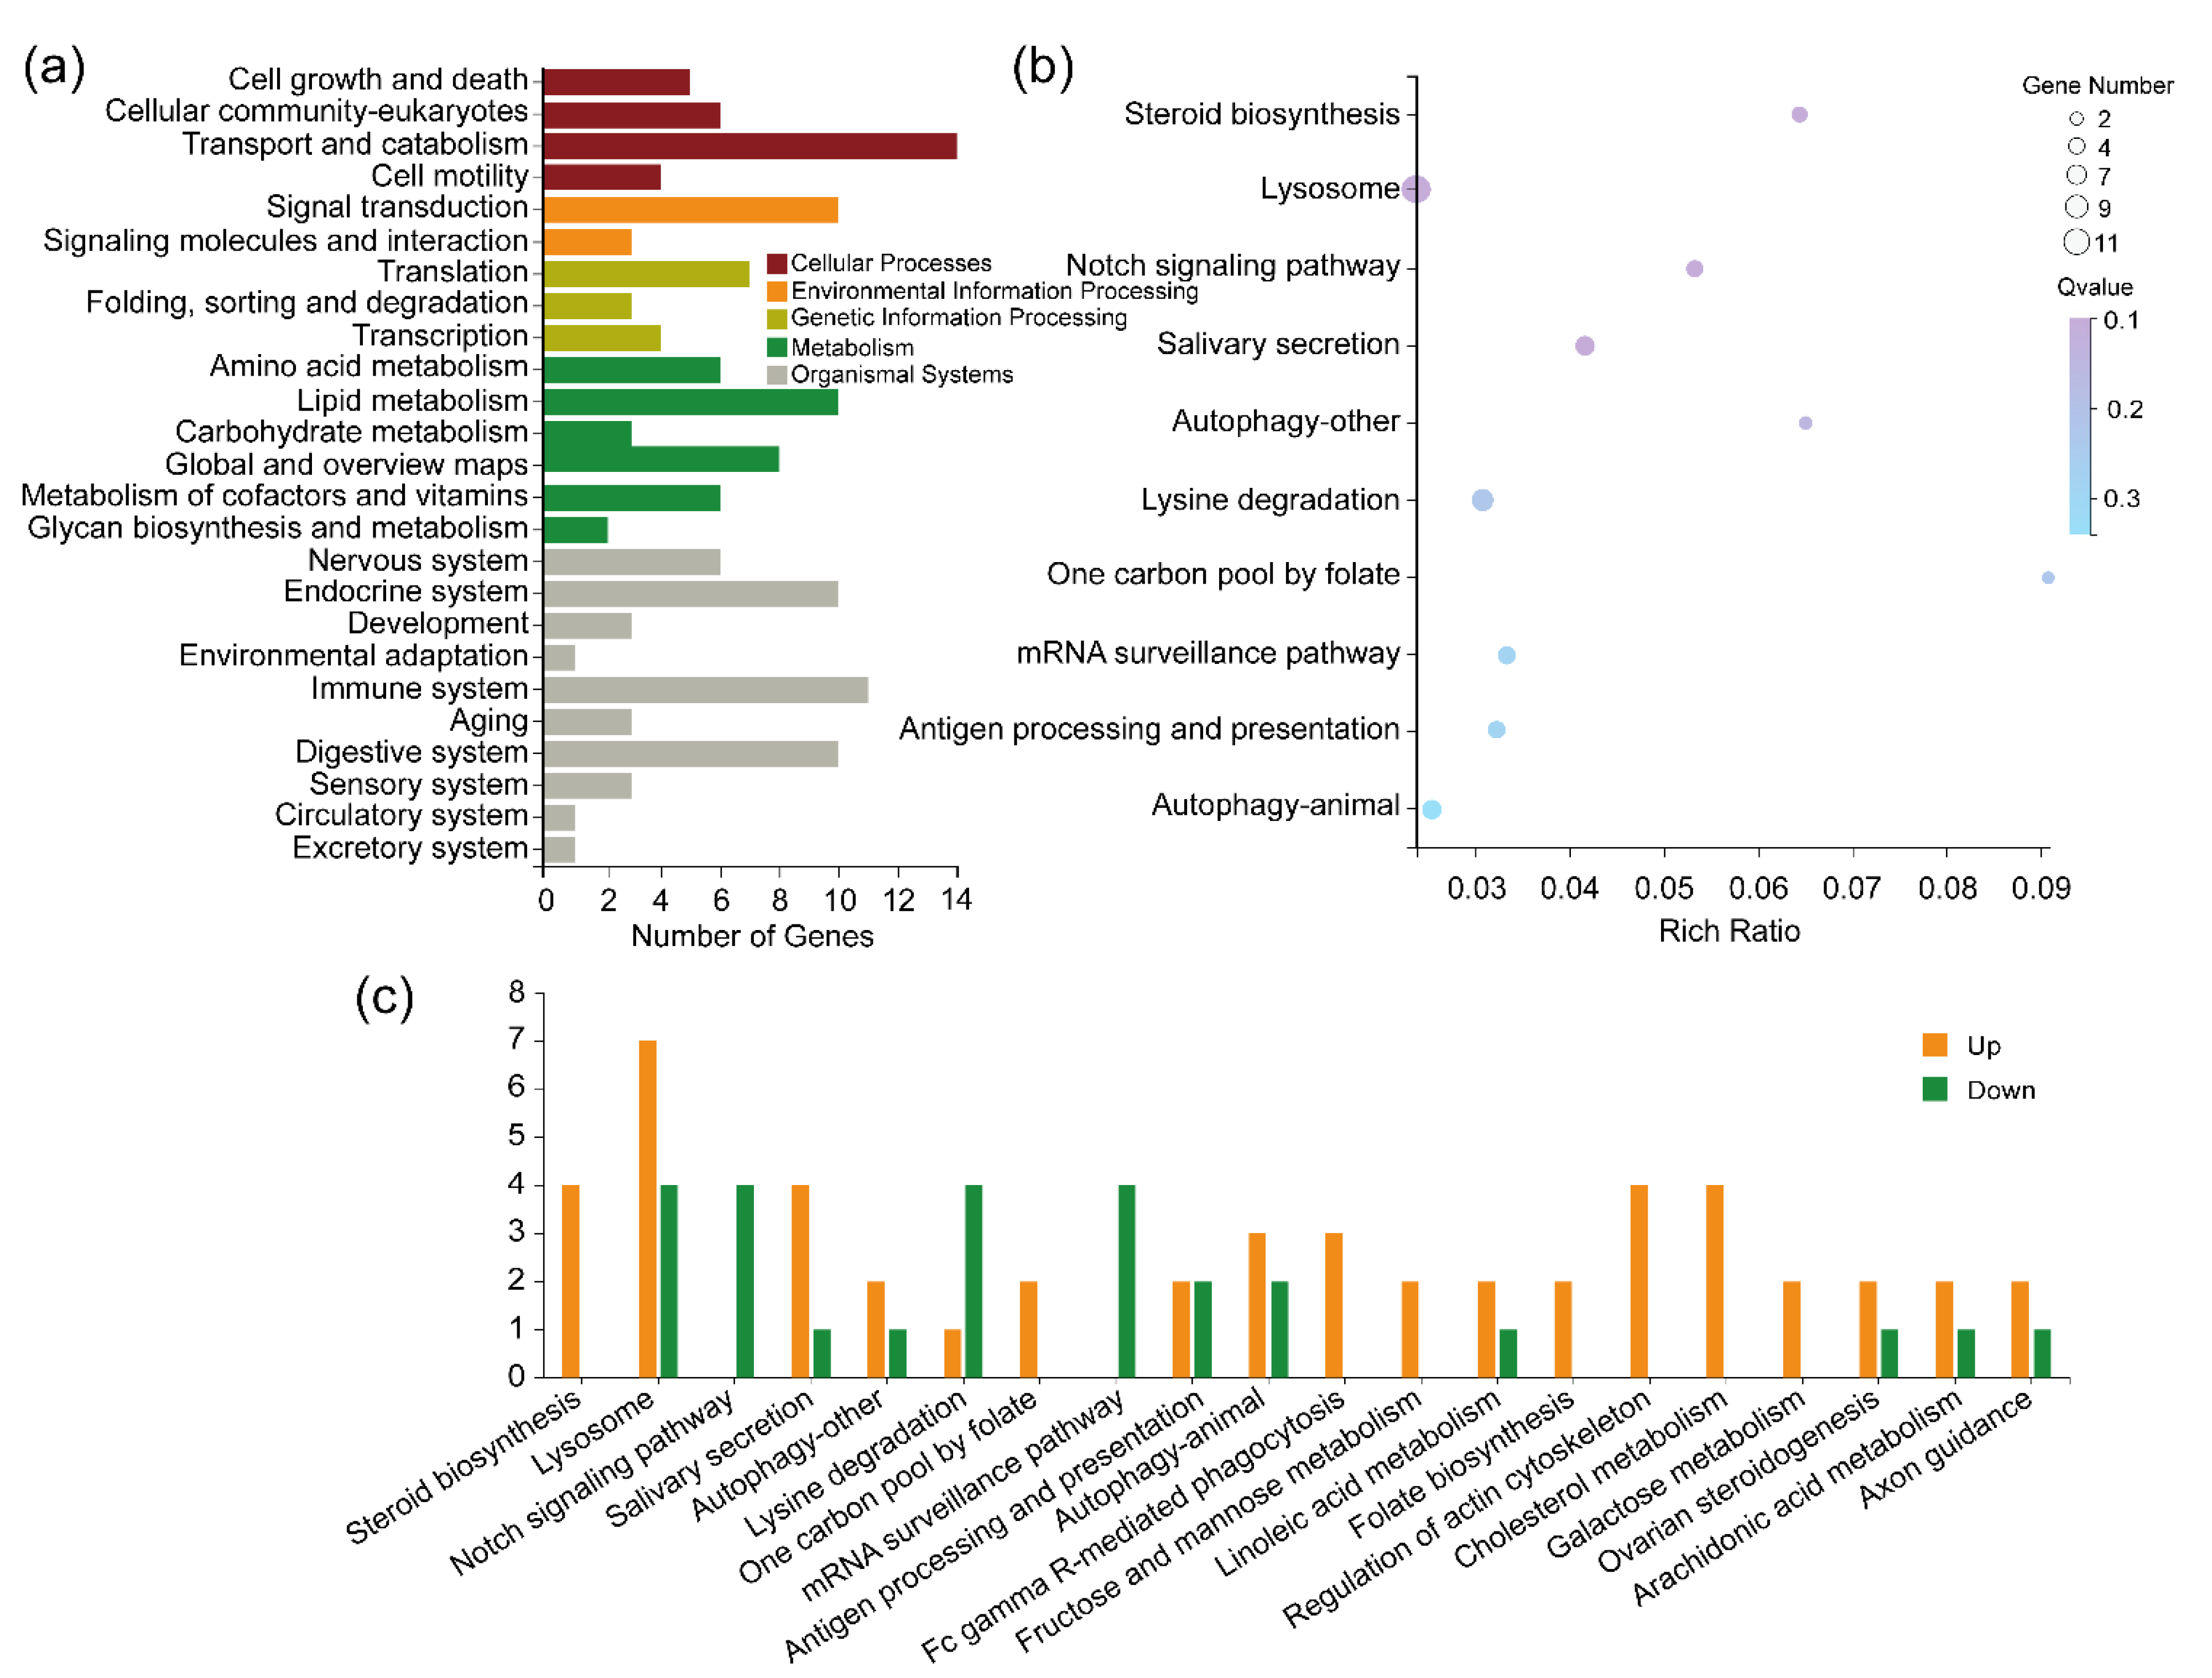
Regarding the biological functions of DEGs in the cyflumetofen-resistant strain, the KEGG enrichment analysis showed that there were 6770 annotated genes in the detected metabolic pathways (Table S4). Compared to the susceptible strain, in the cyflumetofen-resistant strain, 64 DEGs were annotated, which were primarily associated with five major metabolic pathways: cellular processes, environmental information processing, genetic information processing, metabolism and organismal systems (Table S4, Figure 7a). There were 10 significantly enriched pathways in the 87 metabolic pathways (Figure 7b). The up- and downregulated DEGs in the top 20 metabolic pathways are presented in Figure 7c. This enrichment is presented in Table S4 and indicated that these 10 significantly enriched pathways might be important for mite resistance to cyflumetofen.

2.5.2. KEGG Pathway Analysis of the Lab_SS vs R_bft Group

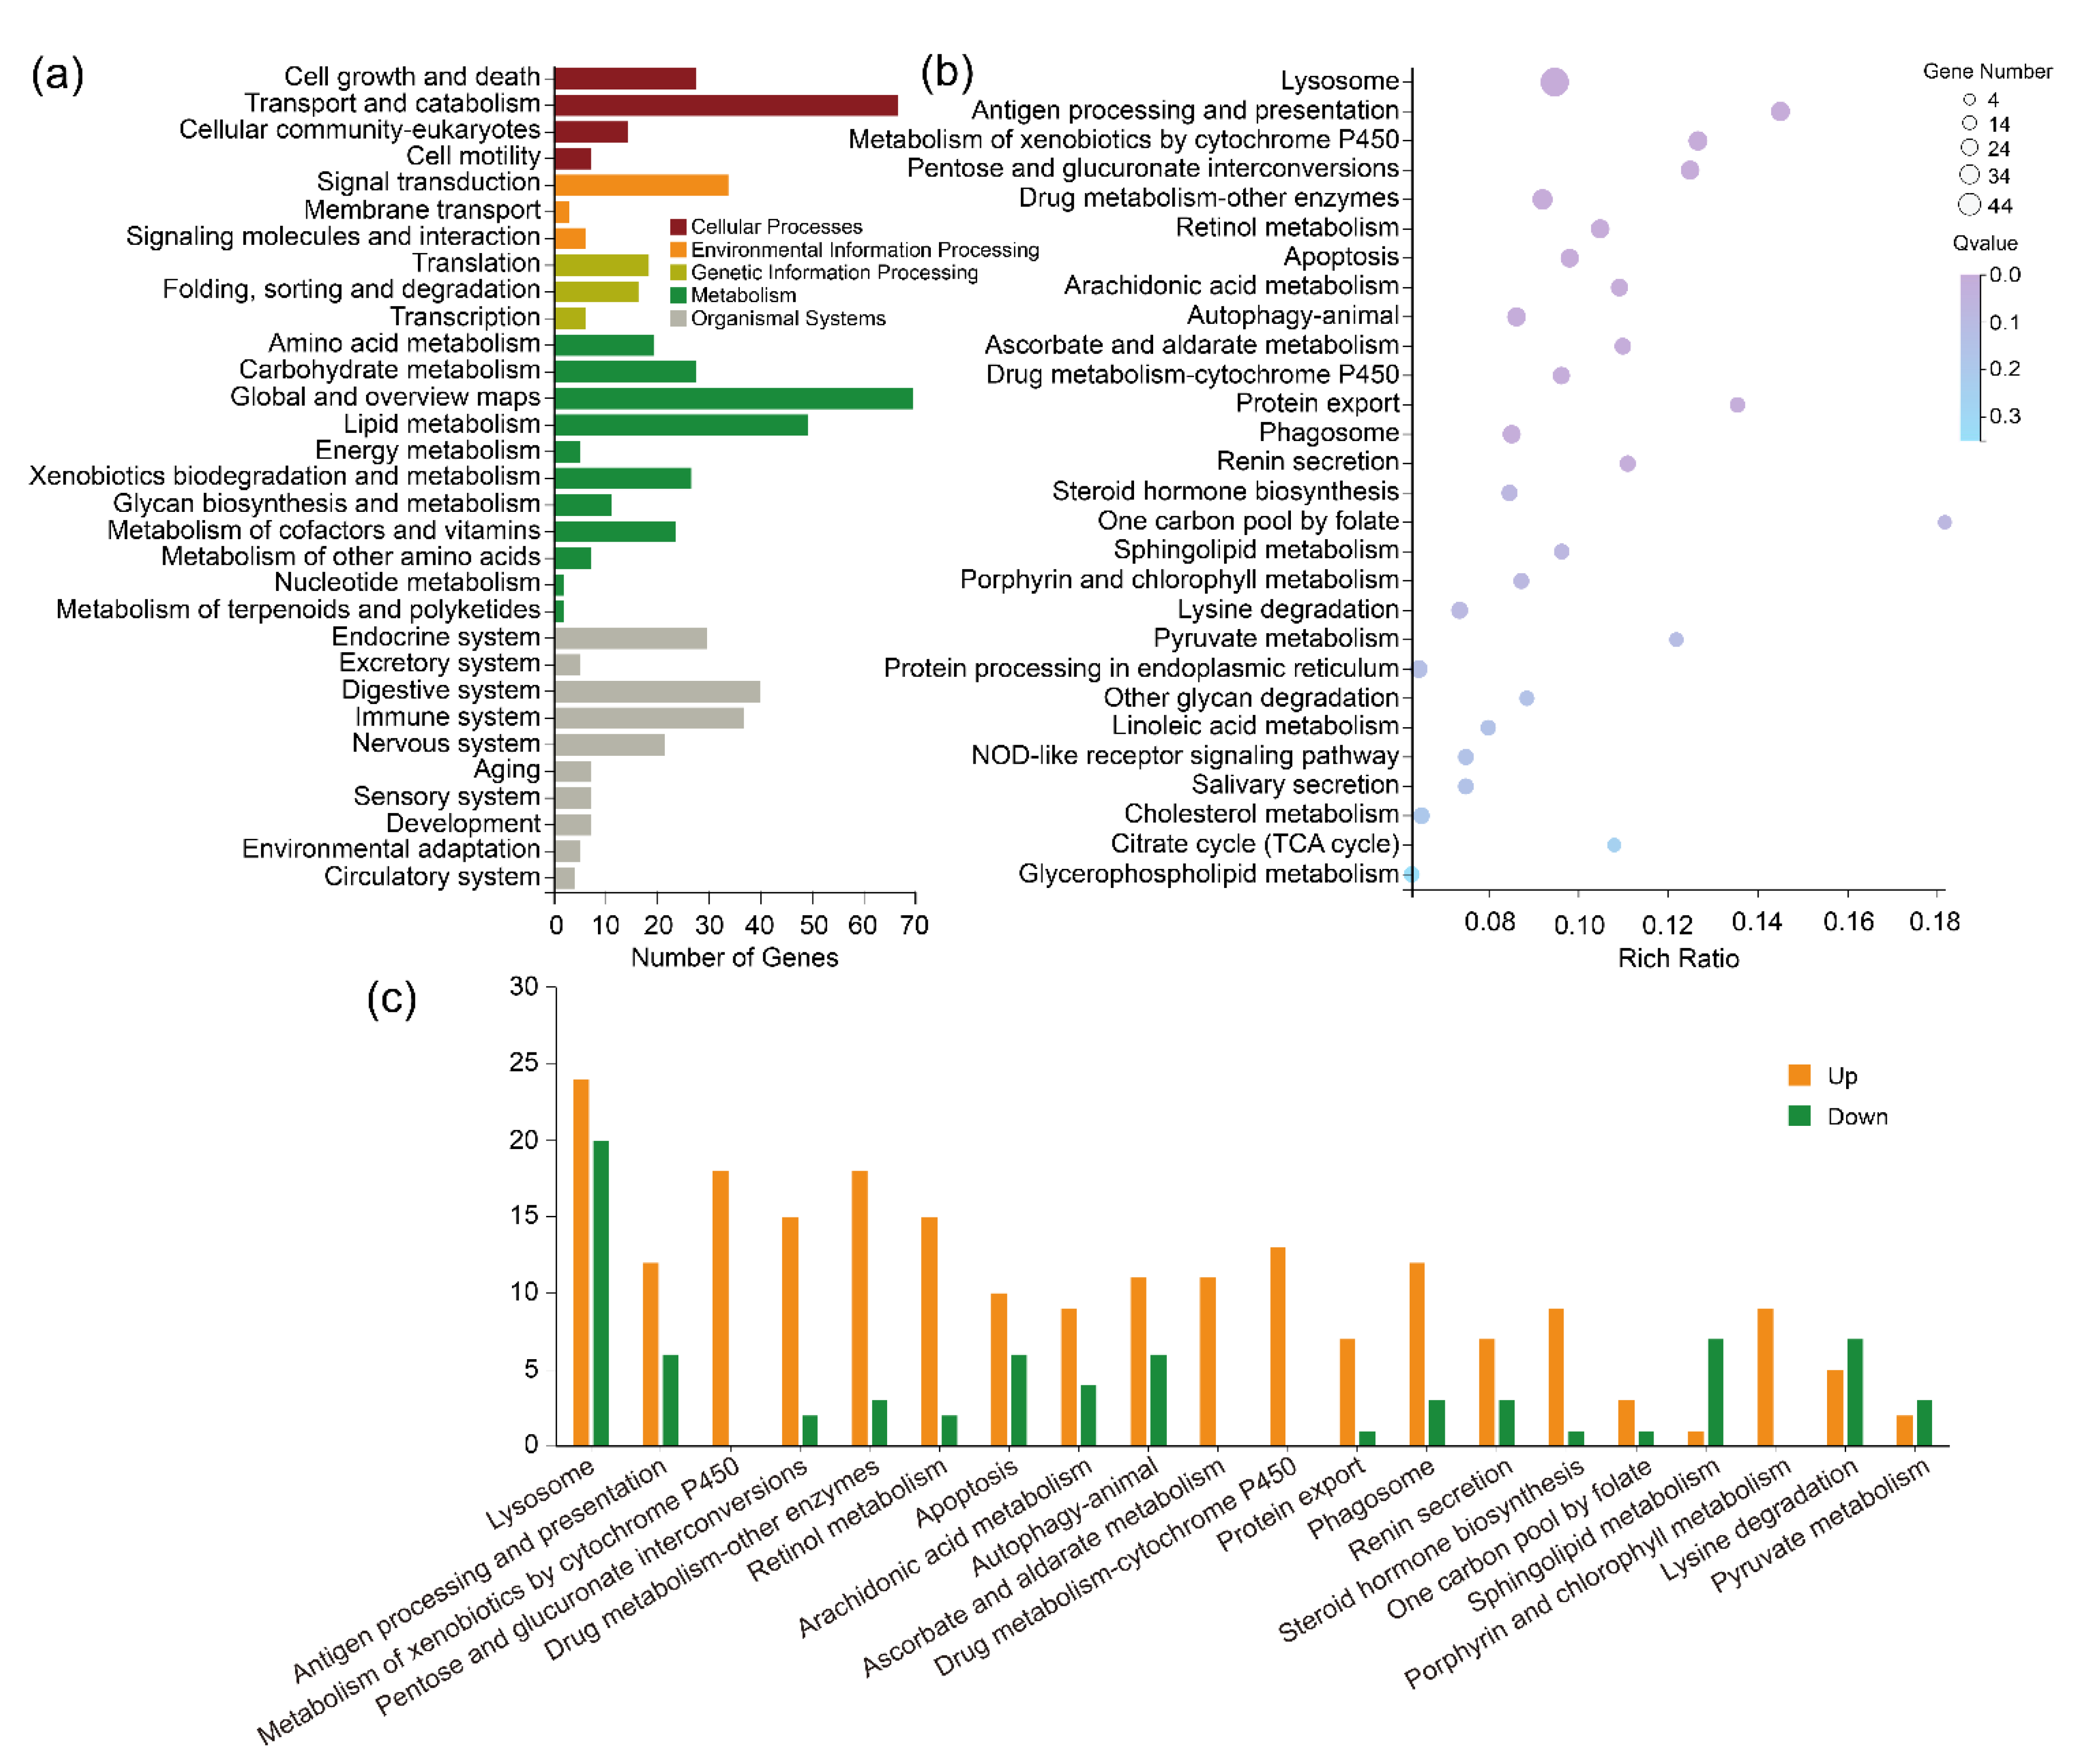
Regarding the biological functions of DEGs in the bifenthrin-resistant strain, the KEGG enrichment analysis showed that there were 6770 annotated genes in the whole of the detected metabolic pathways (Table S5). Compared to the susceptible strain, in the bifenthrin-resistant strain, 224 DEGs were annotated and majority of them were related to five major metabolic pathways: cellular processes, environmental information processing, genetic information processing, metabolism and organismal systems (Table S5, Figure 8a). It was shown that 28 of the 189 metabolic pathways were significantly enriched (Figure 8b). The up- and downregulated DEGs in the top 20 metabolic pathways are presented in Figure 8c. This enrichment was shown in Table S5 and indicated that these 28 significantly enriched pathways might be important for mite resistance to bifenthrin.

2.5.3. KEGG Pathway Analysis of the Common DEGs between the Lab_SS vs R_cfm Group and the Lab_SS vs R_bft Group

The KEGG enrichment analysis revealed that 34 of the 94 DEGs common to the two groups (the Lab_SS vs R_cfm group and the Lab_SS vs R_bft group) were annotated and they could be associated with 53 metabolic pathways, and they were primarily classified into five major metabolic pathways: cellular processes, environmental information processing, genetic information processing, metabolism and organismal systems. The up- and downregulated DEGs in the top 20 metabolic pathways are presented in Figure S3. This enrichment was shown in Table S6 and indicated that these 20 significantly enriched pathways might be important for mite resistance, both to cyflumetofen and bifenthrin.

2.6. Selected DEGs of Detoxification Enzymes of Lab_SS vs R_cfm and Lab_SS vs R_bft

Combined with the result of the GO analysis, five detoxification genes were obtained in the cyflumetofen-resistant strain compared with the susceptible population. Of these genes, two CCE genes (TuCCE46 and TuCCE70) and two P450 genes (CYP392A2p and CYP392A1) were upregulated. The upregulation fold changes of these four genes were 1.77, 1.28, 1.64 and 1.10, respectively. Additionally, CYP392E7 was downregulated (Table 3).
In the bifenthrin-resistant strain, 29 detoxification genes were identified. Among the upregulated genes in the bifenthrin-resistant strain, there were eleven CCE, nine UGT, two P450, four GST and three ABC genes. In detail, the upregulation fold changes of TuCCE46 and TuCCE70 were 3.68 and 3.09, respectively. The upregulation fold changes of CCEincTu16, TuCCE45, TuCCE44 and CCEincTu08 varied from 2.04 to 2.65. The upregulation fold changes of teturUGT16, teturUGT22 and teturUGT58p were 3.31, 2.83 and 2.29, respectively. Additionally, the upregulation fold change of CYP392D2 was 2.04. The upregulation fold changes of the other 29 genes ranged from 1.06 to 1.89 (Table 3).
Meanwhile, seven other genes of detoxification enzymes, including four CCE genes (TuCCE40, TuCCE22, TuCCE61 and TuCCE01) and three P450 genes (CYP392D7, CYP385C4v2 and CYP392A2p), were downregulated (Table 3).

2.7. Validation of Detoxification Enzyme Genes

Furthermore, five genes of the corresponding detoxification enzymes of the mite strain of Lab_SS vs R_cfm and 16 genes of the corresponding detoxification enzymes of the mite strain of Lab_SS vs R_bft were verified by qPCR.
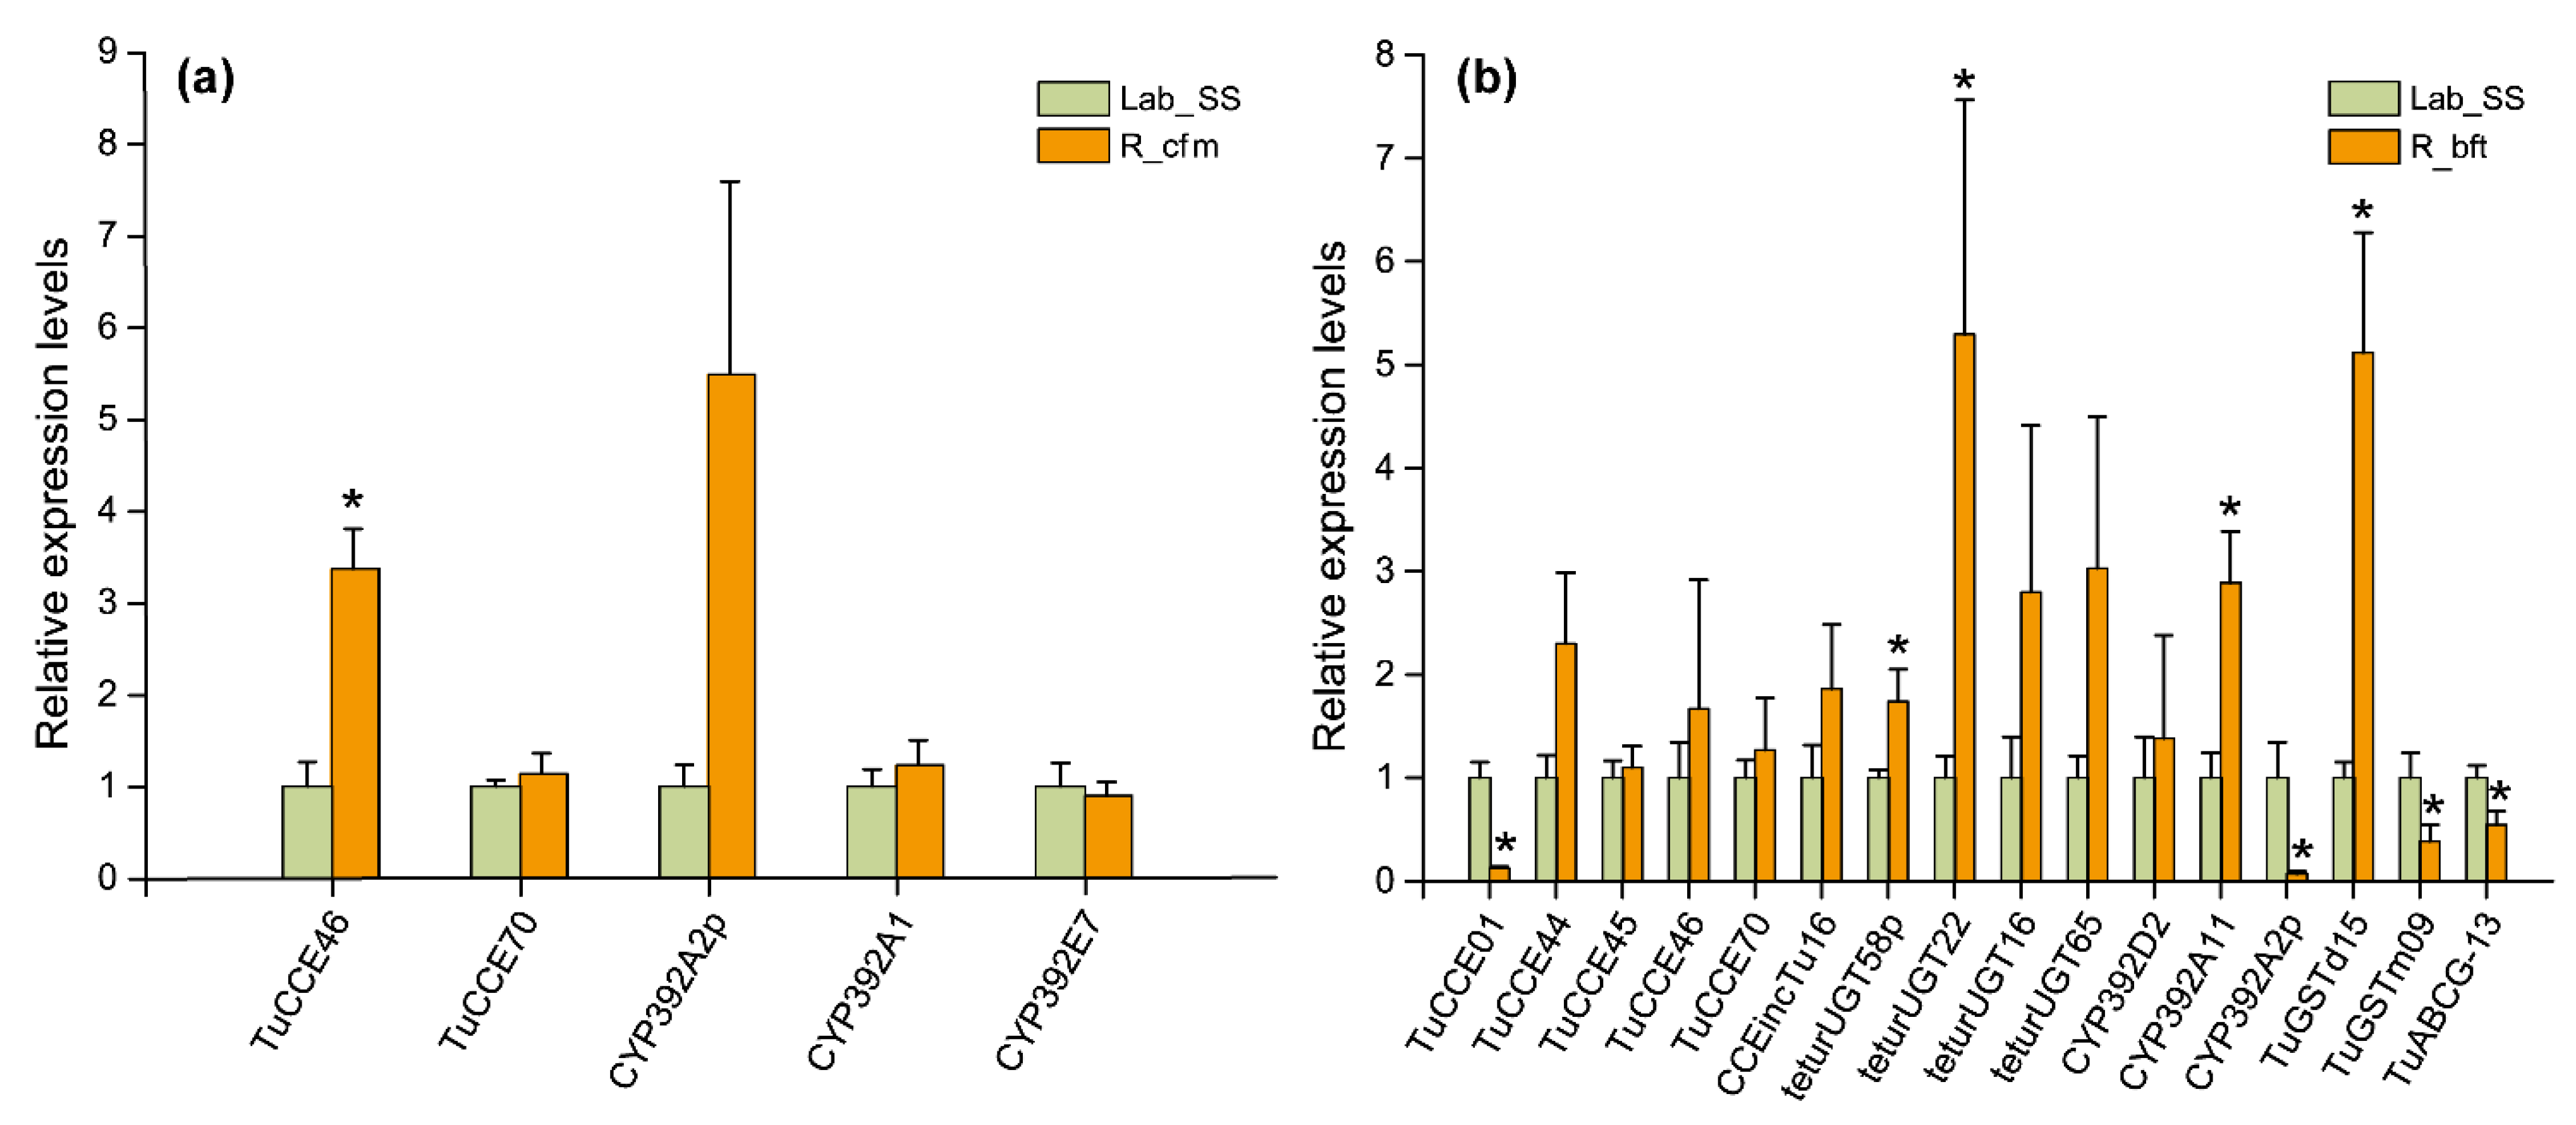
In the strain of Lab_SS vs R_cfm, the trends of variation of TuCCE46, TuCCE70, CYP392A2p, CYP392A1 and CYP392E7 were consistent with the results of the RNA-seq analysis (Figure 9a). Of these genes, TuCCE46 was significantly upregulated, with 3.37-fold higher expression than in the susceptible population.
In the strain of Lab_SS vs R_bft, the qRT-PCR data were almost consistent with the RNA-seq analysis (Figure 9b). Four genes, including teturUGT22, teturUGT58p, CYP392A11 and TuGSTd15, were significantly upregulated, whose expressions were 5.29-, 1.74-, 2.89- and 5.12-fold higher than in the susceptible strain, respectively. TuCCE01 and CYP392A2p were significantly downregulated by 0.13- and 0.07-fold compared to the susceptible strain, respectively. TuCCE46 and TuCCE70 were 1.67- and 1.27-fold higher expression than in the susceptible population, respectively. By contrast, the upregulated TuGSTm09 and TuABCG-13 in the RNA-seq analysis were significantly downregulated by 0.39- and 0.55-fold compared to the susceptible strain, respectively.

3. Discussion

From our results, we concluded that the increased P450 monooxygenase activity together with the decreased activities of UGTs and esterases were related to the high-level resistance of the mites to cyflumetofen in the enzymatic activity assays in vitro. Khalighi et al. [15] found that piperonyl butoxide (PBO, inhibitor of P450s) and S,S,S-tributyl phosphorotrithioate (DEF, inhibitor of CCEs) synergized cyflumetofen toxicity in the resistant mite strain TU008R. Similarly, Feng et al. [24] reported that the increased activities of P450s and GSTs were related to cyflumetofen resistance. Our study was in accordance with previous studies [16,22].
Previous studies reported that the detoxification of bifenthrin in T. urticae was associated with increased esterase activity rather than cytochrome P450s [15,16]. However, in our study, the activity of P450s, GSTs and CarEs increased and could thus play a vital role in bifenthrin resisitance [17,25]. Moreover, the activity of GSTs (R_bft) was significantly higher than that of the susceptible strain (Lab_SS) (Figure 1b), which is in agreement with the work described by Yang et al. in 2001 [26].
Carboxyl/cholinesterases (CCEs) participate in various metabolic reactions, including neurogenesis, xenobiotic detoxification, pheromone degradation and developmental regulation, and are thus considered major detoxification genes [14,27,28]. They play a critical role in the detoxification of commonly used pesticides including organophosphates, pyrethroids and carbamates through isolation and direct metabolism [29]. Previous studies confirmed that both upregulated and downregulated CCE genes contribute to cyflumetofen resistance [14,30]. In our study, TuCCE46 was significantly upregulated in the cyflumetofen resistant strain (R_cfm) (Figure 9a). Therefore, TuCCE46 may be pertinent to a specific upregulated esterase that could detoxify cyflumetofen and its intermediate metabolic substance [14]. However, it is yet to be verified whether the upregulated CCE genes only sequester instead of metabolizing. In addition, five upregulated CCE genes were found in the bifenthrin resistant strain (R_bft) (Figure 9b), of which upregulated TuCCE45 has been reported in a multi-resistance population [22]. Therefore, we speculated that these genes may contribute to bifenthrin resistance.
UDP-glucosyltransferases (UGTs), a gene family of glycosyltransferases, can catalyze the binding of various small lipophilic molecules to uridine diphosphate glucose (UDPG) and increase their solubility in water [31]. Therefore, glycosylation of UGTs plays a crucial role not only in the detoxification of exogenous substances but also in the biosynthesis, storage and transportation of secondary metabolites [32,33]. Vertebrate UGTs, as critical phase II enzymes, participate in endo- and xenobiotic metabolisms in detoxification and elimination [34]. In insects, compared to other enzymes such as P450s, GSTs and CCEs, the significance of UGTs has been overlooked because they are generally considered to be a secondary mechanism of enzymatic detoxification [35]. The validation result of the expression of UGT16, UGT22, UGT58p and UGT65 by qRT-PCR was consistent with that of the transcriptome sequencing (Figure 9b). Among them, UGT22 was significantly upregulated by 5.29-fold. Therefore, we assumed that these four UGT genes were related to the bifenthrin resistance in T. urticae.
The cytochrome P450 monooxygenases participate in the resistance to pyrethroids and organochlorines by catalyzing the oxidation of toxic substances in mites and insects [13,36,37,38]. Previous studies reported that the P450 genes involved in insecticides were mainly in CYP2, CYP4, CYP6, CYP9 and CYP12 families [39,40,41]. Yang et al. [41] reported that the up- and down-regulation of P450 genes may function in pesticide metabolism and participate in the homeostatic response of organisms induced by changes in the cellular environment. In this study, CYP392A11 and CYP392D2 were upregulated while CYP392A2p, CYP392D7 and CYP385C4v2 were downregulated in the R_bft strain. Moreover, three P450 genes were identified by qRT-PCR, of which CYP392A11 was obviously upregulated (Figure 9b). These findings suggest that the upregulated CYP392A11 may be highly pertinent to bifenthrin resistance. It is noteworthy that CYP392A11 has been shown to hydroxylate cyenopyrafen and fenpyroximate [42]. Liu et al. [23] reported that CYP392A1 may participate in the cyflumetofen resistance of T. cinnabarinus. However, CYP392A1 was not significantly up-regulated in the R_cfm strain of T. urticae in this study (Figure 9a).
The GSTs of T. urticae were classified into six families: Delta, Omega, Zeta, Mu, Kappa and incomplete. Among these families, the GST genes in the Delta family were related to the insect resistance [43]. A prior study found that the GST gene TuGSTd05 could directly metabolize cyflumetofen and the de-esterified form (AB-1) of cyflumetofen in the highly resistant strain of T. urticae [12]. However, in this study, GST genes associated with cyflumetofen resistance were not detected in the R_cfm strain. However, the significantly upregulated TuGSTd15 and the increased GST activity in the bifenthrin resistant strain may contribute to the resistance of T. urticae to bifenthrin (Figure 9b).
In conclusion, in the cyflumetofen-resistant strain, the enzyme activity of UGTs and CarEs decreased, while that of P450s increased. Additionally, the GSTs, CarEs and P450s increased in the bifenthrin-resistant strain. Four upregulated genes (two CCEs and two P450s) and one downregulated P450 gene were involved in the metabolic resistance of the cyflumetofen-resistant strain. However, in the bifenthrin-resistant strain, there were twelve upregulated genes (five CCEs, four UGTs, two P450s and one GST) and four downregulated genes (belonging to CCEs, P450s, GSTs and ABCs) related to its metabolic resistance (Figure 10).

4. Materials and Methods

4.1. Mites

The original parent strain of T. urticae (Lab_SS), which has been reared in the laboratory for more than 6 years without exposure to any acaricide, obtained from the Institute of Plant Protection, Chinese Academy of Agricultural Sciences. The mite was lab-reared on kidney beans (Phaseolus vulgaris) in a growth chamber at 20–30 °C, 60–70% RH and L12:D12 h [44]. Then, the colony was maintained at 16:8 (L:D) h at 25 ± 1 °C with 50–60% RH.

4.2. Reagents

Acaricides (96% cyflumetofen, CAS: 400882-07-7; and 97.2% bifenthrin CAS: 82657-04-3) were purchased from Sigma-Aldrich Co. (Saint Louis, USA). ELISA kits were purchased from Jiangsu Boshen Biotechnology Co., Ltd. (Nanjing, Jiangsu, China). The Total RNA Kit II was purchased from Omega (Seoul, Korea).

4.3. Resistance Selection

Based on the previous method [45], the cyflumetofen or bifenthrin resistance population was selected under laboratory conditions. Cyflumetofen or bifenthrin was diluted with and 40% acetone and water (v/v). Then, cyflumetofen or bifenthrin was sprayed on cowpea leaves in order to exert a selection pressure. The concentration of each spraying was the last LC50. Then, 48 h after spraying, the survivors were transferred to fresh young cowpea leaves. The next selection cycle continued when the population recovered and then increased. After each selection, the concentrations of cyflumetofen or bifenthrin increased accordingly. The spray of cyflumetofen or bifenthrin was conducted at an interval of 14 days.

4.4. Bioassays of Cyflumetofen- and Bifenthrin-Resistant Strains of T. urticae

Owing to the phenomenon of the mites escaping into the surrounding water after cyflumetofen treatment, the slide dip method was used to measure the mortality of the cyflumetofen-resistant strain [46]. Specifically, a 2 × 2 cm piece of double-sided adhesive tape was attached to one side of glass microscope slides, and then, 30 adult female mites were affixed to the tape by their dorsal surface. Note that the feet and mouthparts of mites should not be stuck to the tape. The glass microscope slides were placed in a tray covered with wet cotton and then incubated at 26 °C. After 4 h, the dead or inactive individuals were removed and new active female adults were supplemented. Then, five concentrations of cyflumetofen obtained by diluting cyflumetofen solution with water and 40% acetone and the control (i.e., water and 40% acetone) were used for testing. Each concentration had three replicates. Slides were dipped into the solution of cyflumetofen for 5 s. Then the slides were taken out and placed on a paper towel to dry. The extra solution was moved from the slides with filter paper. The treated slides, lined with slightly moistened paper towels, were left in the plastic tray with a cover and incubated under the condition of 16:8 (L:D) h at 25 ± 1 °C with 50–60% RH. The mortality criterion used for this method was the inability to move a leg when lightly prodded. After 24 h, the mortality of the cyflumetofen-resistant strain was determined using a microscope.
The mortality of the bifenthrin-resistant strain was measured according to the leaf residual toxicity method recommended by the FAO [46]. Briefly, five concentrations (with a 2-fold increase between concentrations) of bifenthrin were obtained by diluting the stock solution of bifenthrin (dissolved in acetone) with 0.1% Tween water and 40% acetone. The control contained 0.1% Tween water and 40% acetone. Then, cowpea leaf discs (4 cm in diameter) were dipped into the solution of bifenthrin for 10 s and subsequently placed on Petri dishes filled with water to dry naturally. Furthermore, 20 adult females of T. urticae were gently transported to each of the leaves using a soft brush. The petri dishes were kept in incubators under a cycle of 16:8 (L:D) h at 25 ± 1 °C and 50–60% RH. After 48 h, the mortality of the cyflumetofen-resistant strain was determined using a microscope. The mortality criterion was the same as the abovementioned.
The LC50 value was determined by the corrected mortality calculated with Abbott’s formula. The bifenthrin-resistant strain (R_bft) and the cyflumetofen-resistant strain (R_cfm) were cultivated following the abovementioned process. The resistance ratio (RR) was calculated as the following [47]:
RR = LC50 of resistant population/LC50 of susceptible population

4.5. Determination of the Activity of the Detoxification Enzymes UGTs, GSTs, CarEs and P450s

The activity of UDP-glucuronosyltransferase (UGTs), glutathione-S-transferases (GSTs), carboxylesterase (CarEs) and cytochrome P450 monooxygenases (P450s) was assayed with ELISA kits [48,49,50]. In detail, about 250 female adults (2.5–3.3 mg) were rinsed with cold phosphate buffer (PBS) (pH = 7.4), then dried with absorbent paper and finally put into a 5-milliliter homogenate tube. Then, the homogenization medium was added into the homogenate tube with a ratio of weight (mg, i.e., mites) to volume (mL, i.e., homogenization medium) of 1:9 and evenly grinded. Subsequently, the obtained homogenate was centrifuged at 3000 r/min for 10–15 min, and the supernatant was used for further analysis. The Bicinchoninic Acid (BCA) protein content determination kit was used to test the protein content of the supernatant. Then, the Insect UGTs ELISA kit (BS-E19272O2, Jiangsu Boshen Biotechnology Co., Ltd., Nanjing, Jiangsu, China), Insect GSTs ELISA kit (BS-E19119O2, Jiangsu Boshen Biotechnology Co., Ltd., Nanjing, Jiangsu, China), Insect CES ELISA kit (BS-E19073O2, Jiangsu Boshen Biotechnology Co., Ltd., Nanjing, Jiangsu, China) and InsectCYP450Oase ELISA kit (BS-E19093O2, Jiangsu Boshen Biotechnology Co., Ltd., Nanjing, Jiangsu, China) were applied to determine the enzyme activity of UGTs, GSTs, CarEs and P450s, respectively.

4.6. Transcriptome Sequencing

4.6.1. Total RNA Extraction, Library Construction and RNA-Seq

Three biological replicates of 200 female T. urticae adults from three strains, namely Lab_SS, R_cfm and R_bft, were used for the total RNA extraction with the Total RNA Kit II (R6830-02, Omega, Seoul, Korea) [51,52]. The quality of total RNA was assessed using 1% agarose gel electrophoresis. Then, the concentration and purity of the nine extracted RNA samples were tested using a NanoDrop One device (Thermo Scientific, USA). First, the Standard Sensitivity RNA Analysis Kit (15 nt) was used to detect the concentration of total RNA and 28S/18S and RIN values to determine whether the samples met the requirements for database construction. Then, total RNA was processed with rRNA depletion to obtain purified RNA. Subsequently, the enriched mRNA was fragmented to synthesize first-strand cDNA and the second cDNA, and the modified double-stranded DNA was enriched by PCR amplification. The PCR product was thermally denaturized into single-strand cDNA, and then, the single-strand DNA was cycled with a bridge primer to obtain a single-strand circular cDNA library. Finally, the constructed cDNA libraries were sequenced in the DNBSEQ platform of BGI.

4.6.2. Transcriptome Sequencing Data Analysis

During the quality control of sequencing, clean reads were obtained by filtering the raw reads of low quality, contaminated connectors, and high N content of unknown bases. Then, the clean reads were compared against the reference genome sequence (https://bioinformatics.psb.ugent.be/orcae/overview/Tetur accessed on 10 November 2022) using HISAT [53] and were mapped to the reference gene sequence using Bowtie2 [54]. Subsequently, the expression levels of genes and transcripts were calculated with RSEM [55]. The Pearson correlation between each set of two samples was calculated with the cor function in R. Additionally, a principal component analysis (PCA) was performed using the princomp function, and all genes were clustered with the hclust function. The differential genes in this study were detected by the DEseq2 method based on negative binomial distribution. Differentially expressed genes (DEGs) were determined between susceptible and resistant mite populations under the fold change (FC) ≥ 2 and false discovery rate (FDR) < 0.05.

4.6.3. Transcriptome Sequencing Data Analysis

According to the results of the pairwise comparison of differentially expressed genes, a GO analysis was implemented by molecular function, cellular component and biological processing [21,22]. In addition, functional metabolic pathways were identified using the KEGG pathway database [21].

4.7. Quantitative Real-Time PCR (qRT-PCR) Analysis

To verify the detoxification enzyme gene results from DNBSEQ sequencing of BGI, five genes of the cyflumetofen-resistant strain and 16 genes of the bifenthrin-resistant strain were randomly selected. The gene-specific primers designed for the target genes are listed in Table 4. Cyclophilin A (tetur01g12670) [56], the most stable housekeeping gene, was used as the reference gene for the qRT-PCR analysis. In each strain, the total RNA was extracted from approximately 200 female T. urticae adults using the Total RNA Kit II (R6830-02, Omega, Seoul, Korea) following the manufacturer’s instructions. The extracted RNA was quantified and then used for qRT-PCR. The cDNA was synthesized using the Reverse Transcriptase M-MLV (Omega). The cDNA was synthesized using M-MLV Reverse Transcriptase. The reverse transcriptional system consisted of 10 μL of total RNA, 4 μL of PrimeScript RT Master Mix forward primer (5×) and 6 μL of RNase-free ddH2O. The qRT-PCR was performed in a 25-microliter qPCR reaction system consisting of 12.5 μL SYBR Premix Ex TaqIII, 8.5 μL ddH2O, 1 μL of each primer (forward and reverse) and 2 μL synthesized cDNA. The condition of the reaction started with 95 °C for 30 s, followed by 40 cycles with 95 °C for 5 s and 60 °C for 30 s. Melting curves were obtained by increasing the temperature from 60 to 95 °C (0.5 °C/s). There were three biological and technique replicates in the qPCR analysis. The relative gene expression levels were calculated by the 2-ΔΔCt method [57].

4.8. Statistical Analysis

One-way analysis of variance (ANOVA) (Tukey for data with homogeneous variances or Games–Howell multi-comparisons for data with heterogeneous variances) was conducted to compare data differences at a significance threshold of p < 0.05 in SPSS (Version 25.0, IBM Corp., New York, NY, USA). The mean ± standard error (n = 3) was shown in the figures. The mortality rates of the mites were analyzed using SPSS with the probit analysis. Then, the estimation of the median lethal concentration (LC50) and its 95% confidence limits were obtained.

Supplementary Materials

The following supporting information can be downloaded at: https://www.mdpi.com/article/10.3390/ijms232416220/s1.

Author Contributions

Conceptualization, J.H. and L.Z.; writing—original draft preparation, Z.L.; writing—review and editing, L.Z.; investigation, Z.L., F.W. and W.L.; project administration and funding acquisition, J.H. All authors have read and agreed to the published version of the manuscript.

Funding

This research was funded by Science and Technology Planning Programs of Guangdong Province, China (2017A020208040) and Department of Science and Technology of Guangdong Province (KTP20210359).

Institutional Review Board Statement

Not applicable.

Informed Consent Statement

Not applicable.

Data Availability Statement

Any data or material that support the findings of this study can be made available by the corresponding author upon request.

Acknowledgments

We appreciate Fengliang Jin and Xiaoxia Xu (Department of Entomology, College of Plant Protection, South China Agricultural University) very much for the technical help.

Conflicts of Interest

The authors declare no conflict of interest.

References

  1. Migeon, A.; Nouguier, E.; Dorkeld, F. Spider mites web: A comprehensive database for the Tetranychidae. In Trends in Acarology; Sabelis, M.W., Bruin, J., Eds.; Springer: Dordrecht, The Netherlands; Heidelberg, Germany; London, UK; New York, NY, USA, 2010; pp. 557–560. [Google Scholar]
  2. Adesanya, A.W.; Lavine, M.D.; Moural, T.W.; Lavine, L.C.; Zhu, F.; Walsh, D.B. Mechanisms and management of acaricide resistance for Tetranychus urticae in agroecosystems. J. Pest Sci. 2021, 94, 639–663. [Google Scholar] [CrossRef]
  3. Padilha, G.; Fiorin, R.A.; Cargnelutti Filho, A.; Pozebon, H.; Rogers, J.; Marques, R.P.; Castilhos, L.B.; Donatti, A.; Stefanelo, L.; Burtet, L.M.; et al. Damage assessment and economic injury level of the two-spotted spider mite Ttetranychus urticae in soybean. Pesq. Agropec. Bras. 2020, 55, e01836. [Google Scholar] [CrossRef]
  4. Ndiaye, B.; Joutei, A.B.; Lahlali, R. Managing spider mites in corn: A review. Moroccan. J. Agr. Sci. 2022, 1, 19–28. [Google Scholar]
  5. Sood, A.K.; Pathania, N.; Sharma, P. Annual Progress Report of RKVY Project: Technological Interventions for Protected Cultivation of Vegetable Crops in Himachal Pradesh; CSK Himachal Pradesh Krishi Vishvavidyalya: Palampur, India, 2015. [Google Scholar]
  6. Ferreira, C.B.S.; Andrade, F.H.N.; Rodrigues, A.R.S.; Siqueira, H.A.A.; Gondim, M.G.C. Resistance in field populations of Tetranychus urticae to acaricides and characterization of the inheritance of abamectin resistance. Crop Prot. 2015, 67, 77–83. [Google Scholar] [CrossRef]
  7. Campbell, L.; Euston, S.R.; Ahmed, M.A. Effect of addition of thermally modified cowpea protein on sensory acceptability and textural properties of wheat bread and sponge cake. Food Chem. 2016, 194, 1230–1237. [Google Scholar] [CrossRef]
  8. Adu, M.O.; Asare, P.A.; Yawson, D.O.; Dzidzienyo, D.K.; Nyadanu, D.; Asare-Bediako, E.; Afutu, E.; Tachie-Menson, J.W.; Amoah, M.N. Identifying key contributing root system traits to genetic diversity in field-grown cowpea (Vigna unguiculata L. Walp.) genotypes. Field Crop Res. 2019, 232, 106–118. [Google Scholar] [CrossRef]
  9. Grbić, M.; Van Leeuwen, T.; Clark, R.M.; Rombauts, S.; Rouzé, P.; Grbić, V.; Osborne, E.J.; Dermauw, W.; Thi Ngoc, P.C.; Ortego, F.; et al. The genome of Tetranychus urticae reveals herbivorous pest adaptations. Nature 2011, 479, 487–492. [Google Scholar] [CrossRef] [Green Version]
  10. Van Leeuwen, T.; Tirry, L.; Yamamoto, A.; Nauen, R.; Dermauw, W. The economic importance of acaricides in the control of phytophagous mites and an update on recent acaricide mode of action research. Pestic. Biochem. Phys. 2015, 121, 12–21. [Google Scholar] [CrossRef]
  11. Hayashi, N.; Sasama, Y.; Takahashi, N.; Ikemi, N. Cyflumetofen, a novel acaricide-its mode of action and selectivity. Pest Manag. Sci. 2013, 69, 1080–1084. [Google Scholar] [CrossRef]
  12. Pavlidi, N.; Khalighi, M.; Myridakis, A.; Dermauw, W.; Wybouw, N.; Tsakireli, D.; Stephanou, E.G.; Labrou, N.E.; Vontas, J.; Van Leeuwen, T. A glutathione-S-transferase (TuGSTd05) associated with acaricide resistance in Tetranychus urticae directly metabolizes the complex II inhibitor cyflumetofen. Insect Biochem. Molec. 2017, 80, 101–115. [Google Scholar] [CrossRef]
  13. Van Leeuwen, T.; Dermauw, W. The molecular evolution of xenobiotic metabolism and resistance in chelicerate mites. Annu. Rev. Entomol. 2016, 61, 475–498. [Google Scholar] [CrossRef] [PubMed]
  14. Wei, P.; Chen, M.; Nan, C.; Feng, K.; Shen, G.; Cheng, J.; He, L. Downregulation of carboxylesterase contributes to cyflumetofen resistance in Tetranychus cinnabarinus (Boisduval). Pest Manag. Sci. 2019, 75, 2166–2173. [Google Scholar] [CrossRef] [PubMed]
  15. Khalighi, M.; Tirry, L.; Van Leeuwen, T. Cross-resistance risk of the novel complex II inhibitors cyenopyrafen and cyflumetofen in resistant strains of the two-spotted spider mite Tetranychus urticae. Pest Manag. Sci. 2014, 70, 365–368. [Google Scholar] [CrossRef] [PubMed]
  16. Sugimoto, N.; Takahashi, A.; Ihara, R.; Itoh, Y.; Jouraku, A.; Van Leeuwen, T.; Osakabe, M. QTL mapping using microsatellite linkage reveals target-site mutations associated with high levels of resistance against three mitochondrial complex II inhibitors in Tetranychus urticae. Insect Biochem. Molec. 2020, 123, 103410. [Google Scholar] [CrossRef] [PubMed]
  17. Susurluk, H.; Gürkan, M.O. Mode of inheritance and biochemical mechanisms underlying lambda-cyhalothrin and bifenthrin resistance in the laboratory-selected two-spotted spider mite, Tetranychus urticae. Crop Prot. 2020, 137, 105280. [Google Scholar] [CrossRef]
  18. Tsagkarakou, A.; Van Leeuwen, T.; Khajehali, J.; Ilias, A.; Grispou, M.; Williamson, M.S.; Tirry, L.; Vontas, J. Identification of pyrethroid resistance associated mutations in the para sodium channel of the two-spotted spider mite Tetranychus urticae (Acari: Tetranychidae). Insect Mol. Biol. 2009, 18, 583–593. [Google Scholar] [CrossRef]
  19. Van Leeuwen, T.; Tirry, L. Esterase-mediated bifenthrin resistance in a multiresistant strain of the two-spotted spider mite, Tetranychus urticae. Pest Manag. Sci. 2007, 63, 150–156. [Google Scholar] [CrossRef]
  20. Ay, R.; Gürkan, M.O. Resistance to bifenthrin and resistance mechanisms of different strains of the two-spotted spider mite (Tetranychus urticae) from turkey. Phytoparasitica 2005, 33, 237–244. [Google Scholar] [CrossRef]
  21. Xu, D.; Zhang, Y.; Zhang, Y.; Wu, Q.; Guo, Z.; Xie, W.; Zhou, X.; Wang, S. Transcriptome profiling and functional analysis suggest that the constitutive overexpression of four cytochrome P450s confers resistance to abamectin in Tetranychus urticae from China. Pest Manag. Sci. 2021, 77, 1204–1213. [Google Scholar] [CrossRef]
  22. Papapostolou, K.M.; Riga, M.; Charamis, J.; Skoufa, E.; Souchlas, V.; Ilias, A.; Dermauw, W.; Ioannidis, P.; Van Leeuwen, T.; Vontas, J. Identification and characterization of striking multiple-insecticide resistance in a Tetranychus urticae field population from Greece. Pest Manag. Sci. 2021, 77, 666–676. [Google Scholar] [CrossRef]
  23. Liu, J.; Jiang, Z.; Feng, K.; Lu, W.; Wen, X.; Sun, J.; Li, J.; Liu, J.; He, L. Transcriptome analysis revealed that multiple genes were related to the cyflumetofen resistance of Tetranychus cinnabarinus (Boisduval). Pestic. Biochem. Phys. 2021, 173, 104799. [Google Scholar] [CrossRef] [PubMed]
  24. Feng, K.; Ou, S.; Zhang, P.; Wen, X.; Shi, L.; Yang, Y.; Hu, Y.; Zhang, Y.; Shen, G.; Xu, Z.; et al. The cytochrome P450 CYP389C16 contributes to the cross-resistance between cyflumetofen and pyridaben in Tetranychus cinnabarinus (Boisduval). Pest Manag. Sci. 2020, 76, 665–675. [Google Scholar] [CrossRef] [PubMed]
  25. Alpkent, Y.N.; İnak, E.; Ulusoy, S.; Ay, R. Acaricide resistance and mechanisms in Tetranychus urticae populations from greenhouses in Turkey. Syst. Appl. Acarol. 2020, 25, 155–168. [Google Scholar]
  26. Yang, X.; Zhu, K.Y.; Buschman, L.L.; Margolies, D.C. Comparative susceptibility and possible detoxification mechanisms for selected miticides in banks grass mite and two-spotted spider mite (Acari: Tetranychidae). Exp. Appl. Acarol. 2001, 25, 293–299. [Google Scholar] [CrossRef] [PubMed]
  27. Chen, Q.; Luan, Z.; Cheng, X.; Xu, J. Molecular dynamics investigation of the substrate binding mechanism in carboxylesterase. Biochemistry 2015, 54, 1841–1848. [Google Scholar] [CrossRef] [PubMed]
  28. Wang, L.L.; Huang, Y.; Lu, X.P.; Jiang, X.Z.; Smagghe, G.; Feng, Z.J.; Yuan, G.R.; Wei, D.; Wang, J.J. Overexpression of two α-esterase genes mediates metabolic resistance to malathion in the oriental fruit fly, Bactrocera dorsalis (Hendel). Insect Mol. Biol. 2015, 24, 467–479. [Google Scholar] [CrossRef]
  29. Devonshire, A.L.; Moores, G.D. A carboxylesterase with broad substrate specificity causes organophosphorus, carbamate and pyrethroid resistance in peach-potato aphids (Myzus persicae). Pestic. Biochem. Phys. 1982, 18, 235–246. [Google Scholar] [CrossRef]
  30. Shi, L.; Wei, P.; Wang, X.; Shen, G.; Zhang, J.; Xiao, W.; Xu, Z.; Xu, Q.; He, L. Functional analysis of esterase TCE2 gene from Tetranychus cinnabarinus (Boisduval) involved in acaricide resistance. Sci Rep. 2016, 6, 18646. [Google Scholar] [CrossRef] [Green Version]
  31. Xu, Z.S.; Lin, Y.Q.; Xu, J.; Zhu, B.; Zhao, W.; Peng, R.H.; Yao, Q.H. Selective detoxification of phenols by Pichia pastoris and Arabidopsis thaliana heterologously expressing the PtUGT72B1 from Populus trichocarpa. PLoS ONE 2013, 8, e66878. [Google Scholar] [CrossRef]
  32. Tiwari, P.; Sangwan, R.S.; Sangwan, N.S. Plant secondary metabolism linked glycosyltransferases: An update on expanding knowledge and scopes. Biotechnol. Adv. 2016, 34, 714–739. [Google Scholar] [CrossRef]
  33. Zhang, W.; Wang, S.; Yang, J.; Kang, C.; Huang, L.; Guo, L. Glycosylation of plant secondary metabolites: Regulating from chaos to harmony. Environ. Exp. Bot. 2022, 194, 104703. [Google Scholar] [CrossRef]
  34. Bock, K.W. Vertebrate UDP-glucuronosyltransferases: Functional and evolutionary aspects. Biochem. Pharmacol. 2003, 66, 691–696. [Google Scholar] [CrossRef] [PubMed]
  35. Després, L.; David, J.; Gallet, C. The evolutionary ecology of insect resistance to plant chemicals. Trends Ecol. Evol. 2007, 22, 298–307. [Google Scholar] [CrossRef]
  36. Daborn, P.J.; Yen, J.L.; Bogwitz, M.R.; Le Goff, G.; Feil, E.; Jeffers, S.; Tijet, N.; Perry, T.; Heckel, D.; Batterham, P.; et al. A single P450 allele associated with insecticide resistance in Drosophila. Science 2002, 297, 2253–2256. [Google Scholar] [CrossRef] [PubMed]
  37. Djouaka, R.F.; Bakare, A.A.; Coulibaly, O.N.; Akogbeto, M.C.; Ranson, H.; Hemingway, J.; Strode, C. Expression of the cytochrome P450s, CYP6P3 and CYP6M2 are significantly elevated in multiple pyrethroid resistant populations of Anopheles gambiae s.s. from Southern Benin and Nigeria. BMC Genom. 2008, 9, 538. [Google Scholar] [CrossRef] [Green Version]
  38. Xing, X.; Yan, M.; Pang, H.; Wu, F.A.; Wang, J.; Sheng, S. Cytochrome P450s are essential for insecticide tolerance in the endoparasitoid wasp Meteorus pulchricornis (Hymenoptera: Braconidae). Insects 2021, 12, 651. [Google Scholar] [CrossRef]
  39. Antony, B.; Johny, J.; Abdelazim, M.M.; Jakše, J.; Al-Saleh, M.A.; Pain, A. Global transcriptome profiling and functional analysis reveal that tissue-specific constitutive overexpression of cytochrome P450s confers tolerance to imidacloprid in palm weevils in date palm fields. BMC Genom. 2019, 20, 440. [Google Scholar] [CrossRef]
  40. Shi, Y.; Qu, Q.; Wang, C.; He, Y.; Yang, Y.; Wu, Y. Involvement of CYP2 and mitochondrial clan P450s of Helicoverpa armigera in xenobiotic metabolism. Insect Biochem. Molec. 2022, 140, 103696. [Google Scholar] [CrossRef]
  41. Yang, T.; Liu, N. Genome analysis of cytochrome P450s and their expression profiles in insecticide resistant mosquitoes, Culex quinquefasciatus. PLoS ONE 2011, 6, e29418. [Google Scholar] [CrossRef] [Green Version]
  42. Riga, M.; Myridakis, A.; Tsakireli, D.; Morou, E.; Stephanou, E.G.; Nauen, R.; Van Leeuwen, T.; Douris, V.; Vontas, J. Functional characterization of the Tetranychus urticae CYP392A11, a cytochrome P450 that hydroxylates the METI acaricides cyenopyrafen and fenpyroximate. Insect Biochem. Molec. 2015, 65, 91–99. [Google Scholar] [CrossRef]
  43. Samra, A.I.; Kamita, S.G.; Yao, H.; Cornel, A.J.; Hammock, B.D. Cloning and characterization of two glutathione S-transferases from pyrethroid-resistant Culex pipiens. Pest Manag. Sci. 2012, 68, 764–772. [Google Scholar] [CrossRef] [PubMed] [Green Version]
  44. Wu, S.; Xie, H.; Li, M.; Xu, X.; Lei, Z. Highly virulent Beauveria bassiana strains against the two-spotted spider mite, Tetranychus urticae, show no pathogenicity against five phytoseiid mite species. Exp. Appl. Acarol. 2016, 70, 421–435. [Google Scholar] [CrossRef] [PubMed]
  45. Liu, Z.; Zhou, L.; Yao, Q.; Liu, Y.; Bi, X.; Huang, J. Laboratory selection, resistance risk assessment, multi-resistance, and management of Tetranychus urticae Koch to bifenthrin, bifenazate and cyflumetofen on cowpea. Pest Manag. Sci. 2020, 76, 1912–1919. [Google Scholar] [CrossRef] [PubMed]
  46. Dittrich, V.; Cranham, J.; Jepson, L. Revised method for spider mites and their eggs (eg Tetranychus spp. and Panonychus ulmi koch). FAO Plant Prod. Prot. Pap. 1980, 21, 49–53. [Google Scholar]
  47. Wang, Y.; Zhao, S.; Shi, L.; Xu, Z.; He, L. Resistance selection and biochemical mechanism of resistance against cyflumetofen in Tetranychus cinnabarinus (Boisduval). Pestic. Biochem. Phys. 2014, 111, 24–30. [Google Scholar] [CrossRef]
  48. Chen, A.; Zhang, H.; Shan, T.; Shi, X.; Gao, X. The overexpression of three cytochrome P450 genes CYP6CY14, CYP6CY22 and CYP6UN1 contributed to metabolic resistance to dinotefuran in melon/cotton aphid, Aphis gossypii Glover. Pestic. Biochem. Phys. 2020, 167, 104601. [Google Scholar] [CrossRef]
  49. Wang, Q.; Rui, C.; Wang, L.; Nahiyoon, S.A.; Huang, W.; Zhu, J.; Ji, X.; Yang, Q.; Yuan, H.; Cui, L. Field-evolved resistance to 11 insecticides and the mechanisms involved in Helicoverpa armigera (Lepidoptera: Noctuidae). Pest Manag. Sci. 2021, 77, 5086–5095. [Google Scholar] [CrossRef]
  50. Zhang, Y.; Huang, D.; Lv, N.; Zhu, G.; Peng, J.; Chou, T.; Zhu, Z.; Wang, J.; Chen, Y.; Fang, X.; et al. Global quantification of glutathione S-transferases in human serum using LC-MS/MS coupled with affinity enrichment. J. Proteome Res. 2022, 21, 1311–1320. [Google Scholar] [CrossRef]
  51. Yin, Z.; Dong, X.; Kang, K.; Chen, H.; Dai, X.; Wu, G.; Zheng, L.; Yu, Y.; Zhai, Y. FoxO transcription factor regulate hormone mediated signaling on nymphal diapause. Front. Physiol. 2018, 9, 1654. [Google Scholar] [CrossRef] [Green Version]
  52. Zhang, W.; Chen, W.; Li, Z.; Ma, L.; Yu, J.; Wang, H.; Liu, Z.; Xu, B. Identification and characterization of three new cytochrome P450 genes and the use of RNA interference to evaluate their roles in antioxidant defense in Apis cerana cerana Fabricius. Front. Physiol. 2018, 9, 1608. [Google Scholar] [CrossRef] [Green Version]
  53. Kim, D.; Langmead, B.; Salzberg, S.L. HISAT: A fast spliced aligner with low memory requirements. Nat. Methods 2015, 12, 357–360. [Google Scholar] [CrossRef] [PubMed] [Green Version]
  54. Langmead, B.; Salzberg, S.L. Fast gapped-read alignment with Bowtie 2. Nat. Methods 2012, 9, 357–359. [Google Scholar] [CrossRef] [Green Version]
  55. Li, B.; Dewey, C.N. RSEM: Accurate transcript quantification from RNA-Seq data with or without a reference genome. BMC Bioinform. 2011, 12, 323. [Google Scholar] [CrossRef] [PubMed]
  56. Morales, M.A.; Mendoza, B.M.; Lavine, L.C.; Lavine, M.D.; Walsh, D.B.; Zhu, F. Selection of reference genes for expression studies of xenobiotic adaptation in Tetranychus urticae. Int. J. Biol. Sci. 2016, 12, 1129–1139. [Google Scholar] [CrossRef] [PubMed] [Green Version]
  57. Livak, K.J.; Schmittgen, T.D. Analysis of relative gene expression data using real-time quantitative PCR and the 2-ΔΔCt method. Methods 2001, 25, 402–408. [Google Scholar] [CrossRef] [PubMed]
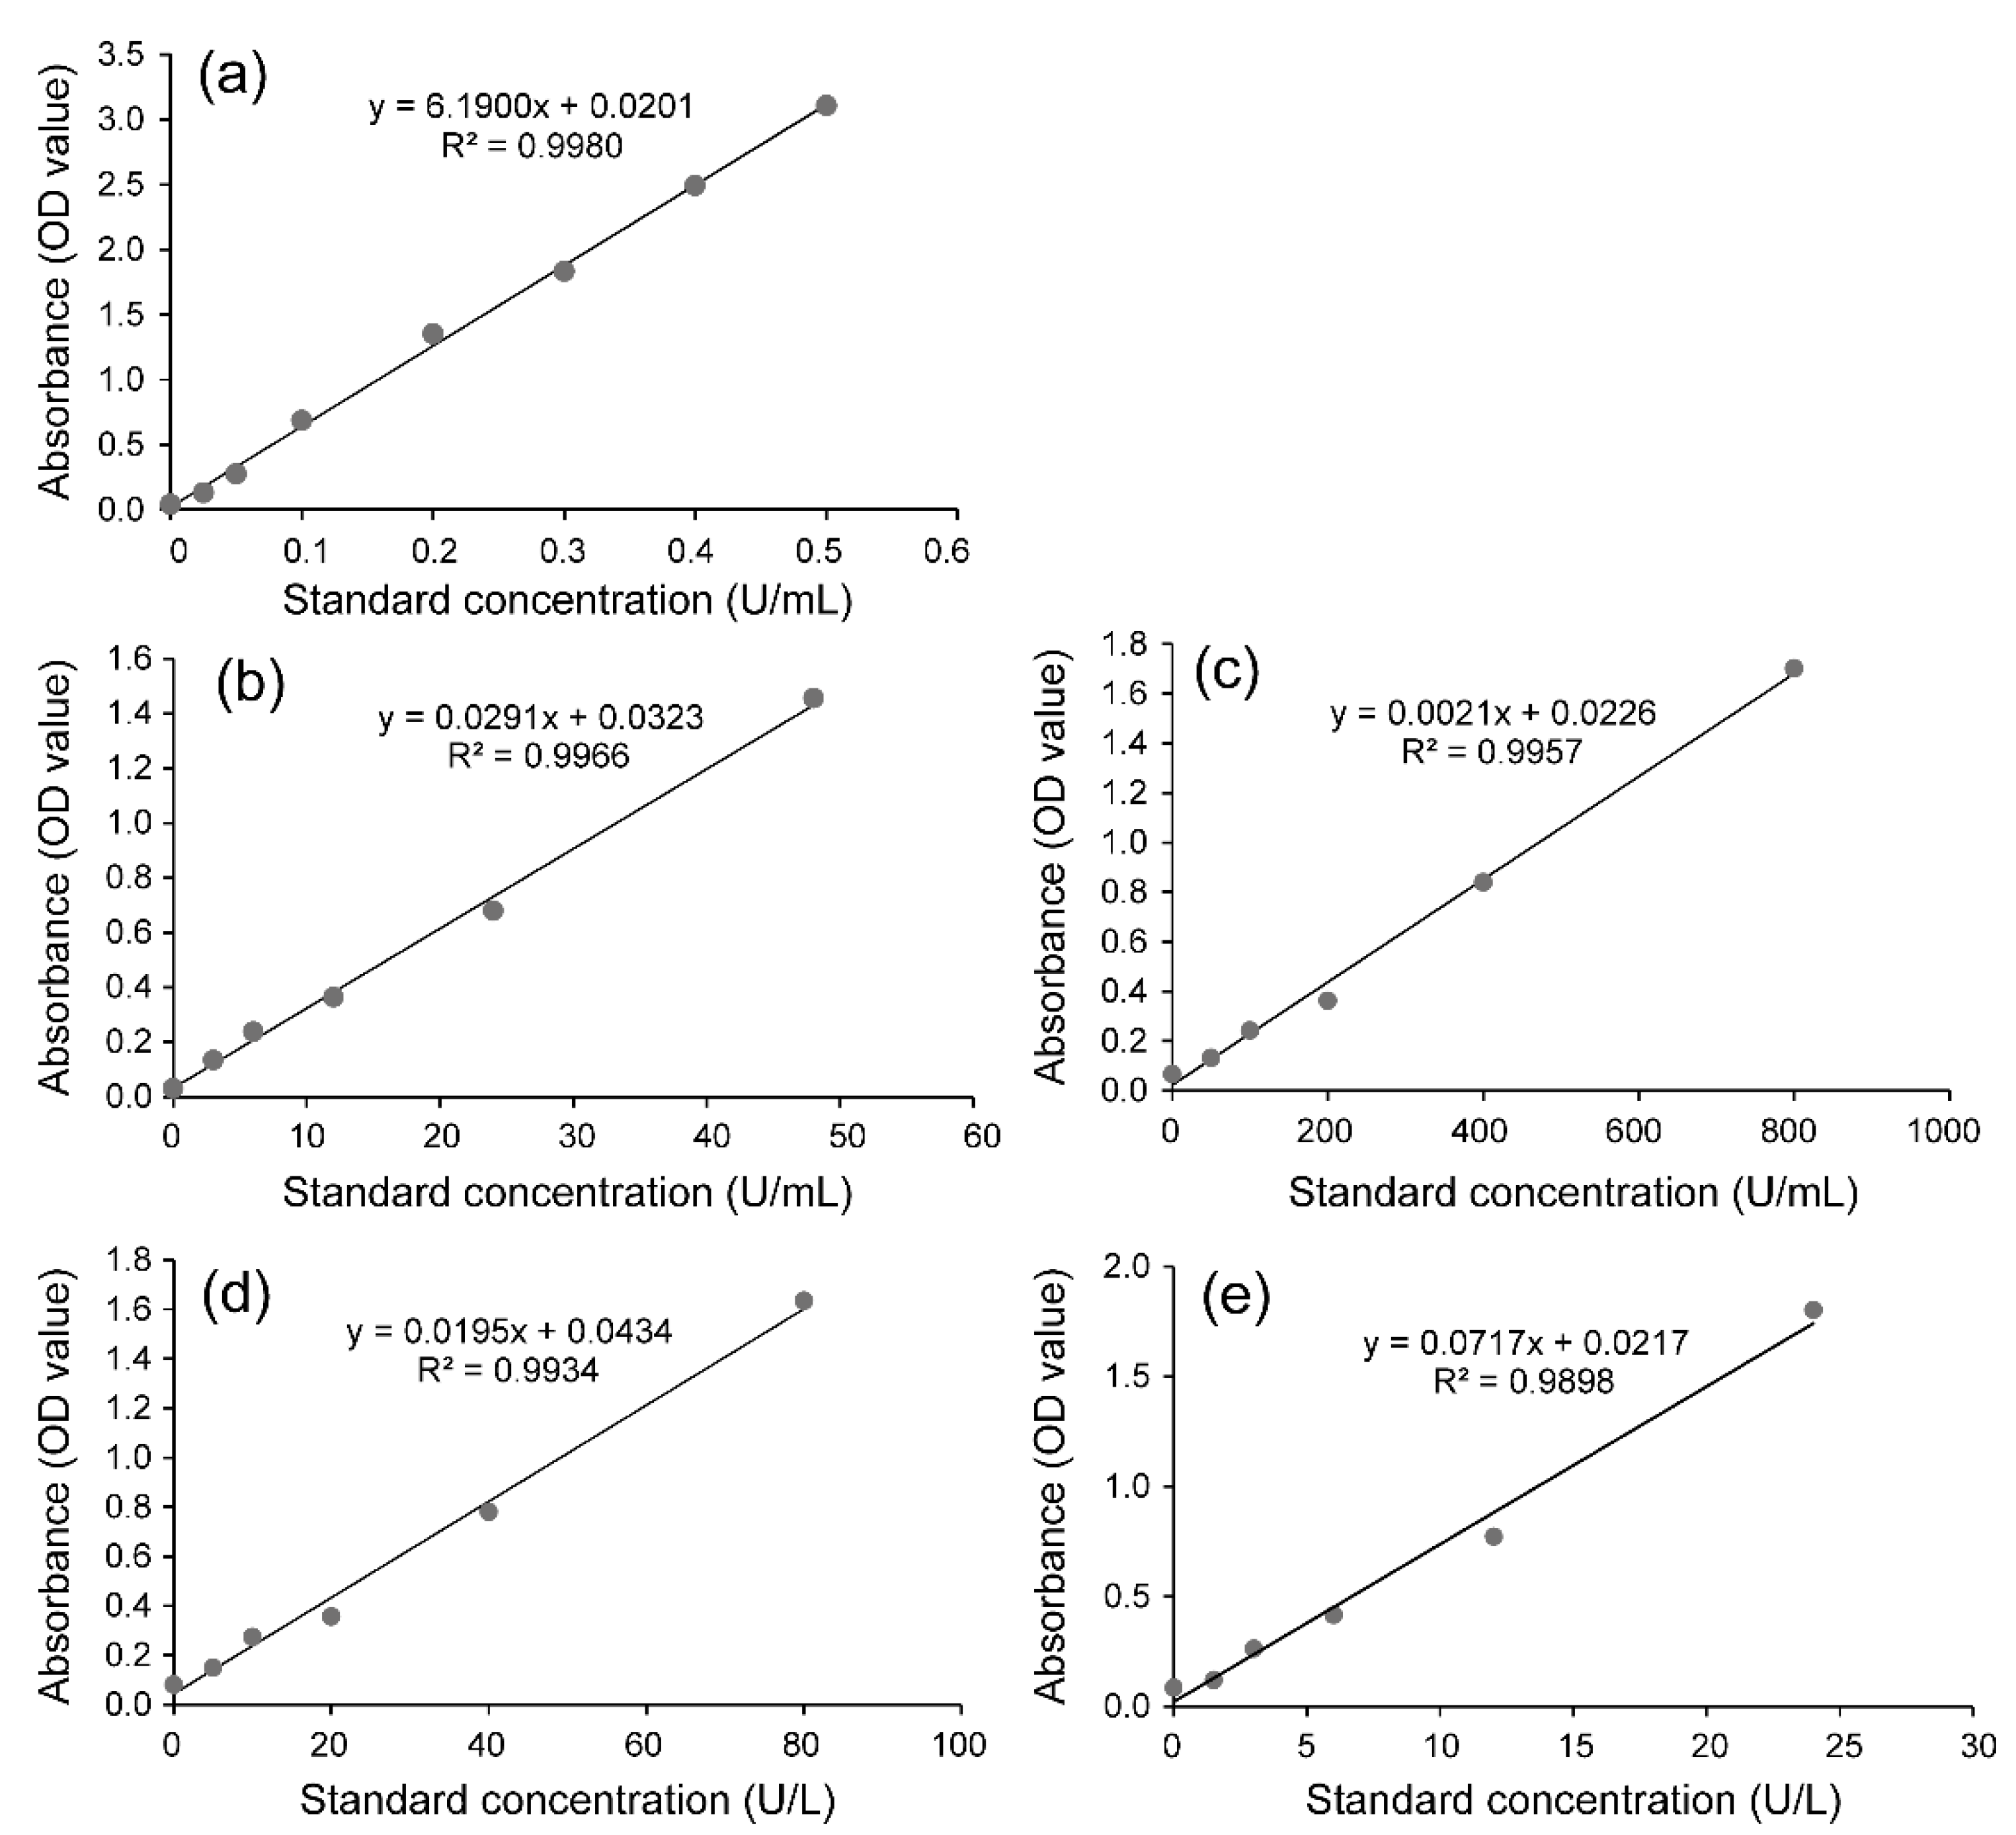
Figure 1. The standard curves of the content of protein (a), UDP-glucuronosyltransferases (UGTs) (b), carboxylesterases (CarEs) (c), glutathione-S-transferases (GSTs) (d) and cytochrome P450 monooxygenases (P450s) (e).
Ijms 23 16220 g001
Figure 2. The enzyme activity in the cyflumetofen- (R_cfm) and bifenthrin-resistant (R_bft) strains of T. urticae. The activity of UDP-glycosyltransferases (UGTs) (a), glutathione-S-transferases (GSTs) (b), carboxylesterases (CarEs) (c) and cytochrome P450 monooxygenases (P450s) (d). * indicates the significant difference (p < 0.05) compared with the susceptible strain (Lab_SS).
Ijms 23 16220 g002
Figure 3. PCA plots of the susceptible strain (Lab_SS), cyflumetofen- (R_cfm) and bifenthrin-resistant (R_bft) strains of T. urticae. Different colours represent different treatments (Ijms 23 16220 i001:Lab_SS; Ijms 23 16220 i002: R_bft; Ijms 23 16220 i003: R_cfm).
Ijms 23 16220 g003
Figure 4. Summary of differentially expressed genes between the Lab_SS vs R_cfm group and the Lab_SS vs R_bft group.
Ijms 23 16220 g004
Figure 5. Gene ontology enrichment analysis of the differentially expressed genes from the cyflumetofen-resistant (R_cfm) (a) and the bifenthrin-resistant (R_bft) (b) strains of T. urticae.
Ijms 23 16220 g005
Figure 6. Gene ontology analysis of the differentially expressed genes common to the Lab_SS vs R_cfm group and the Lab_SS vs R_bft group.
Ijms 23 16220 g006
Figure 7. Kyoto Encyclopedia of Genes and Genomes (KEGG) analysis of differentially expressed genes from the cyflumetofen-resistant (R_cfm) strain of T. urticae. (a) Classified KEGG pathways; (b) enriched KEGG pathways; (c) the number of differently expressed genes in the most enriched pathways.
Ijms 23 16220 g007
Figure 8. Kyoto Encyclopedia of Genes and Genomes (KEGG) analysis of differentially expressed genes from the bifenthrin-resistant (R_bft) strain of T. urticae; (a) classified KEGG pathways; (b) enriched KEGG pathways; (c) the number of differently expressed genes in the most enriched pathways.
Ijms 23 16220 g008
Figure 9. Validation of the transcriptome sequencing results by quantitative real-time PCR. (a) Comparison between the susceptible strain (Lab_SS) and the cyflumetofen-resistant strain (R_cfm) of T. urticae. (b) Comparison between the Lab_SS strain and the bifenthrin-resistant (R_bft) strain of T. urticae. * indicates the significant difference (p < 0.05) compared with the Lab_SS.
Ijms 23 16220 g009
Figure 10. The integrated diagram illustrating the changes of detoxifying enzymes and involved genes in the cyflumetofen- and bifenthrin-resistant T. urticae strains based on this study. The up and down arrows indicate the increased/up-regulated and decreased/down-regulated of the parameters, respectively.
Ijms 23 16220 g010
Table 1. Selection of the cyflumetofen- and bifenthrin-resistant strains of T. urticae.
AcaricideGenerationRegressionLC50 (mg/L) (95% CI)Resistance Ratio
CyflumetofenF0y = 4.14 + 1.10x6.02 (4.29~8.43)-
F16y = −6.65 + 4.09x707.95 (646.64~775.09)117.60
BifenthrinF0y = −0.21 + 2.46x125.04 (103.19~151.52)-
F20->20000>159.95
Table 2. Summary of the RNA sequencing and assembly of T. urticae.
SamplesTotal Raw Reads (Mb)Total Clean Reads (Mb)Clean Reads
Ratio (%)
Mapping Rate (%)Clean Reads Q20 (%)Clean Reads Q30 (%)
Lab_SS145.5742.2492.6863.4594.9488.86
Lab_SS247.3342.8390.5062.0294.5588.10
Lab_SS345.5742.2692.7264.8894.6788.30
R_cfm147.3343.1191.1067.0494.7288.42
R_cfm242.6538.5190.3070.2794.8088.53
R_cfm347.3343.1091.0766.8094.8488.66
R_bft149.0842.8187.2249.2995.1789.34
R_bft247.3343.1091.0854.8994.8588.69
R_bft345.5742.2292.6569.8094.7088.36
Table 3. The DEGs of detoxification enzymes in the cyflumetofen-resistant strain and the bifenthrin-resistant strain of T. urticae.
Detoxification
Enzymes
Gene IDlog2 (R_cfm or R_bft /Lab_SS)Symbol
Lab_SS vs R_cfmCCEstetur17g003501.77TuCCE46
tetur207g000101.28TuCCE70
P450stetur07g064401.64CYP392A2p
tetur07g064101.10CYP392A1
tetur27g00340−1.32CYP392E7
Lab_SS vs R_bftCCEstetur17g003503.68TuCCE46
tetur207g000103.09TuCCE70
tetur207g000202.65CCEincTu16
tetur17g003002.63TuCCE45
tetur17g000802.21TuCCE44
tetur17g003602.04CCEincTu08
tetur35g001801.89CCEincTu13
tetur35g002001.77TuCCE65
tetur04g067701.53TuCCE25
tetur01g141801.26TuCCE12
tetur11g057701.15TuCCE35
tetur16g02380−1.01TuCCE40
tetur04g02550−1.04TuCCE22
tetur30g01290−1.26TuCCE61
tetur01g08680−1.46TuCCE01
UGTstetur04g076303.31UGT16
tetur05g000802.83UGT22
tetur21g014002.29UGT58p
tetur22g004201.75UGT65
tetur08g001901.73UGT40
tetur09g016601.69UGT
tetur05g093251.56UGT
tetur05g000901.30UGT23
tetur22g005101.17UGT69
P450stetur03g049902.04CYP392D2
tetur03g009701.75CYP392A11
tetur03g09961−1.14CYP392D7
tetur46g00150−1.44CYP385C4v2
tetur07g06440−1.89CYP392A2p
GSTstetur31g013301.88TuGSTd15
tetur05g052601.65TuGSTm09
tetur26g015101.49TuGSTd13
tetur05g052501.48TuGSTm08
ABCstetur09g019701.35TuABCG-13
tetur18g002301.14TuABCH-13
tetur11g021201.06TuABCC-28
Table 4. qPCR primers of the selected genes.
GeneForward PrimerReverse Primer
tetur03g04990TCTAAAGGACCAAGAGGAGACGATGGGTTTGATAATGT
tetur04g07630ATCAGGACCTCCACCATTTAATCTATTCGGCACCAACC
tetur05g00080AACATCGCTTCATCGTCTCCAATCAATCTTGCCACTTC
tetur21g01400GGACCAAGAGGAGACGAACTTCAGCATACGATGGGTTT
tetur17g00350TTCCTTATGCGAAGCCAACGAACGGACCAAGATCCAGCA
tetur207g00010AAAAGGACCAGCGAAGACTAACGGACCAAGATCCAGCA
tetur207g00020TATGTTTTCGGTTTACCTCTTTCCCCAATCATCTATG
tetur17g00300CAAGAAGAACCAGCGAAGACTGACCAAGATCCAGCAGA
tetur17g00080AACATCGCTTCATCGTCTCCAATCAATCTTGCCACTTC
tetur17g00360TCAAACAAACTACGACCAGCTCCGAAGTAGATGAAACC
tetur01g08680TTTTGATAATTCGGTTGACGACGATATTGGCTTAGGAGG
tetur22g00420ATGGTCCACCTCTTCGTTCTTCCCATTGAGACATAGATAAGC
tetur03g00970AGGAAGCAATTCGCTGATAGCCAACAATAGGAAGACCC
tetur07g06440CTCGTCCAATATCCTCAATAGCACTAAATGGCACTAAA
tetur31g01330GATTGGTTTACGCTGTCCTGTTTCGTTTCGATAAGATTG
tetur05g05260AGGTGCTGTTGAGCCTATTTTTCTTGGTCCTAAATCGT
tetur09g01970ATGTTGCTGGCTGAGGGTCATGGCTTCTTGATTGTAGTCCTG
tetur27g00340GGCTTAGGAAAGAGTGAAACGAAATACGGAAACAGACC
tetur01g12670CTTCAAGGCGGTGACTTTACCCCATTGAAAGGATACCTGGTCC
Publisher’s Note: MDPI stays neutral with regard to jurisdictional claims in published maps and institutional affiliations.