
Interrelations between Iron and Vitamin A—Studied Using Systems Approach


Abstract
:
1. Introduction
1.1. Research Context
1.2. Biological Background
2. Results
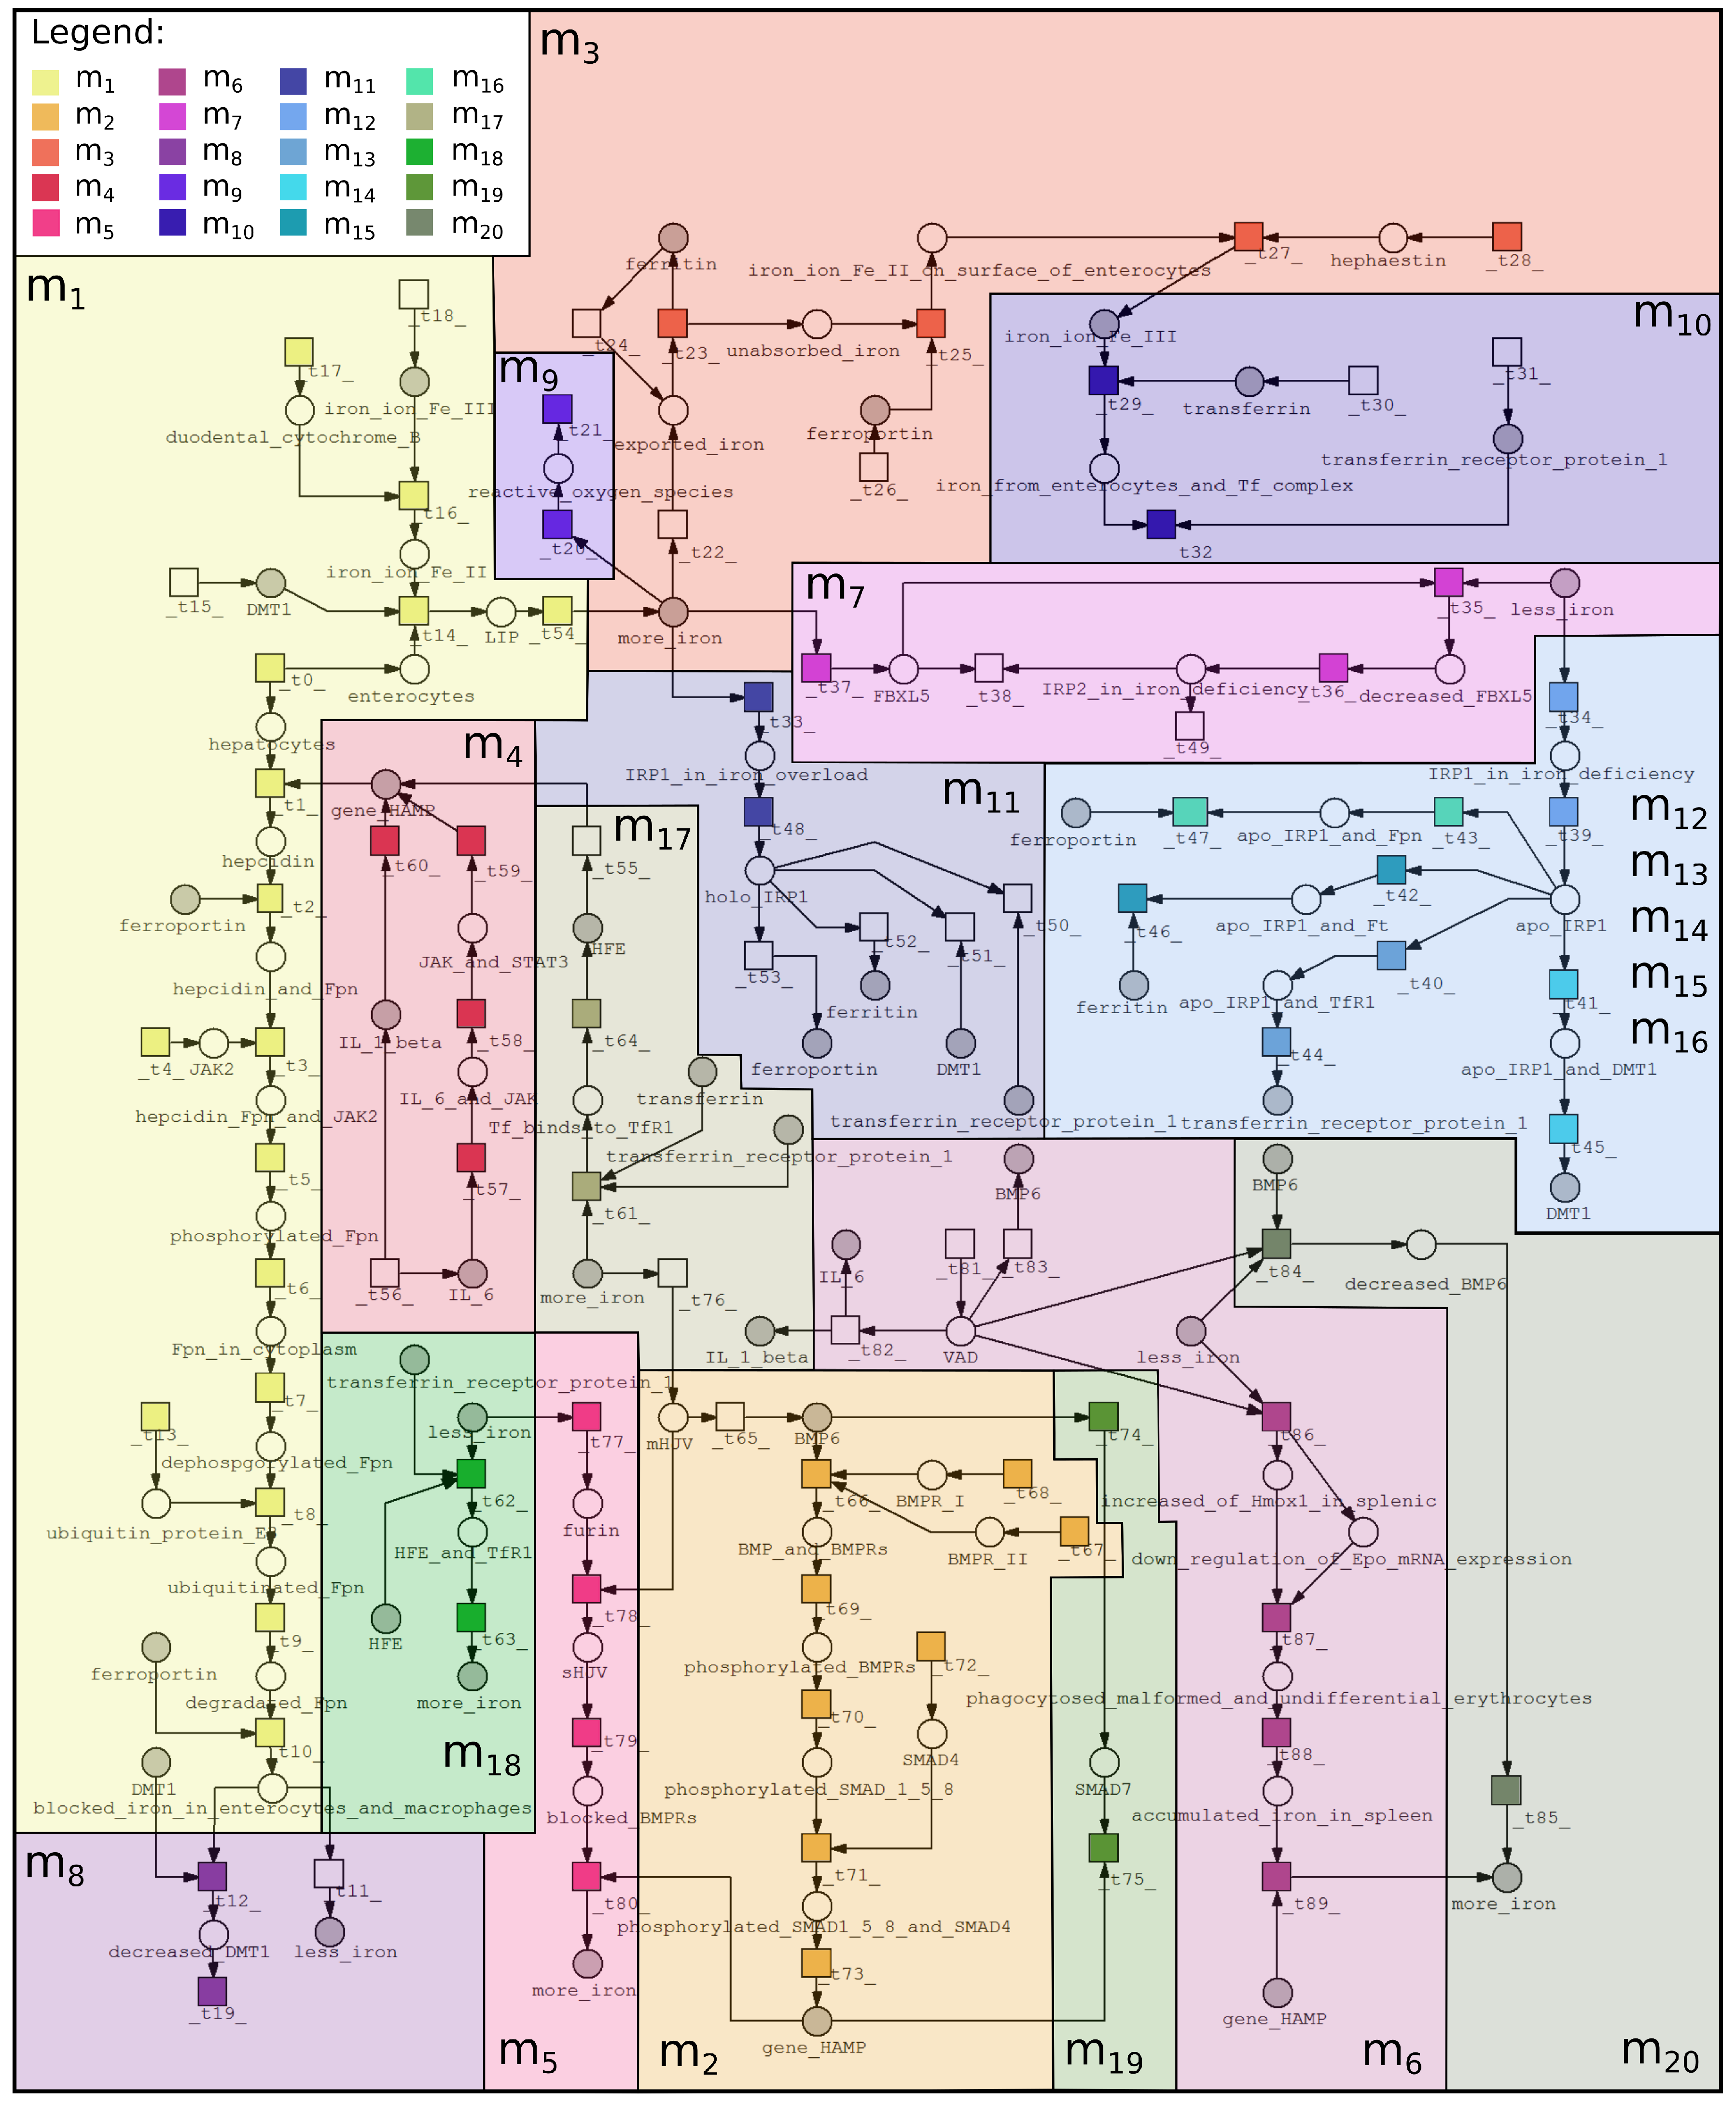
2.1. Petri Net-Based Model
2.2. Analysis
3. Discussion
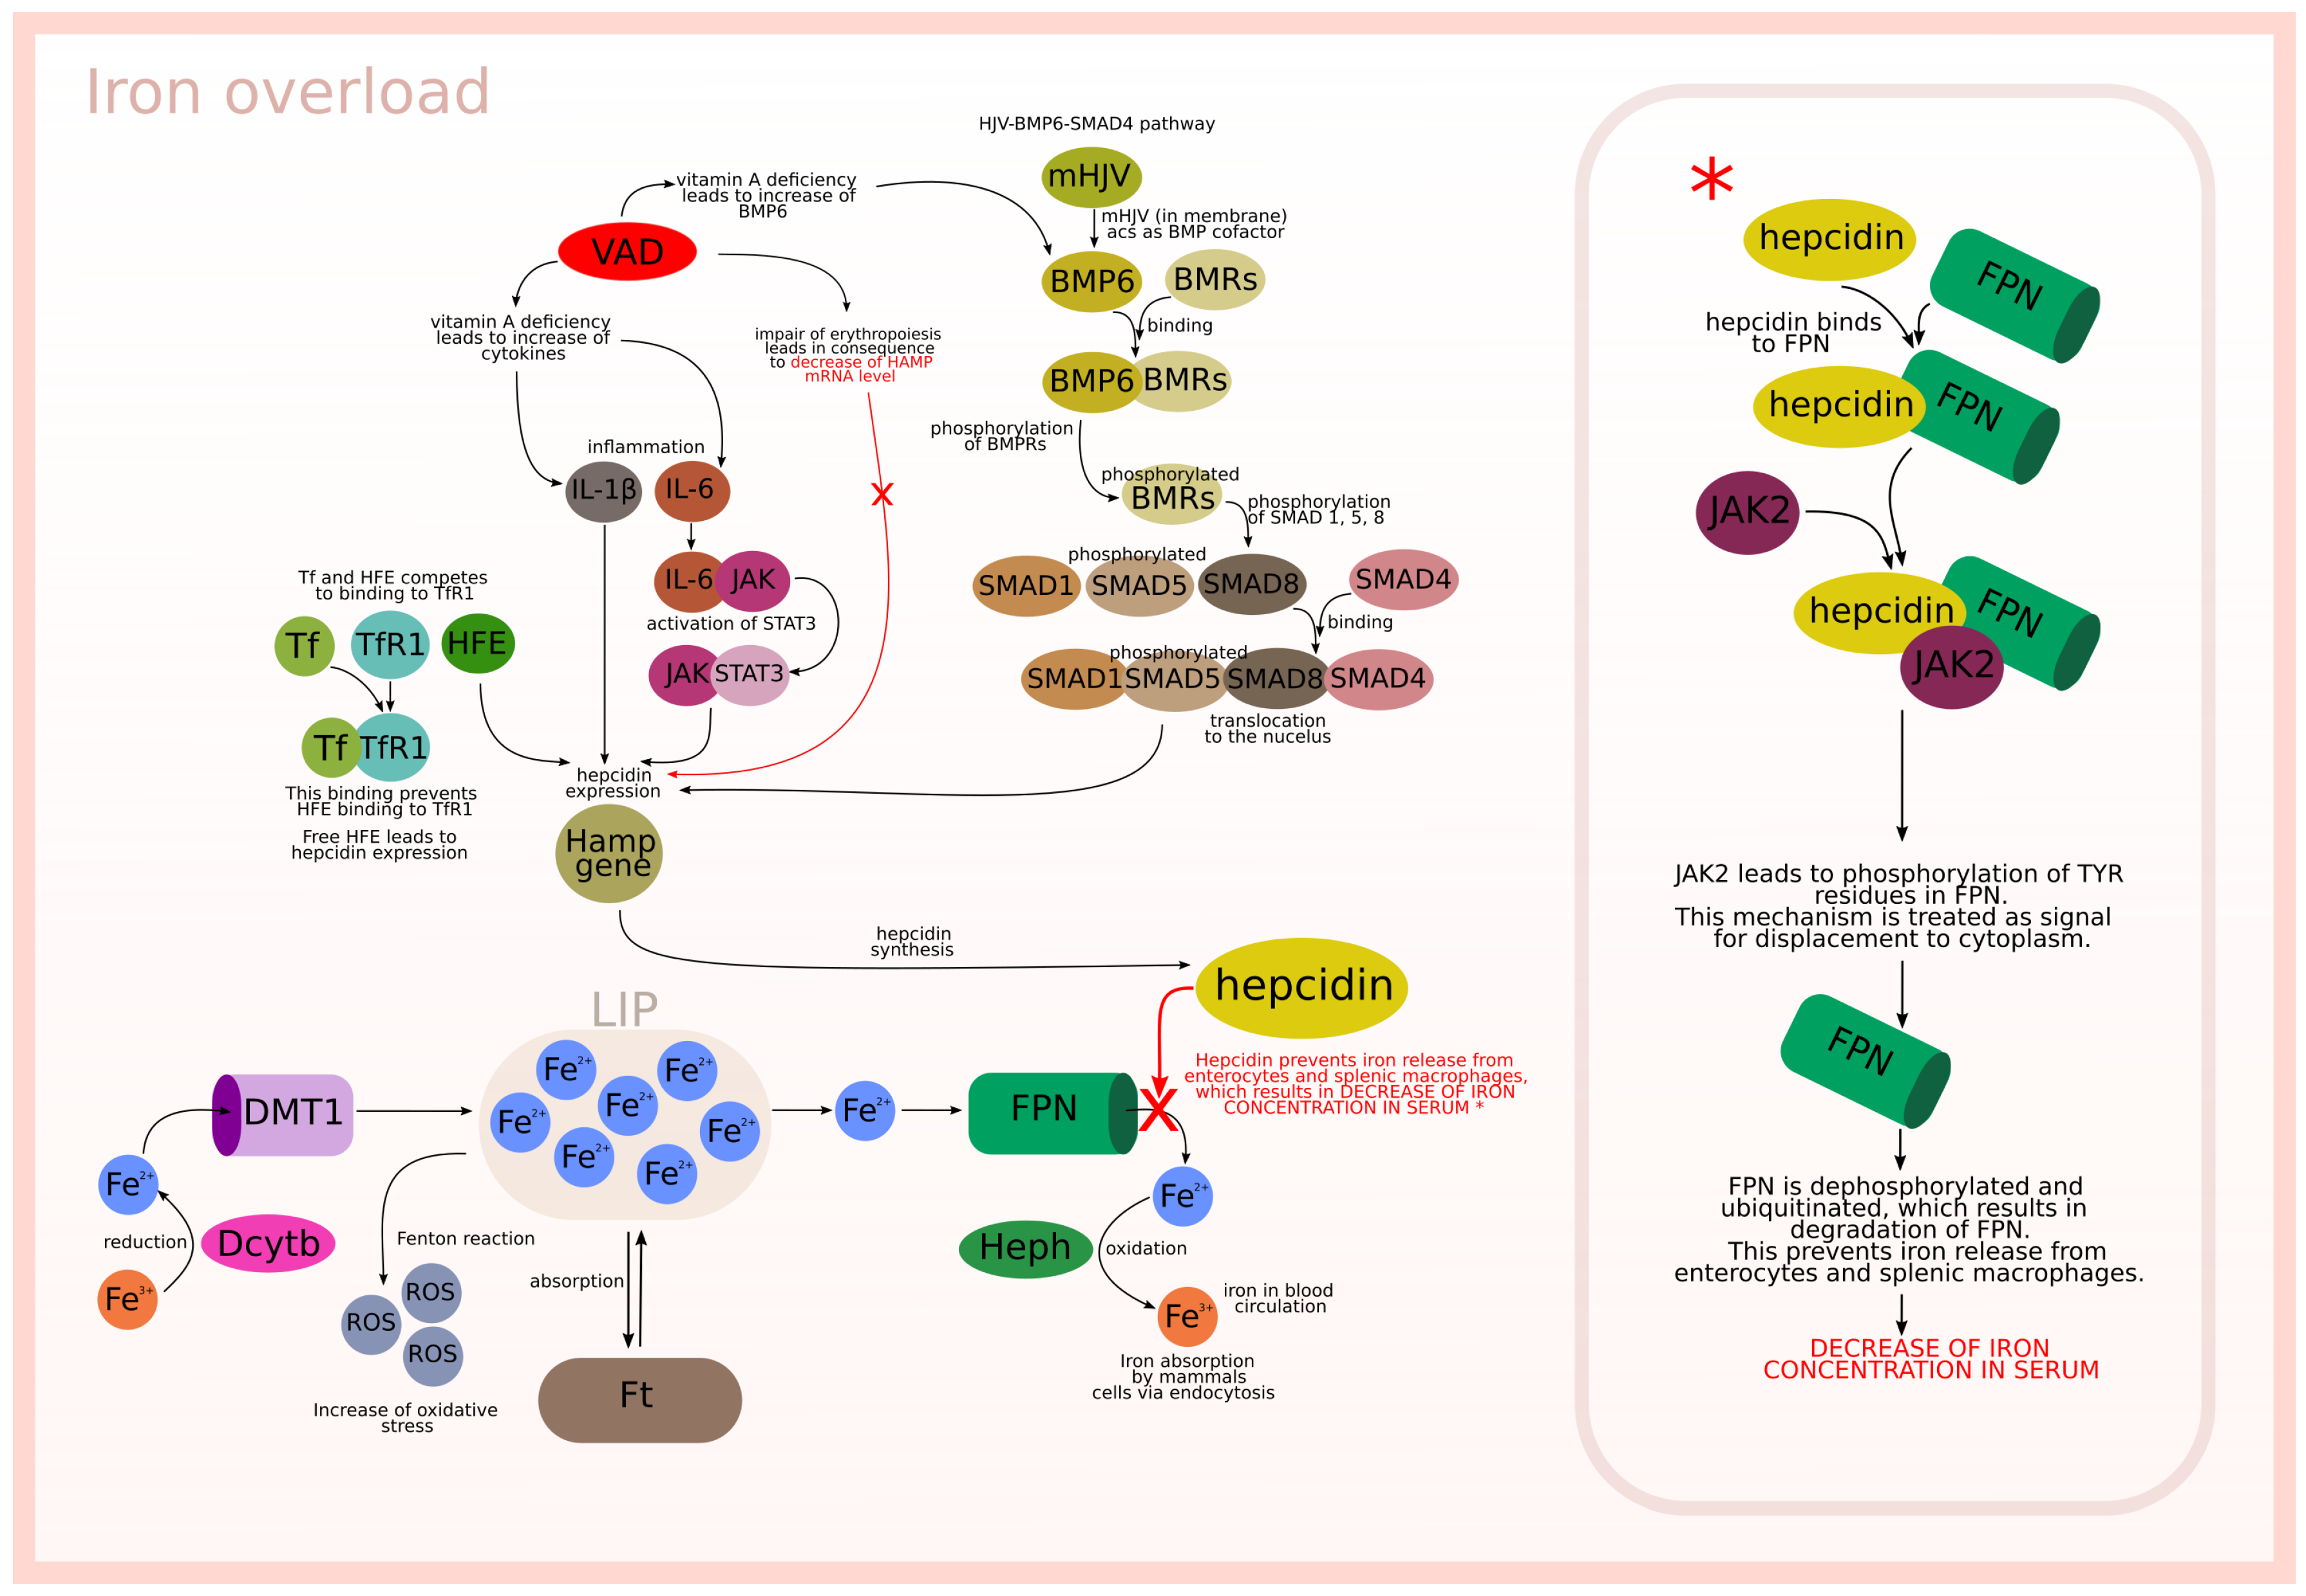
- HJV-BMP6-SMAD4 pathway (subprocess (n)) included in 6 t-clusters, see Table Figure 4).
- Cytokines IL-6 (JAK-STAT3 pathway) and IL-1 (subprocess (h)) included in 13 t-clusters, see Table Figure 4).
- Free HFE; in the case of iron overload or normal status Tf binds to TfR1 and prevents HFE binding (subprocess (f)) included in 6 t-clusters, see Table Figure 4).
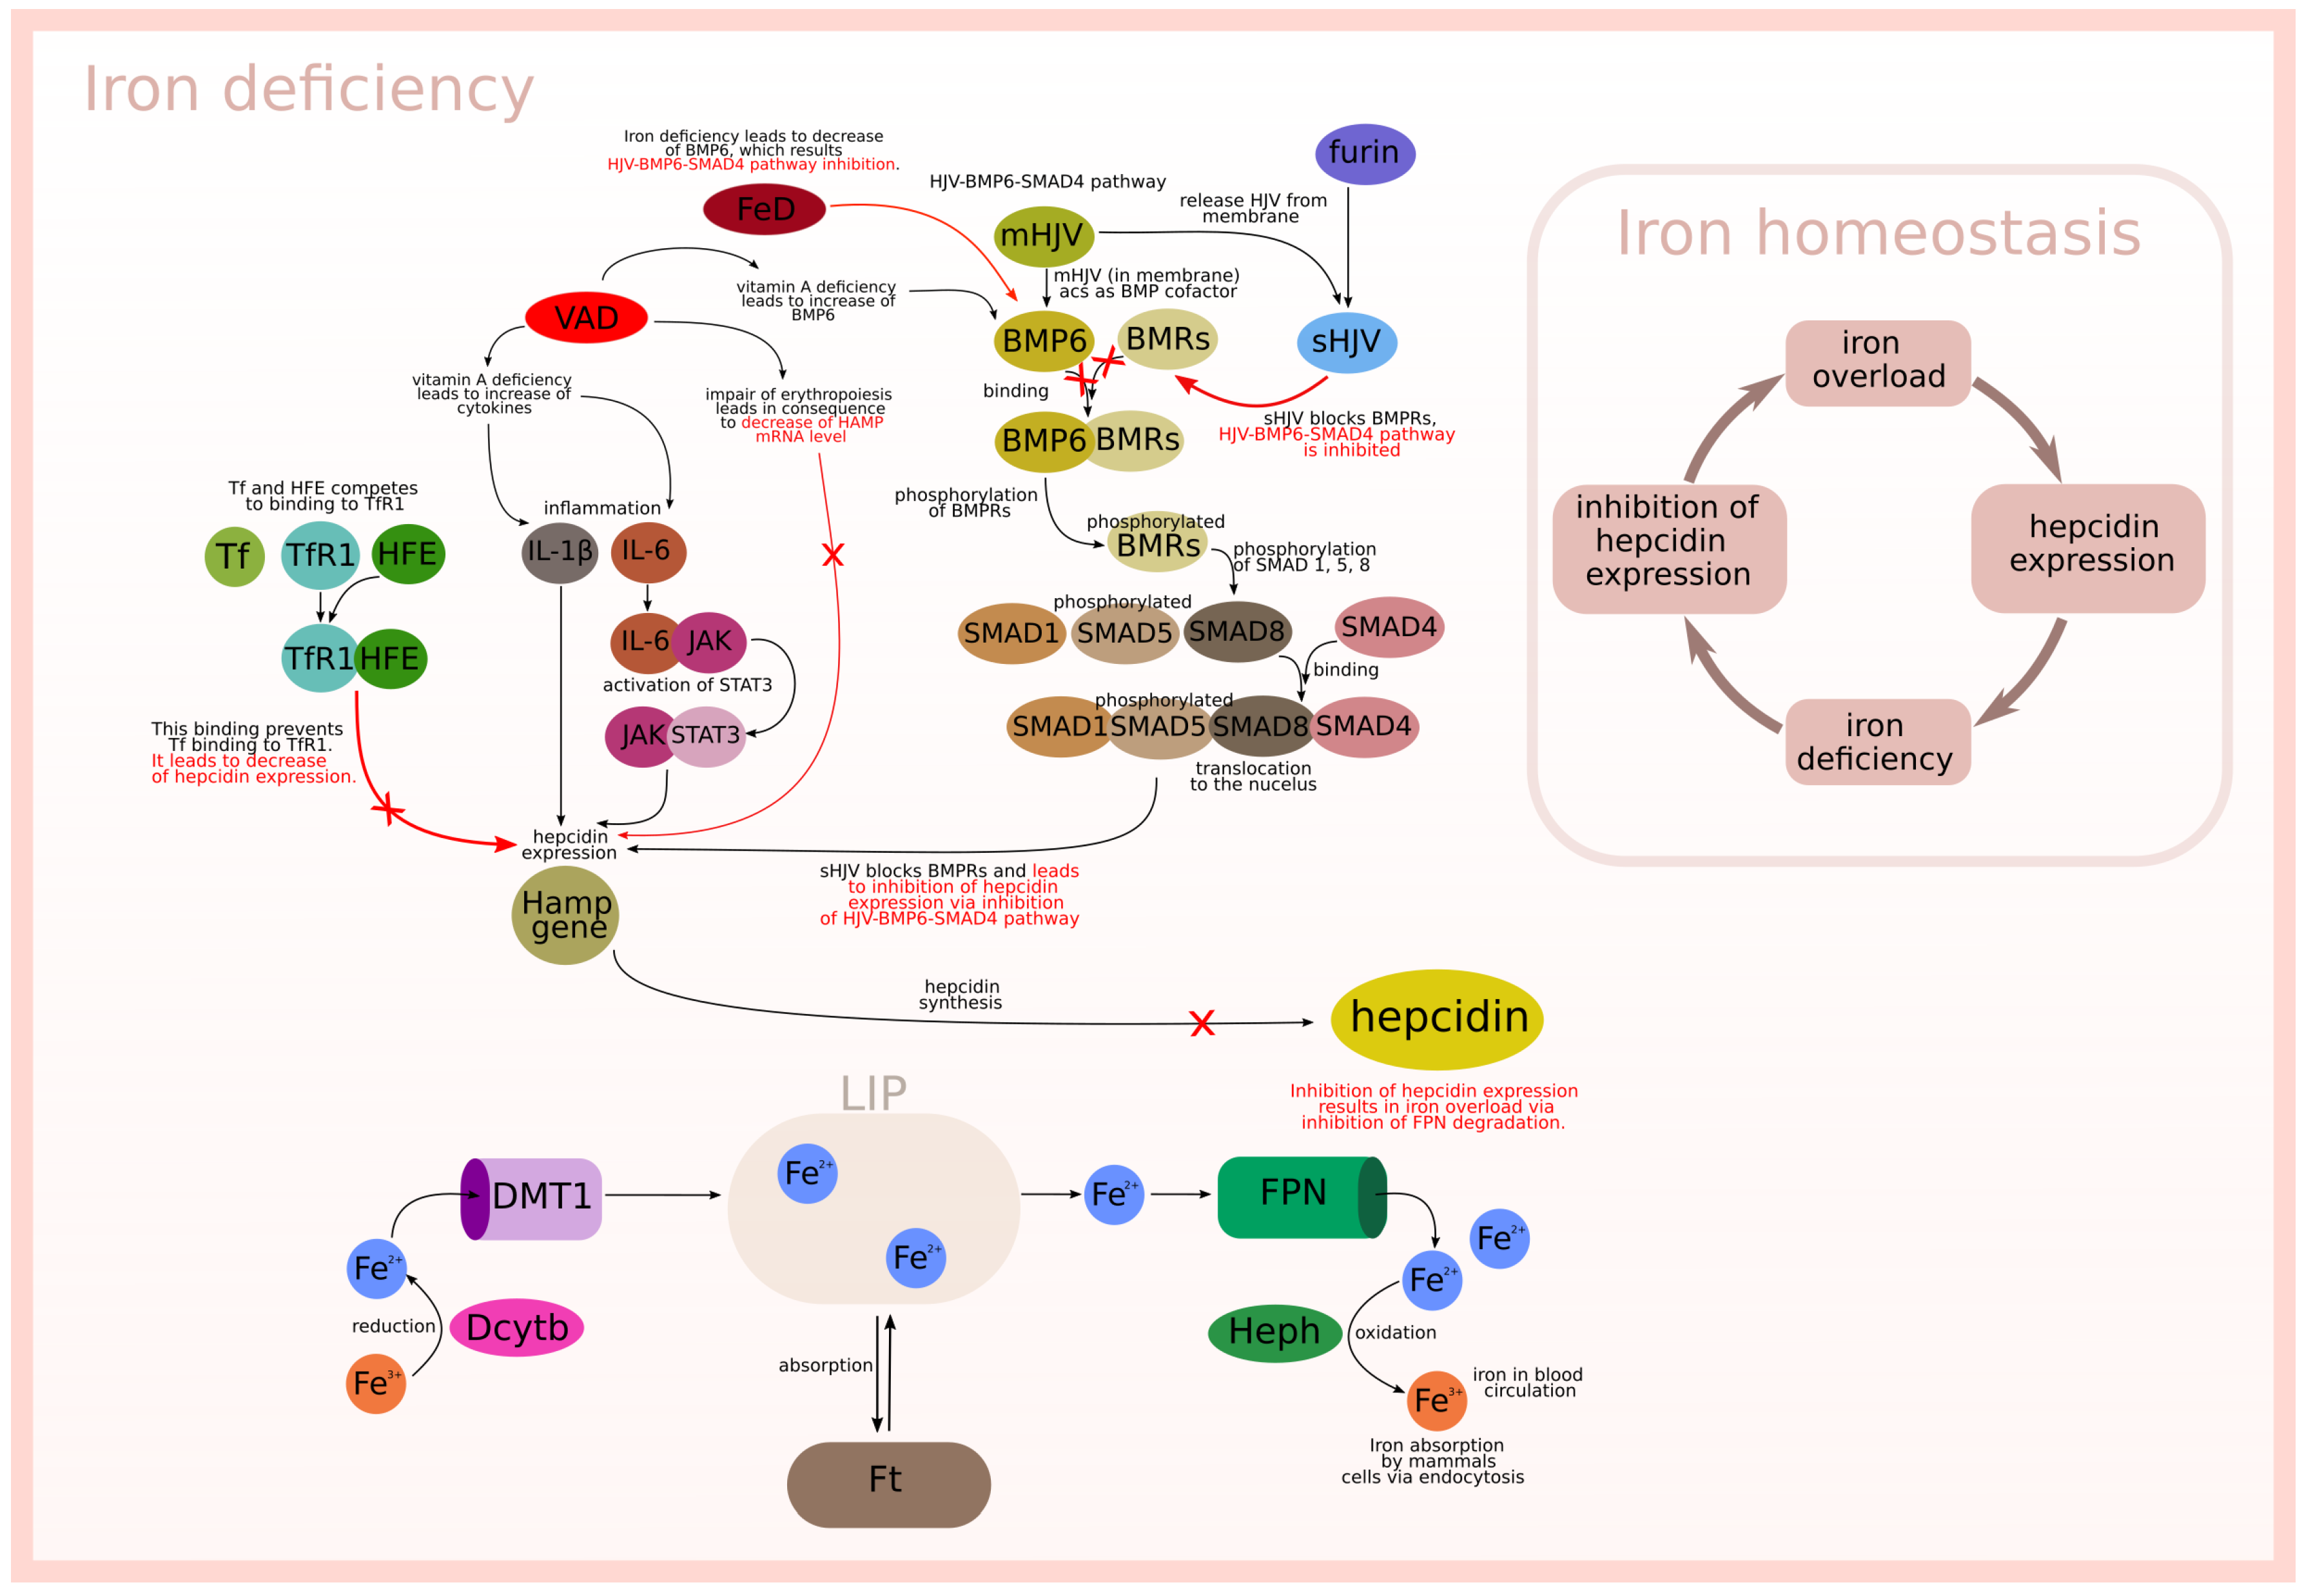
- Inhibition of HJV-BMP6-SMAD4 pathway (subprocess (o) included in 6 t-clusters and subprocess (s) included in 12 t-clusters, see Table 4).
- Binding HFE to TfR1 (subprocess (g) included in 7 t-clusters, see Table 4).
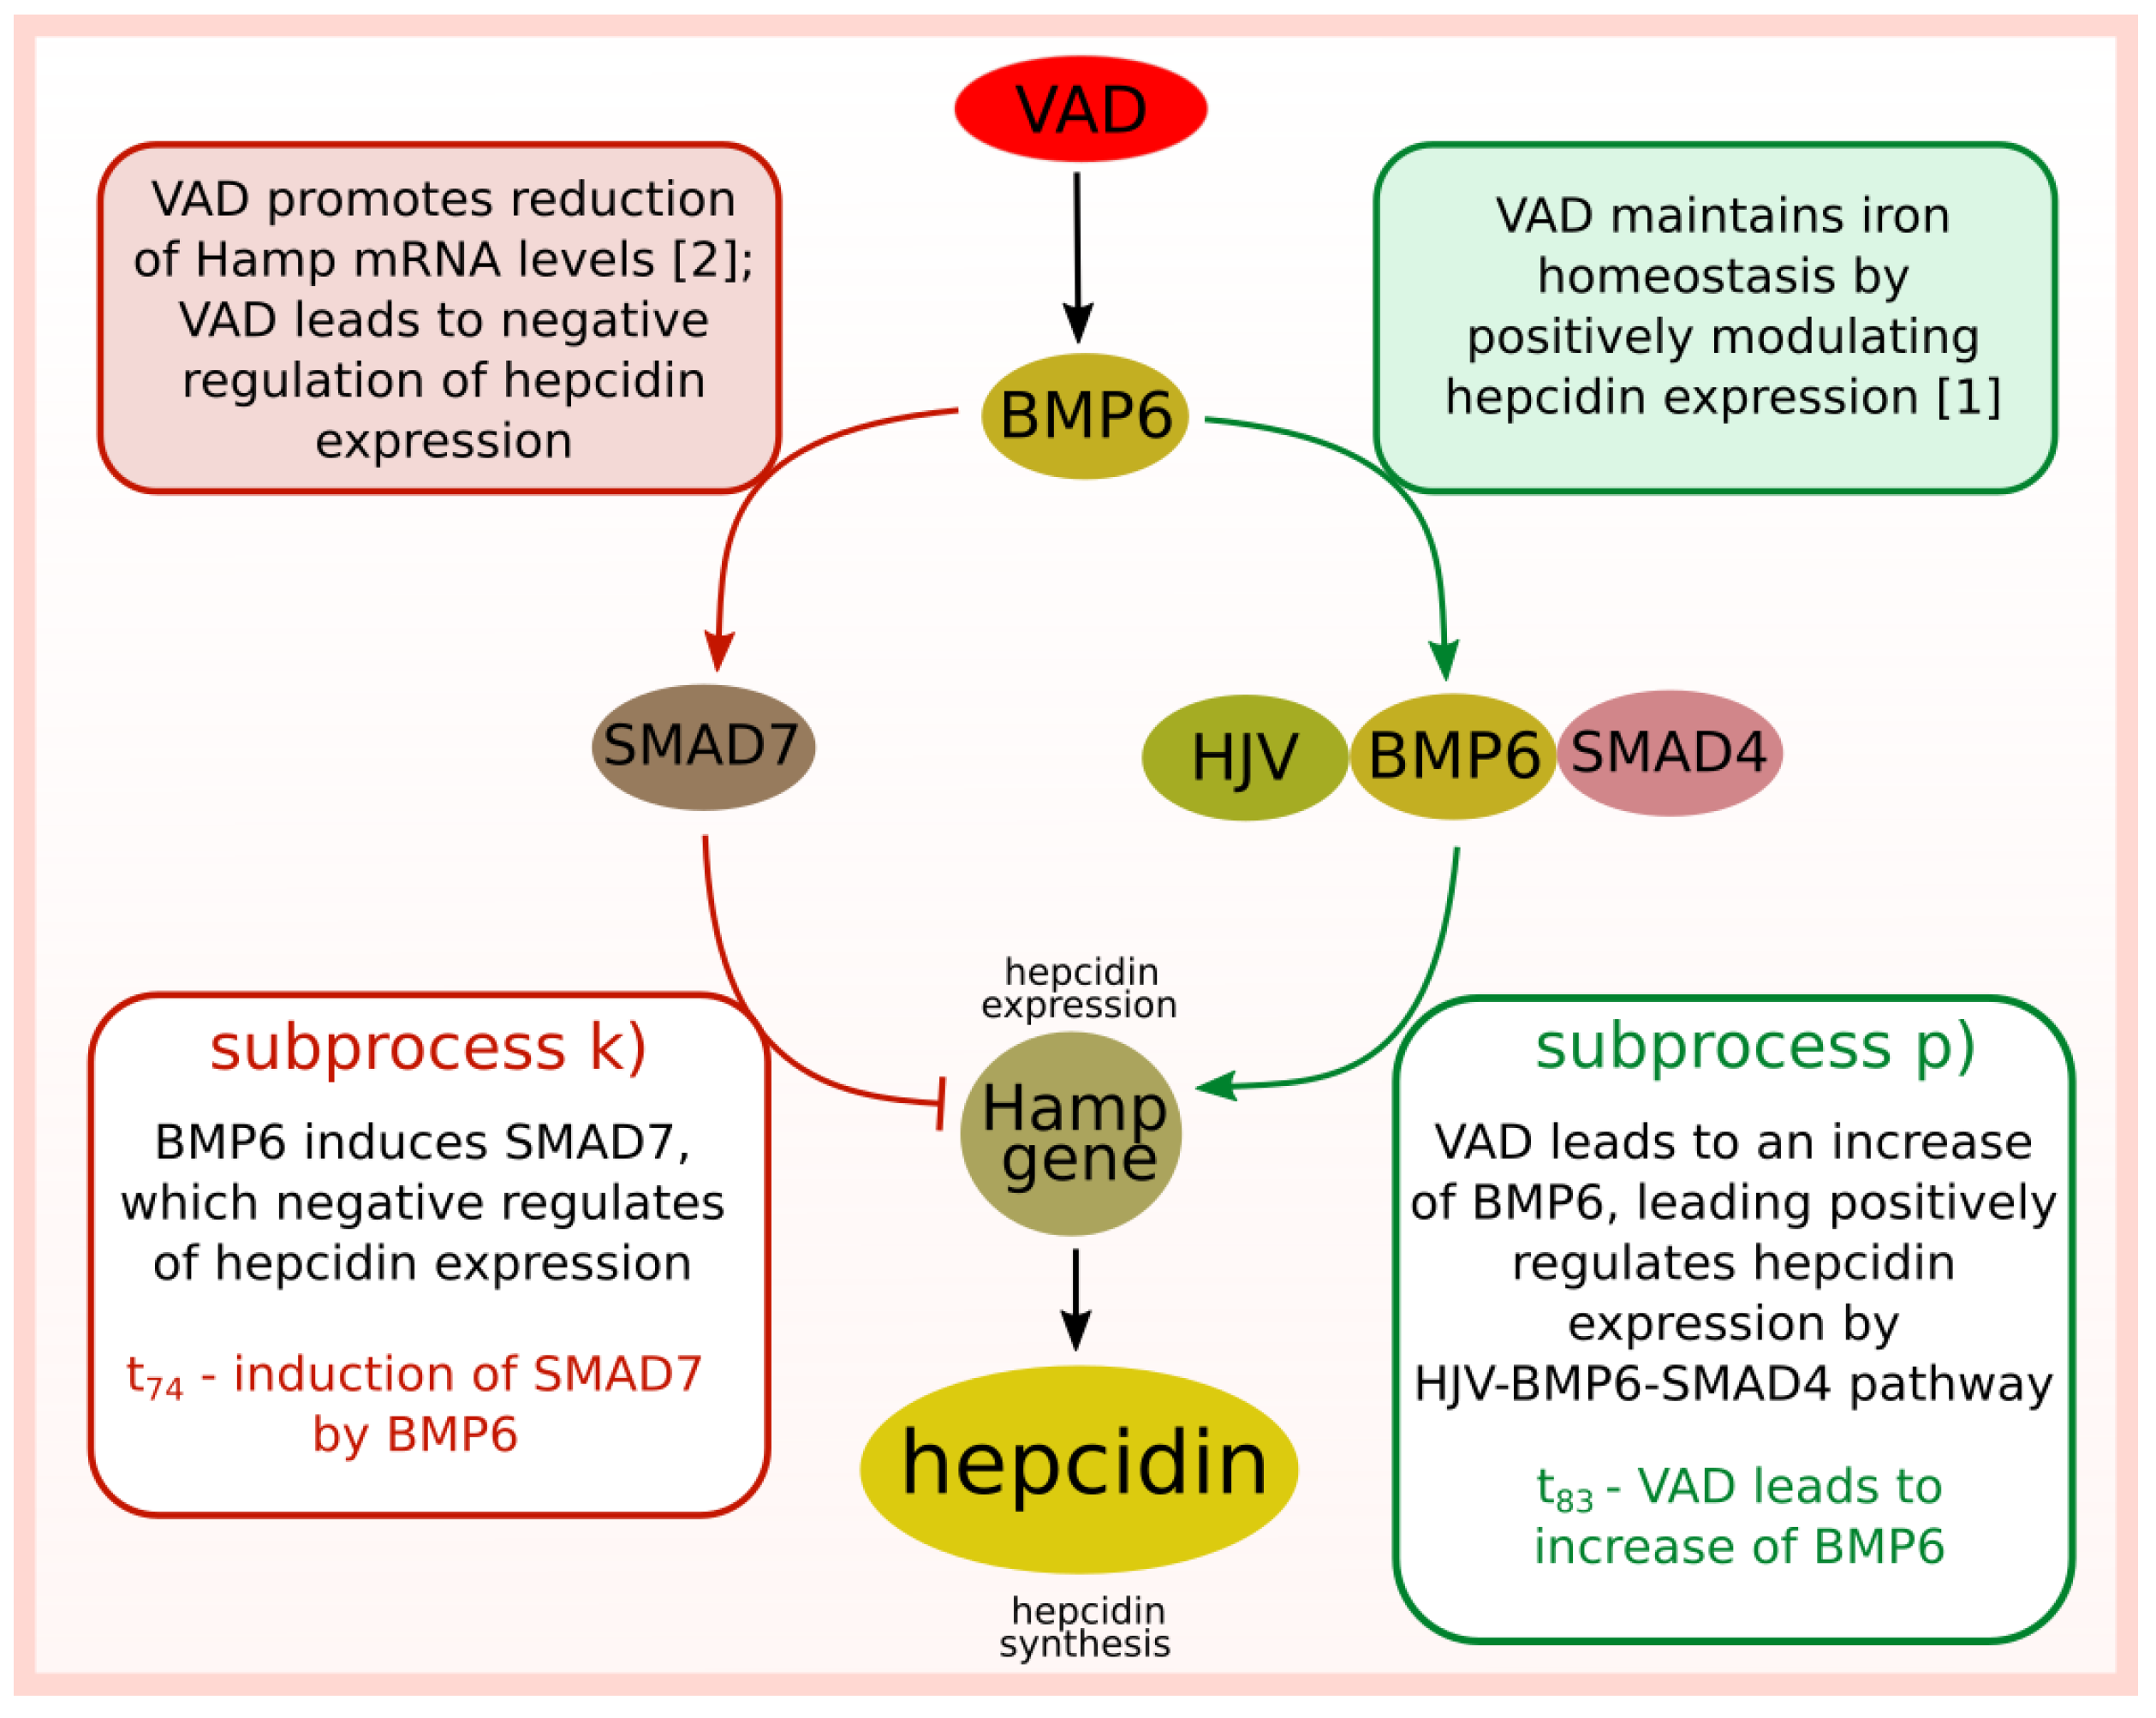
- Induction of SMAD7 by BMP6 (subprocess (k) included in 6 t-clusters, see Table 4).
- Impairing of erythropoiesis (subprocess (t) included in 12 t-clusters, see Table 4).
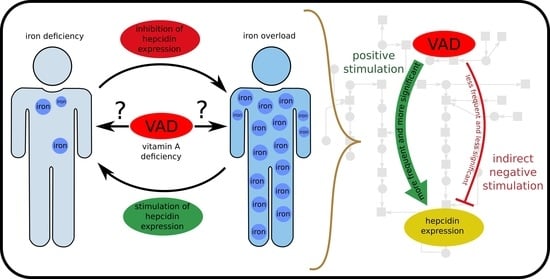
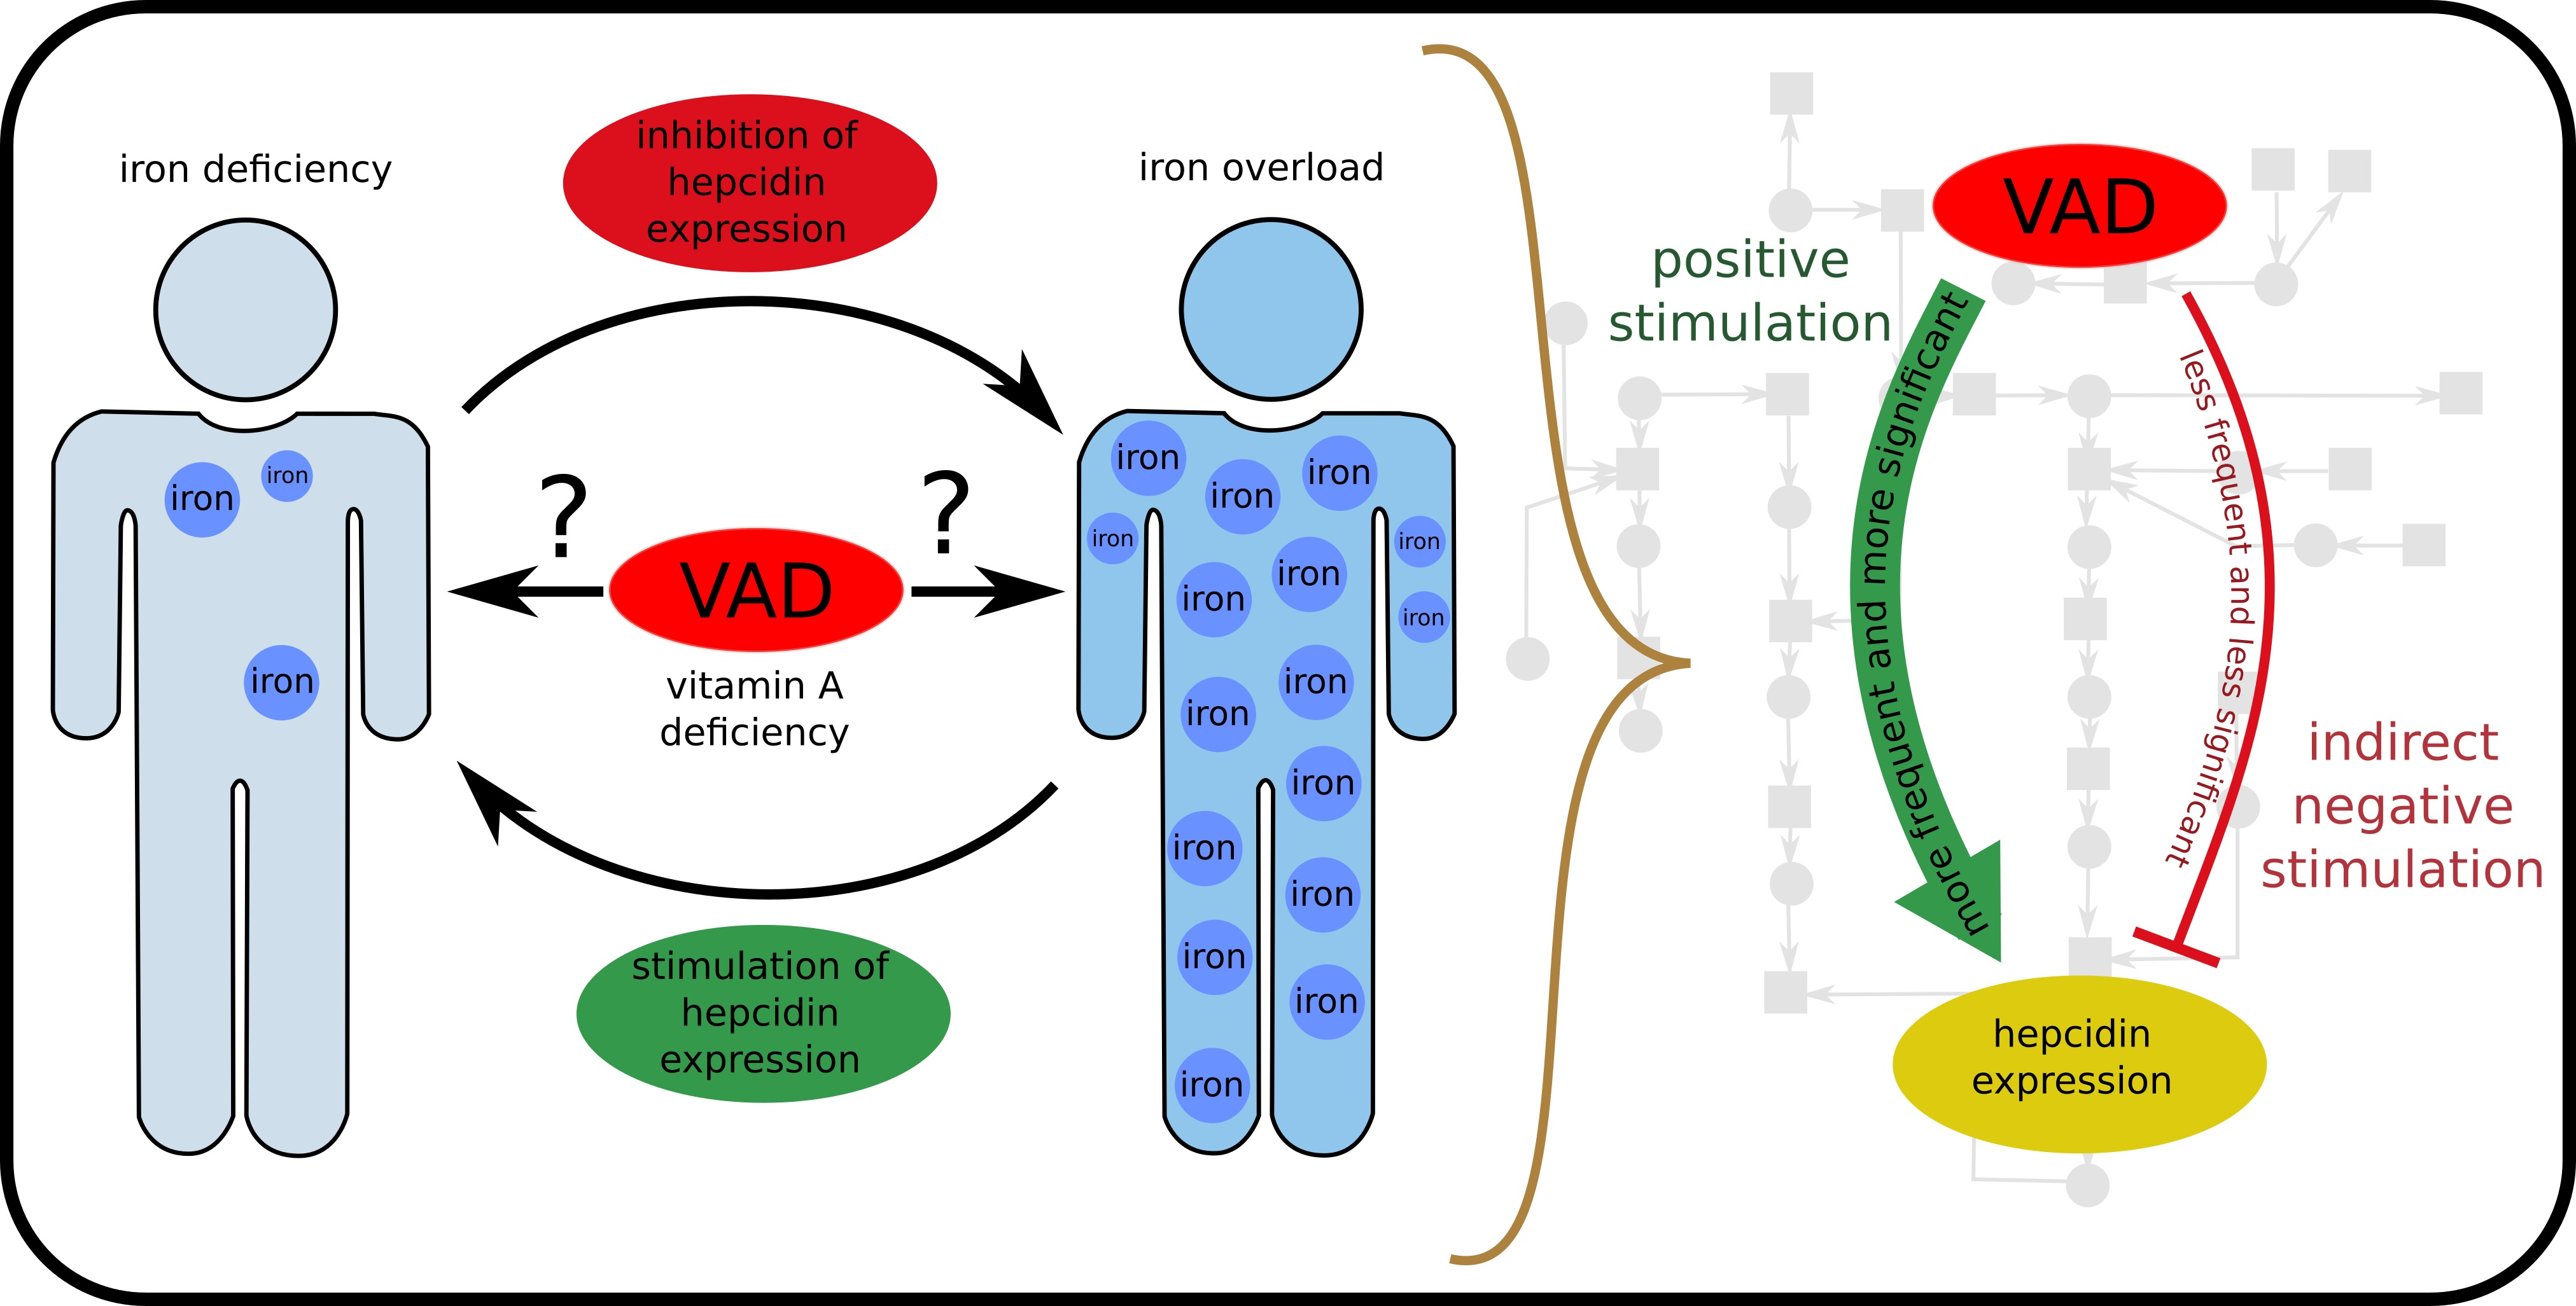
- VAD additionally stimulates hepcidin expression by increase of IL-6 and IL-1 (subprocess (i)) included in 12 t-clusters).
- VAD leads to increase of BMP6 (subprocess (p) included in 6 t-clusters).
- VAD and low iron level leads to decrease of BMP6, which results in inhibition of hepcidin expression (subprocess (s) included in 12 t-clusters).
- VAD and iron deficiency impair of erythropoiesis leading to negative regulation of hepcidin expression (subprocess (t) included in 12 t-clusters).
- Studies described in [1]:
- -
- Experimental animals: male Wistar rats, 21 days-old with a mean body weight of 52.5 ± 3.1g.
- -
- Durations of treatments: 57 days.
- -
- Three experimental groups of rats with six animals per group:
- *
- The control group received an AIN-93G diet [29], where concentrations of vitamin A (4000 IU/kg) was replaced by an equivalent amount of -carotene (14,400 /kg).
- *
- Vitamin A-deficient group received the AIN-93G without any source of vitamin A.
- *
- Vitamin A and iron-deficient group received the AIN-93G without any source of vitamin A and only 12.2 mg of iron/kg of diet.
- Studies described in [2]:
- -
- Experimental animals: male Wistar rats, 21 days-old with a mean body weight of 65.7 ± 5.5 g.
- -
- Duration of treatments: 59 days.
- -
- 5 experimental groups of rats with six animals per group:
- *
- The control group received the AIN-93G diet, containing 4000 IU of vitamin A/kg.
- *
- Vitamin A-deficient group received the AIN-93G diet without any source of vitamin A.
- *
- Iron-deficient group received the AIN-93G diet without any source of iron.
- *
- Vitamin A and iron-deficient group received the AIN-93G diet without any source of vitamin A or iron.
- *
- All-trans retinoic acid (atRA) group received the AIN-93G diet with 12 mg atRA/kg of diet.
- Subprocess stimulating hepcidin expression (—VAD leads to increase of BMP6): the average number of firings is equal to 24.30.
- Subprocess inhibiting hepcidin expression (—BMP6 induces SMAD7): the average number of firings is equal to 13.99.
4. Methods
5. Conclusions
Supplementary Materials
Author Contributions
Funding
Institutional Review Board Statement
Informed Consent Statement
Data Availability Statement
Conflicts of Interest
Abbreviations
| atRA | all-trans retinoic acid |
| BMP | bone morphogenetic protein |
| BMP6 | bone morphogenetic protein 6 |
| BMPRs | bone morphogenetic protein receptors |
| C–H | Calinski–Harabasz coefficient |
| Dcytb | duodenal cytochrome b |
| DMT1 | divalent metal transporter 1 |
| EPO | erytropoietin |
| FBXL5 | F-box and leucine rich repeat protein 5 |
| FeD | iron deficiency |
| FPN | ferroportin |
| Ft | ferritin |
| HAMP | hepcidin antimicrobial peptide (gene encoding hepcidin) |
| Heph | hephaestin |
| HFE | homeostatic iron regulator |
| HJV | hemojuvelin |
| IL-6 | interleukin-6 |
| IL-1 | interleukin-1 |
| IRE | iron responsive element |
| IRP | iron regulatory protein |
| JAK2 | janus kinases |
| LIP | labile iron pool |
| MCT sets | Maximal Common Transition sets |
| mHJV | membrane hemojuvelin |
| MSS | Mean Split Silhouette index |
| ROS | reactive oxygen species |
| sHJV | soluble hemojuvelin |
| SMAD | mothers against decapentaplegic |
| STAT | signal transducer and activator of transcription protein |
| Tf | transferrin |
| TfR1 | transferrin receptor protein 1 |
| trans./t-inv. | transition/t-invariant |
| Tyr | tyrosine |
| VAD | vitamin A deficiency |
References
- Arruda, S.F.; de Almeida Siqueira, E.M.; de Valência, F.F. Vitamin A deficiency increases hepcidin expression and oxidative stress in rat. Nutrition 2009, 25, 472–478. [Google Scholar] [CrossRef] [PubMed]
- da Cunha, M.S.; Siqueira, E.M.; Trindade, L.S.; Arruda, S.F. Vitamin A deficiency modulates iron metabolism via ineffective erythropoiesis. J. Nutr. Biochem. 2014, 25, 1035–1044. [Google Scholar] [CrossRef] [PubMed]
- Mendes, J.F.; de Almeida Siqueira, E.M.; Arruda, S.F. Vitamin A deficiency modulates iron metabolism independent of hemojuvelin (Hfe2) and bone morphogenetic protein 6 (Bmp6) transcript levels. Genes Nutr. 2016, 11, 1–7. [Google Scholar] [CrossRef] [PubMed] [Green Version]
- Roodenburg, A.C.; West, C.E.; Hovenierl, R.; Beynen, A.C. Supplemental vitamin A enhances the recovery from iron deficiency in rats with chronic vitamin A deficiency. Br. J. Nutr. 1996, 75, 623–636. [Google Scholar] [CrossRef] [PubMed]
- Strube, Y.N.J.; Beard, J.L.; Ross, A.C. Iron deficiency and marginal vitamin A deficiency affect growth, hematological indices and the regulation of iron metabolism genes in rats. J. Nutr. 2002, 132, 3607–3615. [Google Scholar] [CrossRef] [PubMed] [Green Version]
- Schroeder, S.E.; Reddy, M.B.; Schalinske, K.L. Retinoic acid modulates hepatic iron homeostasis in rats by attenuating the RNA-binding activity of iron regulatory proteins. J. Nutr. 2007, 137, 2686–2690. [Google Scholar] [CrossRef] [Green Version]
- Blackfan, K.D.; Wolbach, S.B. Vitamin A deficiency in infants: A clinical and pathological study. J. Pediatr. 1933, 3, 679–706. [Google Scholar] [CrossRef]
- Findlay, G.; Mackenzie, R. The bone marrow in deficiency diseases. J. Pathol. 1922, 25, 402–403. [Google Scholar]
- Koessler, K.K.; Maurer, S.; Loughlin, R. The relation of anemia, primary and secondary, to vitamin A deficiency. J. Am. Med. Assoc. 1926, 87, 476–482. [Google Scholar] [CrossRef]
- Murata, T. Petri nets: Properties, analysis and applications. Proc. IEEE 1989, 77, 541–580. [Google Scholar] [CrossRef]
- Petri, C. Communication with Automata; Schriften des Instituts fur Instrumentelle Mathematik: Bonn, Germany, 1962. [Google Scholar]
- Reisig, W. Understanding Petri Nets: Modeling Techniques, Analysis Methods, Case Studies; Springer: Berlin/Heidelberg, Germany, 2013. [Google Scholar]
- Koch, I.; Reisig, W.; Schreiber, F. Modeling in Systems Biology: The Petri Net Approach; Springer Science & Business Media: London, UK, 2010; Volume 16. [Google Scholar]
- Formanowicz, D.; Radom, M.; Rybarczyk, A.; Formanowicz, P. The role of Fenton reaction in ROS-induced toxicity underlying atherosclerosis—Modeled and analyzed using a Petri net-based approach. Biosystems 2018, 165, 71–87. [Google Scholar] [CrossRef] [PubMed]
- Anderson, G.J.; Frazer, D.M. Current understanding of iron homeostasis. Am. J. Clin. Nutr. 2017, 106, 1559S–1566S. [Google Scholar] [CrossRef] [PubMed] [Green Version]
- Hentze, M.W.; Muckenthaler, M.U.; Galy, B.; Camaschella, C. Two to tango: Regulation of Mammalian iron metabolism. Cell 2010, 142, 24–38. [Google Scholar] [CrossRef] [PubMed] [Green Version]
- Zhou, Z.D.; Tan, E.K. Iron regulatory protein (IRP)-iron responsive element (IRE) signaling pathway in human neurodegenerative diseases. Mol. Neurodegener. 2017, 12, 1–12. [Google Scholar] [CrossRef] [PubMed]
- Zhao, N.; Zhang, A.S.; Enns, C.A. Iron regulation by hepcidin. J. Clin. Investig. 2013, 123, 2337–2343. [Google Scholar] [CrossRef]
- Pagani, A.; Nai, A.; Silvestri, L.; Camaschella, C. Hepcidin and Anemia: A Tight Relationship. Front. Physiol. 2019, 10, 1294. [Google Scholar] [CrossRef]
- Sangkhae, V.; Nemeth, E. Regulation of the Iron Homeostatic Hormone Hepcidin. Adv. Nutr. 2017, 8, 126–136. [Google Scholar] [CrossRef]
- Formanowicz, D.; Sackmann, A.; Kozak, A.; Błażewicz, J.; Formanowicz, P. Some aspects of the anemia of chronic disorders modeled and analyzed by petri net based approach. Bioprocess Biosyst. Eng. 2011, 34, 581–591. [Google Scholar] [CrossRef] [Green Version]
- Formanowicz, D.; Kozak, A.; Głowacki, T.; Radom, M.; Formanowicz, P. Hemojuvelin–hepcidin axis modeled and analyzed using Petri nets. J. Biomed. Inform. 2013, 46, 1030–1043. [Google Scholar] [CrossRef] [Green Version]
- Rishi, G.; Subramaniam, V.N. The liver in regulation of iron homeostasis. Am. J. Physiol.-Gastrointest. Liver Physiol. 2017, 313, G157–G165. [Google Scholar] [CrossRef] [Green Version]
- Heiner, M.; Herajy, M.; Liu, F.; Rohr, C.; Schwarick, M. Snoopy–a unifying Petri net tool. In Proceedings of the International Conference on Application and Theory of Petri Nets and Concurrency, Hamburg, Germany, 27–29 June 2012; pp. 398–407. [Google Scholar]
- Radom, M.; Rybarczyk, A.; Szawulak, B.; Andrzejewski, H.; Chabelski, P.; Kozak, A.; Formanowicz, P. Holmes: A graphical tool for development, simulation and analysis of Petri net based models of complex biological systems. Bioinformatics 2017, 33, 3822–3823. [Google Scholar] [CrossRef] [PubMed] [Green Version]
- Rousseeuw, P.J. Silhouettes: A graphical aid to the interpretation and validation of cluster analysis. J. Comput. Appl. Math. 1987, 20, 53–65. [Google Scholar] [CrossRef] [Green Version]
- Kaufman, L.; Rousseeuw, P.J. Finding Groups in Data: An Introduction to Cluster Analysis; John Wiley & Sons: New York, NY, USA, 1990. [Google Scholar]
- Caliński, T.; Harabasz, J. A dendrite method for cluster analysis. Commun. Stat.-Theory Methods 1974, 3, 1–27. [Google Scholar] [CrossRef]
- Reeves, P.G.; Nielsen, F.H.; Fahey, G.C., Jr. AIN-93 Purified Diets for Laboratory Rodents: Final Report of the American Institute of Nutrition ad hoc Writing Committee on the Reformulation of the AIN-76A Rodent Diet. J Nutr. 1993, 123, 1939–1951. [Google Scholar] [CrossRef] [PubMed]
- David, R.; Alla, H. Discrete, Continuous and Hybrid Petri Nets; Springer: Berlin/Heidelberg, Germany, 2010. [Google Scholar]
- Grafahrend-Belau, E.; Schreiber, F.; Heiner, M.; Sackmann, A.; Junker, B.; Grunwald, S.; Speer, A.; Winder, K.; Koch, I. Modularization of biochemical networks based on classification of Petri net t-invariants. BMC Bioinform. 2008, 9, 90. [Google Scholar] [CrossRef] [Green Version]
- Formanowicz, D.; Radom, M.; Zawierucha, P.; Formanowicz, P. Petri net-based approach to modeling and analysis of selected aspects of the molecular regulation of angiogenesis. PLoS ONE 2017, 12, e0173020. [Google Scholar] [CrossRef] [Green Version]
- Gutowski, Ł.; Gutowska, K.; Pioruńska-Stolzmann, M.; Formanowicz, P.; Formanowicz, D. Systems approach to study associations between OxLDL and abdominal aortic aneurysms. Int. J. Mol. Sci. 2019, 20, 3909. [Google Scholar] [CrossRef] [Green Version]


| ID | Biological Meaning | ID | Biological Meaning |
|---|---|---|---|
| cells involved in iron homeostasis | increase of DMT1 by apo-IRP1 | ||
| hepcidin synthesis | inhibition of Ft by apo-IRP1 | ||
| hepcidin binds to Fpn | inhibition of Fpn by apo-IRP1 | ||
| hepcidin and Fpn binds JAK2 | holo-IRP1 formation | ||
| source of JAK2 | apo-IRP2 formation leads to the same effect as apo-IRP1 | ||
| phosphorylation of Tyr residues in Fpn by JAK2 | decrease of TfR1 caused by holo-IRP1 | ||
| signal for displacement to cytoplasm | decrease of DMT1 caused by holo-IRP1 | ||
| dephosphorylation of Fpn | increase of Ft caused by holo-IRP1 | ||
| ubiquitination of Fpn | increase of Fpn caused by holo-IRP1 | ||
| lysosomal degradation of Fpn | iron status | ||
| degradated Fpn prevents iron release from enterocytes and splenic macrophages | expression of hepcidin | ||
| iron accumulation lead to decrease of iron concentration in serum | inflammation | ||
| down regulation of DMT1 by blocked iron in enterocytes | IL-6 binds with JAK | ||
| source of ubiquitin protein E3 | activation of STAT3 | ||
| iron export to enterocytes by DMT1 | expression of hepcidin by JAK-STAT3 | ||
| source of DMT1 | modulation of hepcidin expression | ||
| iron ion Fe reduction to Fe via Dcytb | Tf binds to TfR1 in case of normal iron status | ||
| source of Dcytb | HFE binds to TfR1 in case of iron deficiency | ||
| source of iron ion Fe | HFE binds to TfR1 and prevents Tf binding to TfR1 which decrease of hepcidin expression | ||
| down regulation of DMT1 leads to decrease of iron absorption | Tf binds to TfR1 and prevents HFE binding | ||
| Fenton reaction | mHJV acts as BMP cofactor | ||
| increase of oxidative stress via ROS | BMP6 binds to BMPR I and II | ||
| iron export from LIP to cells | source of BMPR I | ||
| absorption of iron | source of BMPR II | ||
| feedback iron form storage in enterocytes | BMP and BMPRs binding induces phosphoryla tion of BMPRs | ||
| iron export from enterocytes to blood circulation by Fpn | phosphorylation of SMAD 1,5 and 8 | ||
| enterocytes ferroportin | phosphorylated SMAD 1,5 and 8 binds SMAD4 | ||
| Fe oxydation to Fe by Heph | source of SMAD4 | ||
| source of hephaestin | translocation to the nucleus | ||
| iron from enterocytes binds to Tf | BMP6 induces SMAD7 | ||
| source of transferrin | negative ragulation of hepcidin | ||
| source of transferrin receptor protein 1 | mHJV is located in membrane | ||
| iron absorption by mammals via endocytosis | activation of furin | ||
| IRP/IRE mechanism in iron overload | HJV is released from membrane via proteolytic reaction of furin | ||
| IRP/IRE mechanism in iron deficiency | sHJV blocks BMPRs | ||
| degradation of FBXL5 | inhibition of hepcidin expression | ||
| increase of IRP2 | vitamin A deficiency | ||
| increase of FBXL5 | VAD leads to impairment of inflammatory respon se which leads to increase of cytokines | ||
| degradation of IRP2 | VAD leads to increase of BMP6 | ||
| apo-IRP1 formation | decrease of BMP6 | ||
| apo-IRP1 binds to IRE in 3′UTR region of TfR1 | decreased BMP6 inhibits BMP pathway and exp ression of hepcidin | ||
| apo-IRP1 binds to IRE in 3′UTR region of DMT1 | impair of erythropoiesis | ||
| apo-IRP1 binds to IRE in 5′UTR region of Ft | increased phagocytosis of malformed and undiff erential erythrocytes | ||
| apo-IRP1 binds to IRE in 5′UTR region of Fpn | accumulation of iron in spleen | ||
| increase of TfR1 by apo-IRP1 | decrease of HAMP mRNA level despite increase of BMP6 |
| MCT Set | Contained Transitions | Biological Interpretation |
|---|---|---|
| , , , , , , , , , , , , , , , | Iron ion Fe is reduced to ion Fe II by Dcytb and then is exported to enterocytes (to LIP) by DMT1. Hepcidin binds to Fpn and leads to degradation and internalization of Fpn. What results in prevention of iron release from enterocytes and macrophages. | |
| , , , , , , , | Expression of hepcidin by HJV-BMP6-SMAD4 pathway. | |
| , , , | Iron in enterocytes is absorbed by Ft and is also exported by Fpn to blood circulation. | |
| , , , | Expression of hepcidin by cytokines IL-6 (JAK-STAT3 pathway) and IL-1. | |
| , , , | Low iron level activates furin which release HJV from membrane via proteolytic reaction. Soluble HJV blocks BMPRs and inhibits expression of hepcidin by inhibition of HJV-BMP6-SMAD4 pathway. | |
| , , , | Vitamin A deficiency and iron deficiency impair of erythropoiesis, which results in increased phagocytosis of malformed and undifferential erythrocytes. This mechanism in consequence leads to accumulation of iron in spleen and to decrease of Hamp mRNA level. | |
| , , | Low iron level leads to degradation of FBXL5, which results in increase of IRP2. IRP2 play the same role as IRP1, leads to increase of TfR1 and DMT1 and to decrease of Ft and Fpn. | |
| , | Hepcidin leads to degradation and internalization Fpn, which results in down-regulation of DMT1 and leads to decrease of iron absorption. | |
| , | Iron is engaged in Fenton reaction, which leads to increase of oxidative stress via ROS. | |
| , | Iron absorption by mammals via endocytosis. To be precise, iron ion Fe binds to transferrin (Tf) and next binds to transferrin receptor protein 1 (TfR1), which results in iron absorption. | |
| , | Formation of holo-IRP1 (IRP/IRE mechanisms) in case of increase of iron concentration. | |
| , | Formation of apo-IRP1 (IRP/IRE mechanisms) in case of decrease of iron concentration. | |
| , | apo-IRP1 binds to IRE in 3′UTR region of TfR1, which leads to increase of TfR1. | |
| , | apo-IRP1 binds to IRE in 3′UTR region of DMT1, which leads to increase of DMT1. | |
| , | apo-IRP1 binds to IRE in 5′UTR region of Ft, which leads to decrease of Ft. | |
| , | apo-IRP1 binds to IRE in 5′UTR region of Fpn, which leads to decrease of Fpn. | |
| , | In case of iron overload or iron normal status Tf bind to TfR1, which prevents HFE binding. Free HFE leads to increase of hepcidin expression. | |
| , | In case of iron deficiency HFE binds to TfR1, which lead to decrease of hepcidin expression (and in consequence to increase of iron concentration). | |
| , | BMP6 induces SMAD7, which negative regulates of hepcidin. | |
| , | Low iron level and vitamin A deficiency lead to decrease of BMP6, which results in inhibition of HJV-BMP6-SMAD4 pathway. |
| ID | Biological Meaning |
|---|---|
| (a) | Iron is exported by Fpn to blood circulation and then it can be absorbed by mammalian cells via endocytosis. To be precise, iron ion Fe binds to transferrin (Tf) and next binds to transferrin receptor protein 1 (TfR1), which results in iron absorption. |
| (b) | Iron can be engaged in Fenton reaction, but it occurs rarer than iron absorption in enterocytes. |
| (c) | IRP/IRE mechanisms play important roles: in case of increase of iron concentration holo-IRP1 is formed and it leads to increase of Fpn and to decrease of DMT1 and TfR1. |
| (d) | Iron is exported to enterocytes by DMT1, where is absorbed by Ft. |
| (e) | IRP/IRE mechanisms play important roles: in case of decrease of iron concentration apo-IRP1 is formed and it leads to increase of DMT1 and TfR1 and to decrease of Fpn. |
| (f) | Expression of hepcidin by free HFE (in case of iron overload or iron normal status Tf bind to TfR1, which prevents HFE binding). |
| (g) | In case of iron deficiency HFE binds to TfR1, which lead to decrease of hepcidin expression. |
| (h) | Expression of hepcidin by cytokines IL-6 (JAK-STAT3 pathway) and IL-1 |
| (i) | Vitamin A deficiency additionally stimulates gene Hamp expression by increase of IL-6 and IL-1. |
| (j) | Hepcidin binds to Fpn and leads to degradation and internalization of Fpn. This mechanism results in iron accumulation in enterocytes and macrophages and in consequence it leads to decrease of iron concentration in serum. |
| (k) | BMP6 induces SMAD7, which negative regulates of hepcidin expression ( HJV-BMP6-SMAD4 pathway inactive). |
| (l) | Inflammation leads to hepcidin expression by cytokines. |
| (m) | TfR1 is necessary to iron absorption by mammalian cells. |
| (n) | Expression of hepcidin by HJV-BMP6-SMAD4 pathway (HJV-BMP6-SMAD4 pathway leads to expression of Hamp gene). |
| (o) | Low iron level activates furin which release HJV from membrane via proteolytic reaction. Soluble HJV blocks BMPRs and inhibits expression of hepcidin by inhibition of HJV-BMP6-SMAD4 pathway. |
| (p) | Deficiency of vitamin A leads to increase of BMP6. |
| (r) | BAMP6 is engaged in HJV-BMP6-SMAD4 pathway, which leads to expression of Hamp gene. |
| (s) | Low iron level and vitamin A deficiency lead to decrease of BMP6, which results in inhibition of HJV-BMP6-SMAD4 pathway. |
| (t) | Vitamin A deficiency and iron deficiency impair of erythropoiesis, which results in increased phagocytosis of malformed and undifferential erythrocytes. This mechanism in consequence leads to accumulation of iron in spleen and to decrease of Hamp mRNA level. |
| Subprocess | ID | Name of Elementary Process | Significance | AvgT | |
|---|---|---|---|---|---|
| Frequency Trans./t-inv. | Percentage Ratio [%] | ||||
| Subprocesses Associated with Stimulation of Hepcidin Expression | |||||
| HJV-BMP6-SMAD4 pathway | translocation to the nucleus | 118/402 | 29% | 13.98 | |
| Cytokines IL-6 and IL-1 | expression of hepcidin by JAK STAT3 | 252/402 | 63% | 46.94 | |
| modulation of hepcidin expression | 252/402 | 63% | 49.86 | ||
| VAD leads to impairment of inflammatory response which leads to increase of cytokines | 126/402 | 31% | 24.38 | ||
| Free HFE | expression of hepcidin | 40/402 | 10% | 5.80 | |
| Tf binds to TfR1 and prevents HFE binding | 106/402 | 26% | 6.01 | ||
| Subprocesses associated with inhibition of hepcidin expression | |||||
| Inhibition of HJV-BMP6-SMAD4 pathway | inhibition of hepcidin expression | 48/402 | 12% | 2.00 | |
| decreased BMP6 inhibits BMP pathway and expression of hepcidin | 78/402 | 19% | 0.26 | ||
| Binding HFE to TfR1 | HFE binds to TfR1 in case of iron deficiency | 68/402 | 17% | 0.19 | |
| HFE binds to TfR1 and prevents Tf binding to TfR1 which decrease of hepcidin expression | 68/402 | 17% | 0.19 | ||
| Induction SMAD7 by BMP6 | BMP6 induces SMAD7 | 41/402 | 10% | 13.99 | |
| negative ragulation of hepcidin | 41/402 | 10% | 13.96 | ||
| Impairing of erythropoiesis | impair of erythropoiesis | 38/402 | 9% | 0.89 | |
Publisher’s Note: MDPI stays neutral with regard to jurisdictional claims in published maps and institutional affiliations. |
© 2022 by the authors. Licensee MDPI, Basel, Switzerland. This article is an open access article distributed under the terms and conditions of the Creative Commons Attribution (CC BY) license (https://creativecommons.org/licenses/by/4.0/).
Share and Cite
Gutowska, K.; Formanowicz, D.; Formanowicz, P. Interrelations between Iron and Vitamin A—Studied Using Systems Approach. Int. J. Mol. Sci. 2022, 23, 1189. https://doi.org/10.3390/ijms23031189
Gutowska K, Formanowicz D, Formanowicz P. Interrelations between Iron and Vitamin A—Studied Using Systems Approach. International Journal of Molecular Sciences. 2022; 23(3):1189. https://doi.org/10.3390/ijms23031189
Chicago/Turabian StyleGutowska, Kaja, Dorota Formanowicz, and Piotr Formanowicz. 2022. "Interrelations between Iron and Vitamin A—Studied Using Systems Approach" International Journal of Molecular Sciences 23, no. 3: 1189. https://doi.org/10.3390/ijms23031189