
Protective Effect of Ethyl Rosmarinate against Ulcerative Colitis in Mice Based on Untargeted Metabolomics

 , and
, and
Abstract
:1. Introduction
2. Results
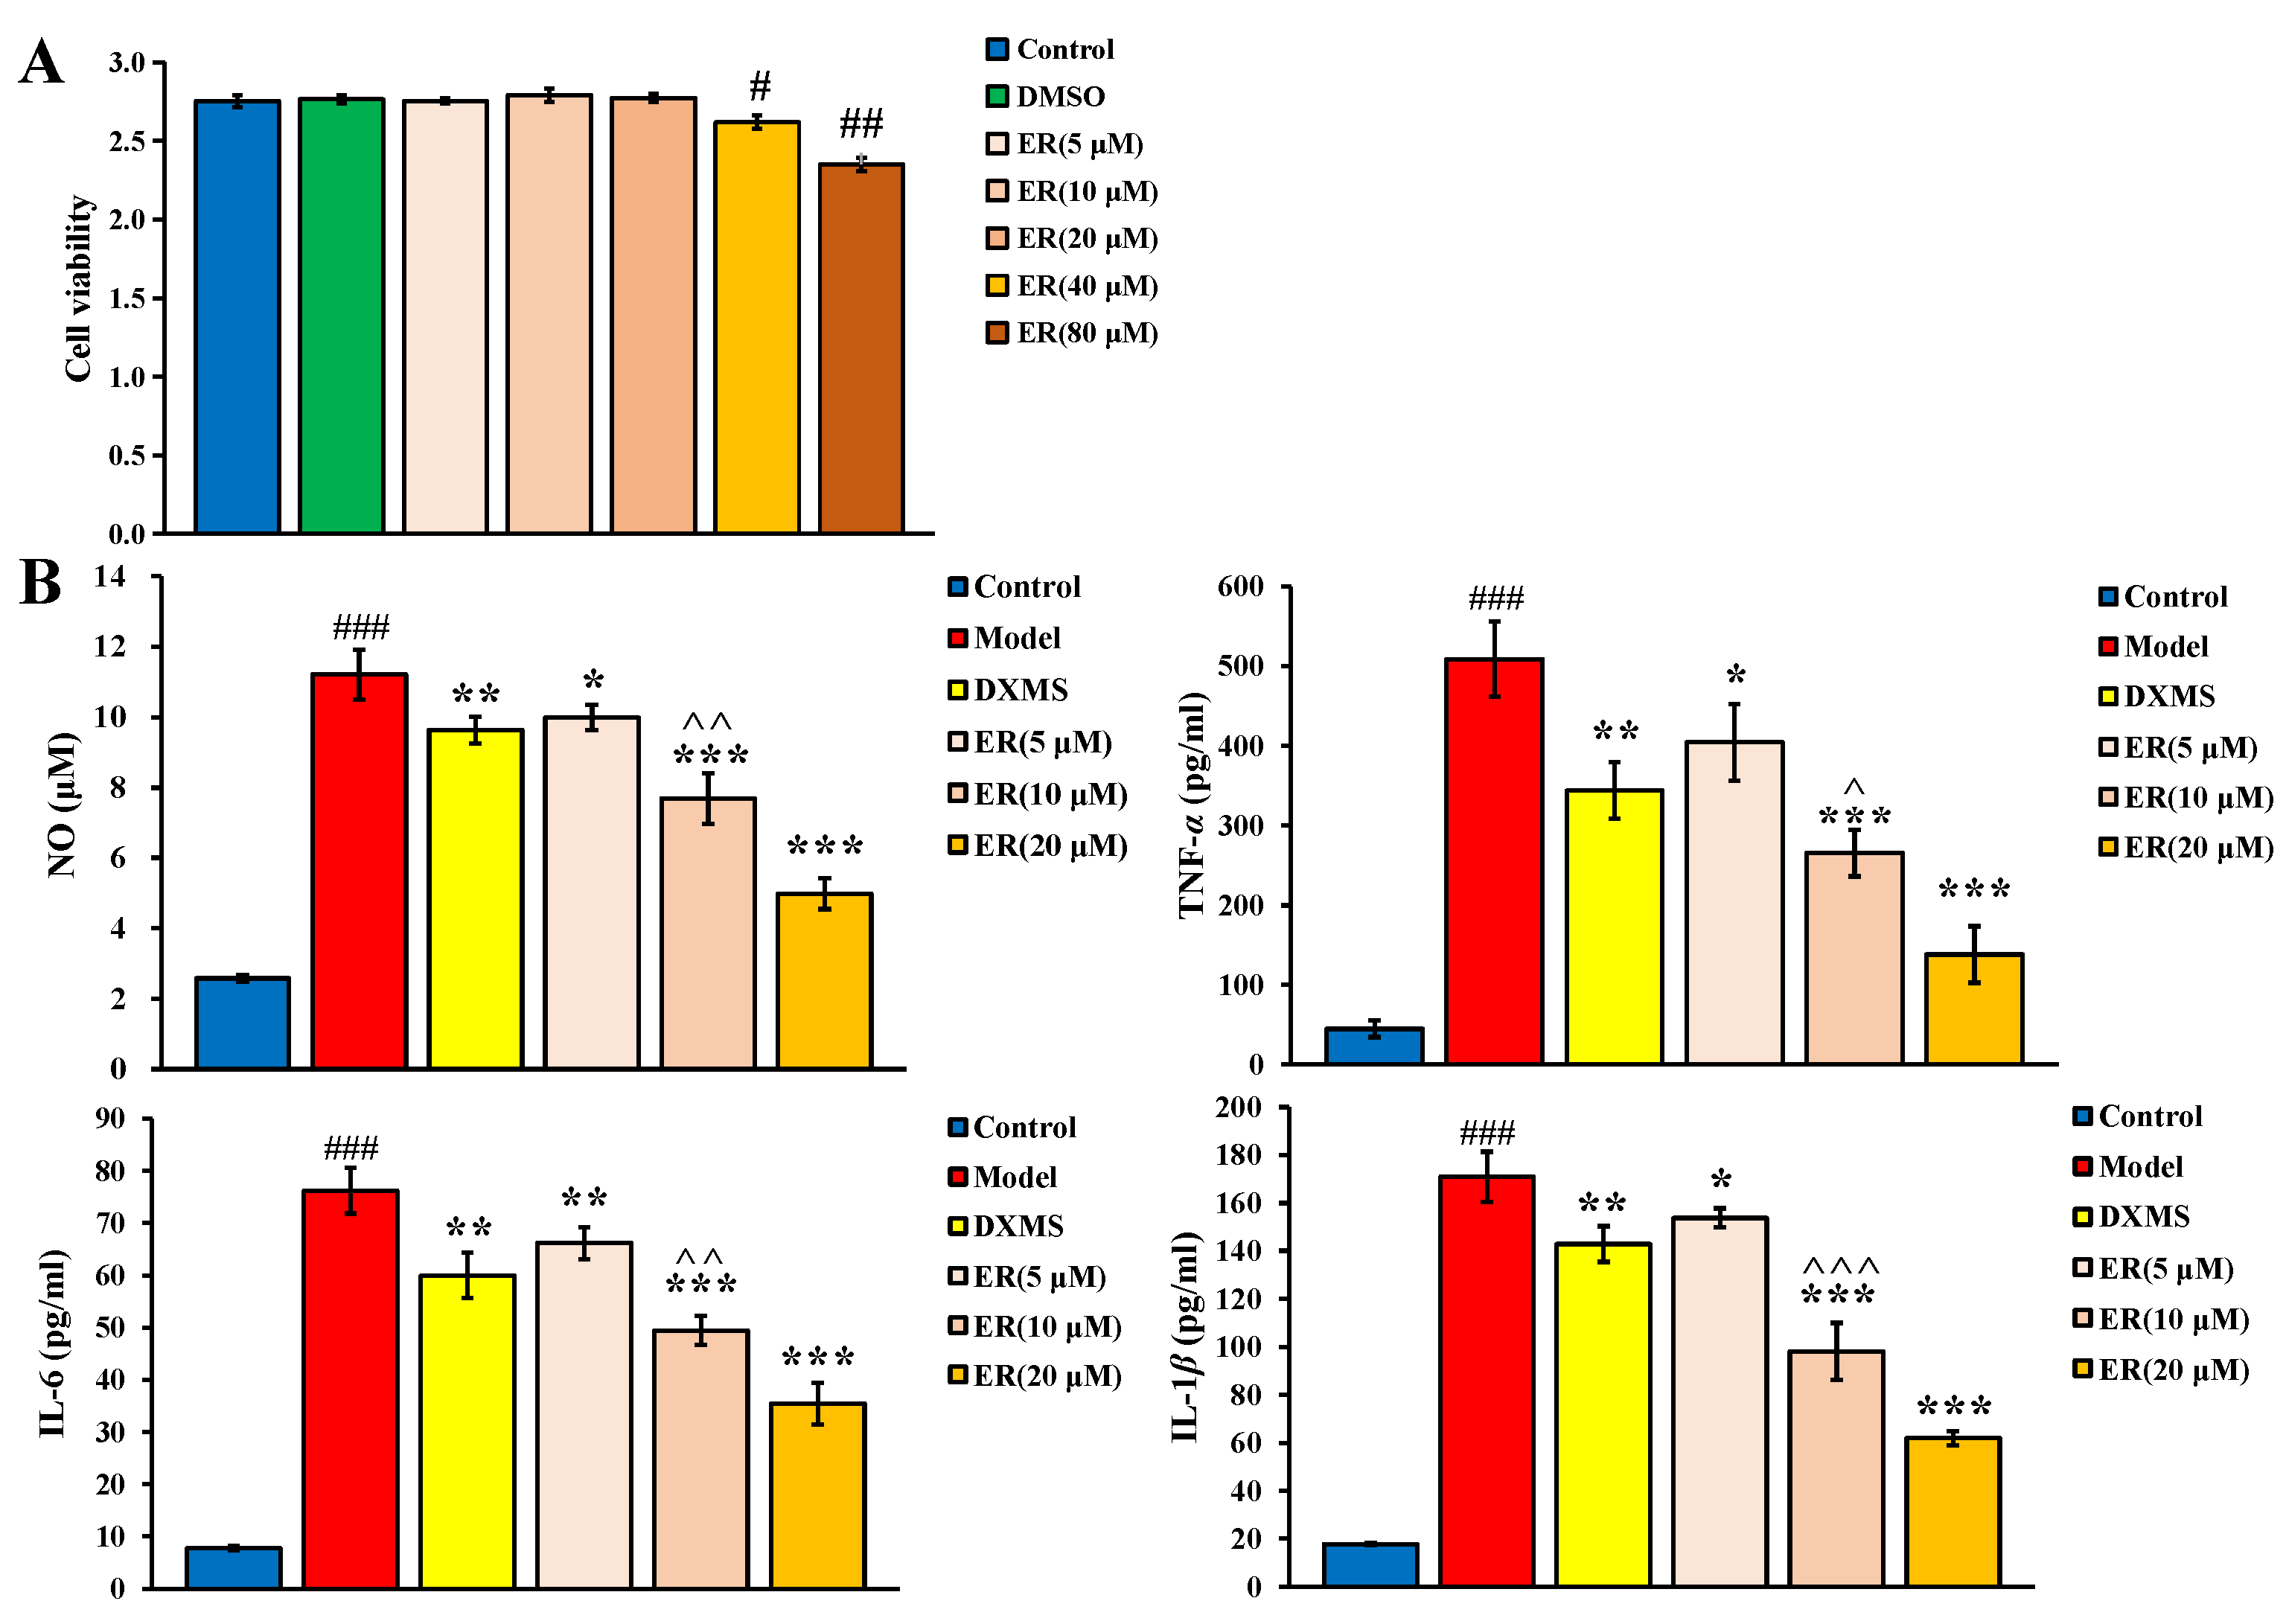
2.1. Effect on LPS-Induced RAW264.7 Cell
2.1.1. Cell Viability
2.1.2. Anti-Inflammatory Activity
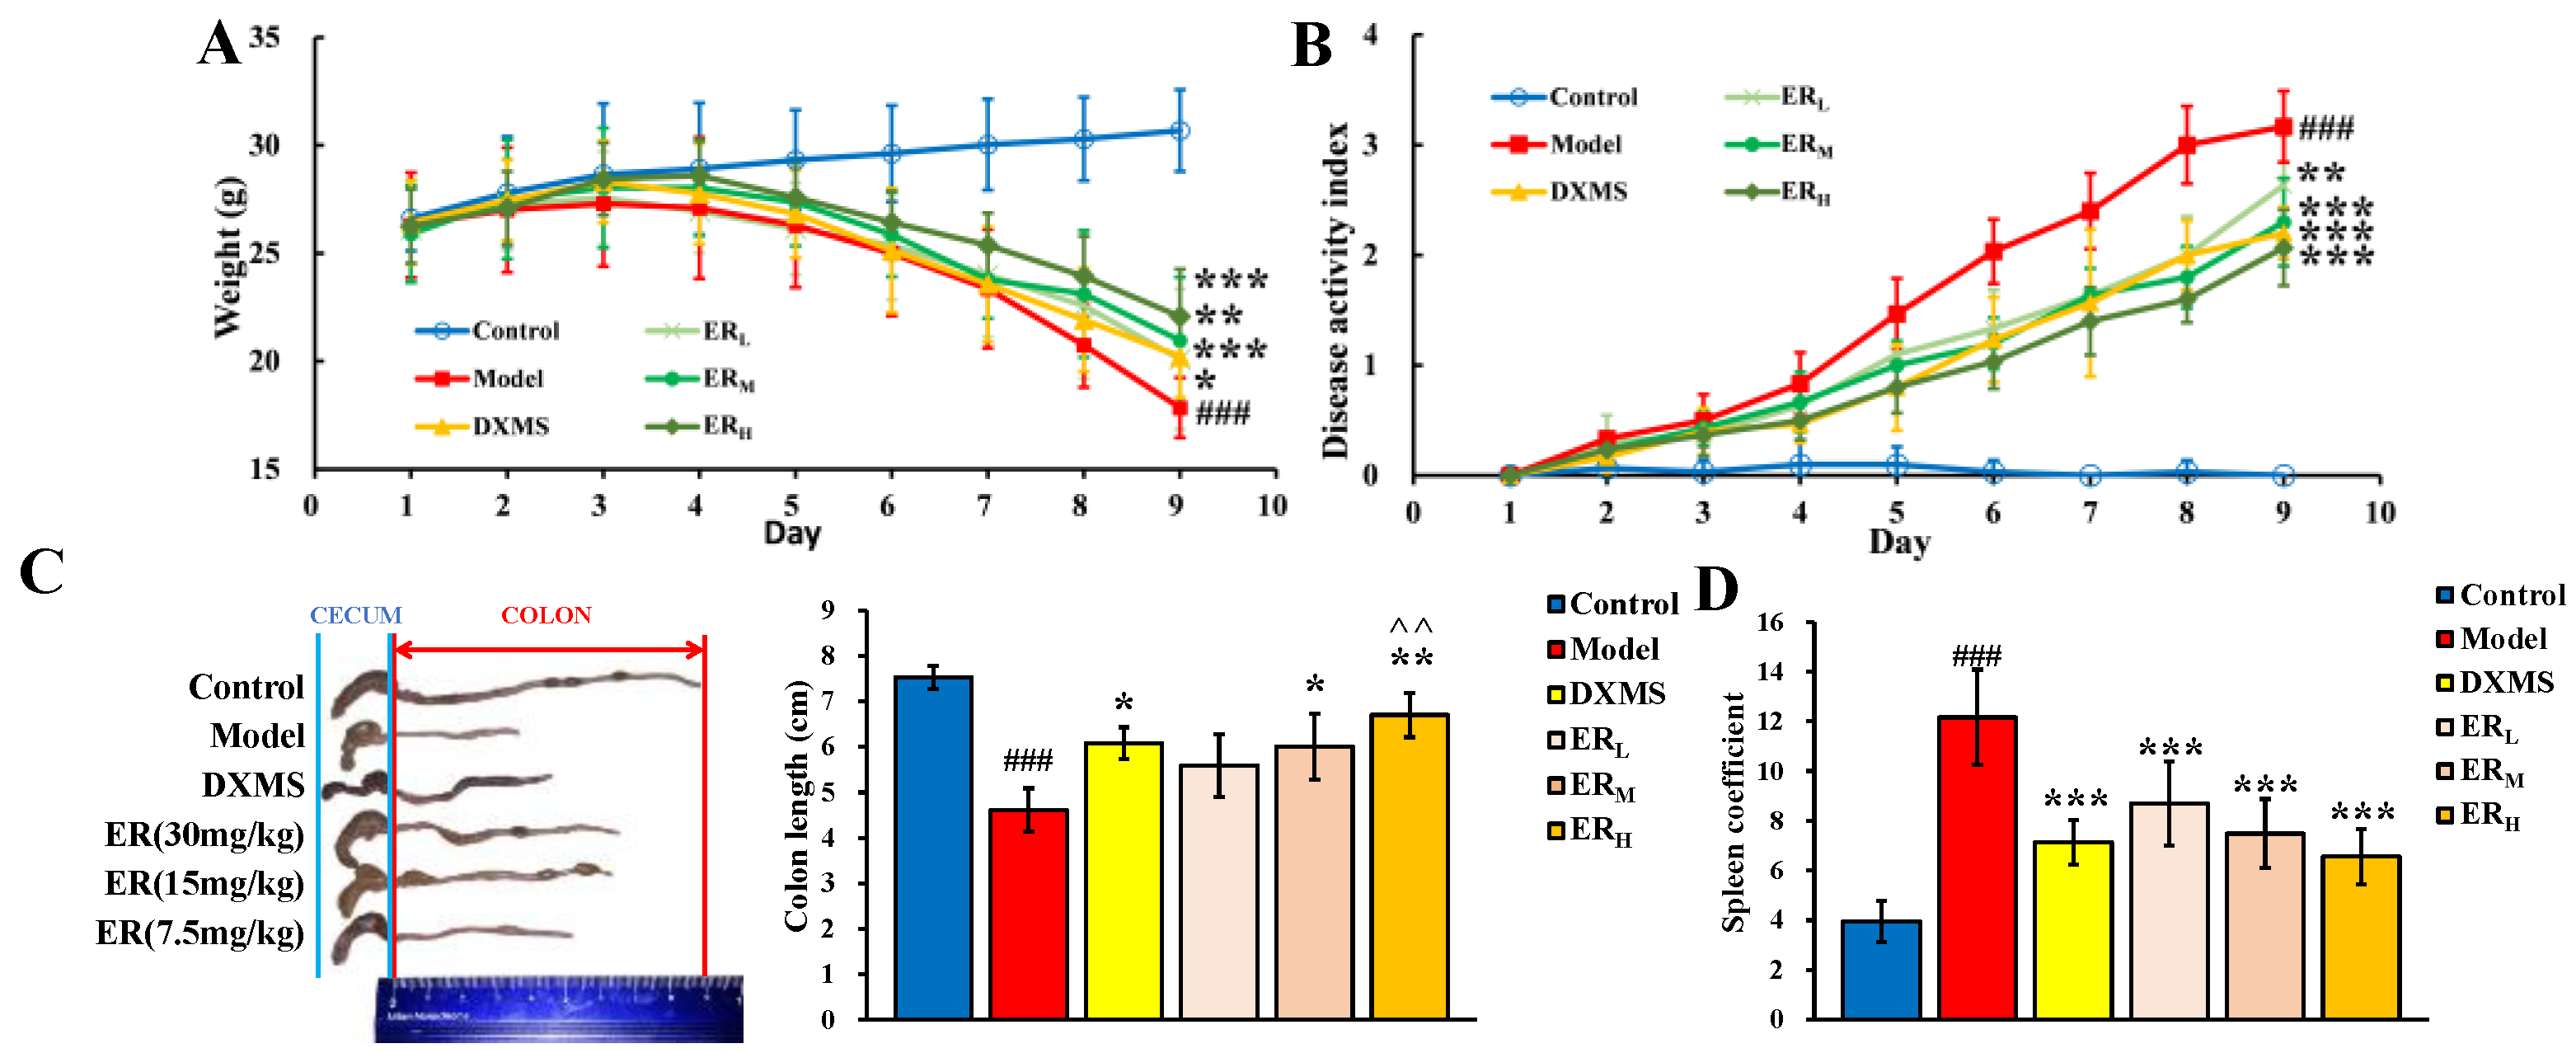
2.2. Effect on DSS-Induced Mice
2.2.1. DAI
2.2.2. Colon Length and Spleen Coefficient
2.2.3. Quantification of Cytokines and MPO Contents
2.2.4. Histopathology
2.2.5. Molecular Docking
2.3. Metabolomics Study
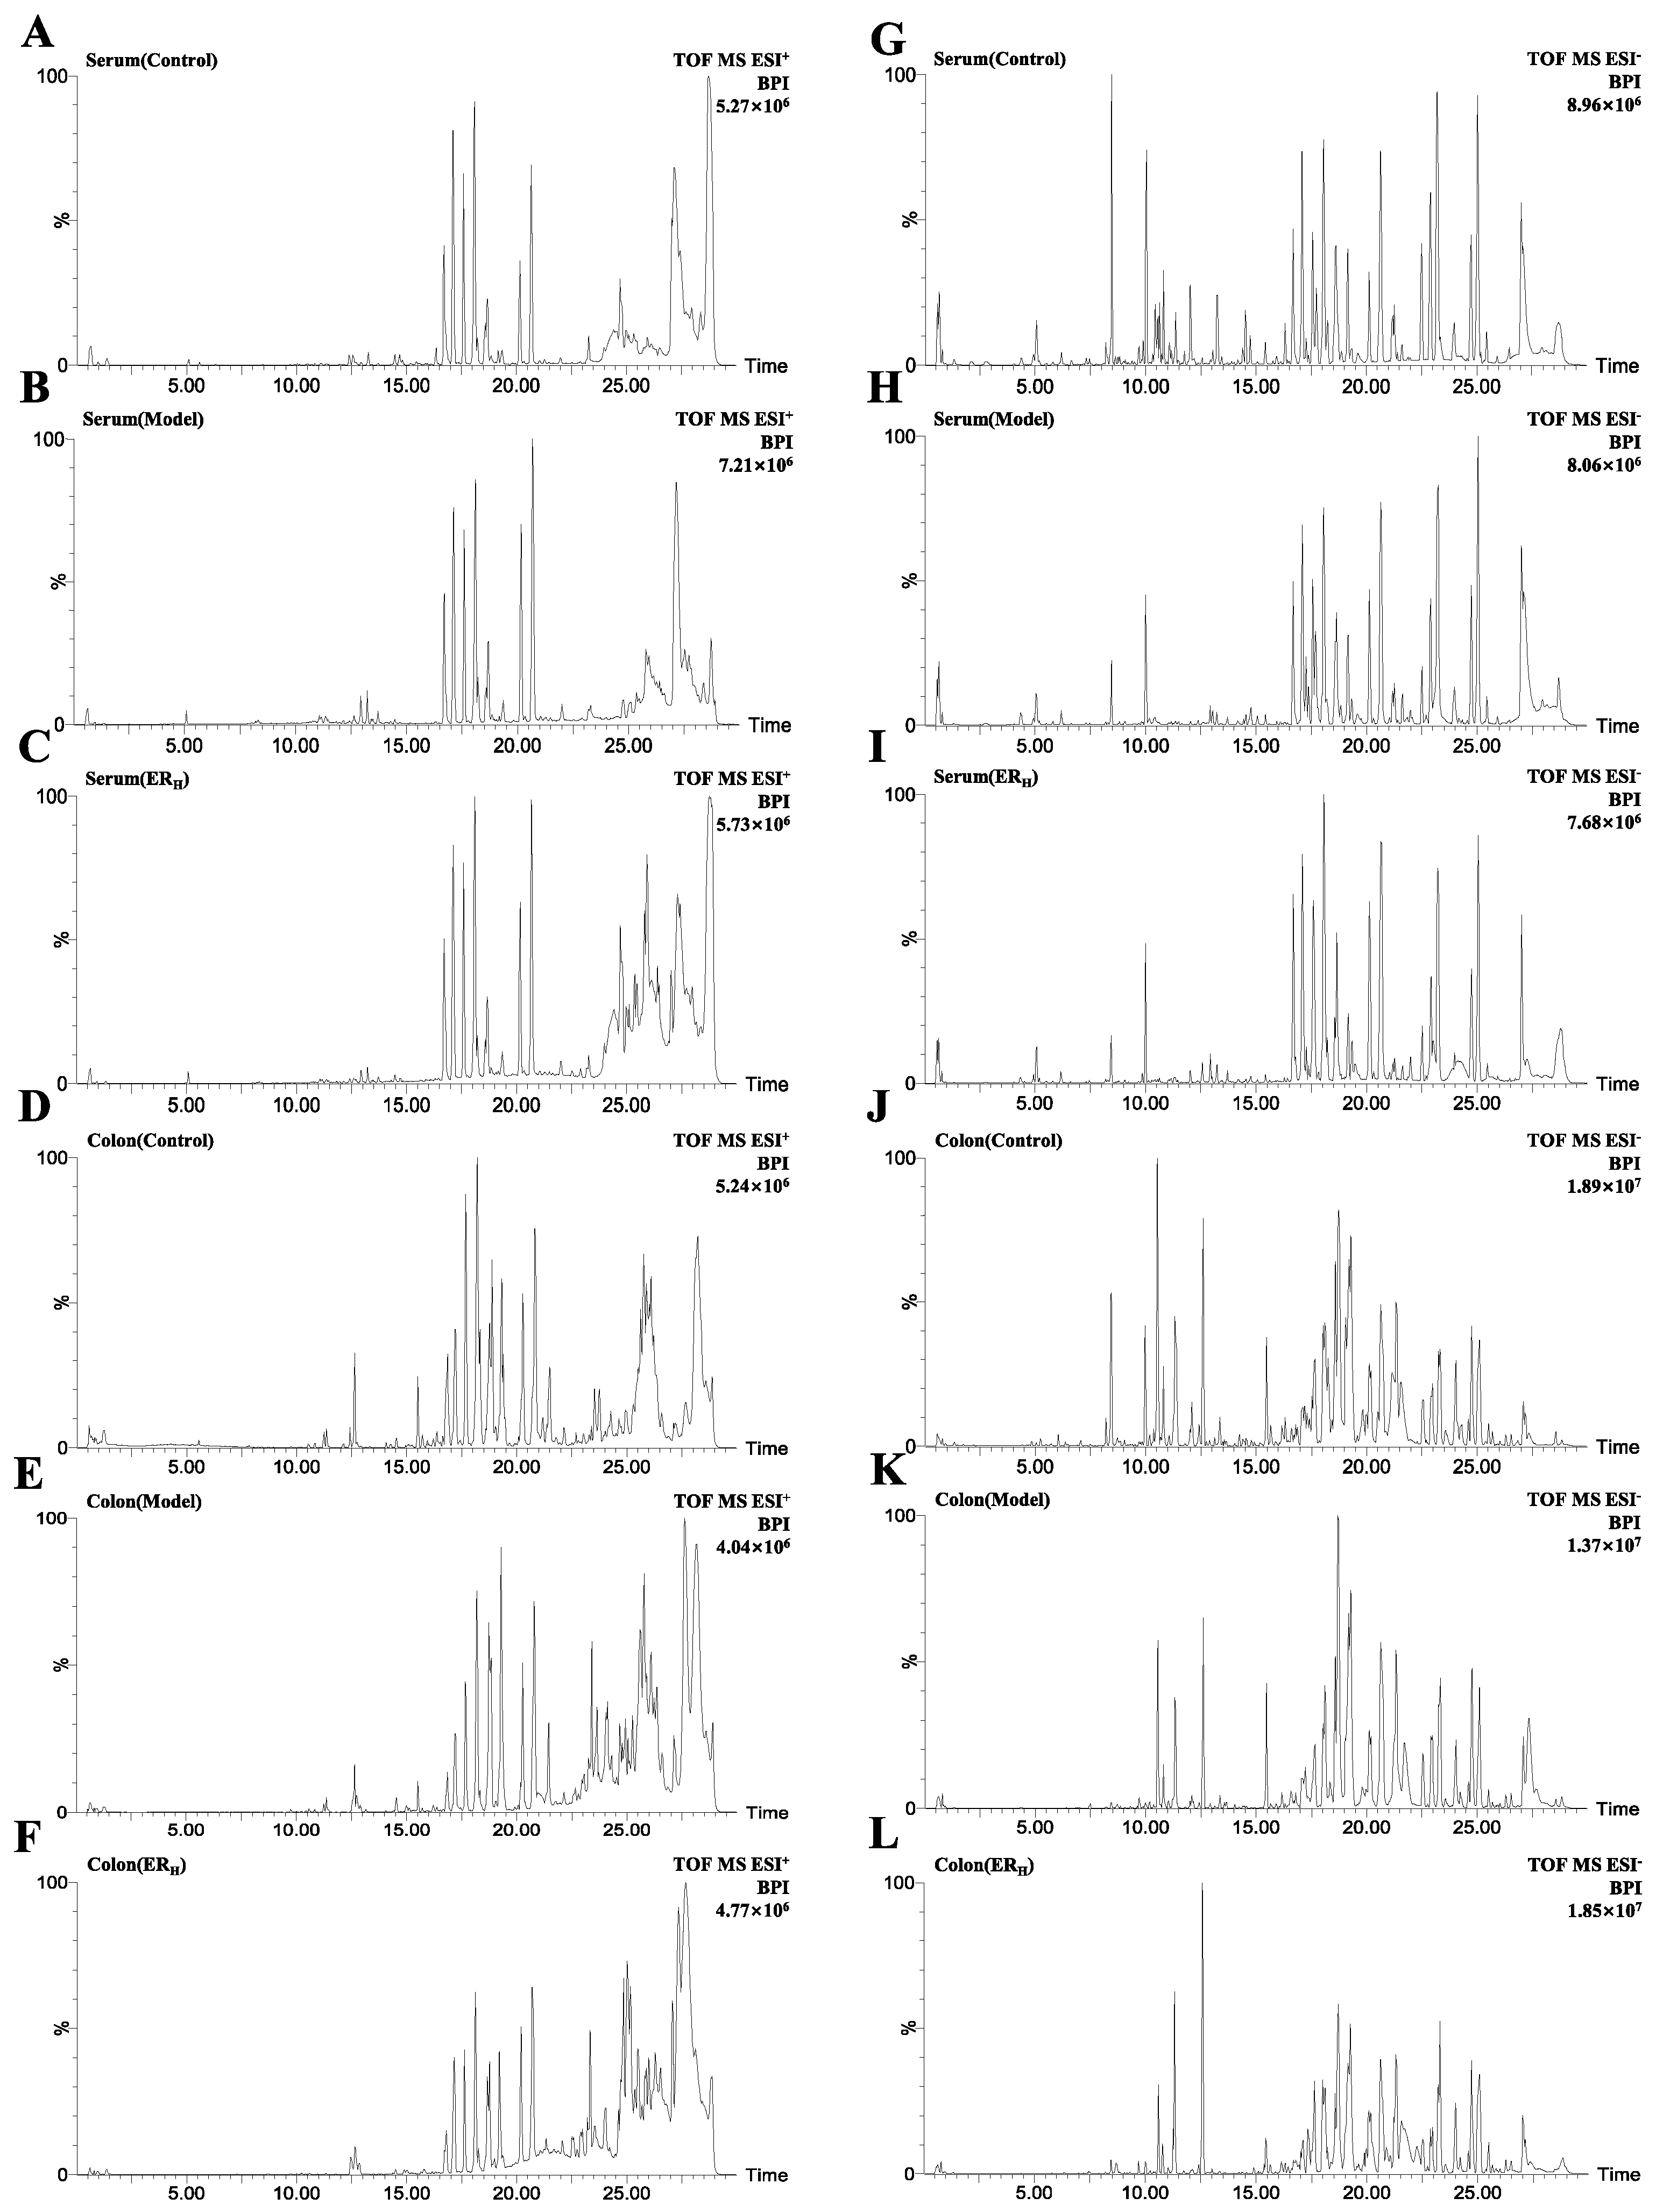
2.3.1. Validation of UPLC-QTOF-MS
2.3.2. Multivariate Statistical Analyses of Serum and Colon Metabolomics
2.3.3. Biomarkers Screening and Pathway Enrichment
3. Discussion
4. Materials and Methods
4.1. Chemicals and Reagents
4.2. Effect on LPS-Induced RAW264.7 Cell
4.2.1. Cell Culture
4.2.2. Cell Viability
4.2.3. Anti-Inflammatory Activity
- DMSO control group,
- Model group;
- ER 5 μM group;
- ER 10 μM group;
- ER 20 μM group;
- DXMS 10 μM group.
4.3. Effects of ER on DSS-Induced UC in Mice
4.3.1. Experimental Design
- Control group (Control);
- UC-model group (Model);
- DXMS group (1.0 mg/kg/d);
- ERL group (7.5 mg/kg/d);
- ERM group (15 mg/kg/d);
- ERH group (30 mg/kg/d).
4.3.2. Disease Activity Index
4.3.3. Sample Collection and Preparation
4.3.4. Quantification of Cytokines and MPO Contents
4.3.5. Histopathology
4.3.6. Statistical Analysis
4.3.7. Molecular Docking
4.4. Metabolomics Study
4.4.1. Preparation of Serum and Colon Metabolisms Samples
4.4.2. UPLC-QTOF-MS Conditions
4.4.3. Validation of UPLC-QTOF-MS
- System Stability: A serum QC sample was run randomly to monitor the stability of the system. The exact m/z-RT (min) pairs of 16 ions (from different spectral regions) were monitored.
- Precision: The precision was estimated by detecting five consecutive replicates of the serum QC sample in succession.
- Reproducibility: The reproducibility of sample preparation was assessed by analyzing five parallel replicates of one serum sample.
- Sample Stability: The stability of the post-preparation of the sample was evaluated by detecting one serum sample settled in autosampler for 0, 4, 8, 10 and 12 h at 4 °C.
4.4.4. Analysis Method
5. Conclusions
Author Contributions
Funding
Institutional Review Board Statement
Informed Consent Statement
Data Availability Statement
Conflicts of Interest
Abbreviations
| ANOVA | Analysis of variance |
| AUC | Area under curve |
| BPI | Base peak intensity |
| CCK-8 | Cell Counting Kit-8 |
| DAI | Disease activity index |
| DHEA | Dehydroepiandrosterone |
| DHET | Dihydroxyeicosatrienoate |
| DMSO | Dimethyl sulfoxide |
| DSS | Dextran sulfate sodium |
| DXMS | Dexamethasone |
| EETA | Epox-yeicosatrienoic acid |
| ELISA | Enzyme-linked immunosorbent assay |
| EOA | Epoxyoctadecenoic acid |
| ER | Ethyl rosmarinate |
| ERH | High dosage of ER |
| ERL | Low dosage of ER |
| ERM | Middle dosage of ER |
| ESI | Electrospray ionization |
| FA | Formic acid |
| FBS | Fetal bovine serum; |
| FC | Fold change |
| H&E | Hematoxylin and eosin stain |
| HETE | Hydroxyeicosatetraenoic acid |
| IL-1β | Interleukin-1β |
| IL-6 | Interleukin-6 |
| LPS | Lipopolysaccharide |
| MPO | Myeloperoxidase |
| NO | Nitric oxide |
| OPLS-DA | Orthogonal projections to latent structures discriminant analysis |
| PBS | Phosphate buffer saline |
| PC | Phosphatidyl-choline |
| PCA | Principle component analysis |
| PDB | Protein Data Bank |
| PE | Phosphatidylethanolamine |
| PI | Peak intensities |
| PUFA | Polyunsaturated fatty acids |
| QC | Quality control |
| QTOF-MS | Quadrupole time-of-flight mass spectrometry |
| ROC | Receiver operating characteristic |
| RPMI-1640 | Roswell Park Memorial Institute 1640 medium |
| RSD | Relative Standard Deviation |
| RT | Retention Time |
| SD | Standard deviation |
| THETA | Trihydroxyeicosatrienoic acid |
| TNBS | 2,4,6-Trinitro-Benzenesulfonic acid |
| TNF-α | Tumor necrosis factor-α |
| UC | Ulcerative colitis |
| UPLC | Ultra-high-performance liquid chromatography |
| VIP | Variable importance in the projection |
References
- Ungaro, R.; Mehandru, S.; Allen, P.B.; Peyrin-Biroulet, L.; Colombel, J.F. Ulcerative colitis. Lancet 2017, 389, 1756–1770. [Google Scholar] [CrossRef]
- Bopanna, S.; Ananthakrishnan, A.N.; Kedia, S.; Yajnik, V.; Ahuja, V. Risk of colorectal cancer in Asian patients with ulcerative colitis: A systematic review and meta-analysis. Lancet Gastroenterol. Hepatol. 2017, 2, 269–276. [Google Scholar] [CrossRef] [Green Version]
- Wei, S.C.; Sollano, J.; Hui, Y.T.; Yu, W.; Santos Estrella, P.V.; Llamado, L.J.Q.; Koram, N. Epidemiology, burden of disease, and unmet needs in the treatment of ulcerative colitis in Asia. Expert Rev. Gastroenterol. Hepatol. 2021, 15, 275–289. [Google Scholar] [CrossRef] [PubMed]
- Akiho, H.; Yokoyama, A.; Abe, S.; Nakazono, Y.; Murakami, M.; Otsuka, Y.; Fukawa, K.; Esaki, M.; Niina, Y.; Oqino, H. Promising biological therapies for ulcerative colitis: A review of the literature. World J. Gastrointest. Pathophysiol. 2015, 6, 219–227. [Google Scholar] [CrossRef] [Green Version]
- Zhang, Z.; Li, Y.; Shen, P.; Li, S.; Lu, X.; Liu, J.; Cao, Y.; Liu, B.; Fu, Y.; Zhang, N. Administration of geniposide ameliorates dextran sulfate sodium-induced colitis in mice via inhibition of inflammation and mucosal damage. Int. Immunopharm. 2017, 49, 168–177. [Google Scholar] [CrossRef]
- Huang, S.; Fu, Y.; Xu, B.; Liu, C.; Wang, Q.; Luo, S.; Nong, F.; Wang, X.; Huang, S.; Chen, J.; et al. Wogonoside alleviates colitis by improving intestinal epithelial barrier function via the MLCK/pMLC2 pathway. Phytomedicine 2020, 68, 153179. [Google Scholar] [CrossRef]
- Wang, C.Z.; Yuan, Y.Z.; Pan, H.; Hsu, A.C.Y.; Chen, J.L.; Liu, J.P.; Li, P.Y.; Wang, F. Protective Effect of Ocotillol, the Derivate of Ocotillol-Type Saponins in Panax Genus, against Acetic Acid-Induced Gastric Ulcer in Rats Based on Untargeted Metabolomics. Int. J. Mol. Sci. 2020, 21, 2577. [Google Scholar] [CrossRef] [Green Version]
- Moharram, F.A.; Marzouk, M.S.; El-Shenawy, S.M.; Gaara, A.H.; El Kady, W.M. Polyphenolic profile and biological activity of Salvia splendens leaves. J. Pharm. Pharmacol. 2012, 64, 1678–1687. [Google Scholar] [CrossRef]
- Kim, G.D.; Park, Y.S.; Jin, Y.H.; Park, C.S. Production and applications of rosmarinic acid and structurally related compounds. Appl. Microbiol. Biotechnol. 2015, 99, 2083–2092. [Google Scholar] [CrossRef]
- Sevindik, H.G.; Ozgen, U.; Atila, A.; Er, H.O.; Kazaz, C.; Duman, H. Phtytochemical Studies and Quantitative HPLC Analysis of Rosmarinic Acid and Luteolin 5-O-β-D-Glucopyranoside on Thymus praecox subsp. grossheimii var. grossheimii. Chem. Pharm. Bull. 2015, 63, 720–725. [Google Scholar] [CrossRef] [Green Version]
- Jin, B.R.; Chung, K.S.; Cheon, S.Y.; Lee, M.; Hwang, S.; Hwang, S.N.; Rhee, K.J.; An, H.J. Rosmarinic acid suppresses colonic inflammation in dextran sulphate sodium (DSS)-induced mice via dual inhibition of NF-κB and STAT3 activation. Sci. Rep. 2017, 7, 46252. [Google Scholar] [CrossRef]
- Venkatachalam, K.; Gunasekaran, S.; Namasivayam, N. Biochemical and molecular mechanisms underlying the chemopreventive efficacy of rosmarinic acid in a rat colon cancer. Eur. J. Pharmacol. 2016, 791, 37–50. [Google Scholar] [CrossRef] [PubMed]
- Falé, P.L.; Ascensão, L.; Serralheiro, M.L. Effect of luteolin and apigenin on rosmarinic acid bioavailability in Caco-2 cell monolayers. Food Func. 2013, 4, 426–431. [Google Scholar] [CrossRef] [PubMed]
- Thammason, H.; Khetkam, P.; Pabuprapap, W.; Suksamrarn, A.; Kunthalert, D. Ethyl rosmarinate inhibits lipopolysaccharide-induced nitric oxide and prostaglandin E2 production in alveolar macrophages. Eur. J. Pharmacol. 2018, 824, 17–23. [Google Scholar] [CrossRef] [PubMed]
- Shen, Y.H.; Wang, L.Y.; Zhang, B.B.; Hu, Q.M.; Wang, P.; He, B.Q.; Bao, G.H.; Liang, J.Y.; Wu, F.H. Ethyl Rosmarinate Protects High Glucose-Induced Injury in Human Endothelial Cells. Molecules 2018, 23, 3372. [Google Scholar] [CrossRef] [PubMed] [Green Version]
- Pantan, R.; Tocharus, J.; Nakaew, A.; Suksamrarn, A.; Tocharus, C. Ethyl Rosmarinate Prevents the Impairment of Vascular Function and Morphological Changes in L-NAME-Induced Hypertensive Rats. Medicina 2019, 55, 777. [Google Scholar] [CrossRef] [Green Version]
- Cao, G.Y.; Wang, X.H.; Li, K.K.; Shen, L.; Yu, D.N. Neuroprotective effect of ethyl rosmarinate against MPTP induced mouse model of Parkinson’s disease. Lishizhen Med. Mater. Med. Res. 2017, 28, 2346–2348. [Google Scholar]
- Wang, Z.; He, H.J.; Li, X.M.; Miao, M.S. Analysis of animal models of ulcerative colitis based on characteristics of clinical symptoms of traditional Chinese and Wes-tern medicine. China J. Chin. Mater. Med. 2021, 46, 757–761. [Google Scholar] [CrossRef]
- Bibi, S.; De Sousa Moraes, L.F.; Lebow, N.; Zhu, M.J. Dietary Green Pea Protects against DSS-Induced Colitis in Mice Challenged with High-Fat Diet. Nutrient. 2017, 9, 509. [Google Scholar] [CrossRef] [Green Version]
- Randhawa, P.K.; Singh, K.; Singh, N.; Jaggi, A.S. A Review on Chemical-Induced Inflammatory Bowel Disease Models in Rodents. Korean J. Physiol. Pharmacol. 2014, 18, 279–288. [Google Scholar] [CrossRef] [Green Version]
- Choudhary, S.; Keshavarzian, A.; Yong, S.; Wade, M.; Bocckino, S.; Day, B.J.; Banan, A. Novel antioxidants Zolimid and AEOL11201 ameliorate colitis in rats. Dig. Dis. Sci. 2001, 46, 2222–2230. [Google Scholar] [CrossRef] [PubMed]
- Jiang, S.Q.; Shen, X.T.; Xuan, S.X.; Yang, B.; Ruan, Q.F.; Cui, H.; Zhao, Z.X.; Jin, J. Serum and colon metabolomics study reveals the anti-ulcerative colitis effect of Croton crassifolius Geisel. Phytomedicine 2021, 87, 153570. [Google Scholar] [CrossRef] [PubMed]
- Hong, Z.H.; Cai, Q.; Duan, X.Y.; Yang, Y.F.; Wu, H.Z.; Jiang, N.; Fan, H. Effect of compound Sophorae decoction in the treatment of ulcerative colitis by tissue extract metabolomics approach. J. Tradit. Chin. Med. 2021, 41, 414–423. [Google Scholar] [CrossRef]
- Santoru, M.L.; Piras, C.; Murgia, F.; Leoni, V.P.; Spada, M.; Murgia, A.; Liggi, S.; Lai, M.A.; Usai, P.; Caboni, P.; et al. Metabolic Alteration in Plasma and Biopsies from Patients with IBD. Inflamm. Bowel. Dis. 2021, 27, 1335–1345. [Google Scholar] [CrossRef] [PubMed]
- Jagt, J.Z.; Struys, E.A.; Ayada, I.; Bakkali, A.; Jansen, E.E.; Claesen, J.; Limbergen, J.E.; Benninga, M.A.; Boer, N.K.; Meij, T.G. Fecal Amino Acid Analysis in Newly Diagnosed Pediatric Inflammatory Bowel Disease: A Multicenter Case-Control Study. Inflamm. Bowl. Dis. 2021, izab256. [Google Scholar] [CrossRef]
- Wang, W.W.; Xu, C.C.; Li, X.Y.; Wang, Z.B.; Yang, J.C.; Shen, Y.; Shi, M.G.; Chen, L.X.; Zhang, L.L.; Guo, Y.L.; et al. Exploration of the potential mechanism of Banxia Xiexin Decoction for the effects on TNBS-induced ulcerative colitis rats with the assistance of network pharmacology analysis. J. Ethnopharmacol. 2021, 277, 114197. [Google Scholar] [CrossRef]
- Fei, L.; Xu, K. Zhikang Capsule ameliorates dextran sodium sulfate-induced colitis by inhibition of inflammation, apoptosis, oxidative stress and MyD88-dependent TLR4 signaling pathway. J. Ethnopharmacol. 2016, 192, 236–247. [Google Scholar] [CrossRef]
- Shao, J.; Liu, Z.L.; Song, Z.; Chang, H.; Han, N.; Yin, J. Screening of the optimized prescription from Suqingwan in terms of its therapeutic effect on DSS-induced ulcerative colitis by its regulation of inflammatory and oxidative mediators. J. Ethnopharmacol. 2017, 202, 54–62. [Google Scholar] [CrossRef]
- Wang, Y.F.; Liu, J.J.; Huang, Z.W.; Li, Y.C.; Liang, Y.Y.; Luo, C.D.; Ni, C.; Xie, J.H.; Su, Z.R.; Chen, J.N.; et al. Coptisine ameliorates DSS-induced ulcerative colitis via improving intestinal barrier dysfunction and suppressing inflammatory response. Eur. J. Pharmacol. 2021, 896, 173912. [Google Scholar] [CrossRef]
- Li, J.N.; Lu, Y.; Wang, D.W.; Quan, F.; Chen, X.; Sun, R.; Zhao, S.; Yang, Z.S.; Tao, W.Y.; Ding, D.; et al. Schisandrin B prevents ulcerative colitis and colitis-associated-cancer by activating focal adhesion kinase and influence on gut microbiota in an in vivo and in vitro model. Eur. J. Pharmacol. 2019, 854, 9–21. [Google Scholar] [CrossRef]
- Boldyreva, L.V.; Morozova, M.V.; Saydakova, S.S.; Kozhevnikova, E.N. Fat of the Gut: Epithelial Phospholipids in Inflammatory Bowel Diseases. Int. J. Mol. Sci. 2021, 22, 11682. [Google Scholar] [CrossRef] [PubMed]
- Horta, D.; Moreno-Torres, M.; Ramírez-Lázaro, M.J.; Lario, S.; Kuligowski, J.; Sanjuan-Herráez, J.D.; Quintas, G.; Villoria, A.; Calvet, X. Analysis of the association between fatigue and the plasma lipidomic profile of inflammatory bowel disease patients. J. Proteome Res. 2021, 20, 381–392. [Google Scholar] [CrossRef] [PubMed]
- Khalili, H.; Higuchi, L.M.; Ananthakrishnan, A.N.; Richter, J.M.; Feskanich, D.; Fuchs, C.S.; Chan, A.T. Oral contraceptives, reproductive factors and risk of inflammatory bowel disease. Gut. 2013, 62, 1153–1159. [Google Scholar] [CrossRef] [PubMed] [Green Version]
- Barbalho, S.M.; Goulart, R.; De, A.; Batista, G.L.; Dos, S.A. Vitamin A and inflammatory bowel diseases: From cellular studies and animal models to human disease. Expert Rev. Gastroenterol. Hepatol. 2019, 13, 25–35. [Google Scholar] [CrossRef] [PubMed]
- Wang, L.; Tao, J.H.; Chen, Y.F.; Shen, Y.M.; Jiang, S. Lizhong Decoction Ameliorates Ulcerative Colitis in Mice via Regulation of Plasma and Urine Metabolic Profiling. Chin. J. Integr. Med. 2021. [Google Scholar] [CrossRef]
- Marton, L.T.; Goulart, R.A.; Carvalho, A.C.A.; Barbalho, S.M. Omega Fatty Acids and Inflammatory Bowel Diseases: An Overview. Int. J. Mol. Sci. 2019, 20, 4851. [Google Scholar] [CrossRef] [Green Version]
- Simovic Markovic, B.; Nikolic, A.; Gazdic, M.; Nurkovic, J.; Djordjevic, I.; Arsenijevic, N.; Stojkovic, M.; Lukic, M.L.; Volarevic, V. Pharmacological inhibition of Gal-3 in mesenchymal stem cells enhances their capacity to promote alternative activation of macrophages in dextran sulphate sodium-induced colitis. Stem Cells Inflamm. Fibros. 2016, 2016, 2640746. [Google Scholar] [CrossRef] [Green Version]
- Majumder, K.; Fukuda, T.; Zhang, H.; Sakurai, T.; Taniguchi, Y.; Watanabe, H.; Mitsuzumi, H.; Matsui, T.; Mine, Y. Intervention of isomaltodextrin mitigates intestinal inflammation in a dextran sodium sulfate-induced mouse model of colitis via inhibition of toll-like receptor-4. J. Agric. Food Chem. 2017, 65, 810–817. [Google Scholar] [CrossRef]
- Jiao, Y.F.; Si, Y.; Li, L.; Wang, C.Z.; Lin, H.Q.; Liu, J.L.; Liu, Y.H.; Liu, J.P.; Li, P.Y.; Li, Z. Comprehensive phytochemical profiling of American ginseng in Jilin province of China based on ultrahigh-performance liquid chromatography quadrupole time-of-flight mass spectrometry. J. Mass Spectrom. 2021, 56, e4787. [Google Scholar] [CrossRef]


| Tests | ESI+ Mode | ESI− Mode | ||
|---|---|---|---|---|
| PI | RT | PI | RT | |
| system stability | 1.35~3.72 | 0.84~2.36 | 1.56~3.22 | 0.24~2.92 |
| precision | 0.94~3.28 | 0.10~0.43 | 0.61~3.42 | 0.06~0.34 |
| reproducibility | 1.01~3.69 | 0.12~1.76 | 0.38~3.74 | 0.09~0.72 |
| sample stablilty | 1.33~3.27 | 0.08~0.54 | 1.92~3.41 | 0.11~0.69 |
| HMDB | Model vs. Control | ERH vs. Model | ||
|---|---|---|---|---|
| AUC | p | AUC | p | |
| HMDB0000077 | 1.000 | <0.001 | 0.969 | <0.001 |
| HMDB0000234 | 1.000 | <0.001 | 1.000 | <0.001 |
| HMDB0000352 | 1.000 | <0.001 | 1.000 | <0.001 |
| HMDB0000564 | 0.984 | <0.001 | 1.000 | <0.001 |
| HMDB0000673 | 0.828 | <0.001 | 0.828 | <0.001 |
| HMDB0001043 | 0.922 | <0.01 | 0.844 | <0.01 |
| HMDB0001139 | 0.906 | <0.001 | 0.984 | <0.001 |
| HMDB0001220 | 0.984 | <0.001 | 0.938 | <0.001 |
| HMDB0001337 | 1.000 | <0.001 | 1.000 | <0.001 |
| HMDB0001381 | 0.984 | <0.001 | 0.922 | <0.001 |
| HMDB0001388 | 1.000 | <0.001 | 0.969 | <0.001 |
| HMDB0001403 | 1.000 | <0.001 | 1.000 | <0.001 |
| HMDB0001452 | 0.969 | <0.001 | 0.953 | <0.001 |
| HMDB0001509 | 1.000 | <0.001 | 0.984 | <0.001 |
| HMDB0002265 | 0.813 | <0.05 | 0.969 | <0.001 |
| HMDB0003235 | 1.000 | <0.001 | 1.000 | <0.001 |
| HMDB0003598 | 0.922 | <0.001 | 0.891 | <0.001 |
| HMDB0003818 | 1.000 | <0.001 | 1.000 | <0.001 |
| HMDB0003959 | 1.000 | <0.001 | 1.000 | <0.001 |
| HMDB0004611 | 1.000 | <0.001 | 0.906 | <0.001 |
| HMDB0004684 | 1.000 | <0.001 | 0.953 | <0.001 |
| HMDB0004693 | 1.000 | <0.001 | 1.000 | <0.001 |
| HMDB0004701 | 0.922 | <0.01 | 0.969 | <0.01 |
| HMDB0004702 | 0.984 | <0.001 | 0.906 | <0.001 |
| HMDB0005779 | 1.000 | <0.001 | 1.000 | <0.001 |
| HMDB0005998 | 0.906 | <0.001 | 0.953 | <0.001 |
| HMDB0006770 | 1.000 | <0.001 | 0.953 | <0.001 |
| HMDB0060339 | 0.859 | <0.001 | 0.875 | <0.001 |
| No. | RT | Compound Name | Mass | Δm | Adducts | Source | HMDB ID | Pathway | Change Trend | |
|---|---|---|---|---|---|---|---|---|---|---|
| M/C | ERH/M | |||||||||
| 1 a | 8.46 | 19-Oxotestosterone | 347.1851 | 0.15 | M + FA−H | Serum | HMDB0003959 | SHB | ↓ | ↑ |
| 2 a | 9.05 | 16α-Hydroxy-DHEA | 349.2013 | 0.15 | M + FA−H | Serum | HMDB0000352 | SHB | ↓ | ↑ |
| 3 a | 9.81 | Thromboxane A2 | 351.2157 | 0.00 | M−H | Serum | HMDB0001452 | AM | ↓ | ↑ |
| 4 * | 10.33 | Prostaglandin F2a | 353.2313 | 0.00 | M−H | Serum | HMDB0001139 | AM | ↑ | ↓ |
| 5 * | 11.16 | DHEA | 333.2070 | 0.16 | M + FA−H | Serum | HMDB0000077 | SHB | ↓ | ↑ |
| 6 * | 11.45 | Prostaglandin D2 | 351.2170 | 0.00 | M−H | Serum | HMDB0001403 | AM | ↑ | ↓ |
| 7 a | 11.51 | 7α-Hydroxy-DHEA | 349.2003 | 0.15 | M + FA−H | Serum | HMDB0004611 | SHB | ↑ | ↓ |
| 8 a | 11.55 | 11,12,15-THETA | 353.2322 | 0.00 | M−H | Serum | HMDB0004684 | AM | ↑ | ↓ |
| 9 a | 12.01 | 5-Androstenediol | 335.2218 | 0.15 | M + FA−H | Serum | HMDB0003818 | SHB | ↓ | ↑ |
| 10 a | 12.01 | 11H-14,15-EETA | 381.2261 | 0.13 | M + FA−H | Serum | HMDB0004693 | AM | ↓ | ↑ |
| 11 a | 12.65 | 11β-Hydroxytestosterone | 349.2008 | 0.15 | M + FA−H | Serum | HMDB0060339 | SHB | ↑ | ↓ |
| 12 a | 12.78 | Prostaglandin G2 | 367.2112 | 0.00 | M−H | Serum | HMDB0003235 | AM | ↑ | ↓ |
| 13 a | 13.67 | 5β-Dihydrotestosterone | 335.2208 | 0.15 | M + FA−H | Serum | HMDB0006770 | SHB | ↑ | ↓ |
| 14 * | 13.71 | Prostaglandin E2 | 351.2160 | 0.00 | M−H | Serum | HMDB0001220 | AM | ↑ | ↓ |
| 15 a | 14.05 | Testosterone | 333.2054 | 0.16 | M + FA−H | Serum | HMDB0000234 | SHB | ↑ | ↓ |
| 16 a | 14.26 | 14,15-DHET | 337.2365 | 0.00 | M−H | Serum | HMDB0002265 | AM | ↑ | ↓ |
| 17 a | 14.57 | 20-Hydroxy-leukotriene B4 | 351.2166 | 0.00 | M−H | Serum | HMDB0001509 | AM | ↑ | ↓ |
| 18 a | 16.92 | 9,10-EOA | 295.2264 | 0.00 | M−H | Serum | HMDB0004701 | LM | ↑ | ↓ |
| 19 a | 17.25 | 12,13-EOA | 295.2278 | 0.00 | M−H | Colon | HMDB0004702 | LM | ↑ | ↓ |
| 20 * | 18.64 | 20-HETE | 319.2265 | 0.00 | M−H | Serum | HMDB0005998 | AM | ↑ | ↓ |
| 21 a | 18.72 | Retinyl ester | 301.2163 | 0.00 | M−H | Colon | HMDB0003598 | RM | ↓ | ↑ |
| 22 a | 19.12 | PE(16:1/24:1) | 844.6050 | 0.06 | M + FA−H | Colon | HMDB0008981 | GlyM | ↑ | ↓ |
| 23 a | 19.7 | Leukotriene A4 | 317.2118 | 0.00 | M−H | Serum | HMDB0001337 | AM | ↑ | ↓ |
| 24 a | 20.58 | Prostaglandin H2 | 397.2247 | 0.13 | M + FA−H | Serum | HMDB0001381 | AM | ↓ | ↑ |
| 25 * | 21.35 | α-Linolenic acid | 277.2164 | 0.00 | M−H | Serum | HMDB0001388 | ALM | ↑ | ↓ |
| 26 * | 22.35 | Arachidonic acid | 327.2299 | 0.07 | M + Na | Serum | HMDB0001043 | AM | ↑ | ↓ |
| 27 * | 23.97 | Linoleic acid | 279.2322 | 0.00 | M−H | Serum | HMDB0000673 | LM | ↓ | ↑ |
| 28 * | 25.05 | PC(16:0/16:0) | 756.5516 | 0.03 | M + Na | Colon | HMDB0000564 | AM, LM, ALM, GlyM | ↑ | ↓ |
| No. | Pathway Name | Match Status | p | −log(p) | Impact |
|---|---|---|---|---|---|
| 1 | Linoleic acid metabolism | 4/5 | 9.44 × 10⁻⁷ | 6.0252 | 1.00 |
| 2 | Arachidonic acid metabolism | 14/36 | 7.16 × 10⁻¹⁶ | 15.145 | 0.64 |
| 3 | α-Linolenic acid metabolism | 2/13 | 3.12 × 10⁻² | 1.5053 | 0.33 |
| 4 | Glycerophospholipid metabolism | 2/36 | 1.85 × 10⁻¹ | 0.73213 | 0.20 |
| 5 | Retinol metabolism | 1/16 | 3.00 × 10⁻¹ | 0.52327 | 0.16 |
| 6 | Steroid hormone biosynthesis | 8/77 | 1.59 × 10⁻⁴ | 3.7974 | 0.12 |
| Score | Weight Loss (%) | Fecal Characteristics | Blood Stool |
|---|---|---|---|
| 0 | None | Normal | Negative |
| 1 | 1–5 | ||
| 2 | 5–10 | Loose stools | Slight bleeding |
| 3 | 10–15 | ||
| 4 | >15 | Diarrhea | Gross bleeding |
Publisher’s Note: MDPI stays neutral with regard to jurisdictional claims in published maps and institutional affiliations. |
© 2022 by the authors. Licensee MDPI, Basel, Switzerland. This article is an open access article distributed under the terms and conditions of the Creative Commons Attribution (CC BY) license (https://creativecommons.org/licenses/by/4.0/).
Share and Cite
Zhou, B.; Liu, J.; Wang, Y.; Wu, F.; Wang, C.; Wang, C.; Liu, J.; Li, P. Protective Effect of Ethyl Rosmarinate against Ulcerative Colitis in Mice Based on Untargeted Metabolomics. Int. J. Mol. Sci. 2022, 23, 1256. https://doi.org/10.3390/ijms23031256
Zhou B, Liu J, Wang Y, Wu F, Wang C, Wang C, Liu J, Li P. Protective Effect of Ethyl Rosmarinate against Ulcerative Colitis in Mice Based on Untargeted Metabolomics. International Journal of Molecular Sciences. 2022; 23(3):1256. https://doi.org/10.3390/ijms23031256
Chicago/Turabian StyleZhou, Baisong, Juntong Liu, Yaru Wang, Fulin Wu, Caixia Wang, Cuizhu Wang, Jinping Liu, and Pingya Li. 2022. "Protective Effect of Ethyl Rosmarinate against Ulcerative Colitis in Mice Based on Untargeted Metabolomics" International Journal of Molecular Sciences 23, no. 3: 1256. https://doi.org/10.3390/ijms23031256
APA StyleZhou, B., Liu, J., Wang, Y., Wu, F., Wang, C., Wang, C., Liu, J., & Li, P. (2022). Protective Effect of Ethyl Rosmarinate against Ulcerative Colitis in Mice Based on Untargeted Metabolomics. International Journal of Molecular Sciences, 23(3), 1256. https://doi.org/10.3390/ijms23031256