Abstract
Pod color is a major economic trait of snap beans (Phaseolus vulgaris L.), among which the pod with a purple stripe is more attractive to people. A stable purple mutant with purple stripes on the pods was obtained by artificial mutagenesis with the high generation snap bean inbred line ‘A18-1’. In order to reveal the genetic factors and pathways responsible for the purple appearance in snap bean, we performed transcriptome and metabolome analyses using the green stem and yellow pod cultivar ‘A18-1’ and its purple mutant ‘pv-pur’ via 60Co-γ radiation. Transcriptome analysis showed that three genes in the anthocyanin biosynthetic pathway were differentially expressed, among which the expression level of F3′5′H (Phvul.006G018800) was increased in the mutant ‘pv-pur’, while expression of F3′H (Phvul.004G021200) and ANS (Phvul.002G152700) was downregulated. Anthocyanin-targeted metabonomics analysis showed significant differences in the contents of 10 metabolites between the wild type and mutant plants. Combined analysis of transcriptome and metabolomics showed that one differential metabolite, delphinidin, was related to the differential expression of Phvul.006G024700, Phvul.002G152700, and Phvul.006G018800. Based on the levels of six anthocyanins in wild type and mutant plants, we speculative that the purple appearance of the mutant ‘pv-pur’ is caused by the increased expression of F3′5′H (Phvul.006G018800), the key enzyme in the transformation from dihydroflavanol (DHK) to dihydromyricetone (DHM) in the anthocyanin biosynthetic pathway. The results lay a foundation for further studies on the molecular mechanism of anthocyanin synthesis in snap bean, and provide a framework for breeding different colors of snap bean.
1. Introduction
There are rich and colorful colors in the plant world. The existence of these colors is due to the existence of a variety of plant pigments in the plant tissues, including chlorophyll, carotenoids, photosensitive pigments, flavonoids and some algal pigments. Flavonoids are widely distributed in higher plants; they are a group of water-soluble phenolic compounds which mainly exist in the vacuoles and play an important role in signal transmission and the stress resistance of plants [1]. Anthocyanins are one type of flavonoid. The variety and content of anthocyanins are the main factors that cause the color changes of fruits, flowers and vegetative tissues in different plants. Anthocyanins are also the main bioactive substances for plants to resist biotic and abiotic stresses such as low temperature, drought, strong light, and ultraviolet radiation [2,3].
Anthocyanins are derived from flavonoid biosynthetic pathways, which have been well studied in some model plants such as Petunia hybrida, snapdragon, Arabidopsis thaliana, and maize [4]. The first step in the biosynthetic of flavonoids is catalyzed by chalcone synthase (CHS), a member of the polyketide synthase (PKS) family. This is a necessary step in the synthesis of all flavonoids, including colored anthocyanins and some colorless flavonoids, such as flavonol. CHS usually cooperates with chalcone isomerase (CHI), flavanone 3-hydroxylase (F3′H) and flavonol synthase (FLS), which is a key branch of flavonol synthesis [2,5]. Flavonols provide UV protection, can form nectar vessels visible to insects, and can be used as the co-pigment of anthocyanins [6]. The synthesis of colorless anthocyanins catalyzed by dihydroflavonol 4-reductase (DFR) is a key regulatory step. Subsequently, under the action of anthocyanin synthase (ANS), chromophores are produced, and anthocyanins are glycosylated [7].
The mechanism of anthocyanin synthesis and regulation has been widely studied in Arabidopsis, Petunia, grape and other model plants, and two groups of genes are known, namely structural genes and regulatory genes [8,9,10]. Structural genes encode enzymes directly involved in anthocyanin biosynthetic, including phenylalanine ammonia lyase (PAL), 4-coumaric acid CoA ligase (4CL), chalcone sythetase, chalcone isomerase (CHS), flavanone 3-hydroxylase (F3H), flavonoid 3′-hydroxylase (F3′H), flavonoid 3′5′-hydroxylase (F3′5′H), dihydroflavonol 4-reductase (DFR) and anthocyanin synthase (ANS) [9,11]. F3′H and F3′5′H are important enzymes for the synthesis of different colorless basic anthocyanins, and they belong to the cytochrome P450 family. F3′H belongs to the CYP75B sub-family of cytochrome P450-dependent monooxygenase (P450) superfamily, which converts dihydroflavanol into colorless cyanidin anthocyanins. F3′5′H belongs to CYP75A, a sub-family of the P450 superfamily. It can convert DHK and dihydroquercetin (DHQ) into dihydromyricetin, which is the precursor of delphinidin [12]. F3′H is responsible for the synthesis of anthocyanins from cyanidin, while F3′5′H is responsible for the synthesis of anthocyanins from delphinidin. In plants, the ratio of F3′5′H to F3′H regulates the apparent color of plants; the higher the ratio of F3′5′H/F3′H, the more purple coloration the plants display [13]. For example, purple and blue varieties in roses are relatively scarce. This is because the petals of ordinary roses do not contain F3′5′H, and lack anthocyanins based on delphinidin. If F3′5′H and DFR genes are overexpressed in rose, delphinidin will be accumulated in petals, thus showing blue color [14].
Snap bean is a leguminous vegetable crop, with tender pods as the edible organ. It is an important vegetable crop with delicious taste and is rich in nutrition. It is cultivated all over the world. As its edible organ, pod color is a very important economic trait of snap bean. Among them, pods with a purple halo or purple stripes are more attractive. However, it is not clear what genes regulate anthocyanin synthesis to make pods show purple. This may be due to the great difference of genetic background between different snap bean varieties. Therefore, in this study, we applied an artificially created purple mutant of snap bean. Mutants are important for the study of plant functional genomics. Mutation of some important genes may cause dramatic changes in anthocyanin synthesis. Using mutants is an effective research strategy for studying the mechanism of anthocyanin synthesis in snap bean. ‘A18-1’ is an important dwarf snap bean ecotype. Its stems and leaves are green, its pods are yellow, and it is widely planted in northern China and deeply loved by consumers. Herein, we constructed a gamma radiation mutant library of ‘A18-1’ and obtained many mutants, including some with yellow leaf, dwarf stature, and leaf shrinkage phenotypes. Among the mutants was one with purple stems and veins, and pods with purple/red stripes. This means that the two materials used in this study are completely consistent in genetic background except for mutant genes, and the mutant genes are likely to be important regulatory genes in the anthocyanin synthesis network. In order to reveal the physiology and molecular mechanisms underlying the purple mutant, we investigated the genetics of the mutant traits, performed transcriptome and metabolome analyses of mutant and wild type plants, and determined their anthocyanin contents. The results revealed the key genes and metabolites causing the changes in appearance of the mutant. This will lay the foundation for exploring the molecular mechanism by which the mutant gene regulates anthocyanin biosynthetic in snap bean and guides its breeding and improvement.
2. Results
2.1. A Purple Mutant Was Observed in A 60Co-γ-Induced Mutant Bank
A snap bean mutant bank was constructed by exposing dry seeds of dwarf snap bean variety ‘A18-1’ to 60Co-γ radiation at 150 Gy. Compared with wild type plants, the mutant bank showed extensive phenotypic variation in leaf color, leaf shape, plant height, maturity, sterility, and other traits. One of the mutants exhibited a purplish phenotype.
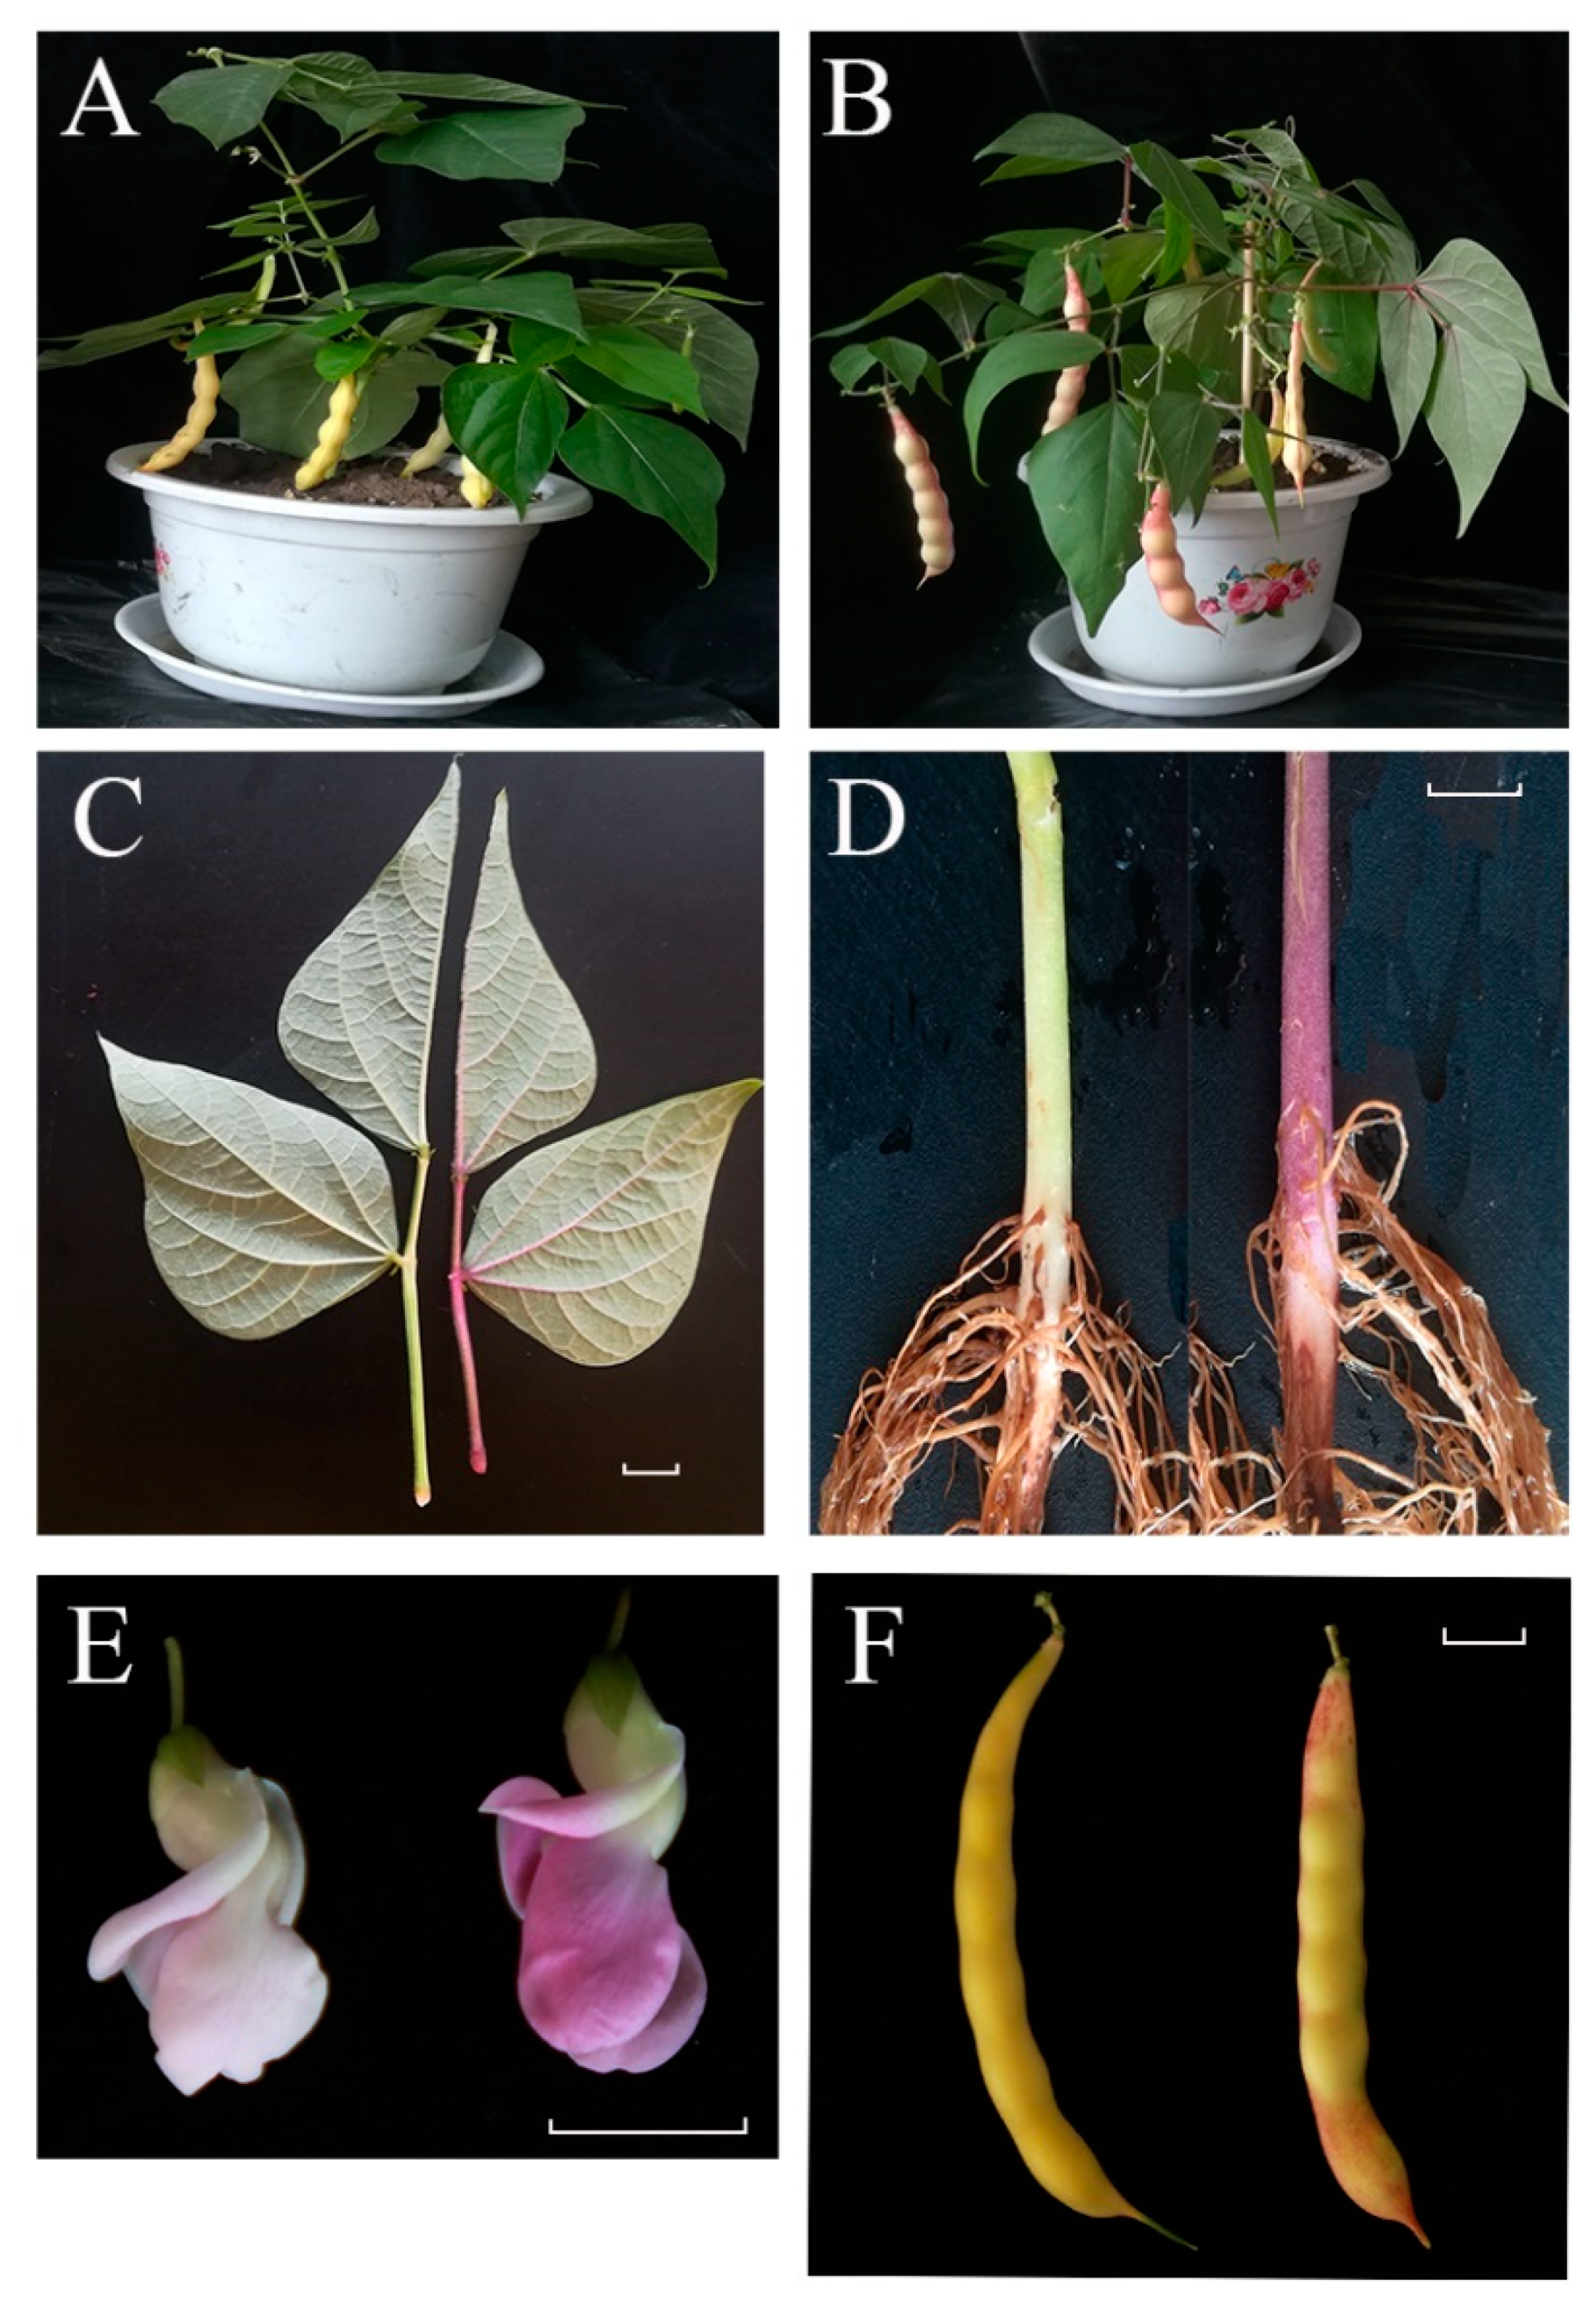
In our experimental materials, wild type ‘A18-1’ is the dwarf snap bean variety. Its cotyledons, hypocotyls, stems and leaves are green, flowers are light pink, and pods are yellow. However, the leaves, hypocotyls, stems and veins of ‘pv-pur’ mutant were purple, the flowers were also purple, and purple red stripes appeared on the surface of pods (Figure 1).

Figure 1.
Phenotypic characterization of ‘pv-pur’ and wild-type ‘A18-1’. Notes: (A): wild type ‘A18-1’ in podding stage; (B): purple mutant ‘pv-pur’ plant in podding stage; (C): leaves and stems of wild type ‘A18-1’ (left) and purple mutant ‘pv-pur’ (right); (D): hypocotyls of wild type ‘A18-1’ (left) and purple mutant ‘pv-pur’ (right); (E): flowers of wild type ‘A18-1’ (left) and purple mutant ‘pv-pur’(right); (F): bean pods of wild type ‘A18-1’ (left) and purple mutant ‘pv-pur’ (right). The scale bar is 1 cm.
2.2. Genetic Analysis of the Mutant ‘pv-pur’
In order to study the genetic behavior of the purple mutant, we used wild type ‘A18-1’ and purple mutant ‘pv-pur’ as parents to generate a six-generation cross population, and investigated the phenotype of each generation. The results are as shown in Table 1. All the F1 plants showed the same phenotype as ‘pv-pur’, which indicated that the purple phenotype of ‘pv-pur’ was dominant and controlled by nuclear genes. In the backcross generation, the segregation ratio of F1 × ‘A18-1’ was 1.17:1 (χ2 = 0.0535 < χ20.05 = 3.84), which was consistent with the theoretical ratio of 1:1; all F1 × ‘pv-pur’ plants were the purple mutant phenotype. In the F2 population, the segregation ratio of wild type ‘A18-1’ and purple mutant ‘pv-pur’ phenotype was 1:2.95 (χ2 = 0.0535 < χ20.05 = 3.84), which met the expected Mendelian segregation ratio of 1:3. Therefore, this result indicated that the purple mutant character of ‘pv-pur’ was controlled by a pair of dominant nuclear genes, and we named the gene pv-pur.

Table 1.
Genetic analysis of purple mutant pv-pur in Phaseolus vulgaris.
2.3. The Total Anthocyanin Content of ‘pv-pur’ Is Significantly Higher than That of ‘A18-1’
The total anthocyanin contents of hypocotyl, leaf, flower, and pod wall tissues of wild type ‘A18-1’ and mutant ‘pv-pur’ were determined by UV spectrophotometer. The total anthocyanin content in different parts of mutant ‘pv-pur’ varied from 3.31 mg/g to 10.831 mg/g, and the total anthocyanin content in pod walls was lowest (3.31 ± 0.44 mg/g), followed by leaves (5.37 ± 0.20 mg/g), flowers 10. 206 ± 368 mg/g, and the total anthocyanin content was highest in the hypocotyl (10.83 ± 0.77 mg/g). The content of total anthocyanins in hypocotyl, leaf, flower and pod wall of ‘pv-pur’ was significantly higher than that of wild type ‘A18-1’. Among them, the total anthocyanin content in hypocotyls of mutant ‘pv-pur’ differed the most from that of wild type ‘A18-1’, and was 5.81 times higher (Figure 2).
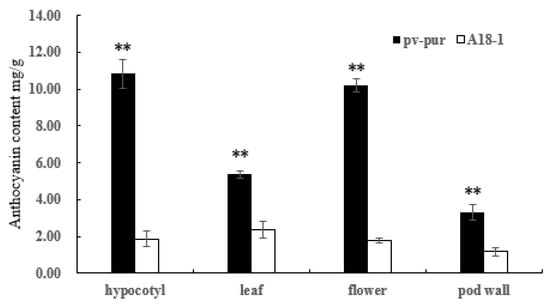
Figure 2.
Anthocyanin content in various tissues of mutant ‘pv-pur’ and wild type ‘A18-1’. Note: ** represents significant differences at p ≤ 0.01 based on ANOVA (Tukey test).
2.4. Illumina Sequencing, DEG Analysis, Funcyional Annotation and Classification
In this study, we constructed six independent sequencing libraries. After the quality control of the original sequencing data, 21952601, 26966989, 22764371, 21999131, 23371341, and 22957321 clean reads were obtained in six samples. The quality of sequencing was further assessed. In the sample CK1 (A18-1), we investigated the distribution of various base contents. The results showed that the content of A, T, G and C fluctuated only in the first 10 bases, following which the base contents were basically the same and tended to be stable. The results of the other five samples were similar to those of CK1, which is in accordance with the sequencing requirements, and could be sequenced normally.
All clean reads were aligned to the reference genome. In order to truly reflect the expression of transcripts, we normalized the number of mapped reads and the length of transcripts, and used FPKM (Fragments Per Kilobase per Million) as an indicator to measure the expression of transcripts or genes. In this study, 209 DEGs (differentially expressed genes) were identified (Supplementary File S1). Compared with CK, 132 genes were up-regulated and 77 genes were down-regulated in mutant M. Therefore, the number of up-regulated genes in purple mutant ‘pv-pur’ was higher than that of down-regulated genes. At the same time, we found 12 specifically expressed genes (only expressed in CK or M) in 209 DEGs. Amongst them, three genes were specifically expressed in wild type ‘A18-1’ (CK), and nine genes were specifically expressed in ‘pv-pur’ (M).
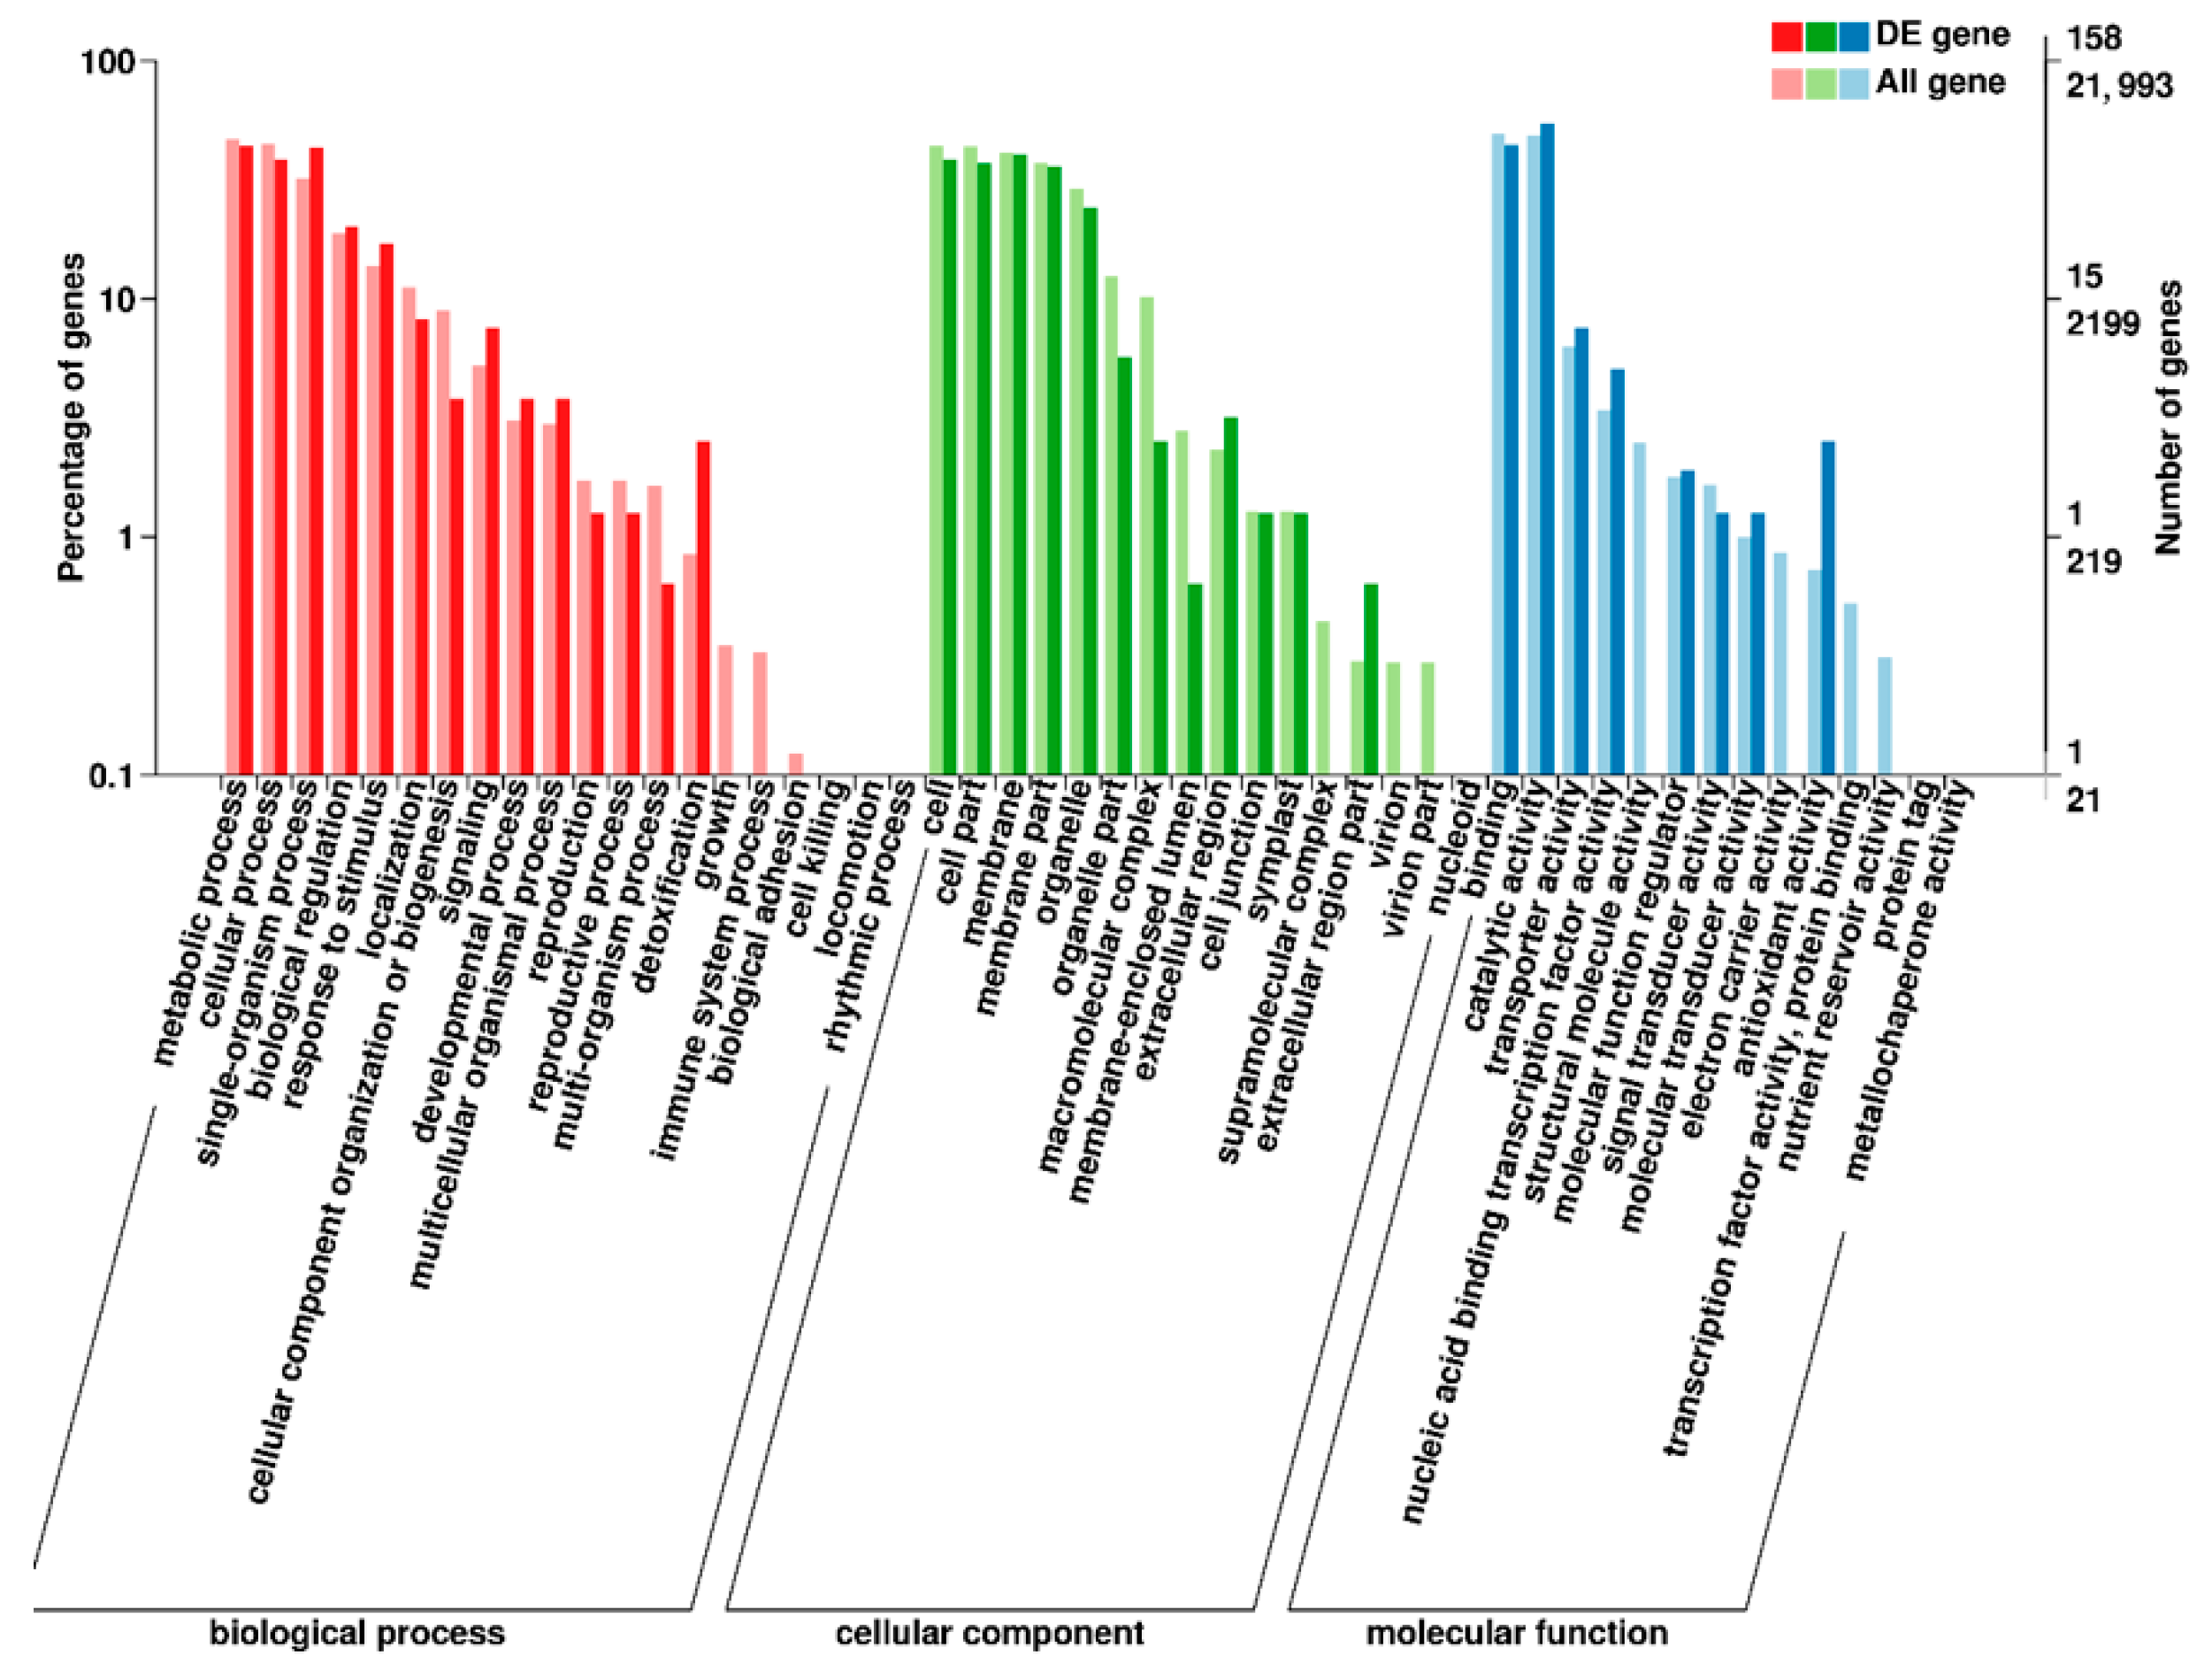
In order to study the function of differentially expressed genes, we analyzed the enrichment of GO (Gene Ontology) terms and KEGG annotations for 209 DEGs of M versus CK. In GO enrichment analysis, 50 GO terms were enriched (Figure 3), including 16 for ‘cellular components’, 14 for ‘molecular functions’ and 20 for ‘biological processes’. Among them, ‘catalytic activity’ contained the most DEGs in the entry of ‘molecular function’. We speculated that the change of anthocyanin content in the purple mutant ‘pv-pur’ may be related to the catalytic process, compared with the wild type (Figure 3). We carried out KEGG (Kyoto Encyclopedia of Genes and Genomes) enrichment analysis of all differentially expressed genes, and the results showed that the DEGs are significantly enriched in 12 metabolic pathways (Supplementary File S2). Up-regulated DEGs were enriched in 10 metabolic pathways, including flavonoid biosynthetic (Supplementary File S3). Down-regulated DEGs were enriched in four metabolic pathways, including isoflavone biosynthetic (Supplementary File S4).
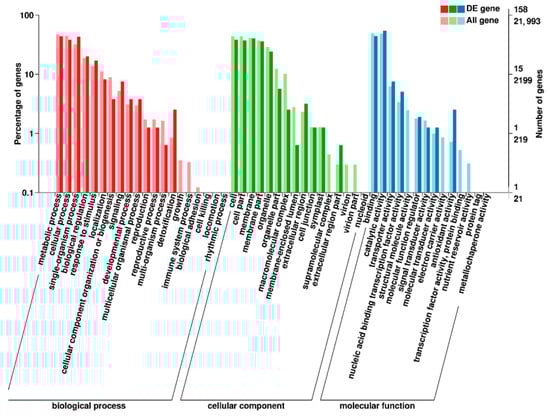
Figure 3.
GO enrichment analysis in M versus CK. Notes: The abscissa is the GO classification, the left side of the ordinate is the percentage of gene number, and the right side is the gene number. M stands for mutant ‘pv-pur’ and CK stands for ‘A18-1’.
2.5. Key Genes Involved in Anthocyanin Biosynthetic Revealed by Transcriptome Analysis
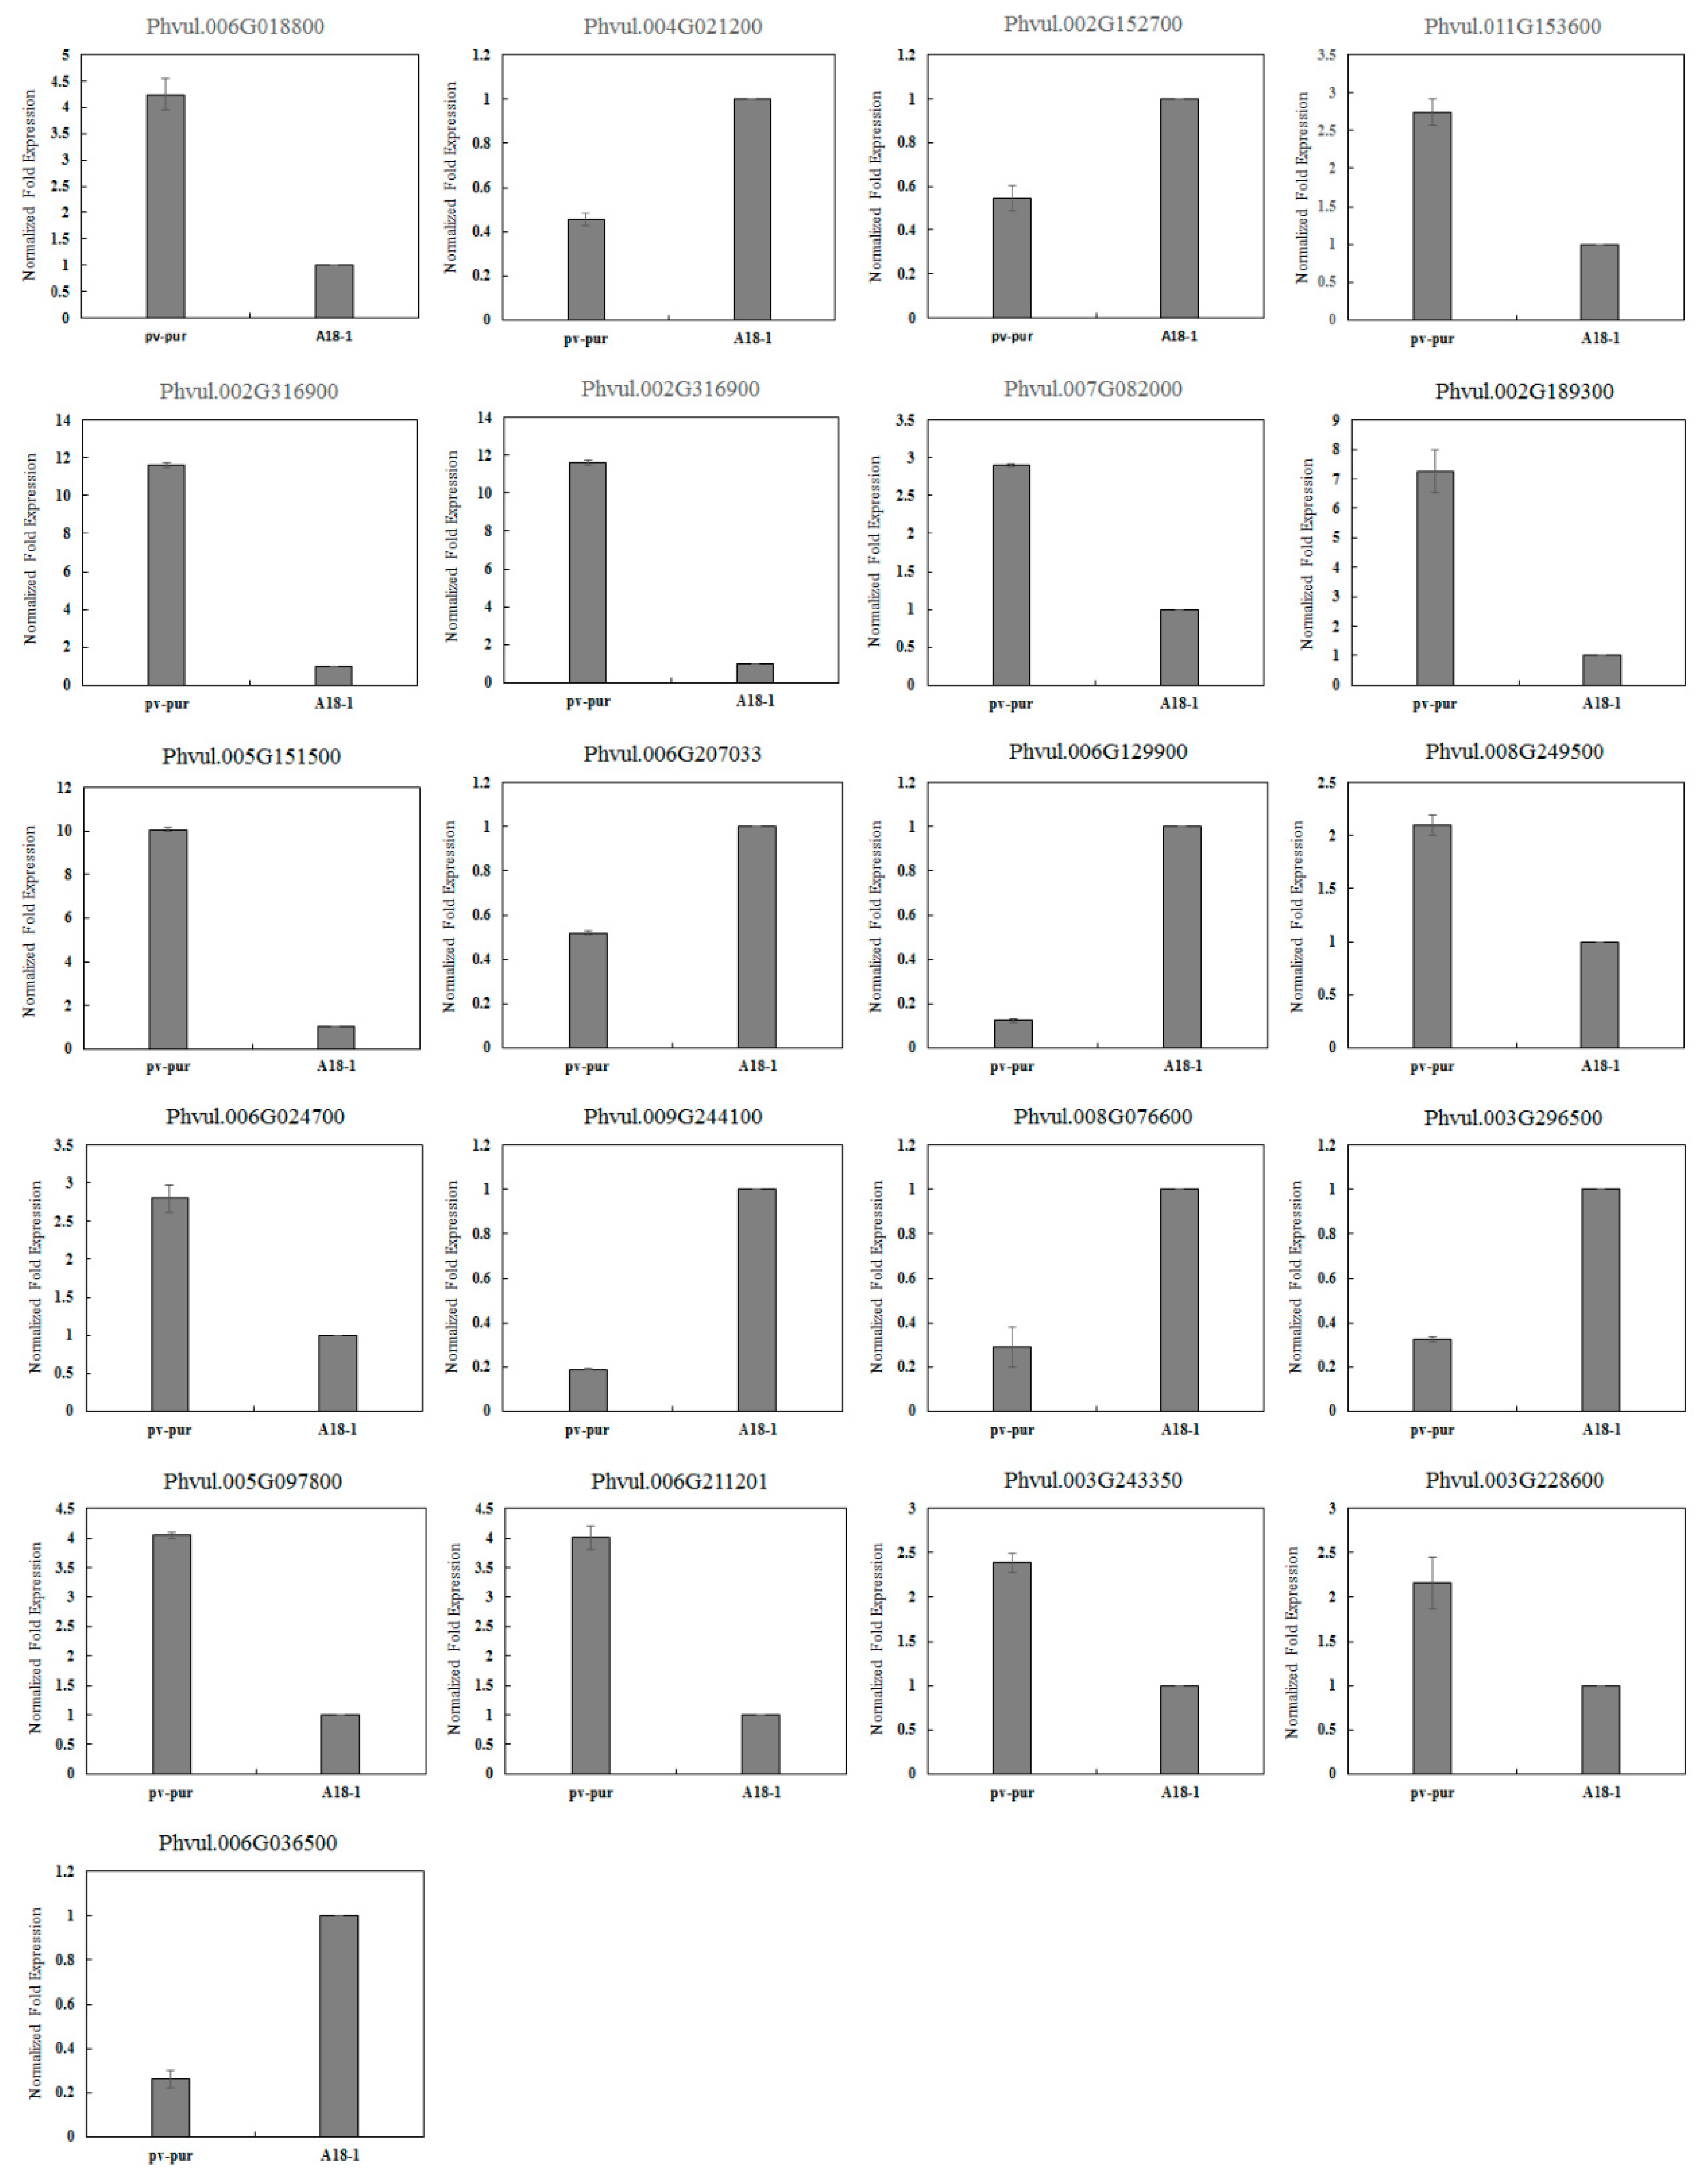
BLAST, GO, KO and KEGG were used to annotate the DEGs to screen for genes related to anthocyanin biosynthetic. Of these, 27 DEGs were involved in the biosynthetic and metabolism of anthocyanins, including 11 structural genes, 13 regulatory genes and three other genes involved in anthocyanin biosynthetic (Table 2). In order to verify the accuracy of the sequencing results, 21 genes related to anthocyanin biosynthetic were selected and verified by qRT-PCR. Among them, there were 12 structural genes and nine regulatory genes. The internal standard gene used was actin. Compared with the sequencing results, the expression trend seen in qRT-PCR was consistent, indicating that the sequencing results were accurate (Figure 4).
Table 2.
Differentially expressed genes involved in anthocyanin biosynthesis.
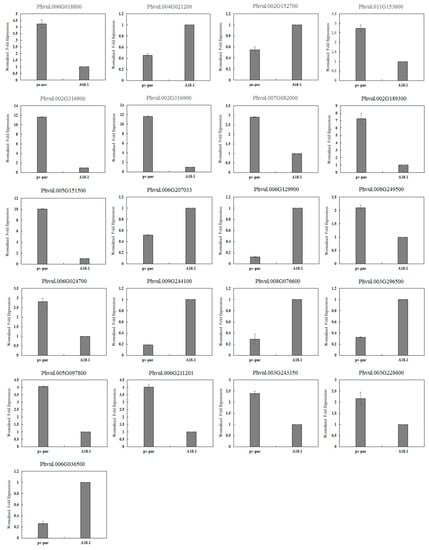
Figure 4.
Validation of gene expression by qRT–PCR.
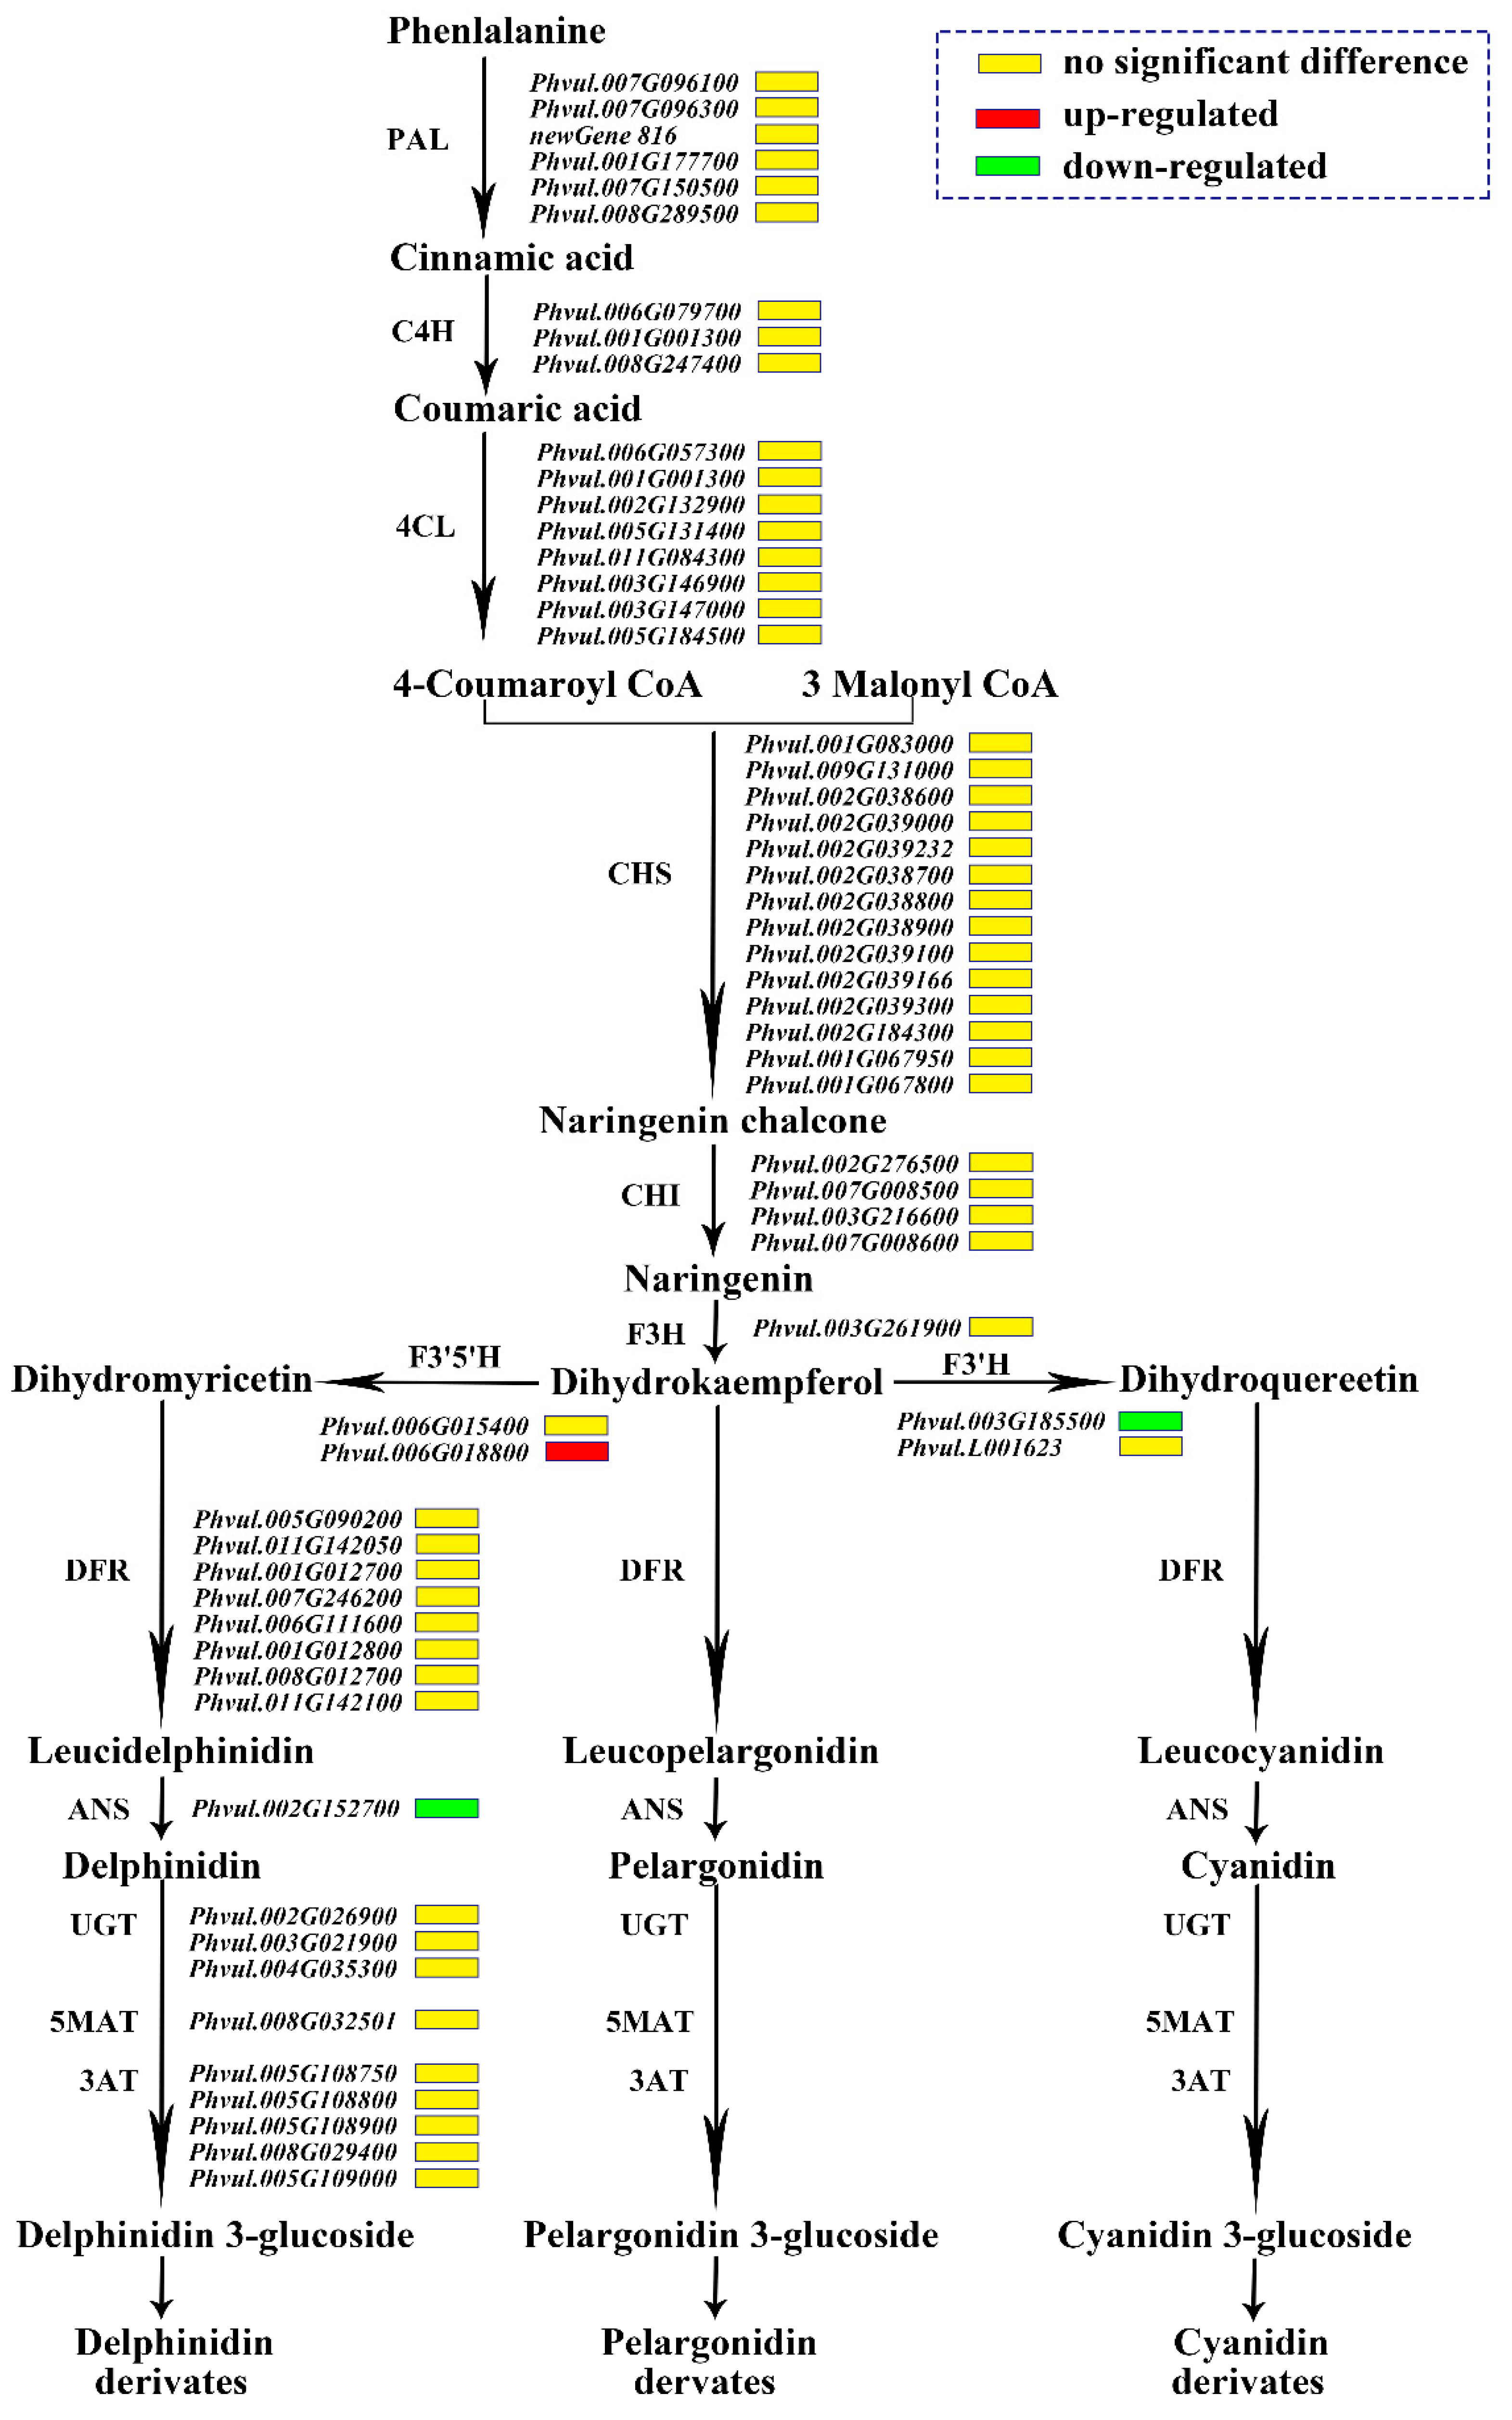
In the sequencing data, 61 genes participated in the anthocyanin synthesis pathway, including seven PAL genes, three C4H (cinnamate 4-hydroxylase) pazigenes, 10 4CL genes, 14 CHS genes, four CHI genes, one F3H gene, two F3′H genes, two F3′5′H genes, eight DFR genes, one ANS gene, three UGTs genes, one 5MAT (5-O-glucoside-6″-O-malonyltransferase) gene and five 3AT (anthocyanidin 3-O-glucoside-6″-O-acyltransferase) genes. Only three genes were differentially expressed, namely F3′5′H (Phvul.006G018800), F3′H (Phvul.004G021200), and ANS (Phvul.002G152700). The expression of Phvul.006G018800 encoding F3′5′H was up-regulated in the mutant ‘pv-pur’, and the other two genes encoding F3′H and ANS were down-regulated in the mutant ‘pv-pur’. This meant that the conversion from DHK to DHQ could be reduced, while the conversion to DHM could be increased. It can therefore be inferred that delphinidin and malvidin in this metabolic branch of DHM will increase, while the content of cyanidin and peonidin in the other branch will decrease due to the decrease in DHQ (Figure 5).

Figure 5.
Expression patterns of the genes involved in anthocyanin biosynthesis. Notes: The name of the enzyme is marked on the left of the arrow, and the gene encoding this enzyme is marked on the right of the arrow. The red box represents that the gene is up-regulated in expression in ‘pv-pur’, while the green box represents down-regulated expression, and the yellow box represents no significant difference.
2.6. Anthocyanin-Targeted Metabolomics Analysis
The same test material as that used for transcriptome analysis was selected for anthocyanin targeted metabolome analysis. A total of 12 known anthocyanin metabolites were detected in this experiment, and the corresponding information is shown in Table 3. In order to compare the differences in concentrations of each metabolite in different samples among the 12 metabolites, we corrected the mass spectral peaks of each metabolite detected in different samples to ensure the accuracy of quantitative analysis.
Table 3.
Statistical table of metabolite information.
The metabolites with fold change ≥ 2 and p-value ≤ 0.5 were selected as the final differential metabolites. In this study, there were 10 metabolites that were significantly different, among which five metabolites that were significantly up-regulated in the purple mutant ‘pv-pur’; these were: malvidin 3-O-galactoside, mallow 3-O-glucoside, delphinidin 3-O-glucoside, malvin and petunidin 3-O-glucoside. Five metabolites were significantly down-regulated in the purple mutant ‘pv-pur’; these were: peonidin O-hexoside, cyanidin O-syringic acid, delphinidin, cyanin and peonidin-3-O-glucoside chloride (Table 4).
Table 4.
Screening results of differential metabolites.
The KEGG database was used to annotate the different metabolites. The results showed that five of the 10 different metabolites could be compared with KEGG data. Among them, anthocyanin, malvacanthin 3-O-glucoside, anthocyanin 3-O-glucoside, anthocyanin and petunia 3-O-glucose are involved in anthocyanin biosynthetic (Table 5), while anthocyanin is also involved in flavonoid biosynthetic.
Table 5.
Annotation of differential metabolites in KEGG.
2.7. Joint Analysis of Transcriptome and Metabolome
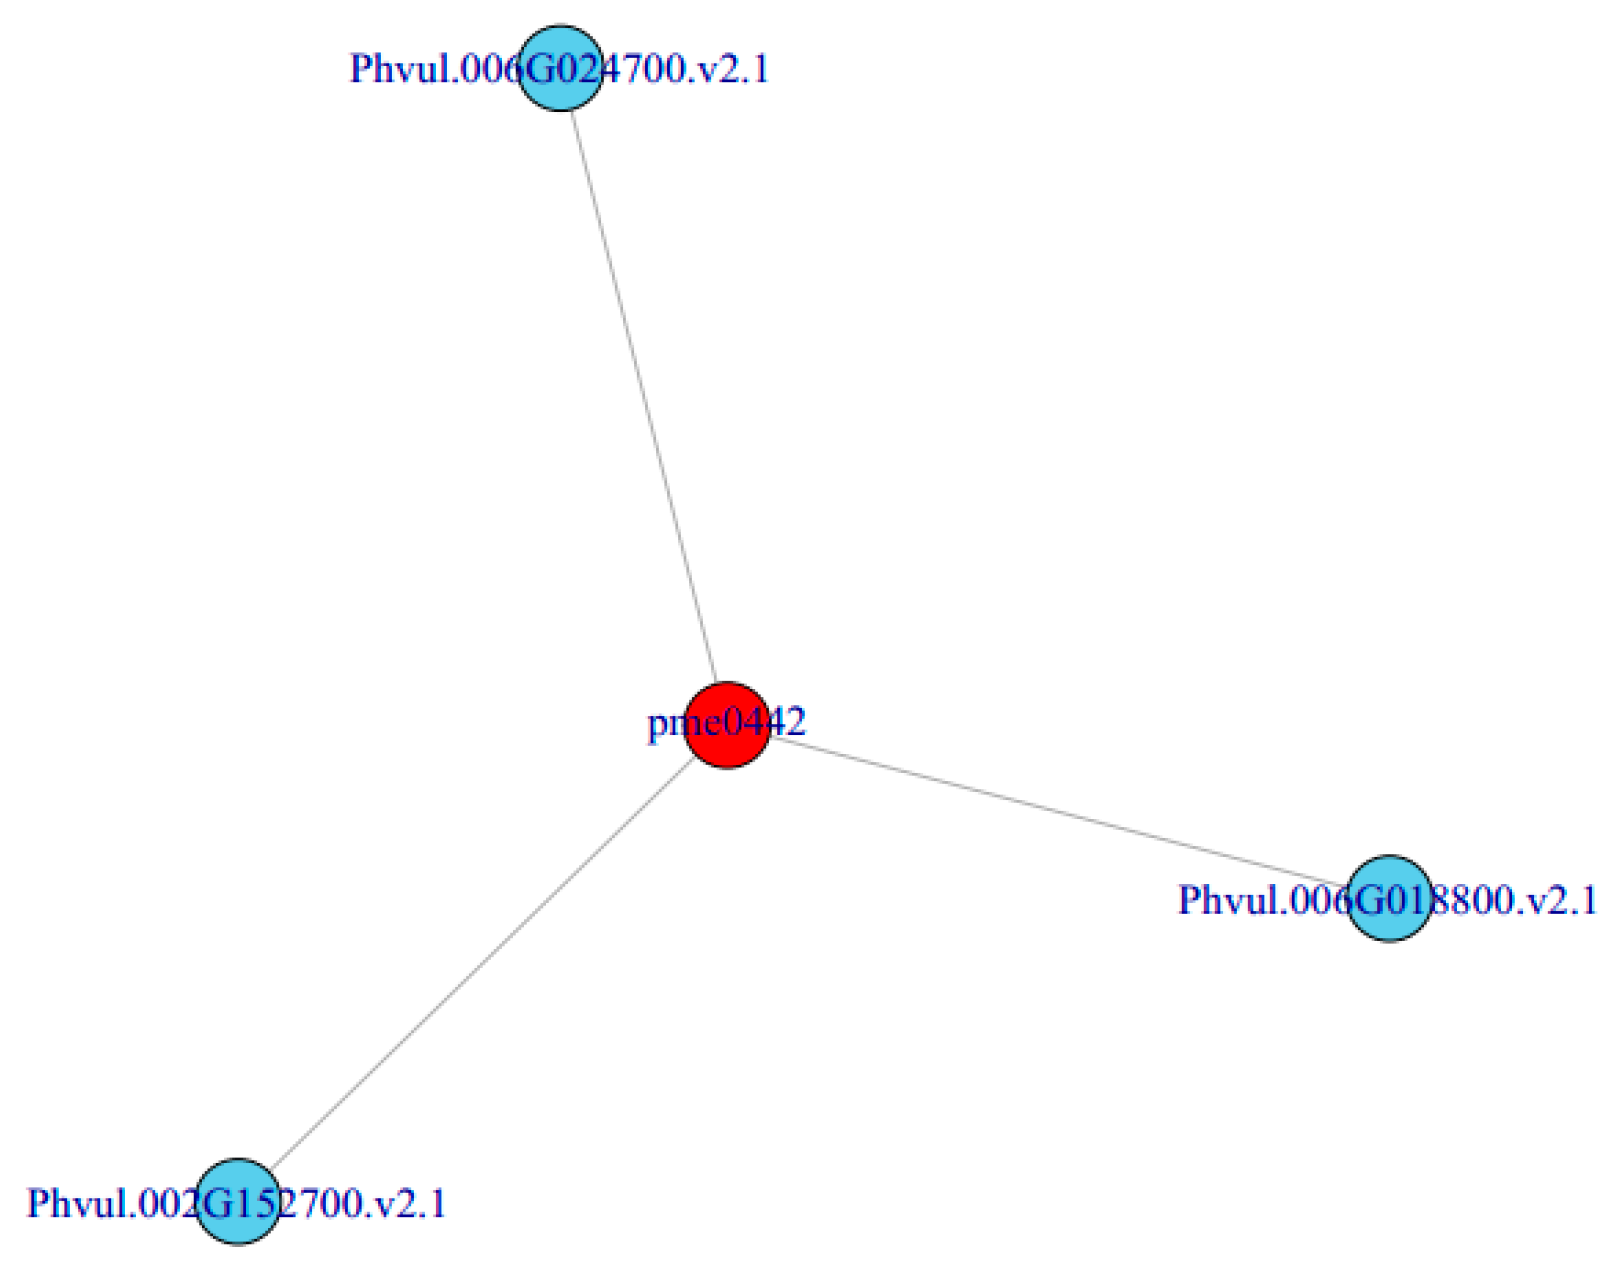
In order to better understand the relationship between genes and metabolites, different genes and metabolites in the same group were mapped to the KEGG pathway at the same time. Based on the correlation analysis of different metabolites and genes, we can directly see the relationship between metabolites and DEGs by selecting DEGs and metabolites with a correlation greater than 0.8, according to the pathway. Finally, we obtained a metabolite pme0442 (delphinidin) which was related to three DEGs: Phvul.006G024700 (SHT), Phvul.002G152700 (ANS) and Phvul.006G018800 (F3′5′H) (Figure 6). It is speculated that the change in the expression of these three genes may be the cause of the purple phenotype of the mutant ‘pv-pur’.
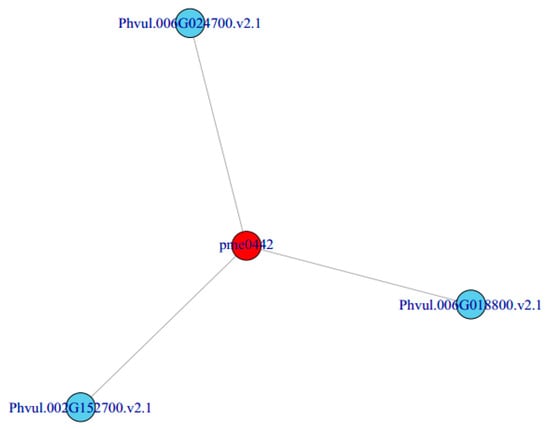
Figure 6.
Correlation network of metabolites and genes.
2.8. Upregulation of F3′5′H Expression Leads to Increased Levels of Three Anthocyanins in the Mutant ‘pv-pur’, Resulting in a Purple Phenotype
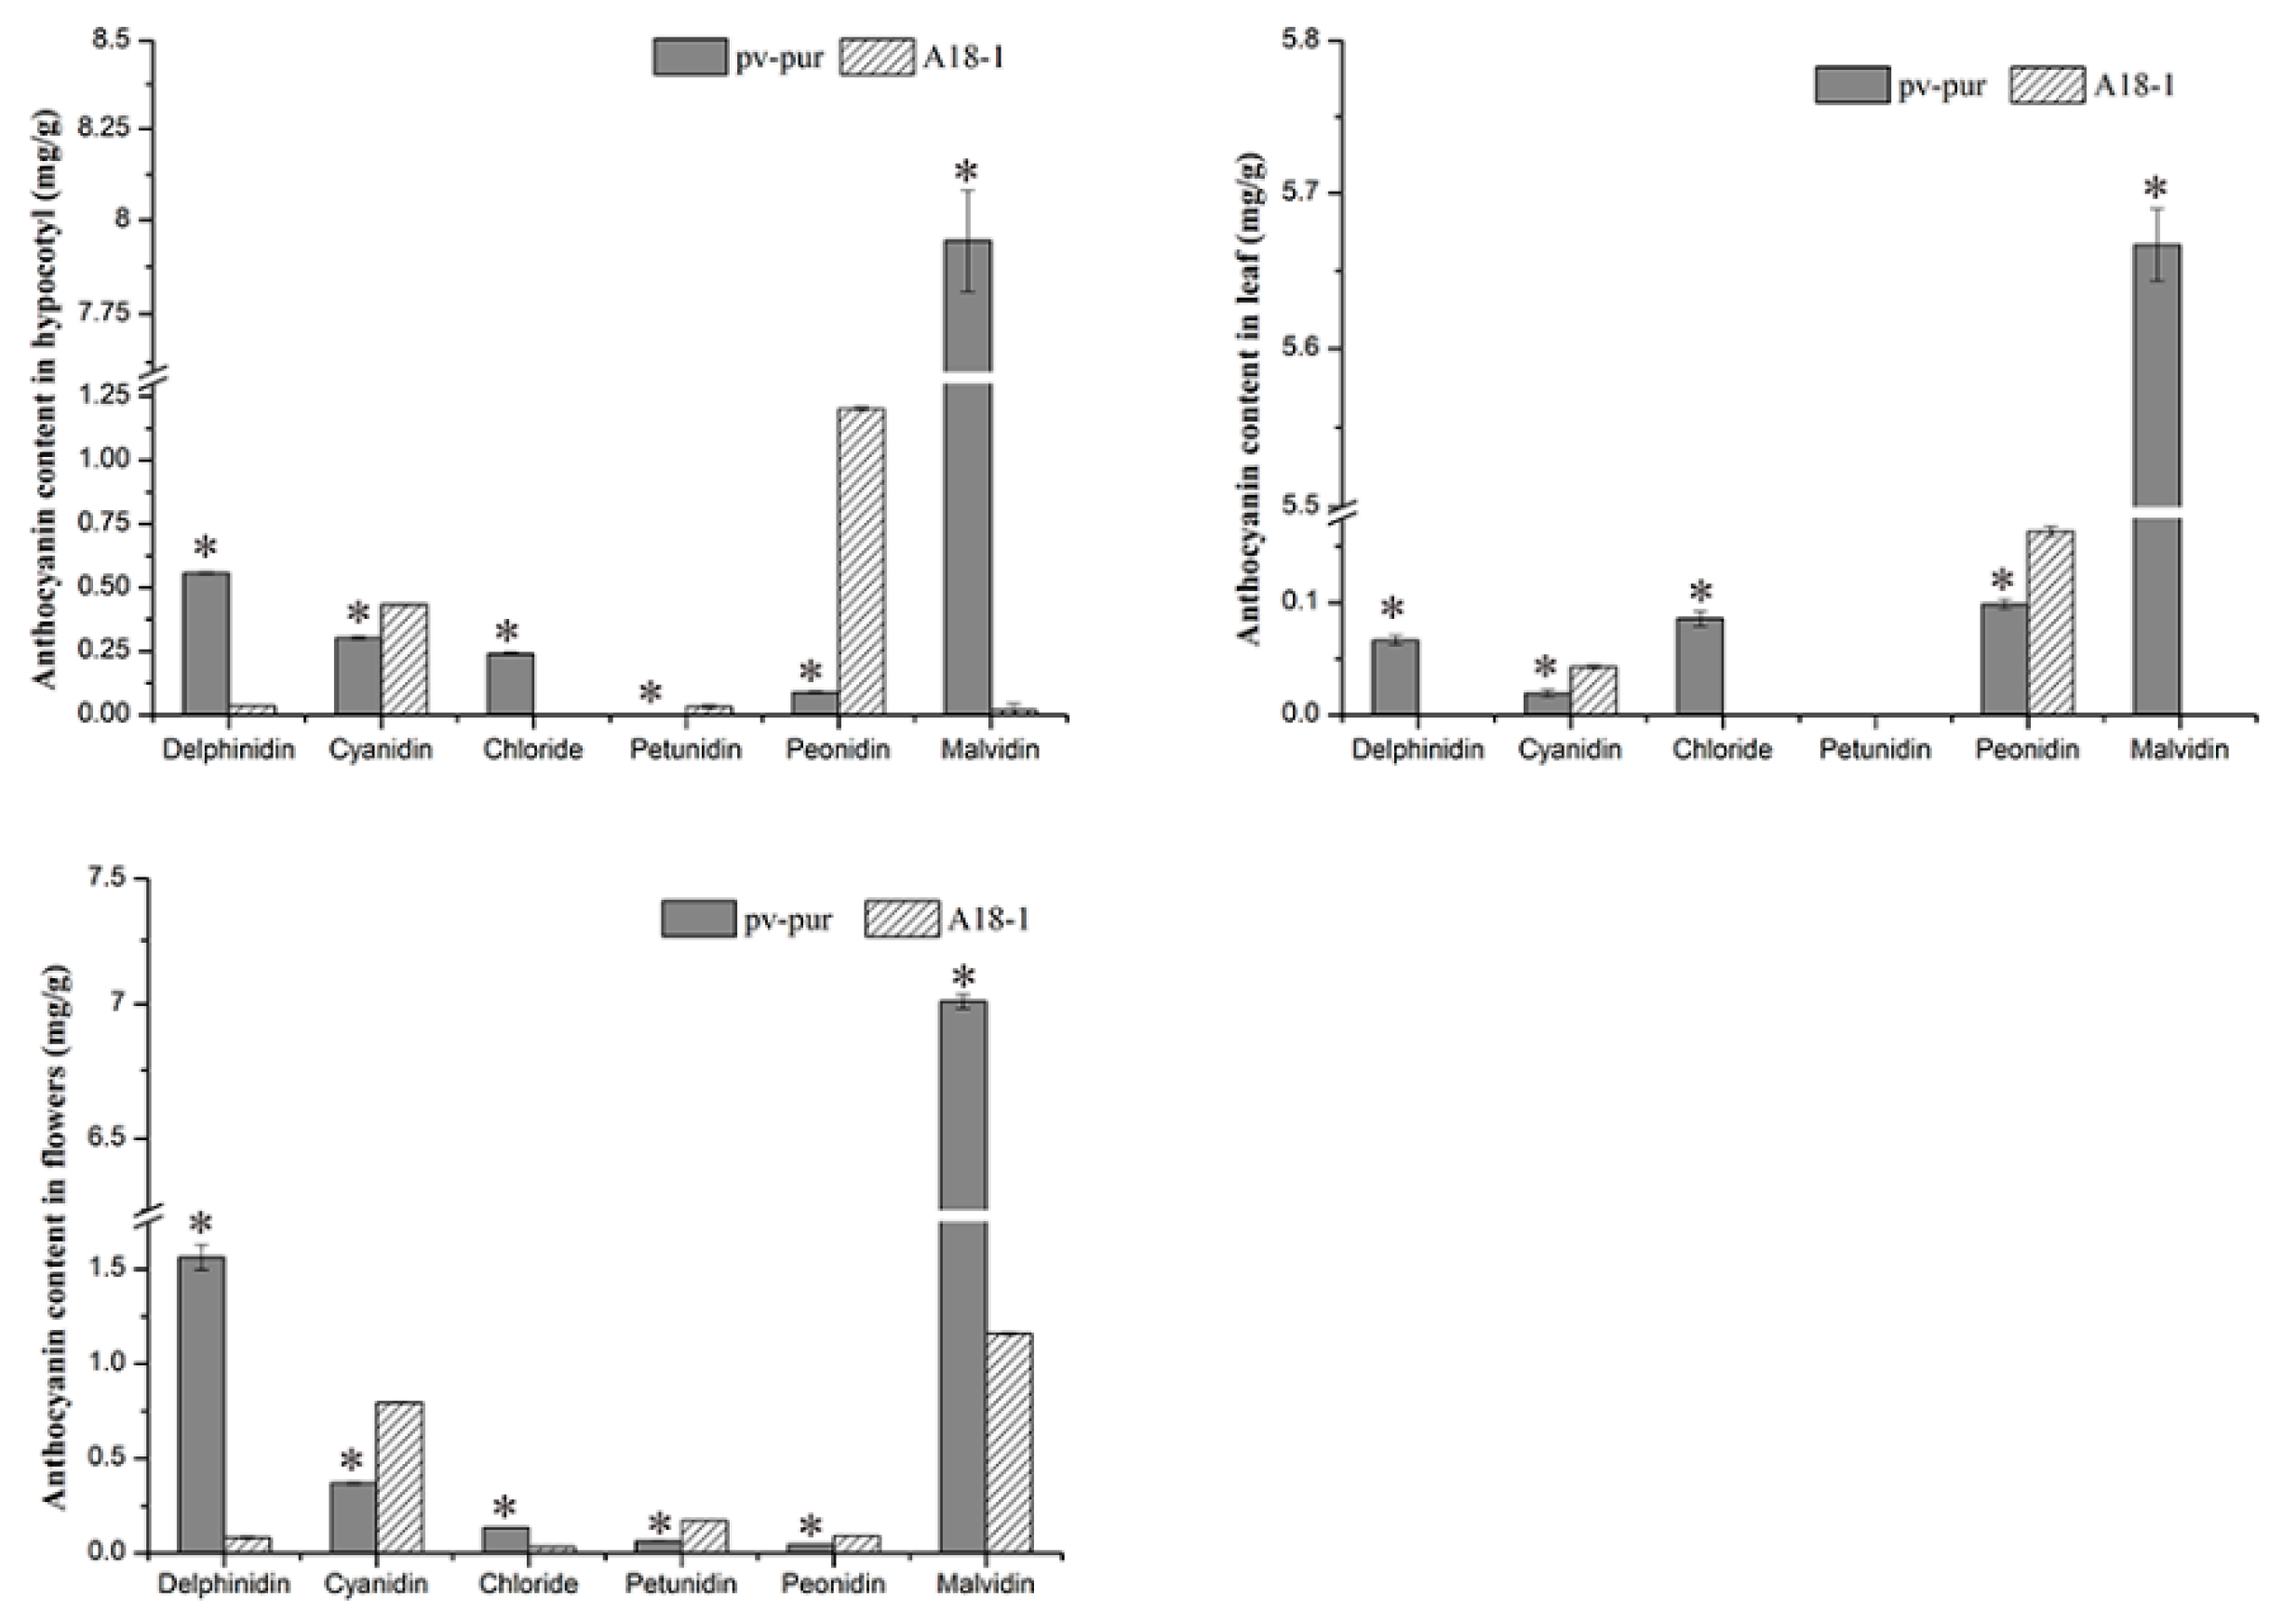
In the above results, it is not exactly clear which changes in gene expression caused which changes in anthocyanin content. Thus, we determined the content of six different anthocyanins in different parts of mutant ‘pv-pur’ and wild type ‘A18-1’ plants. The content of six anthocyanins (delphinidin, cyanidin, petunia, geranium, peonidin, and malvidin) in hypocotyls, leaves, and flowers of wild type ‘A18-1’ and mutant ‘pv-pur’ plants were determined by HPLC. The results showed that the six anthocyanins were significantly differentially abundant in different parts of wild type and mutant plants (Figure 7). In the mutant ‘pv-pur’, delphinidin, petunia, and malvidin were significantly more abundant than in wild type plants. By contrast, levels of the other three anthocyanins in the mutant ‘pv-pur’ were significantly lower than in wild type plants. This indicates that there are three branches in the anthocyanin biosynthetic pathway, and the content of three anthocyanins produced by F3′5′H increased, while the content of three anthocyanins produced from the other two branches decreased. We speculate that the content changes may be due to gene mutation, leading to changes in the three branching steps after DHK. Therefore, based on our experimental results, we conclude that the purple phenotype of the mutant ‘pv-pur’ is caused by the significant increase in the levels of three anthocyanins (delphinidin, petunia, and malvidin) due to increased expression of F3’5’H (Phvul.006G018800).

Figure 7.
Concentration of six anthocyanins in different tissues of wild type ‘A18-1’ and mutant ‘pv-pur’. Note: * represents significant differences at p ≤ 0.05 based on ANOVA (Tukey test).
2.9. Prediction and Sequence Alignment of Purple Mutant Gene pv-pur
Based on the results of transcriptome, metabolome, anthocyanin content in mutant ‘pv-pur’ and wild-type ‘A18-1’ tissues, the purple mutant gene pv-pur was predicted. According to the transcriptome sequencing results, we know that only three genes in the anthocyanin synthesis pathway are differentially expressed, they are Phvul.006G018800 (F3′5′H), Phvul.004G021200 (F3′H) and Phvul.002G152700 (ANS). In the results of joint analysis of transcriptome and metabolome, we found that the differential metabolism of metabolite pme0442 (delphinidin) was related to the differential expression of three genes, which were Phvul.006G024700 (SHT), Phvul.002G152700 (ANS) and Phvul.006G018800 (F3′5′H). Among them F3′5′H was up-regulated in mutant ‘pv-pur’, and ANS was down-regulated. The anthocyanin content assay showed that the anthocyanin content in mutant ‘pv-pur’ increased, so we inferred that Phvul.006G018800 (F3′5′H) was the mutant gene that caused the purple phenotype of the mutant ‘pv-pur’.
The gene Phvul.006G018800 was cloned and sequenced in wild-type ‘A18-1’ and purple mutant ‘pv-pur’, respectively. After comparison, it was found that there were four SNPs in the sequence of mutant ‘pv-pur’, of which the first and fourth SNPs were nonsynonymous mutations (Figure 8). The SNP located at 493bp of the coding region is responsible for the substitution of a cysteine (Cys) with a serine (Ser). The SNP located at 864bp of the coding region is responsible for the substitution of a histidine (His) with a glutamine (Gln). Functional domain analysis showed that the protein contained a P450 domain, located at 36–498bp. The first SNP mutation is located in this domain. The first SNP mutation is located in this domain. The mutation from Cys to Ser may affect the spatial structure and protein function. This further confirms our conjecture.
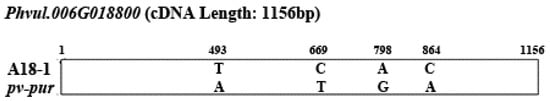
Figure 8.
Sequence alignment diagram of Phvul.006G018800 in wild type ‘A18-1’ and purple mutant ‘pv-pur’.
3. Discussion
Plant color variation is often accompanied by pigment content, plastid development, and abnormal photosynthesis. The content and types of pigments endow plants with rich colors and coloring patterns. Among them, anthocyanins endow plants with purple, red, blue, and other colors [10]. Abnormal changes in anthocyanin content often affect the color of plant appearance. The six most common anthocyanins are cyanidin, delphinidin, malvidin, pelargonidin, peonidin, and petunidin [15]. Among them, pelargonidin gives plants and orange-red color, cyanidin is associated with purple, and delphinidin, malvidin, and petunidin give plants a blue-purple color [8,16]. Snap bean, the second most important legume vegetable after soybean, is widely planted and consumed all over the world [17]. There are great differences in the color of pods and plants of different kidney bean varieties. In one study on purple and green snap bean cultivars, malvidin was found to be the main anthocyanin causing purple pod skin, and three regulatory genes were concluded to play an important role in the transcriptional activation of anthocyanin synthesis genes in purple snap bean [18]. These researchers used two different cultivated varieties in their research, while in our research we used cultivated varieties without purple appearance and purple mutants generated from wild type plants as research materials, hence the final results will be different. The experimental material used in this study is a purple mutant artificially mutated by 60Co-γ treatment and its wild type. The particularity of this material is that it can ignore the differences caused by genetic background, so then the genes related to anthocyanin synthesis can be identified more quickly and accurately.
In our study, we found that total anthocyanins in all parts of the mutant ‘pv-pur’ were significantly elevated compared with those of wild type plants. Among the six common anthocyanin types, the contents of delphinidin, petunia, and malvidin in the mutant were significantly higher than in the wild type, and these three pigments are blue-purple in color, corresponding to the phenotypic color change of our mutant ‘pv-pur’. The contents of the other three anthocyanins in the mutant ‘pv-pur’ were lower than in the wild type, which indicates that there are issues in the process of transformation from DHK to various colored anthocyanins in the anthocyanin synthesis pathway in the mutant ‘pv-pur’. This led to an increase in the content of delphinidin, petunia, and malvidin, derived from one of the branches of DHK transformed by F3′5′H, while the products of cyanidin, geranium, and peonidin, which are transformed by DFR and F3′H, were decreased significantly in abundance. Combined with the results of transcriptome analysis, these results are consistent with our speculation that there were only three DEGs in the anthocyanin synthesis pathway, among which F3′5′H was significantly upregulated in the mutant ‘pv-pur’ and F3′H was significantly downregulated in the mutant ‘pv-pur’. The significant increase in F3′5′H expression in the purple mutant ‘pv-pur’ can effectively guide the biosynthetic of delphinidin, petunia, and malvidin. The significant decrease in F3′H expression in the purple mutant ‘pv-pur’ will reduce the levels of cyanidin and peonidin in this branch. DFR exhibits a distinct substrate specificity; only when F3′H and F3′5′H are both inhibited does the direction of the anthocyanin synthesis pathway move toward the biosynthetic direction of geranium and its derivatives [19,20]. Therefore, the high expression of F3′5′H in the mutant ‘pv-pur’ will result in DFR substrate specificity, becoming an important factor which may be the reason for the decrease in geranium and its derivatives in the mutant ‘pv-pur’.
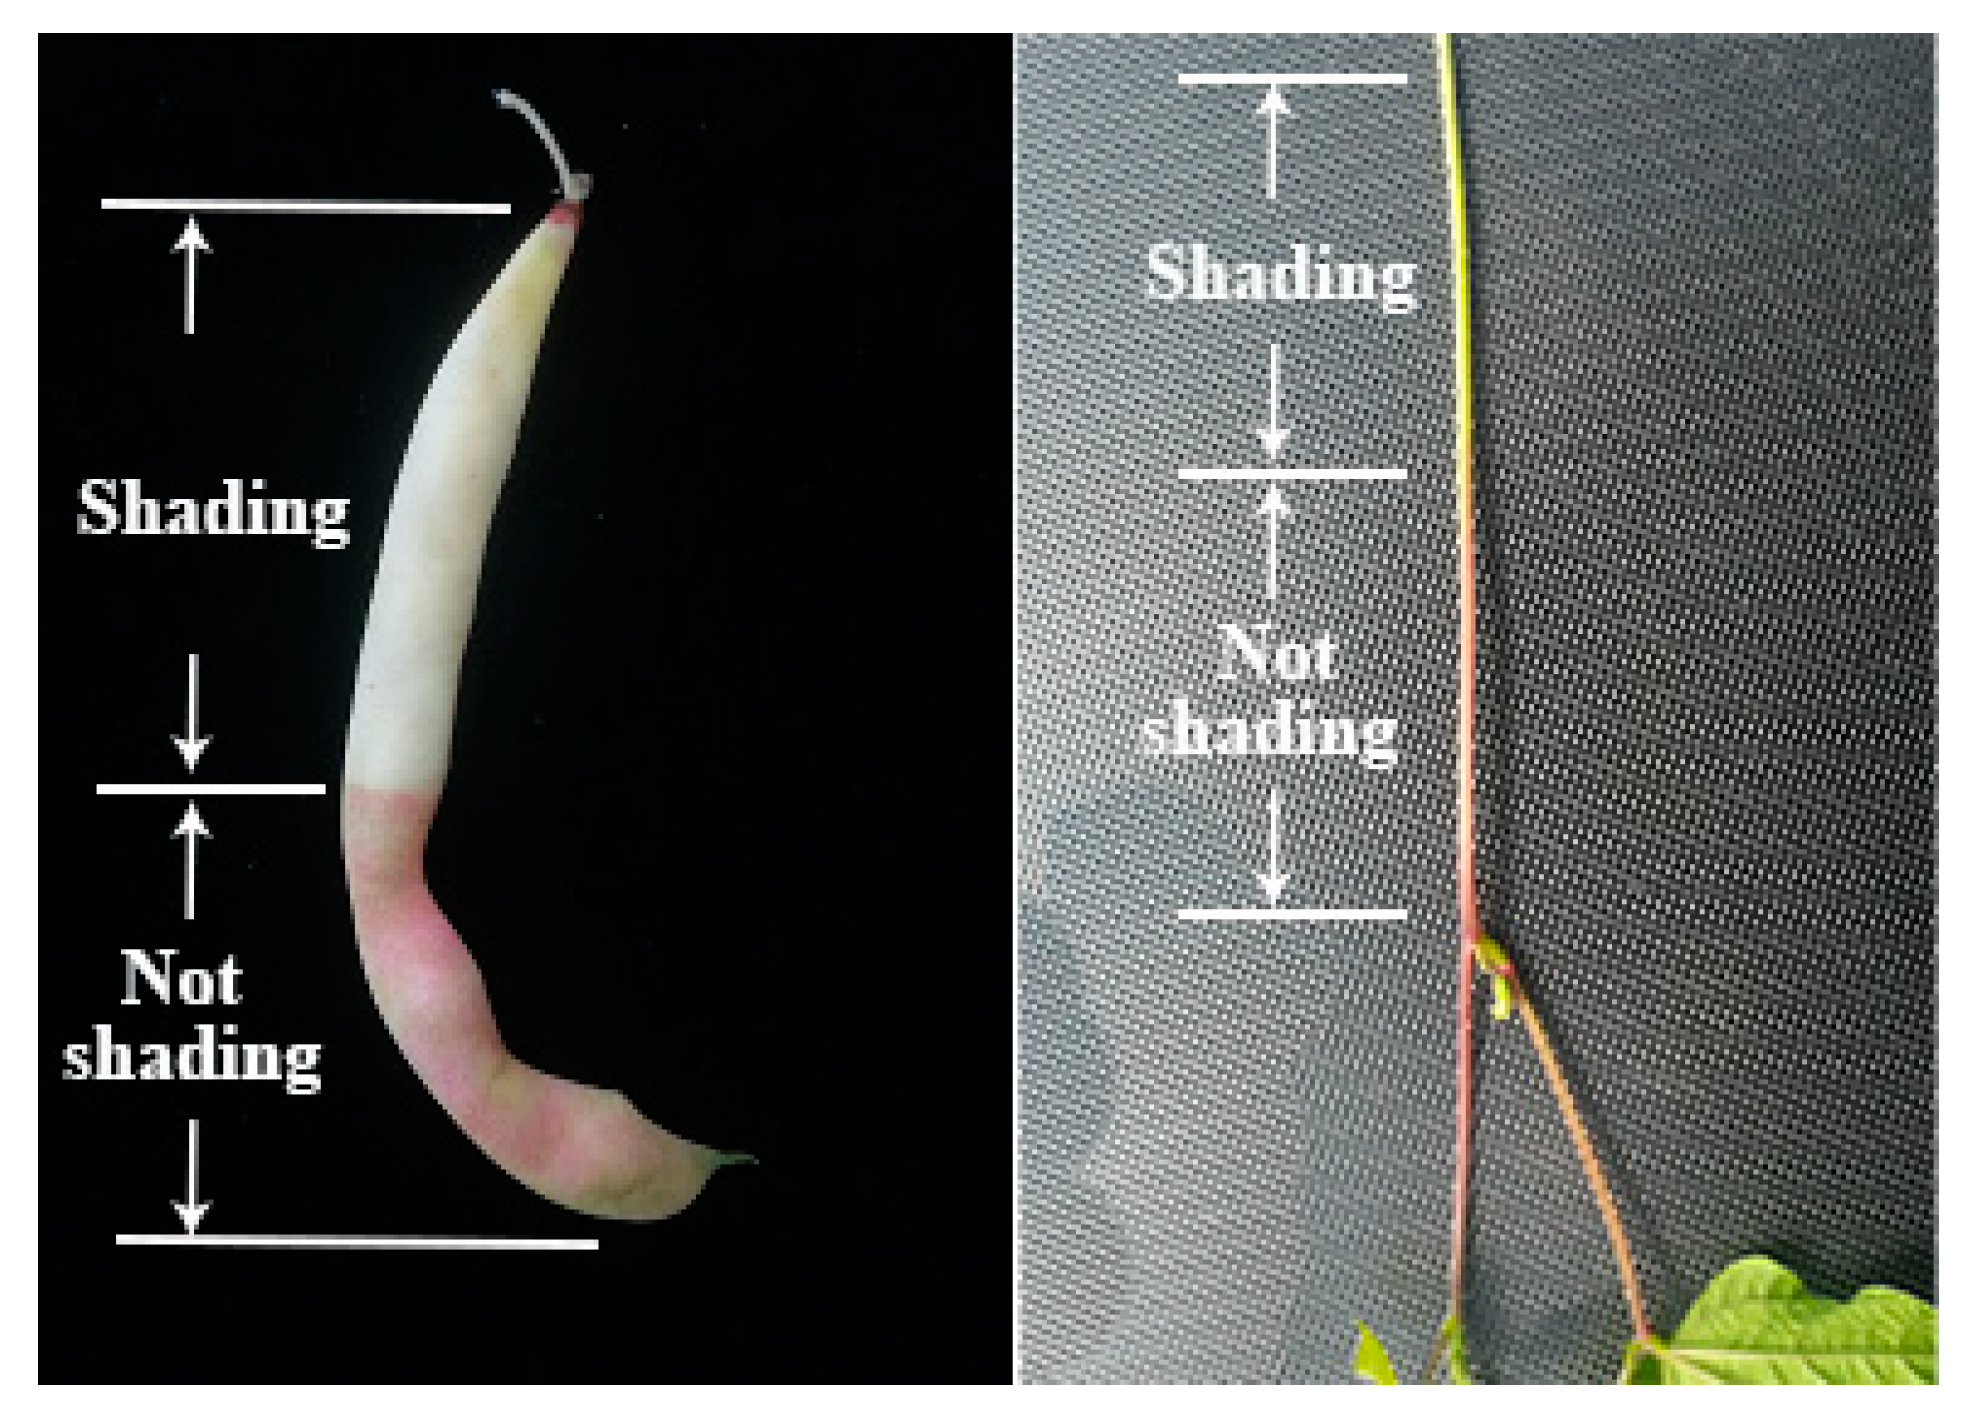
F3′5′H belongs to the cytochrome P450 family and is one of the most important enzymes in the anthocyanin biosynthetic pathway [21]. Its main function is to convert DHK and DHQ into DHM. DHM is the precursor for the synthesis of delphinidin, and F3′5′H is an essential enzyme in this step [12]. F3′5′H gene was first cloned in eggplant, which was also the earliest CYP gene cloned in plants. It was found that the F3′5′H gene was located in the hypocotyl of eggplant seedlings and was induced by white light [22]. After that, a gene homologous with F3′5′H of eggplant was cloned from Petunia hybrida flowers. Subsequently, the F3′5′H gene was cloned and isolated from some other plants, such as Catharanthus roseus, Campanula campestris, rice, Arabidopsis thaliana, etc. [23,24,25,26]. In previous studies, we found that the expression of the F3′5′H gene was spatiotemporal, but its expression in different plants and different parts was also different. With the increase of white light intensity, the expression of F3′5′H gene increased. In the study of Petunia hybrida, the F3′5′H gene was not expressed in leaves, but expressed in flower buds, and the expression was highest at the middle development stage [27]. In addition, in immunohistochemical localization analysis, F3′5′H was found to be dominant in the phloem [28]. In our study, we believe that the phenotypic variation of the purple mutant ‘pv-pur’ was caused by upregulation of Phvul.006G018800 encoding the F3′5′H enzyme. The observation of the purple mutant ‘pv-pur’ showed that the purple coloration appeared in the hypocotyl, stem, vein, petal and pod wall (Figure 1), with higher amounts in hypocotyl, stem and vein, which was consistent with the dominant expression of F3′5′H in the phloem. We conducted shading treatment on the purple mutant ‘pv-pur’ and found that the part with shading treatment by using tin foil paper had no purple phenotype, while the part without shading showed a purple phenotype (Figure 9). This shows that our mutant gene is also induced by light, which is consistent with the results in eggplant. In addition, we cloned and sequenced the gene Phvul.006G018800 in ‘A18-1’ and its mutant ‘pv-pur’. One of the nonsynonymous SNPs is located in the P450 protein domain, resulting in a cysteine to serine mutation. Cysteine generally forms a disulfide bond to stabilize the protein configuration, and is generally not able to tolerate mutations. Therefore, the mutation is likely to cause changes in protein structure and protein function. Therefore, we believe that the purple mutant ‘pv-pur’ of snap bean is caused by upregulation of Phvul.006G018800, which encodes the F3′5′H enzyme.
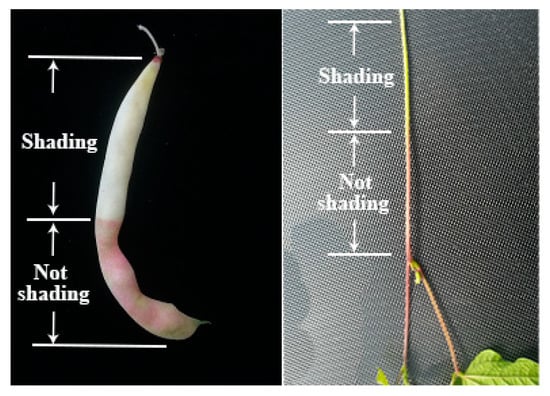
Figure 9.
Pod and stem phenotype of ‘pv-pur’ after shading treatment.
4. Materials and Methods
4.1. Plant Materials
A snap bean mutant bank was constructed by exposing dry seeds of dwarf bean variety ‘A18-1’ to 60Co-γ radiations at 150 Gy. A total of 328 mutants were screened in the M2 generation, one of which was a purple mutant. The wild-type ‘A18-1’ and the purple mutant ‘pv-pur’ were cultivated in a cold shed in Heilongjiang University, Heilongjiang Province, China, in 2019. The hypocotyls were extracted at seedling stage and wrapped in tin foil. After being frozen in liquid nitrogen, the hypocotyls were stored in −80 °C freezers for metabolomic studies and transcriptome sequencing. After podding, the hypocotyls, stems, leaves, flowers and pods of the plants were taken and stored at −80 °C for RNA extraction and determination of anthocyanin content.
4.2. Genetic Analysis of the Purple Phenotype of Mutant Plants
‘A18-1’ and ‘pv-pur’ were used as parents to conduct a six-generation cross. The phenotypic characteristics of F1, BC1 and F2 generations were investigated, and the segregation ratio was determined by χ2 (Chi square) test.
4.3. Determination of Total Anthocyanins
A sample of approximately 0.5 g was weighed and put into a pre-cooled mortar, and 5 mL of extraction solution (80% methanol: 5% hydrochloric acid: 15% ultrapure water) was added at the same time. The sample was ground into a homogenate. The liquid was kept away from light, and placed in a 4 °C refrigerator for 12 h. The sample was then centrifuged at 10,732.8× g for 15 min, and the supernatant was collected after centrifugation. The absorbance values at 657 nm (A657) and 530 nm (A530) were determined by UV spectrophotometry. The total anthocyanin content was determined according to the equation: total anthocyanin content = (A530 − 0.15 × A637)/0.5 [29,30,31].
4.4. Determination of Six Anthocyanins
The contents of six anthocyanins including delphinidin, cyanidin, petunia, pelargonidin, peonidin, and malvidin were determined by HPLC. For anthocyanin extraction and HPLC analysis, refer to the agricultural industry standard of the People’s Republic of China (NY/t2640-2014).
4.5. Transcriptome Sequencing Analysis
‘A18-1’ and ‘pv-pur’ hypocotyls were used as experimental materials, and three biological repeats were set in each group. ‘CK’ represents wild type ‘A18-1’ and ‘M’ represents purple mutant ‘pv-pur’. After total RNA was extracted from the samples, the library was established and sequenced by Biomarker Technologies Co., Ltd. (Beijing, China). After sequencing, repeated base calling steps were performed to eliminate unwanted raw reads, including those with junctions, unknown bases greater than 10%, and low-quality reads. Then, TopHat was used to compare clean reads to reference sequences (https://phytozome.jgi.doe.gov/pz/portal.html, accessed on 17 May 2019) [32].
The Fragments Per Kilobase per Million (FPKM) method was used to estimate gene expression. The screening of differentially expressed genes (DEGs) was carried out according to an experimental method published previously [33]. The false discovery rate (FDR) of the DEGs between the two samples were selected to be less than or equal to 0.001 and the log2 Ratio was set to be greater than or equal to 1. Next, Gene Ontology (GO) and the Kyoto Encyclopedia of Genes and Genomes (KEGG) analyses were performed on DEGs. Go enrichment analysis first compares all DEGs in the GO database (http://www.geneontology.org/, accessed on 17 May 2019), and then calculates the number of genes for each GO term. All GO terms highly enriched in DEGs were compared with the genomic background again by hypergeometric test, and the corrected p-value was less than or equal to 0.05. GO enrichment analysis of DEGs show the main biological functions of DEGs. KEGG is a database related to major metabolic pathways. The significant enrichment analysis of pathway takes the KEGG pathway as the unit and uses hypergeometric analysis to find out the significantly enriched pathways in DEGs compared with the whole genome. The Q-value is less than or equal to 0.05.KEGG, and enrichment analysis determines the main metabolic and signal transduction pathways the DEGs are involved in.
4.6. Targeted Metabolomics Analysis
The experimental material was the same as the transcriptome sequencing material, and each group was repeated three times. LC-MS/MS analysis was performed by Biomarker Technologies Co., LTD (Beijing, China). Based on the self-built database of the sequencing company and public databases of metabolite information including MassBank (http://www.massbank.jp/, accessed on 12 July 2019), KNAPSAcK (http://kanaya.naist.jp/KNApSAcK, accessed on 12 July 2019), HMDB (http://www.hmdb.ca/, 12 July 2019), MoToDB (http://www.ab.wur.nl/moto/, accessed on 12 July 2019), and METLIN (http://metlin.scripps.edu/index.php, accessed on 12 July 2019), qualitative analysis of the primary and secondary mass spectral data was performed. In the qualitative analysis of some materials, the isotopic signals, repeated signals containing K+, Na+ and NH4+, as well as the repeated signals of fragment ions with higher molecular weight were removed. Metabolites were quantified by multiple reaction monitoring (MRM) analysis of triple quadrupole mass spectrometry. After obtaining the mass spectral data of metabolites from different samples, the peak area of all mass spectra peaks was integrated, and the peaks of the same metabolite in different samples were integrated and corrected. After the quality control analysis of the samples, the differential metabolites were screened. The fold change was calculated and p-value was obtained by the Wilcoxon rank sum test. As screening criteria, the metabolites with fold change ≥ 2 and fold change ≤ 0.5 were selected as the final differential metabolites. The fold change was the ratio of expression between the two samples (groups).
4.7. Combined Analysis of Metabolomics and Transcriptome
The Pearson correlation coefficient was used to calculate metabolomic and transcriptome data integration. For this purpose, the average of all biological repeats for each cultivar in the metabolomic data and the average value of each gene expressed in the transcriptome data center was calculated. The variation multiples of the purple mutant ‘pv-pur’ were calculated in the metabolomic and transcriptome data and compared with the wild type. Finally, the coefficients were calculated from the log2 difference multiple of each metabolite and the log2 difference multiple of each transcript using Microsoft Excel. The correlation corresponding to R2 > 0.9 was selected. The relationship between metabolome and transcriptome was visualized by using Cytoscape (version 2.8.2, Boston, MA, USA).
4.8. qRT–PCR Detection
Using a Roche fluorescence quantitative PCR instrument (Basel, Switzerland) and Tiangen fluorescence quantitative kit (Tiangen, Beijing, China), a 20 μL reaction system was used. The three-step reaction procedure was as follows: 95 °C, 5 min, followed by 40 cycles of 95 °C, 10 s; 58 °C, 1 min. According to the sequence of differentially expressed genes, Primer 6.0 was used to design gene-specific primers, and actin was used as an internal standard gene (Table 6). All reactions were repeated three times, and the expression of related genes was calculated by the 2−ΔΔCT method [34].
Table 6.
Primers used for qRT-PCR.
4.9. Statistical Analysis
The average value of three repetitions was taken for all measurement indexes. The significance of difference was tested by IBM spss 23.0 (http://www.ibm.com/cnzh/products/spss-statistics, accessed on 10 December 2021).
4.10. Gene Cloning and Sequencing
Hiscript® II reverse transcriptase (vazyme, Nanjing, China) was used to reverse transcribe the first strand of cDNA. PCR amplification was carried out with cDNA as template, primer (L: ATGGACACCTTGTTCCTTGTGA, R: TTAACTTGGCATGGTTGGTTG) and DNA polymerase was LA Taq (TaKaRa, Beijing, China). PCR procedure: 95 °C for 5 min; 30 cycles at 95 °C for 30 s, 58 °C for 30 s, 72 °C for 1 min; 72 °C 5 min; 4 save. PCR products were sent to the company for sequencing (Tsingke Biotechnology Co., Ltd. Beijing, China).
5. Conclusions
In this study, we examined the purple mutant of snap bean induced by artificial mutation. The results showed that the content of anthocyanins in the mutant ‘pv-pur’ was significantly higher than that in the wild type, indicating that the mutant gene was the key gene for anthocyanin synthesis. Genetic analysis showed that the purple character of the mutant ‘pv-pur’ was controlled by a single dominant nuclear gene, which was named pv-pur. Through combined transcriptome and metabonomic analysis, we demonstrated that increased expression of Phvul.006G018800, which encodes F3′5′H, is the reason for the purple mutant phenotype. The results of this study will not only provide a theoretical basis for the study of genes related to anthocyanin synthesis, but also the identification of targets for snap bean breeding programs.
Supplementary Materials
The following supporting information can be downloaded at: https://www.mdpi.com/article/10.3390/ijms23031265/s1.
Author Contributions
C.L. and X.Y. conceived, designed, and performed the experiments, and wrote the manuscript; Z.Y. contributed to the experimental materials and field planting; D.L. and G.F. revised the manuscript and performed data analysis. All authors have read and agreed to the published version of the manuscript.
Funding
This work was supported by grants from the National Natural Science Foundation of China, Youth Science Foundation Project (grant number 32002031), the Basic Scientific Research Operating Expenses of Provincial College in Heilongjiang Province, China (grant numbers 2020-KYYWF-1026, 2020-KYYWF-1027), and the Heilongjiang Provincial Natural Science Foundation of China (grant number LH2020C090).
Institutional Review Board Statement
Not applicable.
Informed Consent Statement
Not applicable.
Data Availability Statement
Not applicable.
Conflicts of Interest
The authors declare that the research was conducted in the absence of any commercial or financial relationships that could be construed as a potential conflict of interest.
References
- Akula, R.; Ravishankar, G.A. Influence of abiotic stress signals on secondary metabolites in plants. Plant Signal. Behav. 2011, 6, 1720–1731. [Google Scholar] [CrossRef] [PubMed]
- Albert, N.W.; Lewis, D.H.; Zhang, H.; Irving, L.J.; Jameson, P.E.; Davies, K.M. Light-induced vegetative anthocyanin pigmentation in petunia. J. Exp. Bot. 2009, 60, 2191–2202. [Google Scholar] [CrossRef] [PubMed] [Green Version]
- Gould, K.S. Nature’s Swiss Army Knife: The Diverse Protective Roles of Anthocyanins in Leaves. J. Biomed. Biotechnol. 2007, 2004, 314–320. [Google Scholar] [CrossRef] [Green Version]
- Grotewold, E. The genetics and biochemistry of floral pigments. Annu. Rev. Plant Biol. 2006, 57, 761–780. [Google Scholar] [CrossRef]
- Hartmann, U.; Sagasser, M.; Mehrtens, F.; Stracke, R.; Weisshaar, B. Differential combinatorial interactions ofcis-acting elements recognized by R2R3-MYB, BZIP, and BHLH factors control light-responsive and tissue-specific activation of phenylpropanoid biosynthesis genes. Plant Mol. Biol. 2005, 57, 155–171. [Google Scholar] [CrossRef] [Green Version]
- Davies, K.M.; Albert, N.W.; Schwinn, K.E. From landing lights to mimicry: The molecular regulation of flower colouration and mechanisms for pigmentation patterning. Funct. Plant Biol. 2012, 39, 619. [Google Scholar] [CrossRef]
- Ohmiya, A. Biosynthesis of plant pigments: Anthocyanins, betalains and carotenoids. Plant J. 2010, 54, 733–749. [Google Scholar]
- Dooner, H.K.; Robbins, T.P.; Jorgensen, R.A. Genetic and Developmental Control of Anthocyanin Biosynthesis. Annu. Rev. Genet. 1991, 25, 173–199. [Google Scholar] [CrossRef]
- Springob, K.; Nakajima, J.I.; Yamazaki, M.; Saito, K. Recent advances in the biosynthesis and accumulation of anthocyanins. Nat. Prod. Rep. 2003, 20, 288–303. [Google Scholar] [CrossRef]
- Koes, R.; Verweij, W.; Quattrocchio, F. Flavonoids: A colorful model for the regulation and evolution of biochemical pathways. Trends Plant Sci. 2005, 10, 236–242. [Google Scholar] [CrossRef] [PubMed]
- Holton, T.A.; Cornish, E.C. Genetics and Biochemistry of Anthocyanin Biosynthesis. Plant Cell 1995, 7, 1071–1083. [Google Scholar] [CrossRef] [PubMed]
- Christian, S.; Ameres, S.; Forkmann, G. Identification of the molecular basis for the functional difference between flavonoid 3′-hydroxylase and flavonoid 3′,5′-hydroxylase. FEBS Lett. 2007, 581, 3429–3434. [Google Scholar]
- Zeng, S.; Min, W.; Zou, C.; Liu, X.; Ying, W. Comparative analysis of anthocyanin biosynthesis during fruit development in two Lycium species. Physiol. Plant 2014, 150, 505–516. [Google Scholar] [CrossRef] [PubMed]
- Yukihisa, K.; Masako, F.M.; Yuko, F.; Brugliera, F.; Holton, T.A.; Karan, M.; Nakamura, N.; Yonekura-Sakakibara, K.; Togami, J.; Pigeaire, A. Engineering of the Rose Flavonoid Biosynthetic Pathway Successfully Generated Blue-Hued Flowers Accumulating Delphinidin. Plant Cell Physiol. 2007, 48, 1589–1600. [Google Scholar]
- Kowalczyk, E.; Krzesiński, P.; Kura, M.; Szmigiel, B.; Błaszczyk, J. Anthocyanins in medicine. Pol. J. Pharmacol. 1990, 55, 699–702. [Google Scholar] [CrossRef]
- Harborne, J.B.; Williams, C.A. Advances in flavonoid research since 1992. Phytochemistry 2000, 55, 450–481. [Google Scholar] [CrossRef]
- Myoung-Gun, C.; Byoung-Rourl, C.; Young-Nam, A.; Yong-Ha, C.; Young-Son, C. Anthocyanin profile of Korean cultivated kidney bean (Phaseolus vulgaris L.). J. Agric. Food Chem. 2003, 51, 7040–7043. [Google Scholar] [CrossRef]
- Hu, J.; Chen, G.; Zhang, Y.; Cui, B.; Yin, W.; Yu, X.; Zhu, Z.; Hu, Z. Anthocyanin composition and expression analysis of anthocyanin biosynthetic genes in kidney bean pod. Plant Physiol. Biochem. 2015, 97, 304–312. [Google Scholar] [CrossRef] [PubMed]
- Tanaka, Y.; Brugliera, F. Review article: Flower colour cytochromes P450. Philos. Trans. R. Soc. B Biol. Sci. 2013, 368, 432. [Google Scholar] [CrossRef] [Green Version]
- Nakamura, N.; Fukuchi-Mizutani, M.; Fukui, Y.; Ishiguro, K.; Suzuki, K.; Suzuki, H.; Okazaki, K.; Shibata, D.; Tanaka, Y. Generation of pink flower varieties from blue Torenia hybrida by redirecting the flavonoid biosynthetic pathway from delphinidin to pelargonidin. Plant Biotechnol. 2010, 27, e375–e383. [Google Scholar] [CrossRef]
- Winkel-Shirley, B. Flavonoid biosynthesis. A colorful model for genetics, biochemistry, cell biology, and biotechnology. Plant Physiol. 2001, 126, e485–e493. [Google Scholar] [CrossRef] [PubMed] [Green Version]
- Toguri, T.; Azuma, M.; Ohtani, T. The cloning and characterization of a cDNA encoding a cytochrome P450 from the flowers of Petunia hybrida. Plant Sci. 1993, 94, 119–126. [Google Scholar] [CrossRef]
- Kaltenbach, M.; Schröder, G.; Schmelzer, E.; Lutz, V.; Schröder, J. Flavonoid hydroxylase from Catharanthus roseus: cDNA, heterologous expression, enzyme properties and cell-type specific expression in plants. Plant J. 1999, 19, 183–193. [Google Scholar] [CrossRef] [PubMed]
- Okinaka, Y.; Shimada, Y.; Nakano-Shimada, R.; Ohbayashi, M.; Kiyokawa, S.; Kikuchi, Y. Selective Accumulation of Delphinidin Derivatives in Tobacco Using a Putative Flavonoid 3′5′-Hydroxylase cDNA from Campanula medium. J. Agric. Chem. Soc. Jpn. 2003, 67, 161–165. [Google Scholar]
- Aida, R.; Yoshida, K.; Kondo, T.; Kishimoto, S.; Shibata, M. Copigmentation gives bluer flowers on transgenic torenia plants with the antisense dihydroflavonol-4-reductase gene. Plant Sci. 2000, 160, 1–56. [Google Scholar] [CrossRef]
- Mori, S.; Kobayashi, H.; Hoshi, Y.; Kondo, M.; Nakano, M. Heterologous expression of the flavonoid 3′5′-hydroxylase gene of Vinca major alters flower color in transgenic Petunia hybrida. Plant Cell Rep. 2004, 22, 415–421. [Google Scholar] [CrossRef] [PubMed]
- Li, Y.; Lou, X.; Wu, C.; Cao, S.; Zhou, Y.; Jie, B.; Cao, Y.; Meng, H.; Wu, G. Comparative Transcriptome Analysis of Genes Involved in Anthocyanin Biosynthesis in Red and Green Walnut (Juglans regia L.). Molecules 2017, 23, 25. [Google Scholar] [CrossRef] [Green Version]
- Toguri, T.; Umemoto, N.; Kobayashi, O.; Ohtani, T. Activation of anthocyanin synthesis genes by white light in eggplant hypocotyl tissues, and identification of an inducible P-450 cDNA. Plant Mol. Biol. 1994, 23, 933–946. [Google Scholar] [CrossRef]
- Rabino, I.; Mancinelli, A.L. Light, temperature, and anthocyanin production. Plant Physiol. 1986, 81, 922–924. [Google Scholar] [CrossRef] [Green Version]
- Kubasek, W.L.; Shirley, B.W.; McKillop, A.; Goodman, H.M.; Briggs, W.; Ausubel, F.M. Regulation of flavonoid biosynthetic genes in germinating Arabidopsis seedlings. Plant Cell 1992, 4, 1229–1236. [Google Scholar] [CrossRef]
- Frank, M.; Harald, K.; Pawel, B.; Bernd, W. The Arabidopsis transcription factor MYB12 is a flavonol-specific regulator of phenylpropanoid biosynthesis. Plant Physiol. 2005, 138, 1083–1096. [Google Scholar]
- Trapnell, C.; Pachter, L.; Salzberg, S.L. TopHat: Discovering splice junctions with RNA-Seq. Bioinformatics 2009, 25, 1105–1111. [Google Scholar] [CrossRef]
- Audic, S.; Claverie, J.M. The significance of digital gene expression profiles. Genome Res. 1997, 7, 986–995. [Google Scholar] [CrossRef] [PubMed]
- Livak, K.J.; Schmittgen, T.D.L. Analysis of relative gene expression data using real-time quantitative PCR and the 2(-Delta Delta C(T)) method. Methods 2001, 25, 402–408. [Google Scholar] [CrossRef] [PubMed]


Publisher’s Note: MDPI stays neutral with regard to jurisdictional claims in published maps and institutional affiliations. |
© 2022 by the authors. Licensee MDPI, Basel, Switzerland. This article is an open access article distributed under the terms and conditions of the Creative Commons Attribution (CC BY) license (https://creativecommons.org/licenses/by/4.0/).