Article

Epigenomic and Transcriptomic Prioritization of Candidate Obesity-Risk Regulatory GWAS SNPs

1
Tulane Center for Biomedical Informatics and Genomics, Division of Biomedical Informatics and Genomics, Deming Department of Medicine, School of Medicine, Tulane University, New Orleans, LA 70112, USA
2
Center for System Biology, Data Sciences, and Reproductive Health, School of Basic Medical Science, Central South University, Changsha 410013, China
3
Tulane Cancer Center and Hayward Genetics Center, Tulane University, New Orleans, LA 70112, USA
*
Authors to whom correspondence should be addressed.
Int. J. Mol. Sci. 2022, 23(3), 1271; https://doi.org/10.3390/ijms23031271
Submission received: 15 December 2021 / Revised: 19 January 2022 / Accepted: 19 January 2022 / Published: 23 January 2022
(This article belongs to the Section Molecular Genetics and Genomics)

Abstract

:
Concern about rising rates of obesity has prompted searches for obesity-related single nucleotide polymorphisms (SNPs) in genome-wide association studies (GWAS). Identifying plausible regulatory SNPs is very difficult partially because of linkage disequilibrium. We used an unusual epigenomic and transcriptomic analysis of obesity GWAS-derived SNPs in adipose versus heterologous tissues. From 50 GWAS and 121,064 expanded SNPs, we prioritized 47 potential causal regulatory SNPs (Tier-1 SNPs) for 14 gene loci. A detailed examination of seven loci revealed that four (CABLES1, PC, PEMT, and FAM13A) had Tier-1 SNPs positioned so that they could regulate use of alternative transcription start sites, resulting in different polypeptides being generated or different amounts of an intronic microRNA gene being expressed. HOXA11 and long noncoding RNA gene RP11-392O17.1 had Tier-1 SNPs in their 3′ or promoter region, respectively, and strong preferences for expression in subcutaneous versus visceral adipose tissue. ZBED3-AS1 had two intragenic Tier-1 SNPs, each of which could contribute to mediating obesity risk through modulating long-distance chromatin interactions. Our approach not only revealed especially credible novel regulatory SNPs, but also helped evaluate previously highlighted obesity GWAS SNPs that were candidates for transcription regulation.

1. Introduction

The rapidly rising rates of obesity are a major concern for public health and increased risk of disease, including type 2 diabetes (T2D), cardiovascular disease, osteoarthritis, certain kinds of cancer, and respiratory problems [1,2]. Adipose tissue expansion involves an increase in the number of adipocytes and/or in the size of adipocytes. However, not only overall obesity, but also the location of the fat depot with increased adipose tissue is of importance to health risk [2]. The major types of fat depots are visceral adipose tissue (VAT), which is deposited around internal organs in the abdominal cavity, and subcutaneous adipose tissue (SAT), which is beneath the skin. High levels of VAT are associated with metabolic abnormalities while high levels of SAT may be protective rather than harmful [3]. Similarly, adipose deposition around the hips, which mostly involves SAT, is less likely to be a risk factor for various chronic diseases than are high levels of adipose at the waist, which have a large VAT component. Pre-menopausal women with their tendency for high SAT/VAT ratios are at lower risk of adipose-related disease [4]. Nonetheless, expansion of SAT depots may also contribute to health either in its protective role or through its interactions with VAT depots [3,5].
The clinical relevance of the location of fat depots in obesity led to more detailed measurements of obesity than just body mass index (BMI), namely, the waist-to-hip ratio (WHR) adjusted for BMI (WHRadjBMI), waist circumference adjusted for BMI (WCadjBMI), and hip circumference adjusted for BMI (HCadjBMI). These anthropomorphic measures are the most frequent ones used in genome-wide association studies of the genetic risk of obesity (obesity GWAS) because of their ease of measurement and, for the last three measures, their health-related emphasis on the distribution of fat depots [3]. Genetic risk clearly contributes to obesity, and genetic heritability for BMI has been estimated to be 30–40% [2], but this estimate depends on the study design [6].
Especially challenging in the analysis of most GWAS-derived genetic variants is assigning a biochemical function to them when they are not both exonic and predicted to change the encoded protein’s activity or stability. For example, less than 10% of single nucleotide polymorphisms (SNPs, the most frequent genetic variants) significantly associated with obesity in GWAS are in coding regions [7], and only a fraction of these SNPs is in non-synonymous codons predicted to affect polypeptide structure. Most of the GWAS-derived SNPs that actually mitigate genetic risk for a given trait are probably in enhancers or, less frequently, promoters [8]. The detection of regulatory SNPs is complicated by the variety of sizes and genomic locations for cell-type specific enhancers. Especially difficult is the finding that there are often tens to hundreds of SNPs tightly linked to an individual GWAS-reported SNP, a problem that also is characteristic of expression quantitative trait loci (eQTLs). Complex linkage disequilibrium (LD) between SNPs and causative mutations compounded by sampling errors in test statistics [9] obscures the assignment of a given SNP to a biological function. Because of LD, it is important to expand GWAS SNPs that are obtained from only small subsets of total SNPs (as is generally the case) to obtain all SNPs highly linked to the tested set of SNPs.
While there has been more attention recently to epigenetics in studies of obesity and obesity risk (for example, [1,2,10,11]), many recent GWAS either do not include epigenomic or transcriptomic analyses in evaluating GWAS-derived SNPs or do so with insufficient use of important, publicly available databases (for example, [12,13,14,15,16]). Here, we propose a novel method for prioritizing candidates for regulatory SNPs derived from obesity GWAS by extensively using publicly available epigenomic and transcriptomic data. Our prioritization scheme is focused on SNPs preferentially displaying transcription-enhancing epigenetic marks in adipose tissue and associated with genes preferentially expressed in adipose tissue, in conjunction with a rigorous screening for SNPs that overlap predicted allele-specific transcription factor (TF) binding sites. We focused on adipose tissue due to its direct relationship to obesity [1,2]. We demonstrate that our prioritization method can find a subset of novel, highly plausible regulatory SNPs from 50 obesity GWAS. These SNPs are candidates for modulating enhancers, promoters, or long-distance chromatin interactions affecting expression of protein-coding or long non-coding RNA (lncRNA) genes relevant to adipose biology. Our prioritization method is a valuable tool for rigorous identification of regulatory SNP candidates after obtaining GWAS data and can be easily adopted to studies of other complex disorders.

2. Results

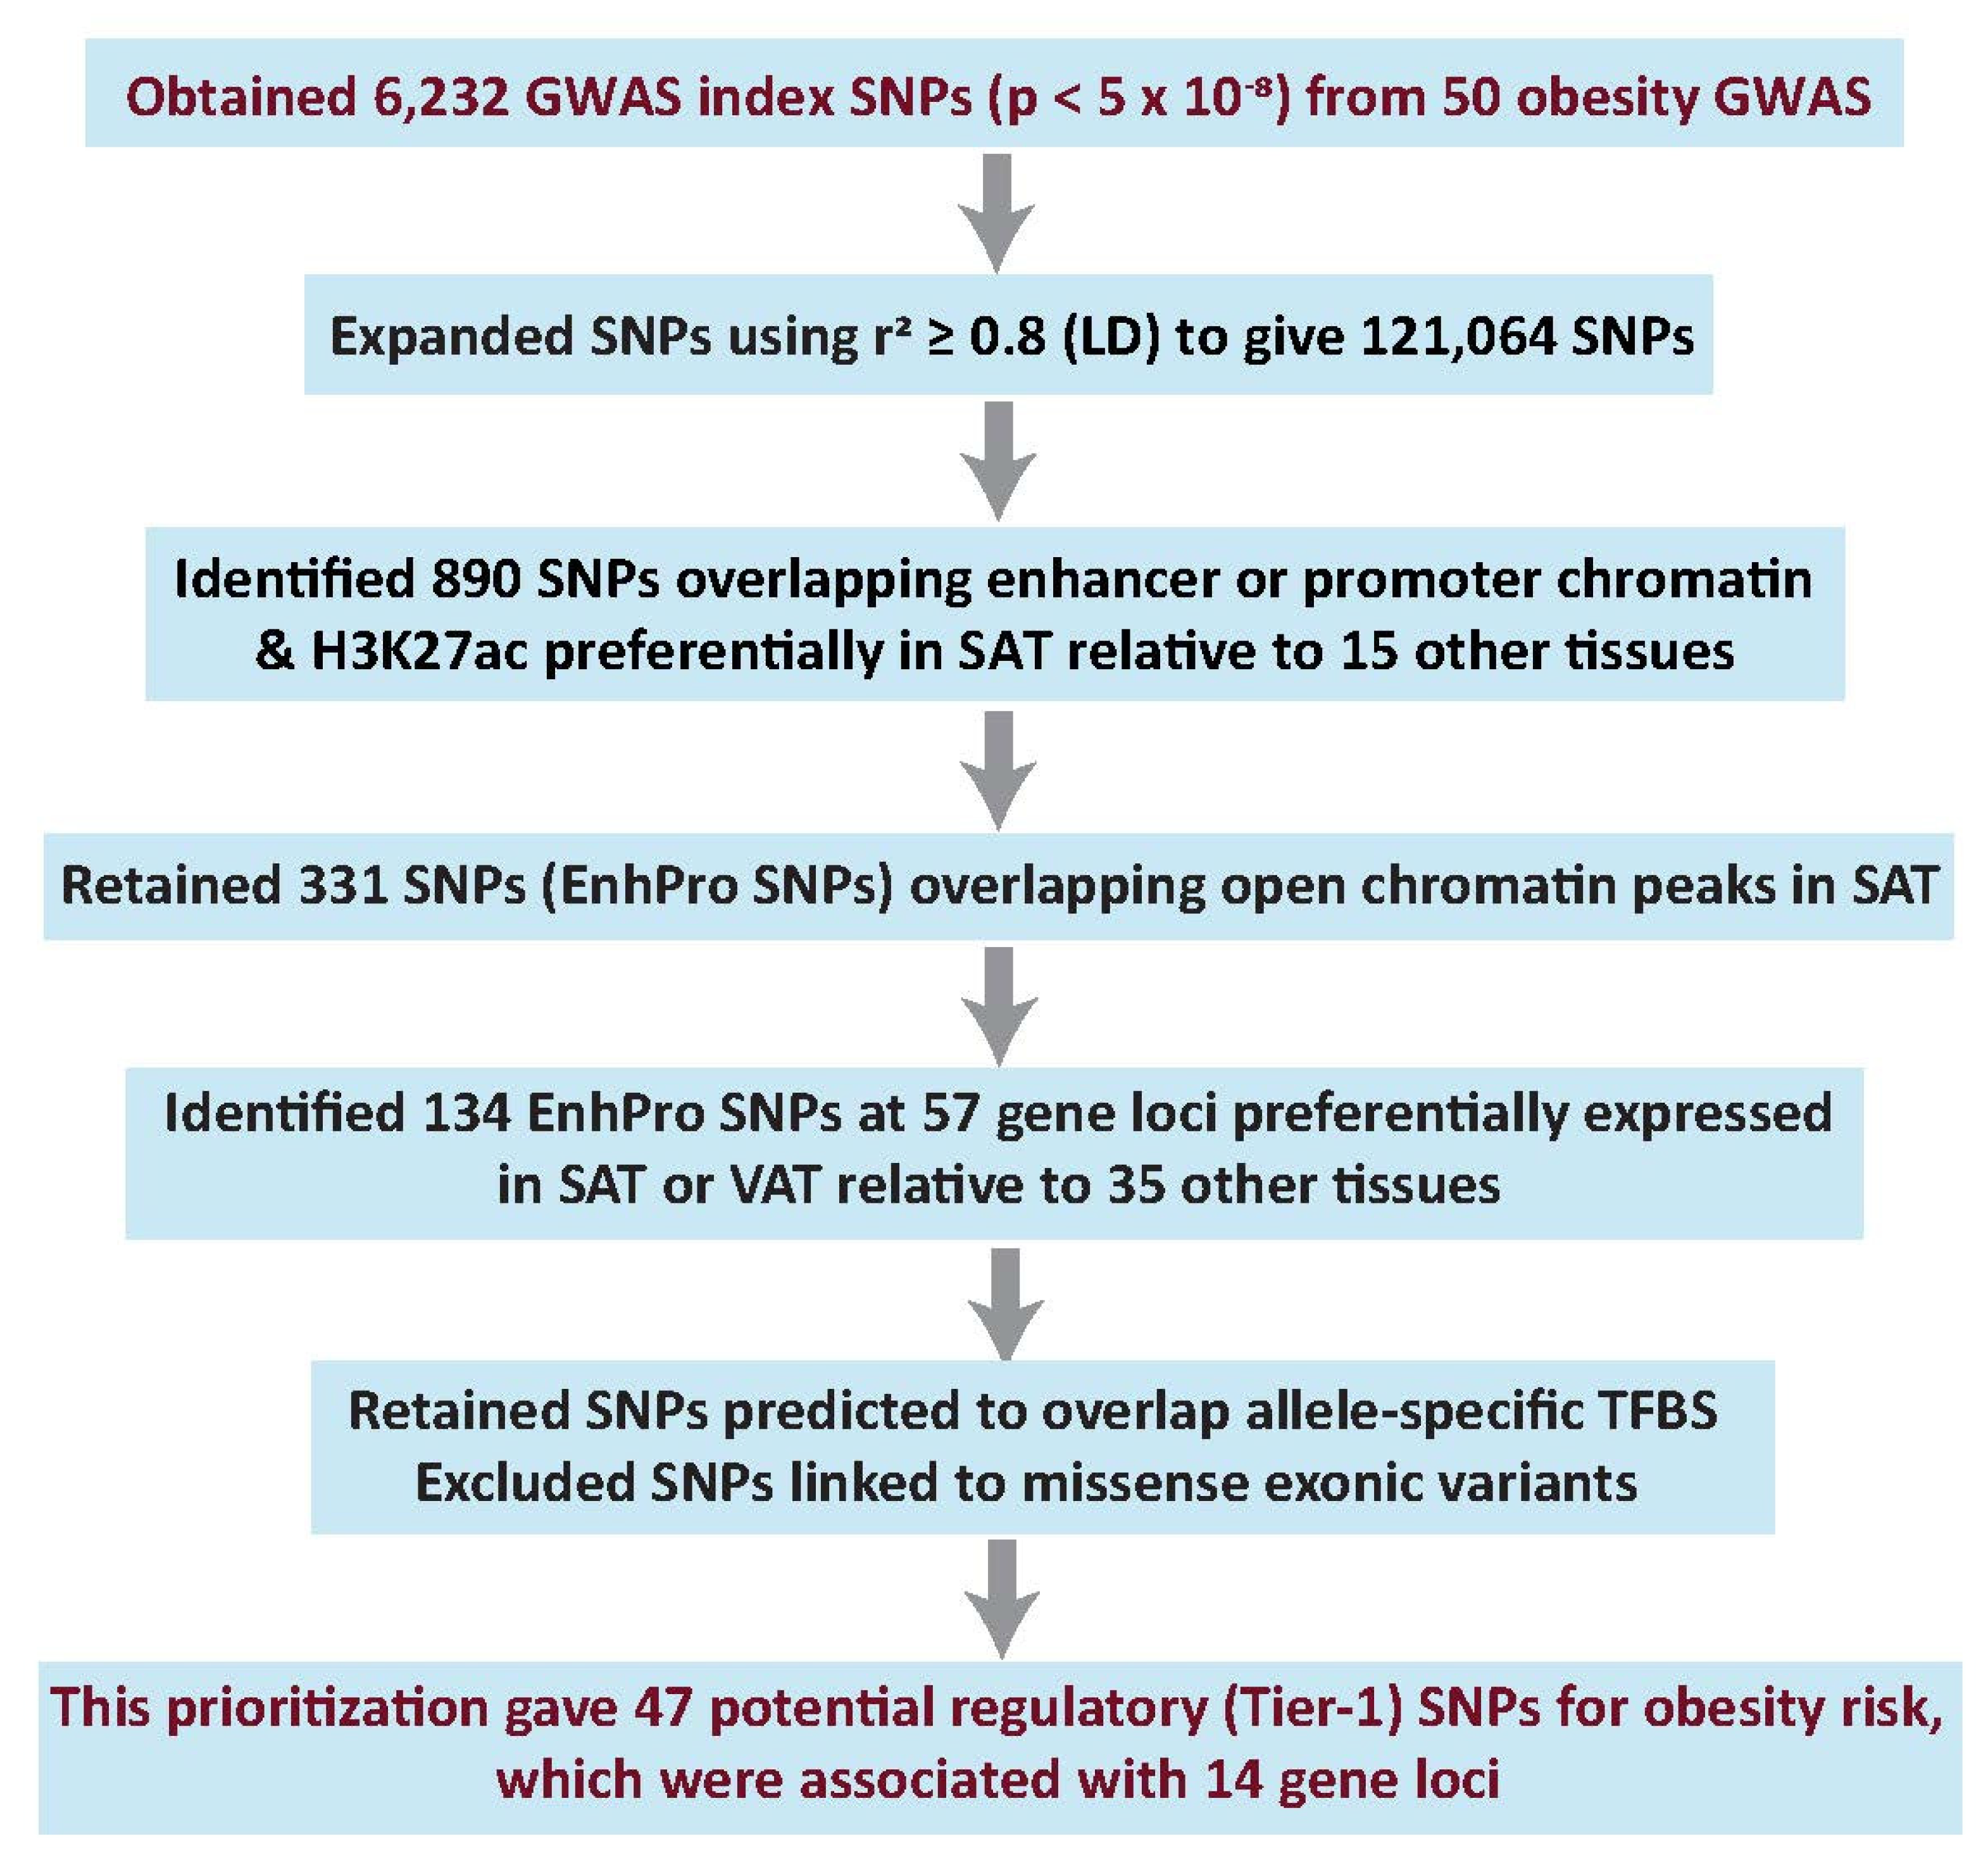
2.1. Candidate Regulatory SNPs (Tier-1 SNPs) for Obesity Risk Were Prioritized from 50 Obesity-Related GWAS

To identify highly credible candidates for causative regulatory variants from obesity-related GWAS, index SNPs from 50 studies of BMI, WHRadjBMI, WCadjBMI, or HCadjBMI, (Supplementary Table S1) were expanded (LD r2 ≥ 0.8, European population, EUR), and the index or proxy SNPs (I/P SNPs) were prioritized using epigenomics, transcriptomics, and transcription factor binding site (TFBS) predictions (Figure 1). The prioritization depended on the assumptions that many of the regulatory SNPs affecting obesity risk should modulate transcription of genes preferentially expressed in adipose tissue, should directly overlap epigenetic regulatory features seen preferentially in adipose tissue, and should overlap a TFBS that is bound to its TF selectively by only one of the two alleles. We used SAT rather than VAT epigenomics because only SAT genome-wide epigenetic profiles are available for adipose tissue. However, analysis of the GTEx RNA-seq database [17] indicated that 87% of the 2245 genes preferentially expressed in VAT were also preferentially expressed in SAT (ratio of ≥2.0 for VAT or SAT TPM, transcripts per million, versus the median TPM of 35 heterologous tissues).
From the 121,064 I/P SNPs, 331 SNPs (called EnhPro SNPs) were found to overlap a peak of open chromatin in SAT and strong enhancer or strong promoter chromatin as well as a peak of active positive regulatory chromatin (histone H3 lysine-27 acetylation, H3K27ac) preferentially in SAT (in SAT and no more than four of 15 heterologous tissues; Supplementary Table S2). Overlap of a candidate regulatory SNP with a peak of open chromatin (DnaseI hypersensitive site, DHS) in a relevant tissue increases the likelihood that a TF binds to the SNP-containing oligonucleotide sequence in that tissue. Enhancer or promoter chromatin determinations were based upon enrichment of histone H3 K4 trimethylation (H3K4me3) and H3K27ac for promoter chromatin and of H3K4me1 and H3K27ac for enhancer chromatin (RoadMap Epigenome Project [8]). We identified the subset of 134 EnhPro SNPs at 57 gene loci that are preferentially expressed in SAT or VAT by examining RNA-seq profiles from poly (A)+ RNA (GTEx database [17]). This is an important consideration because a regulatory genetic variant is more likely to be genetically linked to the tissue-associated phenotype if the gene whose expression it modulates is preferentially expressed in a tissue associated with that trait. The definition used for preferential expression was that the ratio of SAT or VAT TPM to the median TPM of 35 heterologous tissues was >2.0 and the SAT or VAT TPM was >2.0. Forty-nine of these genes were preferentially expressed in SAT and 73% of them (36) were also preferentially expressed in VAT while eight genes were preferentially expressed in VAT but not SAT (Supplementary Table S3).
We subsequently selected those SNPs with strong predictions of overlap with allele-specific TFBS and without appreciable linkage (LD r2 < 0.2, EUR) to missense SNPs. Lastly, we verified SAT-preferential expression/epigenetics of the SNP-associated gene in the UCSC Genome Browser [18]. The resulting 47 SNPs are referred to as Tier-1 SNPs and were associated with 14 gene loci (Supplementary Table S4).
We retained 7 of these 14 gene loci for further study, which were linked to 18 Tier-1 SNPs, including three that were obtained by imputation (Table 1). Most of the TFs predicted to bind to these 18 Tier-1 SNPs with allele-specificity have some known adipose-related functionality (Supplementary Table S5). Seven of the 14 genes were excluded from this study because they were previously examined for GWAS regulatory SNPs (TBX15 [19]) or because they formed a distinct functional group (extracellular matrix-related genes COL4A2, EFEMP1, FBN1, NID2, and ABLIM3). In addition, a HOXC gene subcluster which had nine Tier-1 SNPs in the regions of MIR196A2, HOXC9, HOXC4, HOXC5, and HOXC6 was also excluded. The HOXC4/C5/C6 intragenic Tier-1 SNPs are in moderate LD (r2 = 0.45–0.63) with the MIR196A2-overlapping SNP, rs11614913 (Supplementary Table S4). This SNP affects, in cis, the processing of pre-miR-196a2 [20] and was previously implicated in adipose biology [21,22]. The obesity association of the HOXC4/C5/C6 Tier-1 SNPs might be due to their linkage with rs11614913, as determined by conditional and joint analysis (COJO [23,24] (Supplementary Table S6)).

2.2. Limited Power in Finding Best Candidate Regulatory SNPs with Several Commonly Used Statistical Methods

As alternatives to our comparative epigenomic/transcriptomic analysis for obesity SNP prioritization (Figure 1), we tried several popular statistical methods using the largest available obesity GWAS summary data [25], some epigenetic data for SAT [8], and/or SAT eQTLs [17]. First, to identify SNPs and genes with potential causal effects on obesity risk, we used the summary data-based Mendelian randomization with heterogeneity in dependent instruments test (SMR and HEIDI [9]) to prioritize SNPs that have statistically significant potential to affect both the transcript level of a gene and obesity based upon data for SAT eQTLs at a locus [17] and obesity GWAS data. The resulting 58 SNPs that were associated with 65 genes contained no SAT EnhPro SNPs, and only nine genes, including FAM13A, showed preferential expression in SAT (Supplementary Table S7). Only 10 of these 58 SNPs overlapped a narrow peak of DNaseI hypersensitivity in SAT and only 30 were in a DNaseI hypersensitive region in any of 53 examined tissues or cell types. Expansion of the 58 SNPs using LD r2 ≥ 0.80 (EUR) yielded 5395 SNPs. Only three of these 5395 SNPs (FAM13A SNPs rs11097198, rs13133548, and rs2869949; Table 1 and Supplementary Table S4) were Tier-1 SNPs. In contrast, 30 Tier-1 SNPs were derived by our epigenomic/transcriptomic scheme from Pulit et al. GWAS summary data [25].
We also performed colocalization analysis (eCAVIAR [26]) to look for potential causal variants at a given locus that could be causal in both GWAS and eQTL studies among the seven studied gene regions (Table 1). None of our EnhPro/Tier-1 SNPs nor any new credible regulatory SNPs were prioritized by colocalization analysis (Supplementary Table S8). In addition, we conducted fine-mapping analysis (Probabilistic Annotation INtegraTOR, PAINTOR [16]) to prioritize potential causal SNPs from the neighborhoods of the above-mentioned seven genes. The fine-mapping analysis of WHRadjBMI that included SAT epigenetic parameters prioritized only two of 18 Tier-1 SNPs (FAM13A rs13133548, posterior probability, PP = 1, and ZBED3-AS1 rs9293708, PP = 0.8; Supplementary Table S9). Of the other 55 SNPs prioritized by this fine-mapping analysis (PP ≥ 0.6), only four overlapped enhancer or promoter chromatin and a peak of DNaseI hypersensitivity in SAT (FAM13A: rs4544678, rs3775380; HOXA11: rs17471520: and PEMT: rs8070128). Importantly, four of the seven gene loci had at least one fine-mapping prioritized SNP which was in moderate to high LD (r2 > 0.4) with a Tier-1 SNP (Table 1 and Supplementary Table S9). Although regulatory SNPs can modulate obesity through tissues other than SAT, Tier-1 SNP rs7732130, which as described below was implicated in T2D risk in pancreas by detailed experimental analysis [27,28], was not prioritized by any of the analytical methods that we used (Supplementary Tables S7–S9).
Because the protocol used in the present study to obtain Tier-1 SNPs (Figure 1) was not meant to be all-inclusive, but rather to give some highly credible risk alleles, we tried to expand it. The last criterion for being a Tier-1 SNP, overlap of a stringently predicted allele-specific TFBS, is limited in power. Five EnhPro SNPs associated with two of the seven genes in Table 1, FAM13A and RP11-392O17.1, did not meet this last criterion. We utilized COJO analysis [23,24] to look for secondary association signals for the Tier-1 SNPs at neighboring FAM13A and RP11-392O17.1. This analysis revealed three FAM13A-associated EnhPro SNPs (i.e., rs17014602, rs4544678, and rs3775378) that might still be credible obesity risk-associated variants. The p-value for the FAM13A Tier-1 SNP rs13133548 increased after conditioning on these three EnhPro SNPs (Supplementary Table S6). Therefore, our protocol could be extended in the future to include COJO analysis of EnhPro SNPs that did not have predictions of overlapping allele-specific TFBS.

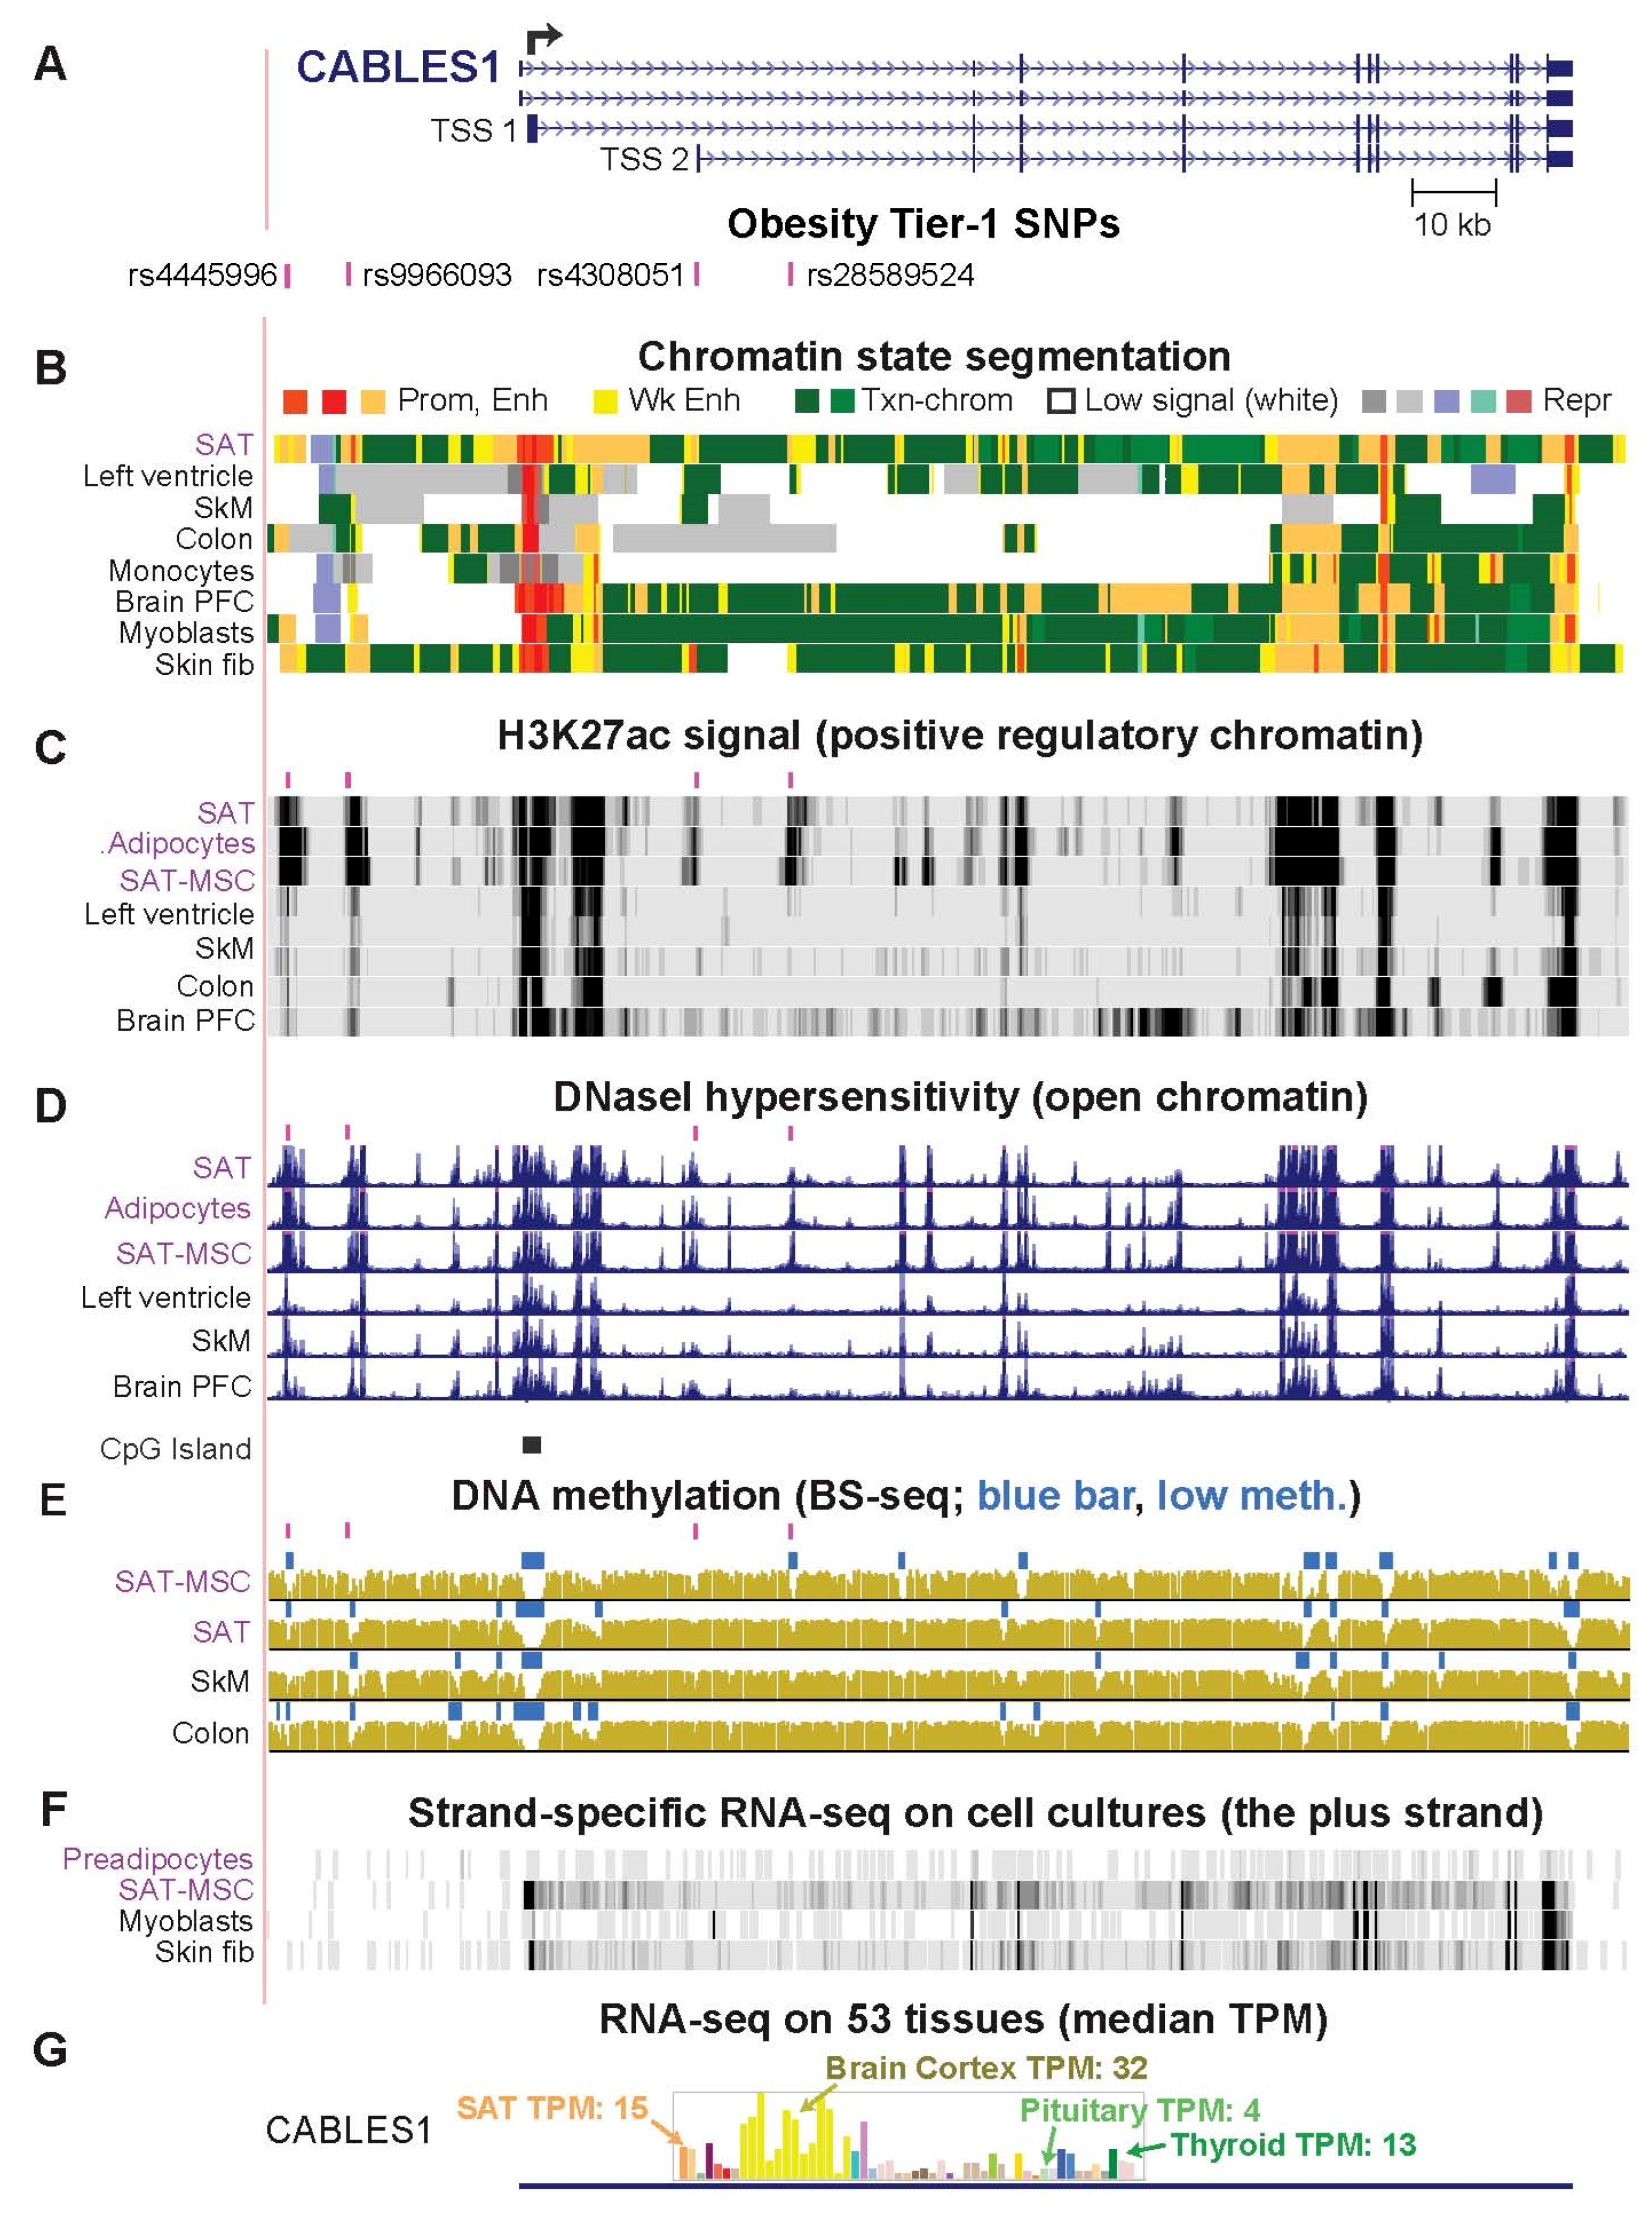
2.3. CABLES1, PEMT, and PC Genes Are Associated with Obesity Tier-1 SNPs That May Regulate Alternate Usage of Transcription Start Sites

One or more of the Tier-1 SNPs associated with the genes encoding Cdk5 and ABL1 Enzyme Substrate 1 (CABLES1), Phosphatidylethanolamine N-Methyltransferase (PEMT), and Pyruvate Carboxylase (PC) were located within 0.7 kb of an alternative transcription start site (TSS; Figure 2A and Supplementary Figures S1–S5). CABLES1, PEMT, and PC are the only genes in their 1-Mb neighborhoods that exhibit preferential expression in SAT (Figure 2 and Supplementary Table S10). However, expression of these genes is not specific for adipose tissue, and correspondingly, they have non-adipose tissue-specific functions and generalized functions as well as adipose-related functions [29]. Although CABLES1 is involved in the regulation of proliferation of pituitary gland cells [30], its expression in SAT or VAT is about 3 times that in the pituitary gland (Supplementary Table S10).
There were tissue-specific differences in the usage of alternative TSS for CABLES1, PEMT, and PC, including in SAT versus some other tissues (Supplementary Figures S2, S4 and S5), which might be influenced by Tier-1 SNP-containing enhancer chromatin near one of the TSS. Enhancer chromatin, peaks of H3K27ac, and DNaseI hypersensitivity overlapped some of the Tier-1 SNPs for these genes not only preferentially in SAT but also in SAT-derived mesenchymal stem/stromal cells (SAT-MSC) or adipocytes derived from them in vitro [31] (Table 1, Figure 2B–D; Supplementary Figures S1, S3 and S5). DNA hypomethylated regions, a frequent hallmark of cis-acting positive transcription-regulatory elements, overlapped several of CABLES1 Tier-1 SNPs specifically in SAT-MSC, adipocytes, brain neurons, and the nonneuronal cell fraction of brain (Figure 2E and Supplementary Figure S1). The brain cell-specific DNA hypomethylation is likely to reflect specific roles for CABLES1 in the brain [32] and might be related to differences in TSS usage in brain versus adipose (Supplementary Figure S2). The Tier-1 SNP-containing enhancer chromatin of CABLES1, PEMT, and PC may regulate overall transcription as well as TSS usage. This is illustrated by melanocytes, which had very high overall levels of expression of CABLES1, extensive enhancer chromatin and H3K27ac around TSS 2, and much transcription initiation from TSS 2 as well as TSS 1 (Supplementary Figures S1 and S2B, data not shown).
The tissue-specific TSS usage for CABLES1 and PEMT results in very different sized polypeptides (Supplementary Figures S2B and S4C). However, despite the tissue-specificity for alternate TSS usage for PC (ENSG00000173599; Supplementary Figure S5F), there is no effect of TSS choice on the encoded polypeptide because the open reading frame (ORF) starts far downstream of all TSS. In addition to the annotated TSS 2, we found a novel, cell type-specific TSS (TSS 3) that is even closer to Tier-1 SNP rs17147932 (0.7 versus 2.5 kb upstream; Supplementary Figure S6). Only transcription initiation from TSS 1 allows a PC-intragenic MIR3163 gene to be included in the primary transcript (Supplementary Figure S5A). The mature miR-3163 has many documented effects on cell biology partly through modulation of Wnt signaling [33]. SAT and liver share promoter/enhancer chromatin, a H3K27ac peak, and a DHS overlapping rs17147932 at PC (Supplementary Figure S6). The frequency of TSS usage might be modulated by this Tier-1 SNP in the liver, which has the highest expression of PC, and in adipose, which has the second highest expression level. Supporting a role of TSS 2 in both the adipose and liver lineages, a binding site in adipocytes was found at the core promoter region of TSS 2 for the adipogenesis-associated TF PPARG [34] and in liver and HepG2 cells at the core promoter regions of TSS 2 and TSS 3 for many transcription initiation-associated proteins (TF ChIP-seq; Supplementary Figure S6).

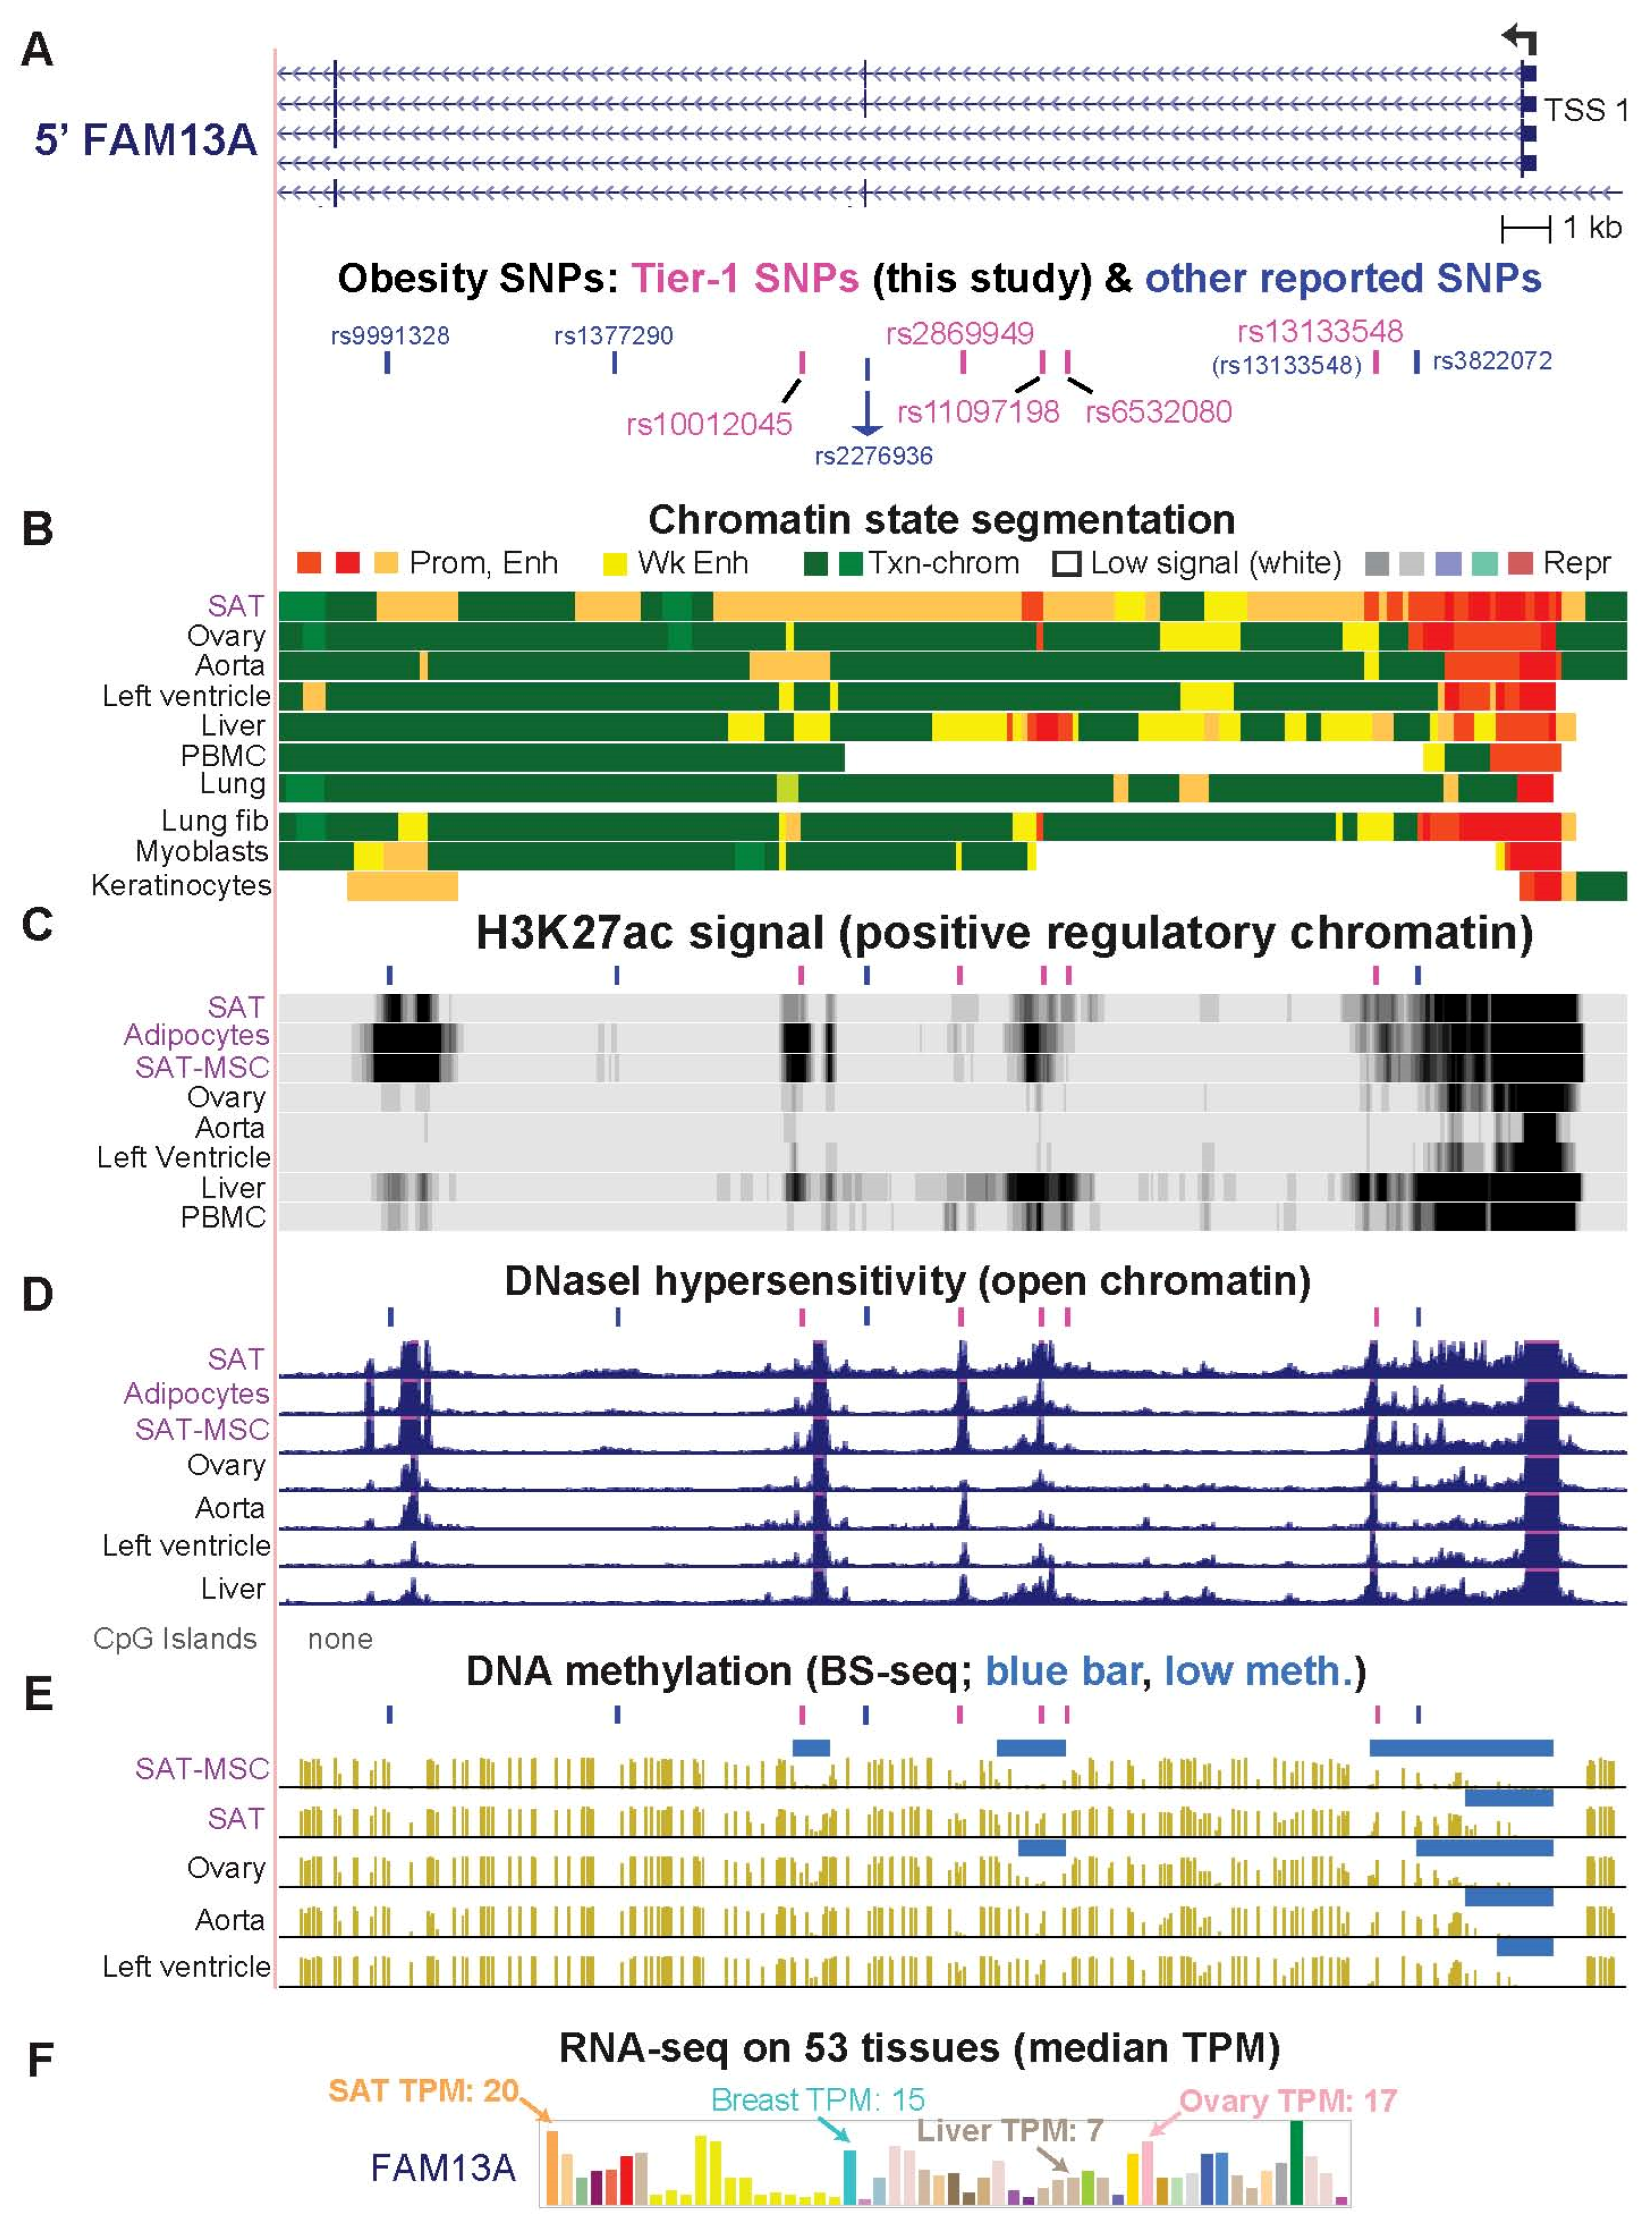
2.4. Only One of the Previously Prioritized FAM13A Obesity-Related Regulatory SNP Candidates Is among the Six Tier-1 FAM13A SNPs

FAM13A (Family with Sequence Similarity 13 Member A) was associated with six Tier-1 SNPs (Figure 3A, Table 1), four of which were found to be eQTLs in SAT (Supplementary Table S11). This gene is implicated in modulating diet-induced obesity, regulating insulin signaling in adipocytes, participating in Wnt signaling, and affecting the risk of certain lung diseases [3,35,36]. We evaluated five previously reported candidate regulatory SNPs (Figure 3A, blue bars and blue font). One, rs2276936, was highlighted by Lin et al. [37] as a likely regulatory SNP from massively parallel reporter assays (MPRA) on bronchial epithelial cells, GWAS data for body fat distribution and blood lipid levels, reporter gene experiments on HepG2 cells, and a CRISPR/Cas-9 mediated ~0.1-kb deletion around this SNP in HepG2 cells. We found that the 0.5-kb region centered around rs2276936 (Figure 3A, blue arrow) did not overlap a peak of DHS (open chromatin) or of H3K27ac in >15 types of cells or tissues, including SAT, liver, HepG2 cells, lung, and esophagus, although the SNP was embedded in a broad region of enhancer chromatin in SAT (Figure 3A–D). Therefore, rs2276936 does not meet the general expectation that a SNP whose allelic state modulates transcription is located at a TF-binding site within (and not just near) a peak of open chromatin and of H3K27ac in a biologically relevant cell type or tissue.
Of the four other previous regulatory candidate SNPs in this region [3,11,14], rs1377290 did not overlap a DHS peak or a H3K27ac peak in SAT and rs9991328 did not overlap a DHS peak in SAT or adipocytes (Figure 3A–D). Another of these previously reported SNPs, rs3822072, lacked specificity for its peak of H3K27ac (present in eight of 15 non-adipose tissues) and was missing a predicted overlapping allele-specific TFBS. The fourth SNP, rs13133548 [15], met all the criteria for a Tier-1 SNP. These five previously described regulatory candidate SNPs are in high or perfect LD (r2 = 0.78–1.00, EUR) with our four novel Tier-1 SNPs in introns 1 or 2 of the short isoforms of FAM13A (Table 1). The last novel Tier-1 SNP, rs7660000, is ~7 kb upstream of TSS 1 in intron 7 of the long FAM13A isoform initiated at TSS 2 and located 235 kb upstream of TSS 1 (Supplementary Figure S7). Only the long FAM13A protein isoform (Supplementary Figure S7) contains a signaling-associated RhoGAP domain [38]. More transcript is made from FAM13A TSS 1 than TSS 2 in SAT, SAT-MSC, and preadipocytes as well as most, but not all cell types (Supplementary Figure S7). Tier-1 SNPs for FAM13A might contribute to different frequencies of use of TSS 1 and TSS 2 as well as tissue-specific differences in expression levels of this gene (Figure 3F).

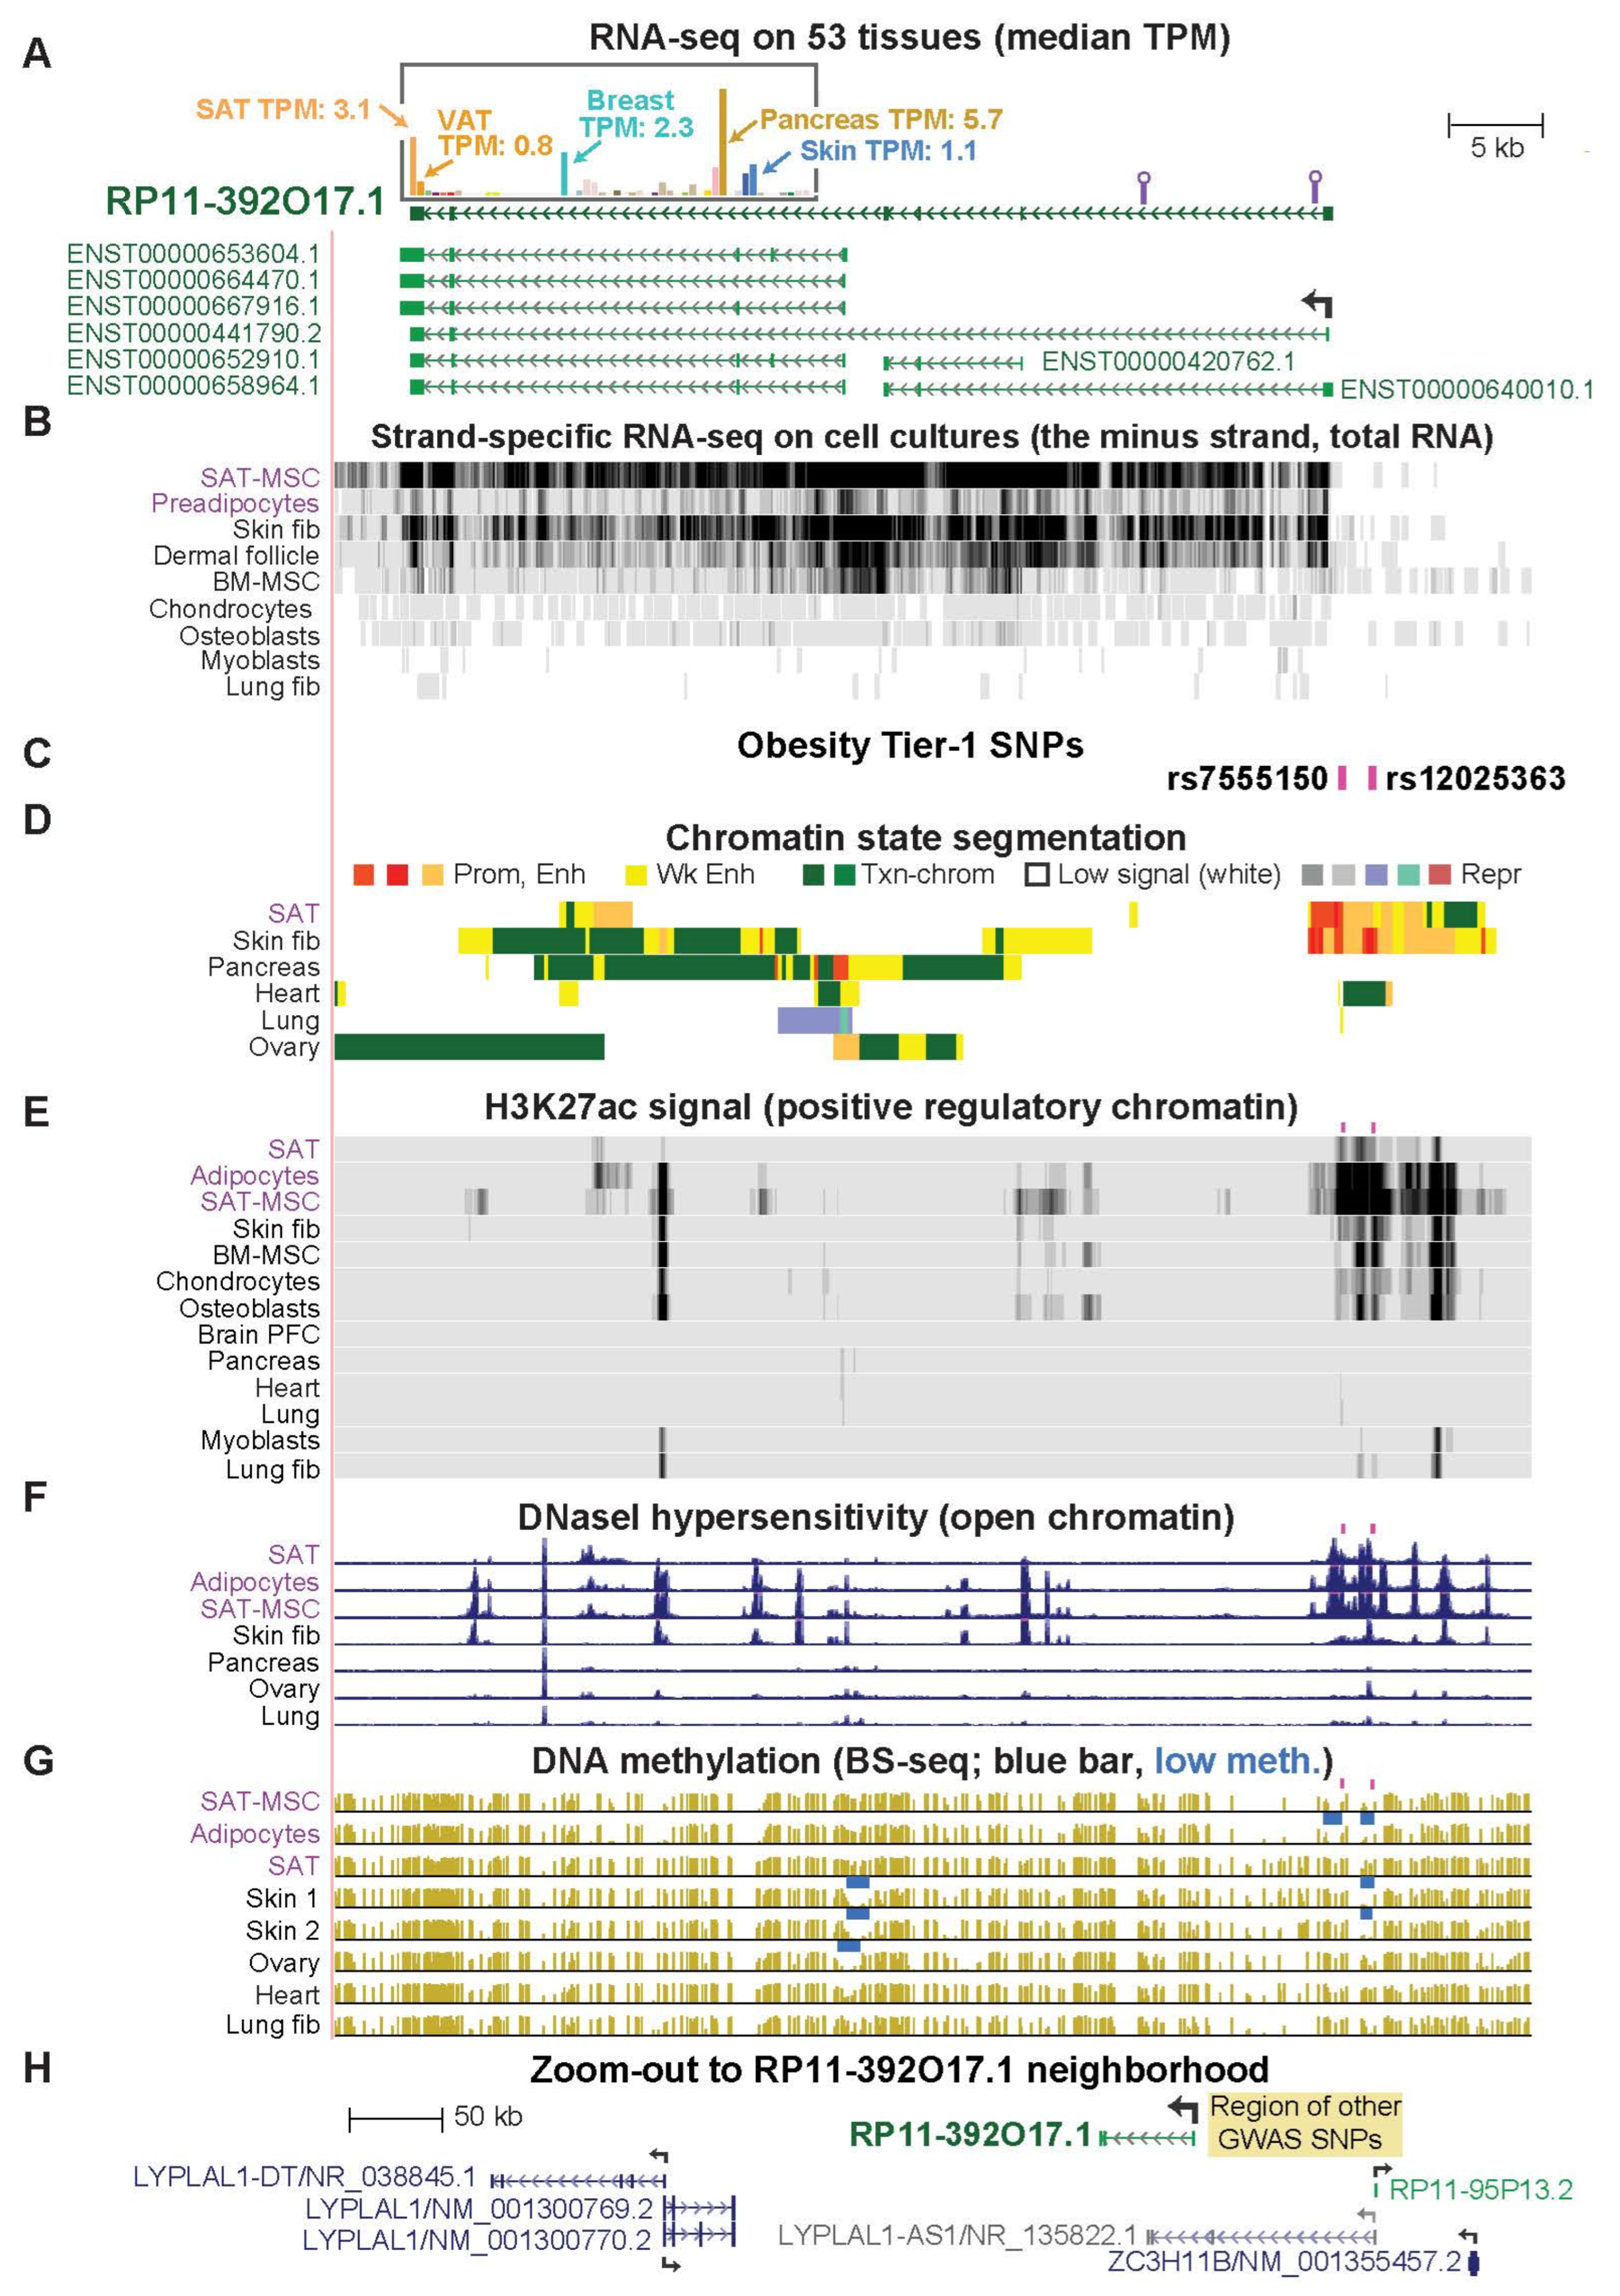
2.5. RP11-392O17.1, an Often-Overlooked SAT-Specific lncRNA Gene, Has Novel Tier-1 SNPs

Of the 14 gene loci associated with Tier-1 SNPs, only RP11-392O17.1, HOXA11, MIR196A2/HOXC4,5,6,9, and TBX15 displayed a strong bias for expression [17] in SAT versus VAT as well as for SAT versus non-adipose tissues (Figure 4A, Supplementary Table S3). As described above, we did not further examine the HOXC and TBX15 loci in this study. For HOXA11, a single Tier-1 SNP in the 3′ untranslated region (3′-UTR) near both HOXA11-AS1 and HOXA10 was identified (Supplementary Figure S8). Because it overlaps enhancer chromatin upstream of HOXA10, it may regulate HOXA10 expression. The 3′ location of this SNP raises the alternate possibility that it is involved in post-transcriptional control. In contrast, rs7555150 and rs12025363, the novel Tier-1 SNPs for RP11-392O17.1, are 0.6 or 2.3 kb upstream of the TSS in promoter or enhancer chromatin in SAT, which clearly suggests a possible transcription regulatory function. These SNPs are in perfect LD with each other and overlap SAT eQTLs for RP11-392O17.1 (Supplementary Table S11), as reported previously for other nearby SNPs [39]. The RP11-392O17.1 Tier-1 SNPs display a much stronger association with female rather than male obesity [13], and gender bias was also found for FAM13A, PEMT, and ZBED3-AS1 Tier-1 SNPs (Supplementary Table S4).
RP11-392O17.1 is a little-studied lncRNA gene, which has recently been implicated in adipogenesis [40]. The 3-Mb region surrounding this gene has no coding gene with preferential transcription in SAT versus VAT like that of RP11-392O17.1 (Supplementary Table S10). However, the very small and very weakly expressed lncRNA gene RP11-95P13.2 (SAT TPM, 0.5) 98 kb upstream of RP11-392O17.1 does show preferential expression in SAT. RP11-392O17.1 has not yet been designated a RefSeq gene although it is in the Ensembl gene database (ENSG00000228536) and displays highly cell type-specific expression in SAT-MSC, SAT, and adult skin fibroblasts (Figure 4B and Supplementary Figures S9 and S10A). This gene had transcription-promoting epigenetic marks specifically in SAT, adipocytes, and SAT-MSC in the region of its Tier-1 SNPs, rs7555150, and rs12025363 (Figure 4C–G). Moreover, 13-bp downstream of its TSS, there is a binding site in adipose stem cells for PPARG, the adipose-associated TF (Unibind database [18,41]).
In eight GWAS related to obesity ([42,43] and Supplementary Figure S9 legend), many candidate regulatory SNPs located 11–120 kb upstream of RP11-392O17.1 were associated with LYPLAL1 (Lysophospholipase-like 1) and overlapped the RefSeq gene structure LYPLAL1-AS1/NR_135822.1 (Figure 4H, tan rectangle). The name LYPLAL1-AS1 is sometimes used in the literature to denote RP11-392O17.1 or LYPLAL1-DT, a lncRNA gene upstream of LYPLAL1 (Figure 4H and Supplementary Figure S9) (for example, [40]). There is no evidence for transcription of LYPLAL1-AS1/NR_135822.1 in any of >20 examined cell types from the UCSC Genome Browser (Supplementary Figures S9 and S10). LYPLAL1 is broadly expressed and located 0.2 Mb further from these SNPs than is its closest downstream gene, RP11-392O17.1 (Figure 4H). Chromatin state segmentation tracks show the absence of promoter chromatin at the 5′ end of the LYPLAL1-AS1/NR_135822.1 in tissues and cell cultures (Supplementary Figure S10B) unlike its presence at the 5′ end of RP11-392O17.1 in SAT and adult skin fibroblasts (Figure 4D). Importantly, these previously identified obesity GWAS SNPs that other investigators associated with LYPLAL1 (Supplementary Figure S9) exhibit moderate LD (r2 = 0.35 to 0.68, EUR) with Tier-1 SNPs in the promoter region of RP11-392O17.1. Therefore, they may have been detected in obesity GWAS only because of their LD with RP11-392O17.1 promoter-region Tier-1 SNPs.
We tried to test for allele-specific expression of RP11-392O17.1 in a SAT-MSC cell strain that we identified as heterozygous for both Tier-1 SNPs. Using RT-PCR on total RNA, we amplified two small regions of cDNA not far from the 5′ end of the gene (Figure 4A, lollipops) that contained SNPs in high LD with our Tier-1 SNPs. Sanger DNA sequencing of the PCR products (Supplementary Figure S11) from the cDNA and from the analogous genomic DNA revealed amplified background sequences that interfered with quantification of the relative expression of the alleles. We were only able to verify transcription of the examined 5′ portions of the gene in SAT-MSC from both alleles, unlike the finding on adipose tissue from reanalysis of RNA-seq data [44].

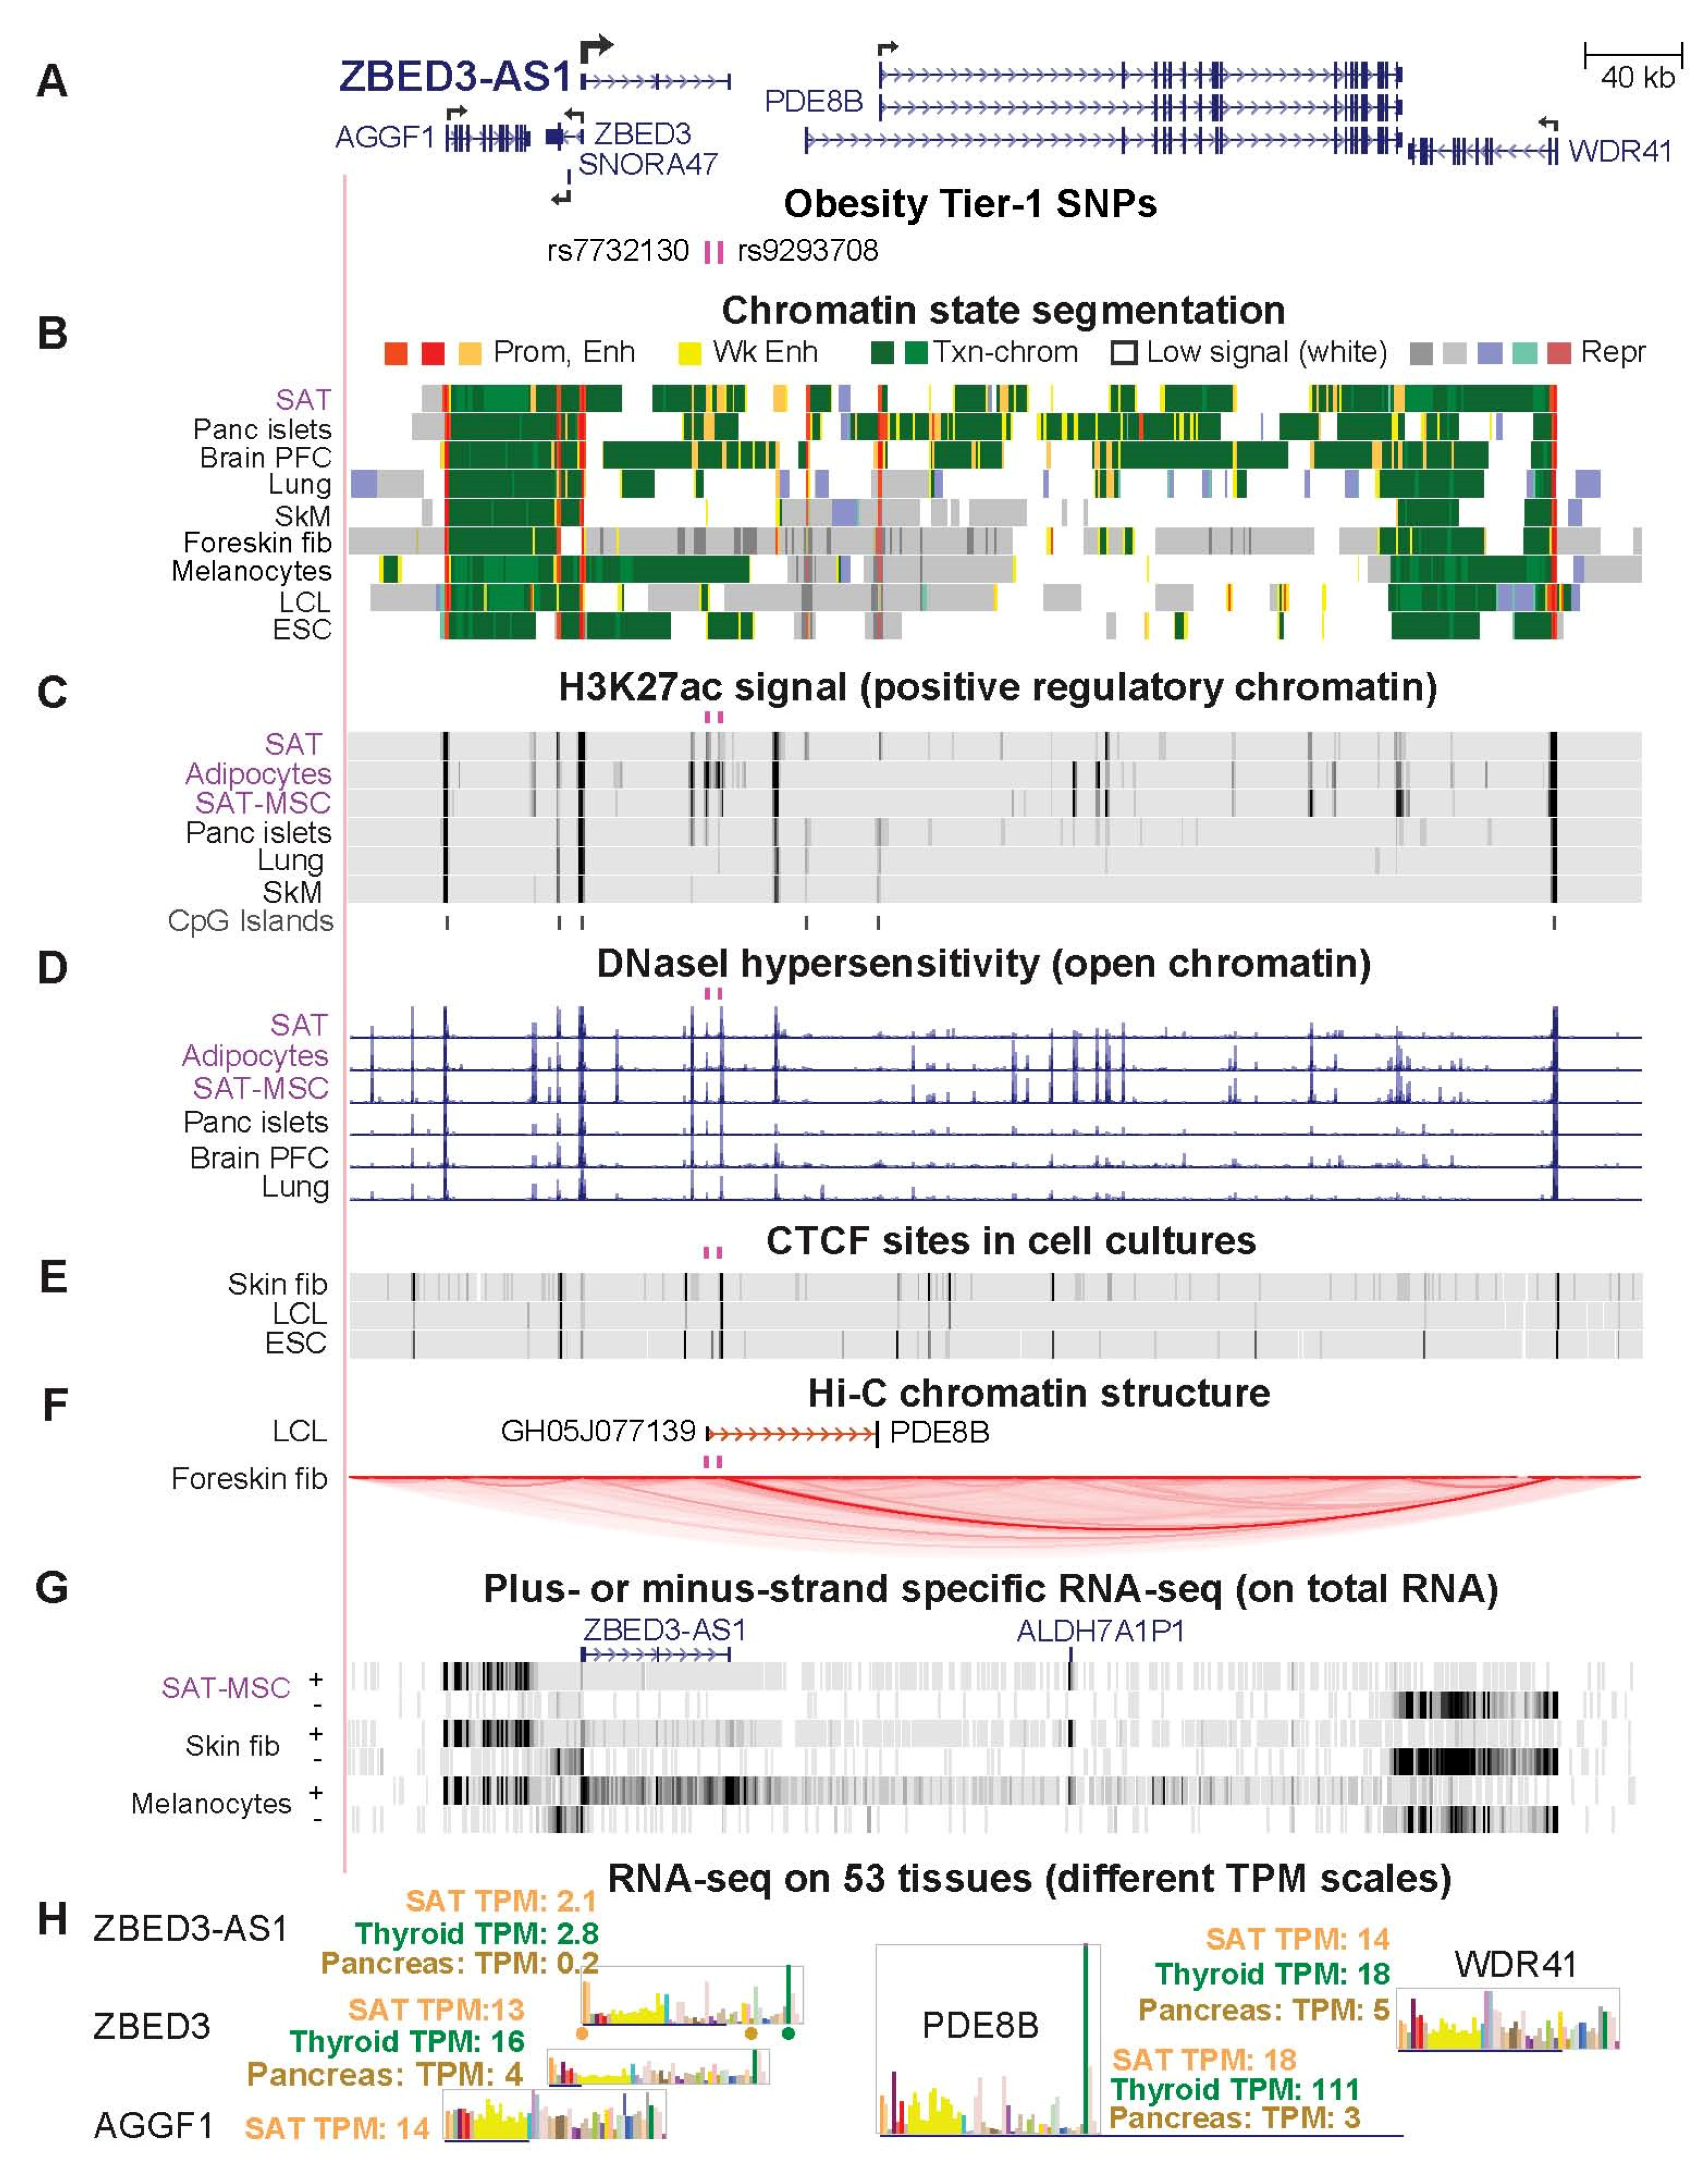
2.6. Two Obesity Tier-1 SNPs Located in ZBED3-AS1 Might Help Control Expression in SAT of Several Genes

We identified Tier-1 SNPs rs7732130 and rs9293708 in the 3′ end of the lncRNA gene ZBED3-AS1 (Figure 5A). ZBED3-AS1 might influence expression in SAT of several genes in its 1-Mb neighborhood, including ZBED3, which encodes Zinc Finger BED Domain-Containing Protein 3 and is oriented head-to-head to ZBED3-AS1 with a 0.5 kb overlap. ZBED3 and ZBED3-AS1 have been implicated in adipogenesis [45]. The ZBED3-AS1 Tier-1 SNPs are in low LD with each other (r2 = 0.2, EUR) and reside 5 kb apart in separate enhancer chromatin segments and DNase hypersensitivity peaks in SAT (Figure 5B–D). One of them, rs9293708, is located 0.6 kb from a binding site for CTCF (CCCTC-binding factor), which can enable long-distance chromatin looping (Figure 5E,F). Despite ZBED3-AS1 and ZBED3 sharing a bidirectional promoter, there is appreciable ZBED3-AS1 RNA in only one of 19 examined cell strains (melanocytes) in contrast to the broad expression of ZBED3 in cell cultures (Figure 5G and Supplementary Figure S12). Among tissues, ZBED3-AS1 and ZBED3 were preferentially expressed in thyroid, SAT, and VAT, as were ZBED3-AS1 neighbors PDE8B (encoding Phosphodiesterase 8B) and CRHBP (encoding Corticotropin Releasing Hormone-Binding Protein; Figure 5H and Supplementary Table S10 for CRHBP). The latter two genes are relevant to obesity. PDE8B is involved in insulin signaling in the pancreas and is implicated in controlling lipolysis and the ratio of VAT/total adipose tissue [12,46]. Overexpression of CRHBP can affect weight gain in mice [47]. ZBED3-AS1 was selectively transcribed in vivo in adipocytes as well as in SAT, as seen in a single-nucleus RNA-seq analysis of tissues [48] (Supplementary Figure S13).
In pancreatic islets, Miguel–Escalada et al. [28] found that a 0.9-kb enhancer chromatin region containing Tier-1 SNP rs7732130 interacts with and upregulates transcription from promoters of ZBED3-AS1 and the neighboring PDE8B, ZBED3, ZBED3-AS1, SNORA47, and WDR41 genes. The ratio of expression of ZBED3-AS1 in SAT or VAT versus the median of 35 dissimilar tissues is 4. In contrast, the analogous ratio for pancreas is only 0.5 (Supplementary Table S10); however, expression levels may be higher in pancreatic islets for which comparable RNA-seq data are not available. Another distinction between SAT and pancreatic islets is that pancreatic islets lacked the enhancer chromatin in which the second Tier-1 SNP rs9293708 is embedded, although both tissues had enhancer chromatin overlaying rs7732130 (Figure 5A–C; Supplementary Figure S12).
Chromatin interaction data for this region were not available for adipocytes. However, mapping of long-range chromatin interactions for a lymphoblast cell line (LCL, GM12878) and foreskin fibroblasts [49,50] suggests that regions near both ZBED3-AS1 SNPs are involved in such interactions and may be at the boundaries of topologically associating domains (TADs). In GM12878, there was evidence for an interaction between an ~60-bp subregion 0.1 kb from rs7732130, which exhibited weak enhancer chromatin, and a repressed promoter of PDE8B ~70 kb downstream (promoter capture Hi-C profile, Figure 5F). Foreskin fibroblasts displayed a strong and cell type-specific TAD that extended from a constitutive CTCF-binding site 0.5 kb away from rs9293708 in repressed chromatin to another constitutive CTCF binding site in the active WDR41 promoter 342 kb away (Figure 5B,E,F and Supplementary Figure S14). The TAD was seen in Micro-C chromatin interaction profiles, a modified type of Hi-C [50] that is not restricted to interactions using promoter regions as bait. The role of this TAD in foreskin fibroblasts is not clear but the TAD might be needed to insulate the several PDE8B promoters from enhancer chromatin seen in skin fibroblasts more than 0.3 Mb upstream (data not shown). Although some of the effects on obesity risk of genes in this neighborhood are probably attributable to pancreas and the thyroid gland (for which epigenome profiles were not available), epigenomics and transcriptomics suggests that the two ZBED3-AS1 Tier-1 SNPs act through adipose tissue to moderate inherited obesity risk.

3. Discussion

We prioritized 47 candidates for obesity-risk regulatory SNPs (Tier-1 SNPs) using a detailed approach involving comparisons of epigenomics and transcriptomics in adipose tissue versus non-adipose tissues. Of the 18 SNPs that were studied in detail, all but two (rs13133548 and rs7732130 [15,28]) had not been previously reported as possible regulatory SNPs. We showed that identifying credible candidates for obesity-risk regulatory SNPs using their SAT epigenetics (because VAT epigenomic databases were not available) and the expression in SAT and VAT of their associated genes usually prioritized genes preferentially expressed in VAT as well as in SAT. Thus, these candidates for regulatory SNPs are likely to be relevant to obesity-related disease susceptibility, which is more commonly associated with VAT [3].
Specific roles in adipose biology have been inferred for the seven gene loci studied in detail (Table 1) [3,5,29,40,45,51,52,53,54,55,56,57]. Remarkably, four of these genes, CABLES1, PEMT, PC, and FAM13A, had one or more of their Tier-1 SNPs near an alternate tissue-specific TSS. The choice of alternative well-separated TSS for in vivo transcription of these genes is consequential because it affects either the encoded protein structure (CABLES1, PEMT, and FAM13A) or the expression of a miRNA gene in an isoform-specific intron (PC; Supplementary Figures S2, S4 and S5). Therefore, Tier-1 SNPs for these genes could be involved in modulating the structure of the resulting transcript and not just its quantity in SAT and, thereby, affecting inherited obesity risk.
The Tier-1 SNPs at CABLES1, FAM13A, PC, PEMT, ZBED3-AS1, and RP11-392O17.1 are highly plausible candidates for modulating transcription (Figure 6). The genes associated with these SNPs are involved in cell signaling, metabolism, and/or post-transcriptional regulation in ways that could modulate adipose tissue formation or physiology. CABLES1 encodes a growth suppressor protein that acts as a signaling hub for cell growth [58]. It plays a central role in regulating the cell cycle, cell proliferation, and cancer [59]. Although it has not been previously directly linked to obesity, some of its regulatory interactions are very likely to impact obesity [52,60]. For example, CABLES1 affects CDK5 phosphorylation, which, in turn, controls phosphorylation of the critical adipose-related TF PPARG [51]. FAM13A protein is also implicated in diverse types of signaling [61], including adipocyte insulin signaling [36] and Wnt/beta-catenin signaling, which is crucial for normal development and homeostasis of adipose tissue and other lineages [62,63]. Knockdown of FAM13A during in vitro adipogenesis increases expression of several adipocyte markers [11,14], while in vitro overexpression leads to preadipocyte apoptosis [64]. In one study [64], mice with double-knockout of FAM13A had a slight increase in SAT, which was dependent on their being fed a high-fat diet. Similarly, in another study [11], male FAM13A double-knock out mice had a significant increase in body weight but only when maintained on a high-fat diet [11].
Tier-1 SNP-associated lncRNA genes RP11-392O17.1 and ZBED3-AS1 have recently been implicated in adipose biology through interaction with specific proteins or RNAs. In SAT-MSC cells differentiating in vitro to adipocytes, overexpression of part of RP11-392O17.1 (called LYPLAL1-AS1 despite the lack of evidence for expression of an overlapping LYPLAL1-AS1 gene structure; Supplementary Figure S10) increased expression of adipogenesis markers and fat droplet deposition [40]. This finding was partially attributed to the stabilization of desmoplakin, a desmosome protein, and inhibition of Wnt signaling. The prominence of the active chromatin profiles of RP11-392O17.1 in SAT-MSC and adipocytes is consistent with expression of this gene playing a role in adipocyte progenitor differentiation as well as in adipocyte function (Figure 4). Nonetheless, in 13 obesity-related GWAS (Supplementary Figure S9), many candidate risk SNPs upstream of RP11-392O17.1 were assigned to LYPLAL1 rather than to the much closer RP11-392O17.1 (Figure 4H). However, LYPLAL1 displays no preferential expression in any obesity-relevant tissue, unlike RP11-392O17.1. On the basis of eQTLs and limited transcription data, in two previous studies, it was proposed that a few obesity GWAS-derived SNPs that were ascribed to LYPLAL1 may actually be associated with RP11-391O17.1 [13,39]. Here, extensive transcription, epigenetic, and genetic data support such reassignment from LYPLAL1 to RP11-392O17.1 0.2 Mb downstream from it, and the conclusion that the previously described SNPs in the RP11-392O17.1-upstream intergenic region are proxies for regulatory SNPs in the promoter region of this lncRNA gene.
ZBED3-AS1, which contains two intragenic Tier-1 SNPs, rs7732130 and rs9293708 (Figure 5), encodes an RNA that acted as a competitive endogenous RNA (ceRNA, sponge RNA) for miR-513a-5p and miR-381-3p [65]. These miRNAs are implicated in nonalcoholic fatty liver disease [66] or gene dysregulation in VAT in morbidly obese individuals [67]. ZBED3-AS1 displays increases in its steady-state RNA levels during in vitro adipogenesis, and levels of this RNA correlate with expression of adipogenesis markers in liposuction samples [45]. Moreover, production of ZBED3-AS1 RNA was reported to be necessary for normal levels of expression of markers of adipogenesis during in vitro differentiation [45]. ZBED3-AS1 poses an interesting example of a gene with intragenic enhancers that may act in cis on nearby genes as well as on itself. The results of Xu et al. [45] suggest that ZBED3-AS1 also functions in trans in SAT-MSC.
Our finding that ZBED3-AS1 SNP rs7732130 is a Tier-1 SNP prior to reading a report by Miguel–Escalada et al. [28] experimentally validating this SNP’s regulatory function serves as an experimental validation of our scheme for regulatory SNP prioritization. In contrast, an online program for rating candidate regulatory SNPs (RegulomeDB [68]) gave this SNP only a modest probability score (0.38, ranging from 0 to 1, with 1 being most likely to be a regulatory variant). This is probably due to one or more of the following features of RegulomeDB. It does not use transcriptome data. It uses epigenetic data that is not tailored to the tissue of interest and relies on a less stringent and comprehensive tool for assigning allele-specific TFBS overlap (SNP2TFBS, [68]). In their study of T2D GWAS SNPs, Miguel–Escalada et al. [28] documented long-distance chromatin interactions in pancreatic islets between enhancer chromatin containing rs7732130 and promoters of neighboring genes. By epigenome editing they showed that these interactions do significantly potentiate transcription of ZBED3-AS1 gene neighbors as well as ZBED3-AS1 itself. Moreover, in reporter gene assays on pancreatic islet cells, a 0.9-kb region harboring this SNP gave allele-specific upregulation [27]. We found that rs7732130 and nearby rs9293708 are obesity GWAS-derived Tier-1 SNPs that overlap a DHS peak, a H3K27ac peak, and enhancer chromatin preferentially in SAT, and for rs7732130, also in pancreatic islets. Our analysis combined with the promoter capture Hi-C mapping and rs7732130-subregion epigenome editing of Miguel–Escalada et al. [28] and rs7732130 allele-specific enhancer transfection assays of Greenwald et al. [27] suggest that rs7732130 modulates obesity risk through adipose tissue as well as through pancreas. In contrast, we propose that rs9293708, which is located in a separate enhancer chromatin region specific to SAT (Figures 5B and S12B,C), does so only through adipose tissue. Given the higher expression of ZBED3-AS1 in SAT than in pancreas (Supplementary Table S10), the influence of rs7732130 on obesity risk might derive more from its effect on expression of this gene in adipose tissue (both SAT and VAT) than in pancreas.
The Tier-1 SNPs of PC and PEMT might also modulate inherited obesity risk through other tissues as well as through adipose. Positive transcription regulatory marks at the PC and PEMT intragenic Tier-1 SNPs were seen in both liver and SAT, the tissues that most highly express these genes (Supplementary Figures S3 and S5). These findings suggest that regulatory SNP candidates for obesity risk might assert their effect in more than one tissue. Previous studies indicated that many obesity GWAS regulatory SNPs derive their obesity associations even from brain, a tissue very dissimilar to adipose tissue [10]. The role in brain of such regulatory SNP candidates could be evaluated by our scheme focusing on the epigenomics and transcriptomics of brain instead of adipose tissue.
We demonstrated that a detailed epigenomic/transcriptomic/genetic approach is not only valuable for discovery of novel credible candidates for regulatory SNPs (Tier-1 SNPs) but also for re-evaluating previously reported candidate regulatory SNPs. We also showed that most of our prioritized Tier-1 SNPs were not detected with several standard statistical tools for evaluating GWAS SNPs (SMR and HEIDI [9], PAINTOR [16], and eCAVIAR [26]). Moreover, those statistical tools often gave candidates whose epigenetic features made them unlikely to have a transcription regulatory function because, even when the tools included epigenetic parameters, these parameters may not have been weighted sufficiently. Our findings also can aid future studies of the incompletely understood roles of genes such as RP11-392O17.1, ZBED3-AS1, FAM13A, and HOXA11 in adipose tissue and other normal or malignant tissues [30,55,69,70,71,72]. Most importantly, comprehensive biochemically-based prioritization of credible candidates for regulatory SNPs from obesity GWAS can greatly facilitate the demanding experiments required to directly verify allele-specific effects on gene expression linked to inherited obesity risk.

4. Methods

4.1. Obesity GWAS Data

Index SNPs associated with obesity, BMI, WHRadjBMI, WCadjBMI, and HCadjBMI (p < 5 × 10⁻⁸) were retrieved from 50 studies in the NHGRI-EBI GWAS Catalog [73] (downloaded July 2020; Supplemental Table S1). We expanded the index SNPs to a set of proxy SNPs (r2 ≥ 0.8, EUR from the 1000 Genome Project Phase 3 [74] by using PLINK v1.9 [75] (https://www.cog-genomics.org/plink/1.9/; accessed on 1 August 2020) and/or LDlink v3.9 [76] (https://ldlink.nci.nih.gov/; accessed on 1 August 2020). For the genes in Table 1, we also extracted imputed SNPs for BMI and WHRadjBMI [25] (p < 5 × 10⁻⁸) in the 1-Mb region surrounding the genes.

4.2. Epigenomics

Chromatin state segmentation data were from the 18-state Roadmap Epigenome model [8] (https://egg2.wustl.edu/roadmap/data/byFileType/chromhmmSegmentations/ChmmModels/core_K27ac/jointModel/final/; accessed on 1 August 2020). Promoter chromatin refers to strong promoter chromatin (state 1), and enhancer chromatin to strong enhancer chromatin (states 3, 8, 9, or 10). In Tables, we visualized these and other data in the UCSC Genome browser (http://genome.UCSC.edu; accessed on 1 October 2021) [18] and slightly modified the color-coding for chromatin state segmentation accordingly to improve clarity. In evaluating promoter versus enhancer designations, note that these occasionally functionally overlap depending on the cell and DNA context [77]. DHS and peaks of H3K27ac were defined as narrowPeaks (Roadmap Project [8], https://egg2.wustl.edu/roadmap/data/byFileType/peaks/consolidatedImputed/narrowPeak/; accessed on 1 July 2020) and checked manually in the UCSC Genome Browser. The 15 non-adipose tissues examined to determine strong promoter/enhancer chromatin and H3K27ac peaks preferentially in SAT versus ≤ 4 non-adipose tissues are given in Supplementary Table S2. The long-distance chromatin interactions were from GeneHancer tracks (GeneHancer Track Settings (ucsc.edu) [49]; accessed on 1 October 2021) for the LCL or from the Micro-C track at the UCSC Genome Browser (Hi-C and Micro-C Track Settings (ucsc.edu); accessed on 1 October 2021) for foreskin fibroblasts and embryonic stem cells [41]. Adipocytes are mesenchymal stem cells induced to differentiate in vitro to adipocytes [8].

4.3. Transcriptomics

Expression ratios were determined from the TPM of SAT or VAT to that of 35 heterologous tissue types (Supplementary Table S3) from the GTEx portal [17]. Preferential expression was defined as this ratio for either SAT or VAT > 2 and with a minimum of TPM > 2 for SAT or VAT. Transcript specific expression and single-nuclei expression were also from GTEx (https://gtexportal.org/; V8; accessed on 1 July 2020). Expression data for cell cultures was from strand-specific RNA-seq of total RNA (CSHL long RNA-seq) and 5′ cap analysis of gene expression (http://genome.ucsc.edu [18]; accessed on 1 October 2021). Preadipocytes were primary cultures from SAT.

4.4. Excluding EnhPro SNPs Linked to Missense SNPs and Predicting Allele-Specific TFBS

The EnhPro SNPs were examined for appreciable linkage to missense SNPs (HaploReg v4.1; broadinstitute.org; v4.1; July 2020) at an LD r2 > 0.2 (EUR) to eliminate such SNPs from further consideration as candidate transcription regulatory SNPs. Predictions of allele-specific TFBS from the remaining SNPs were using the TRANSFAC v2020.1 program and database (http://gene-regulation.com; accessed on 1 October 2021) with manual curation as previously described [78]. Each TF for a matching TFBS had to have TPM ≥ 2 in SAT or VAT. In addition, we used manual curation to retain only those TRANSFAC TFBS predictions for which all the conserved positions had exact matches to the SNP-containing sequence and for which no more than one base in a partly conserved position had only a partial match (at least 20% as good as the best PWM match). We also looked for evidence from a TF ChIP-seq database [41] for TF binding to oligonucleotide sequences containing our Tier-1 SNPs but no evidence of such binding was found. This is not surprising given the severe limitations on the size of available databases for TF binding in various tissues and cell types.

4.5. Statistical Analyses to Look for Potential Causal Regulatory SNPs

For the SMR and HEIDI [9] (https://yanglab.westlake.edu.cn/software/smr/; accessed on 1 September 2020), PAINTOR v3.1 [16] (https://github.com/gkichaev/PAINTOR_V3.0; accessed on 1 May 2021), and eCAVIAR [26] (https://github.com/fhormoz/caviar; accessed on 1 June 2021) analyses, we used the top associated SNPs (p < 5 × 10⁻⁸) from sex-combined WHRadjBMI GWAS summary data [25]. For the SMR and HEIDI analysis, we employed default values of peQTL < 5 × 10⁻⁸ for SMR and peQTL < 1.57 × 10⁻³ for HEIDI, a Bonferroni corrected threshold of pSMR < 2.16 × 10⁻⁶ and pHEIDI > 0.05. For PAINTOR and eCAVIAR analyses, we only considered significant GWAS SNPs within the 1- to 2-Mb neighborhood of Tier-1 genes in Table 1. For PAINTOR, we integrated overlap of the SNPs with exonic DNA, chromatin segmentation states 1, 3, 8, 9, or 10 (18-state model [8]), or narrow peaks of DHS and H3K27ac in SAT [18]. For colocalization eCAVIAR, we included SNPs with significant eQTLs in SAT located within the 1- to 2-MB neighborhood of the genes in Table 1. For COJO in genome-wide complex trait analysis (GCTA) [23,24] (https://yanglab.westlake.edu.cn/software/gcta/#GWASanalysis; accessed on 1 July 2021), we used the default parameters to evaluate the changes in the association of Tier-1 SNPs with obesity measures by conditioning on any neighboring EnhPro SNPs that lacked a predicted allele-specific TFBS. In addition, we assessed the Tier-1 SNPs for the HOXC4/C5/C6 subcluster conditional on the MIR196A2 SNP rs11644913. The reference panel of European individuals (EUR) from the 1000 Genomes Project (phase 3) was used for linkage disequilibrium estimates for all analyses because most GWAS data was for this group.

4.6. Transcription from RP11-392O17.1 in SAT-MSC

Total RNA was isolated (https://www.foreivd.com/cell-total-rna-isolation-kit-product/; accessed on 1 March 2021) from low-passage MSC derived from SAT that were >95% positive for CD73, CD90, and CD105 and <2% positive for CD45, CD34, CD11b, and CD19 (www.cellcook.com; accessed on 1 April 2021). First-strand cDNA synthesis (www.uebio.com/productDe_46.html; accessed on 1 May 2021) used ~300 ng of RNA template and included a double-strand DNA-specific DNase in the reaction mixture. PCR (www.uebio.com/productDe_443.html; accessed on 1 May 2021) was just for 35 cycles or for 35 cycles followed by a second round of 25 cycles on a 1:10 dilution of the first-round product.

5. Conclusions

A method is presented for prioritizing candidates for GWAS-derived regulatory SNPs by selecting SNPs that overlap multiple epigenetic marks preferentially in a tissue relevant to the GWAS phenotype and that also overlap a predicted allele-specific transcription factor binding site. In addition, the gene associated with the SNP was required to be preferentially expressed in the selected tissue. Using obesity-related GWAS and adipose as the highlighted tissue, 47 SNPs associated with 14 gene loci were prioritized with this method. These prioritized SNPs are highly plausible candidates for influencing inherited obesity risk through allele-specific modulation of transcription levels and, for a few genes, relative usage of multiple alternative promoters. One of the prioritized SNPs was independently examined in two recent experimental studies [27,28]. These studies strongly implicate it in transcription regulation in cis in an allele-specific manner. The method described in the present study is an important tool for rigorous prioritization of regulatory SNP candidates that is needed before embarking on demanding experiments to test allelic effects on transcription and can be easily adopted to evaluate transcription-regulatory SNP candidates for other complex disorders.

Supplementary Materials

Supplemental files can be found at https://www.mdpi.com/article/10.3390/ijms23031271/s1.

Author Contributions

M.E. and X.Z. conceived the study and wrote the manuscript with advice from H.-W.D. and H.S.; T.-Y.L. did the RP11-392O17.1 experiments. H.-W.D. and H.-M.X. funded the research. K.C.E. made the figures and edited the manuscript. All authors have read and agreed to the published version of the manuscript.

Funding

This study was partially supported by grants from the National Institutes of Health (R01AR069055 and U19AG055373).

Institutional Review Board Statement

Not applicable.

Informed Consent Statement

Not applicable.

Data Availability Statement

All data are publicly available at the URLs indicated in Methods.

Acknowledgments

We thank Carl Baribault for his help with collecting and editing obesity GWAS data collection, Yu Liu and Shu Ran for their help with TFBS prediction evaluation, and Xiaojun Hu for help with preliminary analysis of TFBS.

Conflicts of Interest

The authors declare no conflict of interest.

Abbreviations:

BS bisulfite
CAGE5′ Cap analysis gene expression
CGI CpG island
ChIP-seq chromatin immunoprecipitation-sequencing
Enh enhancer
FPKMfragments per kilobase of exon per million reads mapped
H3K27achistone H3 lysine 27 acetylation
H3K4me1histone H3 lysine 4 monomethylation
H3K4me3 histone H3 lysine 4 trimethylation
LCLlymphoblastoid cell line
LMR low methylated region
lncRNA long non-coding RNA
Micro-C chromatin capture analysis using micrococcal nuclease
NHLF normal human lung fibroblasts
ORF open reading frame
PBMC peripheral blood mononuclear cells
SkM skeletal muscle
TAD topologically associating domain
TPM transcripts per million
TSS transcription start site
Txn transcription

References

  1. Ling, C.; Ronn, T. Epigenetics in human obesity and Type 2 diabetes. Cell Metab. 2019, 29, 1028–1044. [Google Scholar] [CrossRef] [PubMed] [Green Version]
  2. Rohde, K.; Keller, M.; la Cour Poulsen, L.; Bluher, M.; Kovacs, P.; Bottcher, Y. Genetics and epigenetics in obesity. Metabolism 2019, 92, 37–50. [Google Scholar] [CrossRef] [PubMed] [Green Version]
  3. Porro, S.; Genchi, V.A.; Cignarelli, A.; Natalicchio, A.; Laviola, L.; Giorgino, F.; Perrini, S. Dysmetabolic adipose tissue in obesity: Morphological and functional characteristics of adipose stem cells and mature adipocytes in healthy and unhealthy obese subjects. J. Endocrinol. Investig. 2021, 44, 921–941. [Google Scholar] [CrossRef] [PubMed]
  4. Palmer, B.F.; Clegg, D.J. The sexual dimorphism of obesity. Mol. Cell Endocrinol. 2015, 402, 113–119. [Google Scholar] [CrossRef] [PubMed] [Green Version]
  5. Zacharia, A.; Saidemberg, D.; Mannully, C.T.; Kogan, N.M.; Shehadeh, A.; Sinai, R.; Zucker, A.; Bruck-Haimson, R.; Goldstein, N.; Haim, Y.; et al. Distinct infrastructure of lipid networks in visceral and subcutaneous adipose tissues in overweight humans. Am. J. Clin. Nutr. 2020, 112, 979–990. [Google Scholar] [CrossRef]
  6. Loos, R.J. The genetics of adiposity. Curr. Opin. Genet. Dev. 2018, 50, 86–95. [Google Scholar] [CrossRef]
  7. Dong, S.S.; Zhang, Y.J.; Chen, Y.X.; Yao, S.; Hao, R.H.; Rong, Y.; Niu, H.M.; Chen, J.B.; Guo, Y.; Yang, T.L. Comprehensive review and annotation of susceptibility SNPs associated with obesity-related traits. Obes. Rev. 2018, 19, 917–930. [Google Scholar] [CrossRef]
  8. Kundaje, A.; Meuleman, W.; Ernst, J.; Bilenky, M.; Yen, A.; Heravi-Moussavi, A.; Kheradpour, P.; Zhang, Z.; Wang, J.; Ziller, M.J.; et al. Integrative analysis of 111 reference human epigenomes. Nature 2015, 518, 317–330. [Google Scholar] [CrossRef] [Green Version]
  9. Zhu, Z.; Zhang, F.; Hu, H.; Bakshi, A.; Robinson, M.R.; Powell, J.E.; Montgomery, G.W.; Goddard, M.E.; Wray, N.R.; Visscher, P.M.; et al. Integration of summary data from GWAS and eQTL studies predicts complex trait gene targets. Nat. Genet. 2016, 48, 481–487. [Google Scholar] [CrossRef]
  10. Locke, A.E.; Kahali, B.; Berndt, S.I.; Justice, A.E.; Pers, T.H.; Day, F.R.; Powell, C.; Vedantam, S.; Buchkovich, M.L.; Yang, J.; et al. Genetic studies of body mass index yield new insights for obesity biology. Nature 2015, 518, 197–206. [Google Scholar] [CrossRef] [Green Version]
  11. Fathzadeh, M.; Li, J.; Rao, A.; Cook, N.; Chennamsetty, I.; Seldin, M.; Zhou, X.; Sangwung, P.; Gloudemans, M.J.; Keller, M.; et al. FAM13A affects body fat distribution and adipocyte function. Nat. Commun. 2020, 11, 1465. [Google Scholar] [CrossRef] [PubMed]
  12. Kempe-Teufel, D.; Machicao, F.; Machann, J.; Bohm, A.; Schick, F.; Fritsche, A.; Stefan, N.; Hrabe de Angelis, M.; Haring, H.U.; Staiger, H. A Polygenic Risk Score of Lipolysis-Increasing Alleles Determines Visceral Fat Mass and Proinsulin Conversion. J. Clin. Endocrinol. Metab. 2019, 104, 1090–1098. [Google Scholar] [CrossRef] [PubMed] [Green Version]
  13. Lumish, H.S.; O’Reilly, M.; Reilly, M.P. Sex differences in genomic drivers of adipose distribution and related cardiometabolic disorders: Opportunities for precision medicine. Arterioscler. Thromb. Vasc. Biol. 2020, 40, 45–60. [Google Scholar] [CrossRef] [PubMed]
  14. Lundback, V.; Kulyte, A.; Strawbridge, R.J.; Ryden, M.; Arner, P.; Marcus, C.; Dahlman, I. FAM13A and POM121C are candidate genes for fasting insulin: Functional follow-up analysis of a genome-wide association study. Diabetologia 2018, 61, 1112–1123. [Google Scholar] [CrossRef] [Green Version]
  15. Spracklen, C.N.; Karaderi, T.; Yaghootkar, H.; Schurmann, C.; Fine, R.S.; Kutalik, Z.; Preuss, M.H.; Lu, Y.; Wittemans, L.B.L.; Adair, L.S.; et al. Exome-Derived Adiponectin-Associated Variants Implicate Obesity and Lipid Biology. Am. J. Hum. Genet. 2019, 105, 15–28. [Google Scholar] [CrossRef] [Green Version]
  16. Kichaev, G.; Roytman, M.; Johnson, R.; Eskin, E.; Lindström, S.; Kraft, P.; Pasaniuc, B. Improved methods for multi-trait fine mapping of pleiotropic risk loci. Bioinformatics 2017, 33, 248–255. [Google Scholar] [CrossRef]
  17. The GTEx Consortium; Ardlie, K.G.; Deluca, D.S.; Segrè, A.V.; Sullivan, T.J.; Young, T.R.; Gelfand, E.T.; Trowbridge, C.A.; Maller, J.B.; Tukiainen, T.; et al. The genotype-tissue expression (GTEx) pilot analysis: Multitissue gene regulation in humans. Science 2015, 348, 648–660. [Google Scholar] [CrossRef] [Green Version]
  18. Kent, W.J.; Sugnet, C.W.; Furey, T.S.; Roskin, K.M.; Pringle, T.H.; Zahler, A.M.; Haussler, D. The human genome browser at UCSC. Genome Res. 2002, 12, 996–1006. [Google Scholar] [CrossRef] [Green Version]
  19. Zhang, X.; Ehrlich, K.C.; Yu, F.; Hu, X.; Meng, X.H.; Deng, H.W.; Shen, H.; Ehrlich, M. Osteoporosis- and obesity-risk interrelationships: An epigenetic analysis of GWAS-derived SNPs at the developmental gene TBX15. Epigenetics 2020, 15, 728–749. [Google Scholar] [CrossRef] [Green Version]
  20. Hoffman, A.E.; Zheng, T.; Yi, C.; Leaderer, D.; Weidhaas, J.; Slack, F.; Zhang, Y.; Paranjape, T.; Zhu, Y. microRNA miR-196a-2 and breast cancer: A genetic and epigenetic association study and functional analysis. Cancer Res. 2009, 69, 5970–5977. [Google Scholar] [CrossRef] [Green Version]
  21. Divoux, A.; Xie, H.; Li, J.L.; Karastergiou, K.; Perera, R.J.; Chang, R.J.; Fried, S.K.; Smith, S.R. MicroRNA-196 regulates HOX gene expression in human gluteal adipose tissue. Obesity 2017, 25, 1375–1383. [Google Scholar] [CrossRef] [PubMed]
  22. Ghanbari, M.; Sedaghat, S.; de Looper, H.W.; Hofman, A.; Erkeland, S.J.; Franco, O.H.; Dehghan, A. The association of common polymorphisms in miR-196a2 with waist to hip ratio and miR-1908 with serum lipid and glucose. Obesity 2015, 23, 495–503. [Google Scholar] [CrossRef] [PubMed]
  23. Yang, J.; Lee, S.H.; Goddard, M.E.; Visscher, P.M. GCTA: A tool for genome-wide complex trait analysis. Am. J. Hum. Genet. 2011, 88, 76–82. [Google Scholar] [CrossRef] [PubMed] [Green Version]
  24. Yang, J.; Ferreira, T.; Morris, A.P.; Medland, S.E.; Genetic Investigation of ANthropometric Traits (GIANT) Consortium; DIAbetes Genetics Replication and Meta-analysis (DIAGRAM) Consortium; Madden, P.A.F.; Heath, A.C.; Martin, N.G.; Montgomery, G.W.; et al. Conditional and joint multiple-SNP analysis of GWAS summary statistics identifies additional variants influencing complex traits. Nat. Genet. 2012, 44, 369–375. [Google Scholar] [CrossRef]
  25. Pulit, S.L.; Stoneman, C.; Morris, A.P.; Wood, A.R.; Glastonbury, C.A.; Tyrrell, J.; Yengo, L.; Ferreira, T.; Marouli, E.; Ji, Y.; et al. Meta-analysis of genome-wide association studies for body fat distribution in 694 649 individuals of European ancestry. Hum. Mol. Genet. 2019, 28, 166–174. [Google Scholar] [CrossRef] [Green Version]
  26. Hormozdiari, F.; van de Bunt, M.; Segrè, A.V.; Li, X.; Joo, J.W.J.; Bilow, M.; Sul, J.H.; Sankararaman, S.; Pasaniuc, B.; Eskin, E. Colocalization of GWAS and eQTL Signals Detects Target Genes. Am. J. Hum. Genet. 2016, 99, 1245–1260. [Google Scholar] [CrossRef] [Green Version]
  27. Greenwald, W.W.; Chiou, J.; Yan, J.; Qiu, Y.; Dai, N.; Wang, A.; Nariai, N.; Aylward, A.; Han, J.Y.; Kadakia, N.; et al. Pancreatic islet chromatin accessibility and conformation reveals distal enhancer networks of type 2 diabetes risk. Nat. Commun. 2019, 10, 2078. [Google Scholar] [CrossRef]
  28. Miguel-Escalada, I.; Bonas-Guarch, S.; Cebola, I.; Ponsa-Cobas, J.; Mendieta-Esteban, J.; Atla, G.; Javierre, B.M.; Rolando, D.M.Y.; Farabella, I.; Morgan, C.C.; et al. Human pancreatic islet three-dimensional chromatin architecture provides insights into the genetics of type 2 diabetes. Nat. Genet. 2019, 51, 1137–1148. [Google Scholar] [CrossRef]
  29. Stelzer, G.; Rosen, N.; Plaschkes, I.; Zimmerman, S.; Twik, M.; Fishilevich, S.; Stein, T.I.; Nudel, R.; Lieder, I.; Mazor, Y.; et al. The GeneCards Suite: From gene data mining to disease genome sequence analyses. Curr. Protoc. Bioinform. 2016, 54, 1.30.1–1.30.33. [Google Scholar] [CrossRef]
  30. Roussel-Gervais, A.; Couture, C.; Langlais, D.; Takayasu, S.; Balsalobre, A.; Rueda, B.R.; Zukerberg, L.R.; Figarella-Branger, D.; Brue, T.; Drouin, J. The Cables1 Gene in Glucocorticoid Regulation of Pituitary Corticotrope Growth and Cushing Disease. J. Clin. Endocrinol. Metab. 2016, 101, 513–522. [Google Scholar] [CrossRef] [Green Version]
  31. Lister, R.; Pelizzola, M.; Kida, Y.S.; Hawkins, R.D.; Nery, J.R.; Hon, G.; Antosiewicz-Bourget, J.; O’Malley, R.; Castanon, R.; Klugman, S.; et al. Hotspots of aberrant epigenomic reprogramming in human induced pluripotent stem cells. Nature 2011, 471, 68–73. [Google Scholar] [CrossRef] [Green Version]
  32. Zukerberg, L.R.; Patrick, G.N.; Nikolic, M.; Humbert, S.; Wu, C.L.; Lanier, L.M.; Gertler, F.B.; Vidal, M.; Van Etten, R.A.; Tsai, L.H. Cables links Cdk5 and c-Abl and facilitates Cdk5 tyrosine phosphorylation, kinase upregulation, and neurite outgrowth. Neuron 2000, 26, 633–646. [Google Scholar] [CrossRef] [Green Version]
  33. Liu, S.L.; Cai, C.; Yang, Z.Y.; Wu, Z.Y.; Wu, X.S.; Wang, X.F.; Dong, P.; Gong, W. DGCR5 is activated by PAX5 and promotes pancreatic cancer via targeting miR-3163/TOP2A and activating Wnt/beta-catenin pathway. Int. J. Biol. Sci. 2021, 17, 498–513. [Google Scholar] [CrossRef] [PubMed]
  34. Kawai, M.; Rosen, C.J. PPARgamma: A circadian transcription factor in adipogenesis and osteogenesis. Nat. Rev. Endocrinol. 2010, 6, 629–636. [Google Scholar] [CrossRef] [Green Version]
  35. Jin, Z.; Chung, J.W.; Mei, W.; Strack, S.; He, C.; Lau, G.W.; Yang, J. Regulation of nuclear-cytoplasmic shuttling and function of Family with sequence similarity 13, member A (Fam13a), by B56-containing PP2As and Akt. Mol. Biol. Cell. 2015, 26, 1160–1173. [Google Scholar] [CrossRef] [PubMed] [Green Version]
  36. Wardhana, D.A.; Ikeda, K.; Barinda, A.J.; Nugroho, D.B.; Qurania, K.R.; Yagi, K.; Miyata, K.; Oike, Y.; Hirata, K.I.; Emoto, N. Family with sequence similarity 13, member A modulates adipocyte insulin signaling and preserves systemic metabolic homeostasis. Proc. Natl. Acad. Sci. USA 2018, 115, 1529–1534. [Google Scholar] [CrossRef] [Green Version]
  37. Lin, X.; Liou, Y.H.; Li, Y.; Gong, L.; Li, Y.; Hao, Y.; Pham, B.; Xu, S.; Jiang, Z.; Li, L.; et al. FAM13A Represses AMPK Activity and Regulates Hepatic Glucose and Lipid Metabolism. iScience 2020, 23, 100928. [Google Scholar] [CrossRef] [Green Version]
  38. Corvol, H.; Hodges, C.A.; Drumm, M.L.; Guillot, L. Moving beyond genetics: Is FAM13A a major biological contributor in lung physiology and chronic lung diseases? J. Med. Genet. 2014, 51, 646–649. [Google Scholar] [CrossRef]
  39. McDowell, I.C.; Pai, A.A.; Guo, C.; Vockley, C.M.; Brown, C.D.; Reddy, T.E.; Engelhardt, B.E. Many long intergenic non-coding RNAs distally regulate mRNA gene expression levels. bioRxiv 2016. [Google Scholar] [CrossRef] [Green Version]
  40. Yang, Y.; Fan, J.; Xu, H.; Fan, L.; Deng, L.; Li, J.; Li, D.; Li, H.; Zhang, F.; Zhao, R.C. Long noncoding RNA LYPLAL1-AS1 regulates adipogenic differentiation of human mesenchymal stem cells by targeting desmoplakin and inhibiting the Wnt/β-catenin pathway. Cell Death Discov. 2021, 7, 105. [Google Scholar] [CrossRef]
  41. Gheorghe, M.; Sandve, G.K.; Khan, A.; Cheneby, J.; Ballester, B.; Mathelier, A. A map of direct TF-DNA interactions in the human genome. Nucleic Acids Res. 2019, 47, e21. [Google Scholar] [CrossRef] [PubMed] [Green Version]
  42. Zhu, Z.; Guo, Y.; Shi, H.; Liu, C.L.; Panganiban, R.A.; Chung, W.; O’Connor, L.J.; Himes, B.E.; Gazal, S.; Hasegawa, K.; et al. Shared genetic and experimental links between obesity-related traits and asthma subtypes in UK Biobank. J. Allergy Clin. Immunol. 2020, 145, 537–549. [Google Scholar] [CrossRef] [PubMed] [Green Version]
  43. Funkhouser, S.A.; Vazquez, A.I.; Steibel, J.P.; Ernst, C.W.; Los Campos, G. Deciphering Sex-Specific Genetic Architectures Using Local Bayesian Regressions. Genetics 2020, 215, 231–241. [Google Scholar] [CrossRef] [PubMed]
  44. Ballantyne, R.L.; Zhang, X.; Nunez, S.; Xue, C.; Zhao, W.; Reed, E.; Salaheen, D.; Foulkes, A.S.; Li, M.; Reilly, M.P. Genome-wide interrogation reveals hundreds of long intergenic noncoding RNAs that associate with cardiometabolic traits. Hum. Mol. Genet. 2016, 25, 3125–3141. [Google Scholar] [CrossRef] [Green Version]
  45. Xu, H.; Yang, Y.; Fan, L.; Deng, L.; Fan, J.; Li, D.; Li, H.; Zhao, R.C. Lnc13728 facilitates human mesenchymal stem cell adipogenic differentiation via positive regulation of ZBED3 and downregulation of the WNT/beta-catenin pathway. Stem Cell Res. Ther. 2021, 12, 176. [Google Scholar] [CrossRef]
  46. Dov, A.; Abramovitch, E.; Warwar, N.; Nesher, R. Diminished phosphodiesterase-8B potentiates biphasic insulin response to glucose. Endocrinology 2008, 149, 741–748. [Google Scholar] [CrossRef]
  47. Westphal, N.J.; Seasholtz, A.F. CRH-BP: The regulation and function of a phylogenetically conserved binding protein. Front. Biosci. 2006, 11, 1878–1891. [Google Scholar] [CrossRef] [Green Version]
  48. Eraslan, G.; Drokhlyansky, E.; Anand, S.; Subramanian, A.; Fiskin, E.; Slyper, M.; Wang, J.; Wittenberghe, N.V.; Rouhana, J.M.; Waldman, J.; et al. Single-nucleus cross-tissue molecular reference maps to decipher disease gene function. bioRxiv 2021. [Google Scholar] [CrossRef]
  49. Mifsud, B.; Tavares-Cadete, F.; Young, A.N.; Sugar, R.; Schoenfelder, S.; Ferreira, L.; Wingett, S.W.; Andrews, S.; Grey, W.; Ewels, P.A.; et al. Mapping long-range promoter contacts in human cells with high-resolution capture Hi-C. Nat. Genet. 2015, 47, 598–606. [Google Scholar] [CrossRef]
  50. Krietenstein, N.; Abraham, S.; Venev, S.V.; Abdennur, N.; Gibcus, J.; Hsieh, T.S.; Parsi, K.M.; Yang, L.; Maehr, R.; Mirny, L.A.; et al. Ultrastructural details of mammalian chromosome architecture. Mol. Cell 2020, 78, 554–565.e7. [Google Scholar] [CrossRef]
  51. Banks, A.S.; McAllister, F.E.; Camporez, J.P.; Zushin, P.J.; Jurczak, M.J.; Laznik-Bogoslavski, D.; Shulman, G.I.; Gygi, S.P.; Spiegelman, B.M. An ERK/Cdk5 axis controls the diabetogenic actions of PPARgamma. Nature 2015, 517, 391–395. [Google Scholar] [CrossRef] [PubMed] [Green Version]
  52. Take, K.; Waki, H.; Sun, W.; Wada, T.; Yu, J.; Nakamura, M.; Aoyama, T.; Yamauchi, T.; Kadowaki, T. CDK5 Regulatory Subunit-Associated Protein 1-like 1 Negatively Regulates Adipocyte Differentiation through Activation of Wnt Signaling Pathway. Sci. Rep. 2017, 7, 7326. [Google Scholar] [CrossRef] [PubMed] [Green Version]
  53. Jitrapakdee, S.; St Maurice, M.; Rayment, I.; Cleland, W.W.; Wallace, J.C.; Attwood, P.V. Structure, mechanism and regulation of pyruvate carboxylase. Biochem. J. 2008, 413, 369–387. [Google Scholar] [CrossRef] [PubMed] [Green Version]
  54. Presa, N.; Dominguez-Herrera, A.; van der Veen, J.N.; Vance, D.E.; Gomez-Munoz, A. Implication of phosphatidylethanolamine N-methyltransferase in adipocyte differentiation. Biochim. Biophys. Acta Mol. Basis Dis. 2020, 1866, 165853. [Google Scholar] [CrossRef]
  55. Shank, R.P.; Bennett, G.S.; Freytag, S.O.; Campbell, G.L. Pyruvate carboxylase: An astrocyte-specific enzyme implicated in the replenishment of amino acid neurotransmitter pools. Brain Res. 1985, 329, 364–367. [Google Scholar] [CrossRef]
  56. Nuermaimaiti, N.; Liu, J.; Liang, X.; Jiao, Y.; Zhang, D.; Liu, L.; Meng, X.; Guan, Y. Effect of lncRNA HOXA11-AS1 on adipocyte differentiation in human adipose-derived stem cells. Biochem. Biophys. Res. Commun. 2018, 495, 1878–1884. [Google Scholar] [CrossRef]
  57. Singh, S.; Rajput, Y.S.; Barui, A.K.; Sharma, R.; Datta, T.K. Fat accumulation in differentiated brown adipocytes is linked with expression of Hox genes. Gene Expr. Patterns 2016, 20, 99–105. [Google Scholar] [CrossRef]
  58. Huang, J.R.; Tan, G.M.; Li, Y.; Shi, Z. The Emerging Role of Cables1 in Cancer and Other Diseases. Mol. Pharmacol. 2017, 92, 240–245. [Google Scholar] [CrossRef]
  59. Shi, Z.; Li, Z.; Li, Z.J.; Cheng, K.; Du, Y.; Fu, H.; Khuri, F.R. Cables1 controls p21/Cip1 protein stability by antagonizing proteasome subunit alpha type 3. Oncogene 2015, 34, 2538–2545. [Google Scholar] [CrossRef] [Green Version]
  60. Wu, R.; Sun, J.G.; Wang, J.Q.; Li, B.; Liu, Q.; Ning, G.; Jin, W.; Yuan, Z. c-Abl inhibition mitigates diet-induced obesity through improving insulin sensitivity of subcutaneous fat in mice. Diabetologia 2017, 60, 900–910. [Google Scholar] [CrossRef] [Green Version]
  61. Ruffin, M.; Thompson, K.E.; Corvol, H.; Guillot, L. Two-hybrid screening of FAM13A protein partners in lung epithelial cells. BMC Res. Notes 2020, 12, 804. [Google Scholar] [CrossRef]
  62. Lin, X.; Li, Y.; Gong, L.; Yun, J.H.; Xu, S.; Tesfaigzi, Y.; Qiao, D.; Zhou, X. Tempo-spatial regulation of the Wnt pathway by FAM13A modulates the stemness of alveolar epithelial progenitors. EBioMedicine 2021, 69, 103463. [Google Scholar] [CrossRef] [PubMed]
  63. Chen, N.; Wang, J. Wnt/beta-Catenin Signaling and Obesity. Front. Physiol. 2018, 9, 792. [Google Scholar] [CrossRef] [PubMed]
  64. Tang, J.; Zhou, H.; Sahay, K.; Xu, W.; Yang, J.; Zhang, W.; Chen, W. Obesity-associated family with sequence similarity 13, member A (FAM13A) is dispensable for adipose development and insulin sensitivity. Int. J. Obes. 2019, 43, 1269–1280. [Google Scholar] [CrossRef] [PubMed] [Green Version]
  65. Fu, A.; Yu, Z.; Zhang, E.; Song, J. Long noncoding RNA ZBED3-AS1 restrains breast cancer progression by targeting the microRNA-513a-5p/KLF6 axis. Thorac. Cancer 2021, 12, 2719–2731. [Google Scholar] [CrossRef]
  66. Li, F.; Wu, X.; Zhang, Y.; Wei, K. Plasma miR-513a-5p as a potential biomarker for diagnosis of nonalcoholic fatty liver disease in Type 2 diabetes mellitus patients. Clin. Lab. 2020, 66. [Google Scholar] [CrossRef]
  67. Doumatey, A.P.; Xu, H.; Huang, H.; Trivedi, N.S.; Lei, L.; Elkahloun, A.; Adeyemo, A.; Rotimi, C.N. Global gene expression profiling in omental adipose tissue of morbidly obese diabetic African Americans. J. Endocrinol. Metab. 2015, 5, 199–210. [Google Scholar] [CrossRef] [Green Version]
  68. Dong, S.; Boyle, A.P. Predicting functional variants in enhancer and promoter elements using RegulomeDB. Hum. Mutat. 2019, 40, 1292–1298. [Google Scholar] [CrossRef] [Green Version]
  69. Wan, S.; van der Veen, J.N.; Bakala N’Goma, J.C.; Nelson, R.C.; Vance, D.E.; Jacobs, R.L. Hepatic PEMT activity mediates liver health, weight gain, and insulin resistance. FASEB J. 2019, 33, 10986–10995. [Google Scholar] [CrossRef] [Green Version]
  70. Rahardini, E.P.; Ikeda, K.; Nugroho, D.B.; Hirata, K.I.; Emoto, N. Loss of Family with Sequence Similarity 13, Member a Exacerbates Pulmonary Fibrosis Potentially by Promoting Epithelial to Mesenchymal Transition. Kobe J. Med. Sci. 2020, 65, E100–E109. [Google Scholar]
  71. Pineault, K.M.; Song, J.Y.; Kozloff, K.M.; Lucas, D.; Wellik, D.M. Hox11 expressing regional skeletal stem cells are progenitors for osteoblasts, chondrocytes and adipocytes throughout life. Nat. Commun. 2019, 10, 3168. [Google Scholar] [CrossRef] [Green Version]
  72. Zheng, Y.; Miao, Y.; Xie, J.; Lin, Y.; Yao, Q.; Cai, J.; Yang, X. Long noncoding RNA lysophospholipase-like 1–2 as ceRNA modulates glioma metastasis by regulating miR-217/YWHAG. Am. J. Transl. Res. 2020, 12, 4204–4215. [Google Scholar] [PubMed]
  73. Buniello, A.; MacArthur, J.A.L.; Cerezo, M.; Harris, L.W.; Hayhurst, J.; Malangone, C.; McMahon, A.; Morales, J.; Mountjoy, E.; Sollis, E.; et al. The NHGRI-EBI GWAS Catalog of published genome-wide association studies, targeted arrays and summary statistics 2019. Nucleic Acids Res. 2019, 47, D1005–D1012. [Google Scholar] [CrossRef] [PubMed] [Green Version]
  74. Auton, A.; Brooks, L.D.; Durbin, R.M.; Garrison, E.P.; Kang, H.M.; Korbel, J.O.; Marchini, J.L.; McCarthy, S.; McVean, G.A.; Abecasis, G.R. A global reference for human genetic variation. Nature 2015, 526, 68–74. [Google Scholar] [CrossRef] [PubMed] [Green Version]
  75. Purcell, S.; Neale, B.; Todd-Brown, K.; Thomas, L.; Ferreira, M.A.; Bender, D.; Maller, J.; Sklar, P.; de Bakker, P.I.; Daly, M.J.; et al. PLINK: A tool set for whole-genome association and population-based linkage analyses. Am. J. Hum. Genet. 2007, 81, 559–575. [Google Scholar] [CrossRef] [PubMed] [Green Version]
  76. Machiela, M.J.; Chanock, S.J. LDlink: A web-based application for exploring population-specific haplotype structure and linking correlated alleles of possible functional variants. Bioinformatics 2015, 31, 3555–3557. [Google Scholar] [CrossRef]
  77. Andersson, R.; Sandelin, A. Determinants of enhancer and promoter activities of regulatory elements. Nat. Rev. Genet. 2020, 21, 71–87. [Google Scholar] [CrossRef]
  78. Zhang, X.; Deng, H.W.; Shen, H.; Ehrlich, M. Prioritization of osteoporosis-associated Genome-wide Association Study (GWAS) single-nucleotide polymorphisms (SNPs) using epigenomics and transcriptomics. JBMR Plus 2021, 5, e10481. [Google Scholar] [CrossRef]
Figure 1. Workflow for prioritizing potential causal regulatory (Tier-1) SNPs from 50 obesity GWAS. Summary of prioritization of plausible regulatory obesity SNPs. LD, linkage disequilibrium; assoc, associated; LD, linkage disequilibrium; H3K27ac, histone H3 lysine-27 acetylation (an epigenetic mark of active enhancers or promoters); SAT, subcutaneous adipose tissue; DHS, DNaseI hypersensitive site (open chromatin); TFBS, transcription factor binding site (s).
Ijms 23 01271 g001
Figure 2. CABLES1, which controls cell growth, is associated with Tier-1 SNPs that might regulate alternative usage of its widely separated TSS. (A) A 162-kb region containing CABLES1 and four prioritized regulatory SNP candidates (Tier-1 SNP) for obesity risk (chr18:20,684,550–20,847,013). The broken arrow denotes the most frequently used TSS. (B) Strong promoter (Prom) or strong enhancer (Enh) chromatin segments; weak enhancer chromatin (Wk Enh); chromatin with the H3K36me3 mark of actively transcribed regions (Txn-chrom); chromatin with low signals for the assessed histone modifications (low signal); repressed (Repr) chromatin (8). (C) H3K27ac enrichment profiles (8). (D) Profiles of open chromatin (DNaseI hypersensitivity (8)) and a track for CpG islands, CpG-rich regions (13). (E) DNA methylation profiles from whole-genome bisulfite sequencing (BS-seq); blue horizontal bars indicate regions of significantly low DNA methylation (low meth) relative to the rest of the same genome. (F) RNA-seq on cell cultures (13); just the plus strand is shown with a vertical viewing range of 0–100. (G) Tissue RNA-seq depicted as a bar graph with median transcripts per million (TPM) from hundreds of biological replicates (12). First two orange bars, SAT and VAT (visceral adipose tissue); yellow bars, brain samples; see Supplementary Table S10 for details. SAT, subcutaneous adipose tissue; SkM, skeletal muscle; PFC, pre-frontal cortex; fib, fibroblasts; MSC, mesenchymal stem/stromal cells; short pink bars in panels (CE), indicate positions of Tier-1 SNPs. All tracks were visualized in the UCSC Genome Browser (hg19) and are aligned in this figure and Figure 3, Figure 4 and Figure 5.
Ijms 23 01271 g002
Figure 3. One of the previously highlighted obesity-related SNPs in FAM13A (rs13133548) has optimal epigenetic features to be an obesity-risk regulatory SNP. (A) A 37-kb region (chr4:89,710,207–89,746,974) overlapping five of the six Tier-1 SNPs (pink bars) as well as four other SNPs that had been described as regulatory SNP candidates from obesity GWAS (blue bars); rs13133548 is the one Tier-1 SNP that was previously described. (BE) Chromatin state segmentation, H3K27ac, DHS, and bisulfite-seq profiles as in Figure 2. (F) Bar graph of median expression levels for different tissues as in Figure 2. Pink or blue bars above tracks in panels (CE), indicate positions of Tier-1 SNPs and previously highlighted candidates for regulatory SNP, respectively. PBMC, peripheral blood mononuclear cells; SAT-MSC, subcutaneous adipose tissue-derived stem/stromal cells; BS-seq, whole genome bisulfite sequencing; meth, methylation; TPM, transcripts per million.
Ijms 23 01271 g003
Figure 4. A lncRNA gene, RP11-392O17.1, associated with SAT-related and female obesity that is often overlooked in assignments of genes to obesity GWAS SNPs. (A) A 65-kb region (chr1:219,578,827–219,643,464) containing RP11-392O17.1; above it is the tissue RNA-seq profile (GTEx, determined from poly (A)+ RNA) for the gene structure depicted immediately underneath it. The RP11-392O17.1 isoforms shown are from the latest Ensembl Comprehensive Gene Annotation Set (v104), but this gene is not yet in the RefSeq database. Purple lollipops, regions that we amplified by RT-PCR as described in the text. (B) Cell culture RNA-seq (showing the minus strand) on total RNA, vertical viewing range 0–50. (C) The location of two Tier-1 SNPs. (DG) Chromatin state segmentation, H3K27ac, DHS, and bisulfite-seq, as in the previous figures. There were no CpG islands in the region shown. TPM, transcripts per million; VAT, visceral adipose tissue; SAT-MSC, subcutaneous adipose tissue-derived mesenchymal stem cells; BM-MSC, bone marrow-derived MSC; fib, fibroblasts; BS-seq, whole genome bisulfite sequencing; meth, methylation. (H) Annotated genes in the 0.6-Mb region (chr1:219,183,979–219,829,670) that contains RP11-392O17.1. The LYPLAL1-AS1/NR_135822.1 gene is shown in gray because of the lack of RNA-seq support for this gene structure. Tan rectangle, the region 11–118 kb upstream of RP11-392O17.1 that was cited in many studies as having obesity GWAS SNPs associated with LYPLAL1 (Supplementary Figures S9 and S10).
Ijms 23 01271 g004
Figure 5. Two Tier-1 SNPs in a lncRNA gene, ZBED3-AS1, and neighbors ZBED3, SNORA47, PDE8B, and WDR41 are near long-distance chromatin looping subregions. (A) A 538-kb region (chr5:76,285,728–76,823,921) containing ZBED3-AS1 and neighboring genes; for clarity, additional isoforms of ZBED3 and PDE8B are shown only in Supplementary Figure S14. The main TSS for PDE8B is indicated by a broken arrow. CRHBP, which is referred to in the text but not shown, is 70 kb upstream of AGGF1. (BD) Chromatin state segmentation, H3K27ac, and DHS as in the previous figures. (E) CTCF binding by ChIP-seq profiling of several cell cultures. (F) A promoter-capture Hi-C interaction for the lymphoblastoid cell line (LCL) GM12878 and all chromatin interactions in the region detected by Micro-C for foreskin fibroblasts. (G) RNA-seq (showing results for transcription from both strands separately) on cell cultures with vertical viewing range 0–30; preadipocytes exhibited no detectable expression of ZBED3-AS1 (not shown); ALDH7A1P1 is a pseudogene. (H) Tissue RNA-seq shown as a bar graph with dots color-coded to indicate their position in the bar graph for ZBED3-AS1. SAT, subcutaneous adipose; panc, pancreatic; PFC, prefrontal cortex; fib, fibroblasts; LCL, lymphoblastoid cell line (GM12878); SAT-MSC, subcutaneous adipose tissue-derived mesenchymal stem/stromal cells; ESC, H1-embryonic stem cells; fib, fibroblasts; TPM, transcripts per million. CpG islands (not shown) overlap all the TSS indicated by broken arrows.
Ijms 23 01271 g005
Figure 6. Summary of proposed functions of the 18 obesity-related prioritized candidates for regulatory SNPs (Tier-1 SNPs) and their epigenomic/transcriptomic associations. Assoc., associated; SAT, subcutaneous adipose tissue; VAT, visceral adipose tissue; eQTL, expression quantitative trait loci; 3′ UTR, 3′ untranslated region of mRNA or the corresponding DNA; H3K27ac, histone H3 lysine-27 acetylation, a marker of active enhancer or promoter chromatin; TFBS, transcription factor binding site; Ref. [28], Miguel-Escalada et al. 2019 [28].
Ijms 23 01271 g006
Table 1. Eighteen prioritized candidates for regulatory obesity-risk variants (Tier-1 SNPs) associated with seven SAT-related genes a.
GeneTier-1 SNP for Obesity AssociationIndex/Proxy (I/P) or Imputed (Imp) SNPAlleles (Ref or Alt)Obesity Increasing Allele (Freq EUR) bChromatin State at the SNP in SAT cGene Location of SNP Relative to GenePredicted TF Binding dType of Additional Statistical Analysis That Predicts Assocn. e
Ref AlleleAlt Allele
CABLES1rs4445996ImpA/GG (0.91)Str enh5′ to TSS 1DNTTIP1MAXNone
rs9966093ImpC/TT (0.91)Str enh5′ to TSS 1ZXDA, ZXDBRXRANone
rs4308051 *,†I/P & ImpT/GG (0.79)Str enhNear TSS 2BHLHE40/41KLF4None
rs28589524 *,†I/PG/ANA (0.79)Str enhNear TSS 2NFKB1, RELASMAD2None
FAM13Ars10012045 *,†I/PC/TNA (0.56)Str enhIntron 2 fEPAS1NoneNone
rs2869949 *,†I/PA/GNA (0.51)Str enhIntron 1ZNF333NoneSMR&HEIDI
rs11097198 *,†I/PC/TNA (0.51)Str enhIntron 1STAT1/3/4/5B NoneSMR&HEIDI
rs6532080 *,†I/PA/CNA (0.56)Str enhIntron 1SOX4 NoneNone
rs13133548 *,†I/P & ImpG/AA (0.48)Str enh/promIntron 1NonePOU3F3PAINTOR; SMR&HEIDI
rs7660000I/P & ImpC/TC (0.70)Str enh5′ to TSS 1ZBTB44NoneNone
HOXA11rs530375207I/PT/ANA (0.91)Str enh3′-UTRZNF254PRRX2, DLX5None
PCrs17147932I/P & ImpG/TT (0.05)Str enhNear TSS 2KLF2/6, SP2/3NoneNone
PEMTrs8078513 *I/P & ImpC/AA (0.07)Str enhEnd of intron 2SMAD3NoneNone
rs8070432 *ImpT/CC (0.07)Str enhNear TSS 3NoneRUNX1None
RP11-392O17.1rs7555150 *,†I/P & ImpA/GG (0.61)Str enh/promNear promNoneNFIBNone
rs12025363 *,†I/P & ImpG/AA (0.61)Str enhProm regionGTF2IRD1NoneNone
ZBED3-AS1rs7732130I/P & ImpG/AG (0.33)Str enhNear 3′ endRFX7 NoneNone
rs9293708I/P & ImpC/TC (0.43)Str enhNear 3′ endSOX18NonePAINTOR
a Tier-1 SNPs were obtained from 50 GWAS (Figure 1); SAT, subcutaneous adipose tissue. b Obesity-increasing allele was from WHRadjBMI summary data by Pulit et al. [25]; freq EUR, frequency in the European population; NA, not available (Ref allele frequency in EUR is given instead). c Str prom, strong promoter chromatin; Str enh, strong enhancer chromatin from Roadmap database 18-state chromatin segmentation maps; Str enh/prom, strong enhancer or promoter chromatin. d Transcription factors (TFs) predicted by stringent criteria to bind to SNP-containing sequences in an allele-specific manner. e The indicated Tier-1 SNP was prioritized by SMR & HEIDI or PAINTOR programs (see Results 2.2); assocn, association. f Intron nomenclature for FAM13A is for the main isoform generated from transcription initiation at the proximal TSS. *, the Tier-1 SNP is in LD r2 > 0.75 (EUR) with other Tier-1 SNPs associated with the same gene; other multiple Tier-1 SNPs for a gene are in low LD with each other (r2 < 0.3). †, the Tier-1 SNP has LD r2 ≥ 0.4 (EUR) with 12 prioritzed plausible causual SNPs (PP ≥ 0.6) from PAINTOR WHRadjBMI with epigenetic annotations. Ref allele, Reference allele; Alt allele, alternate to the Ref allele; 3′-UTR, 3′ untranslated region of mRNA or the corresponding DNA.
Publisher’s Note: MDPI stays neutral with regard to jurisdictional claims in published maps and institutional affiliations.

