2.2. Crystal Structures
The crystal structures of EuLnCuSe
3 were best solved in the orthorhombic system from powder X-ray diffraction patterns (
Figure 1,
Table 1,
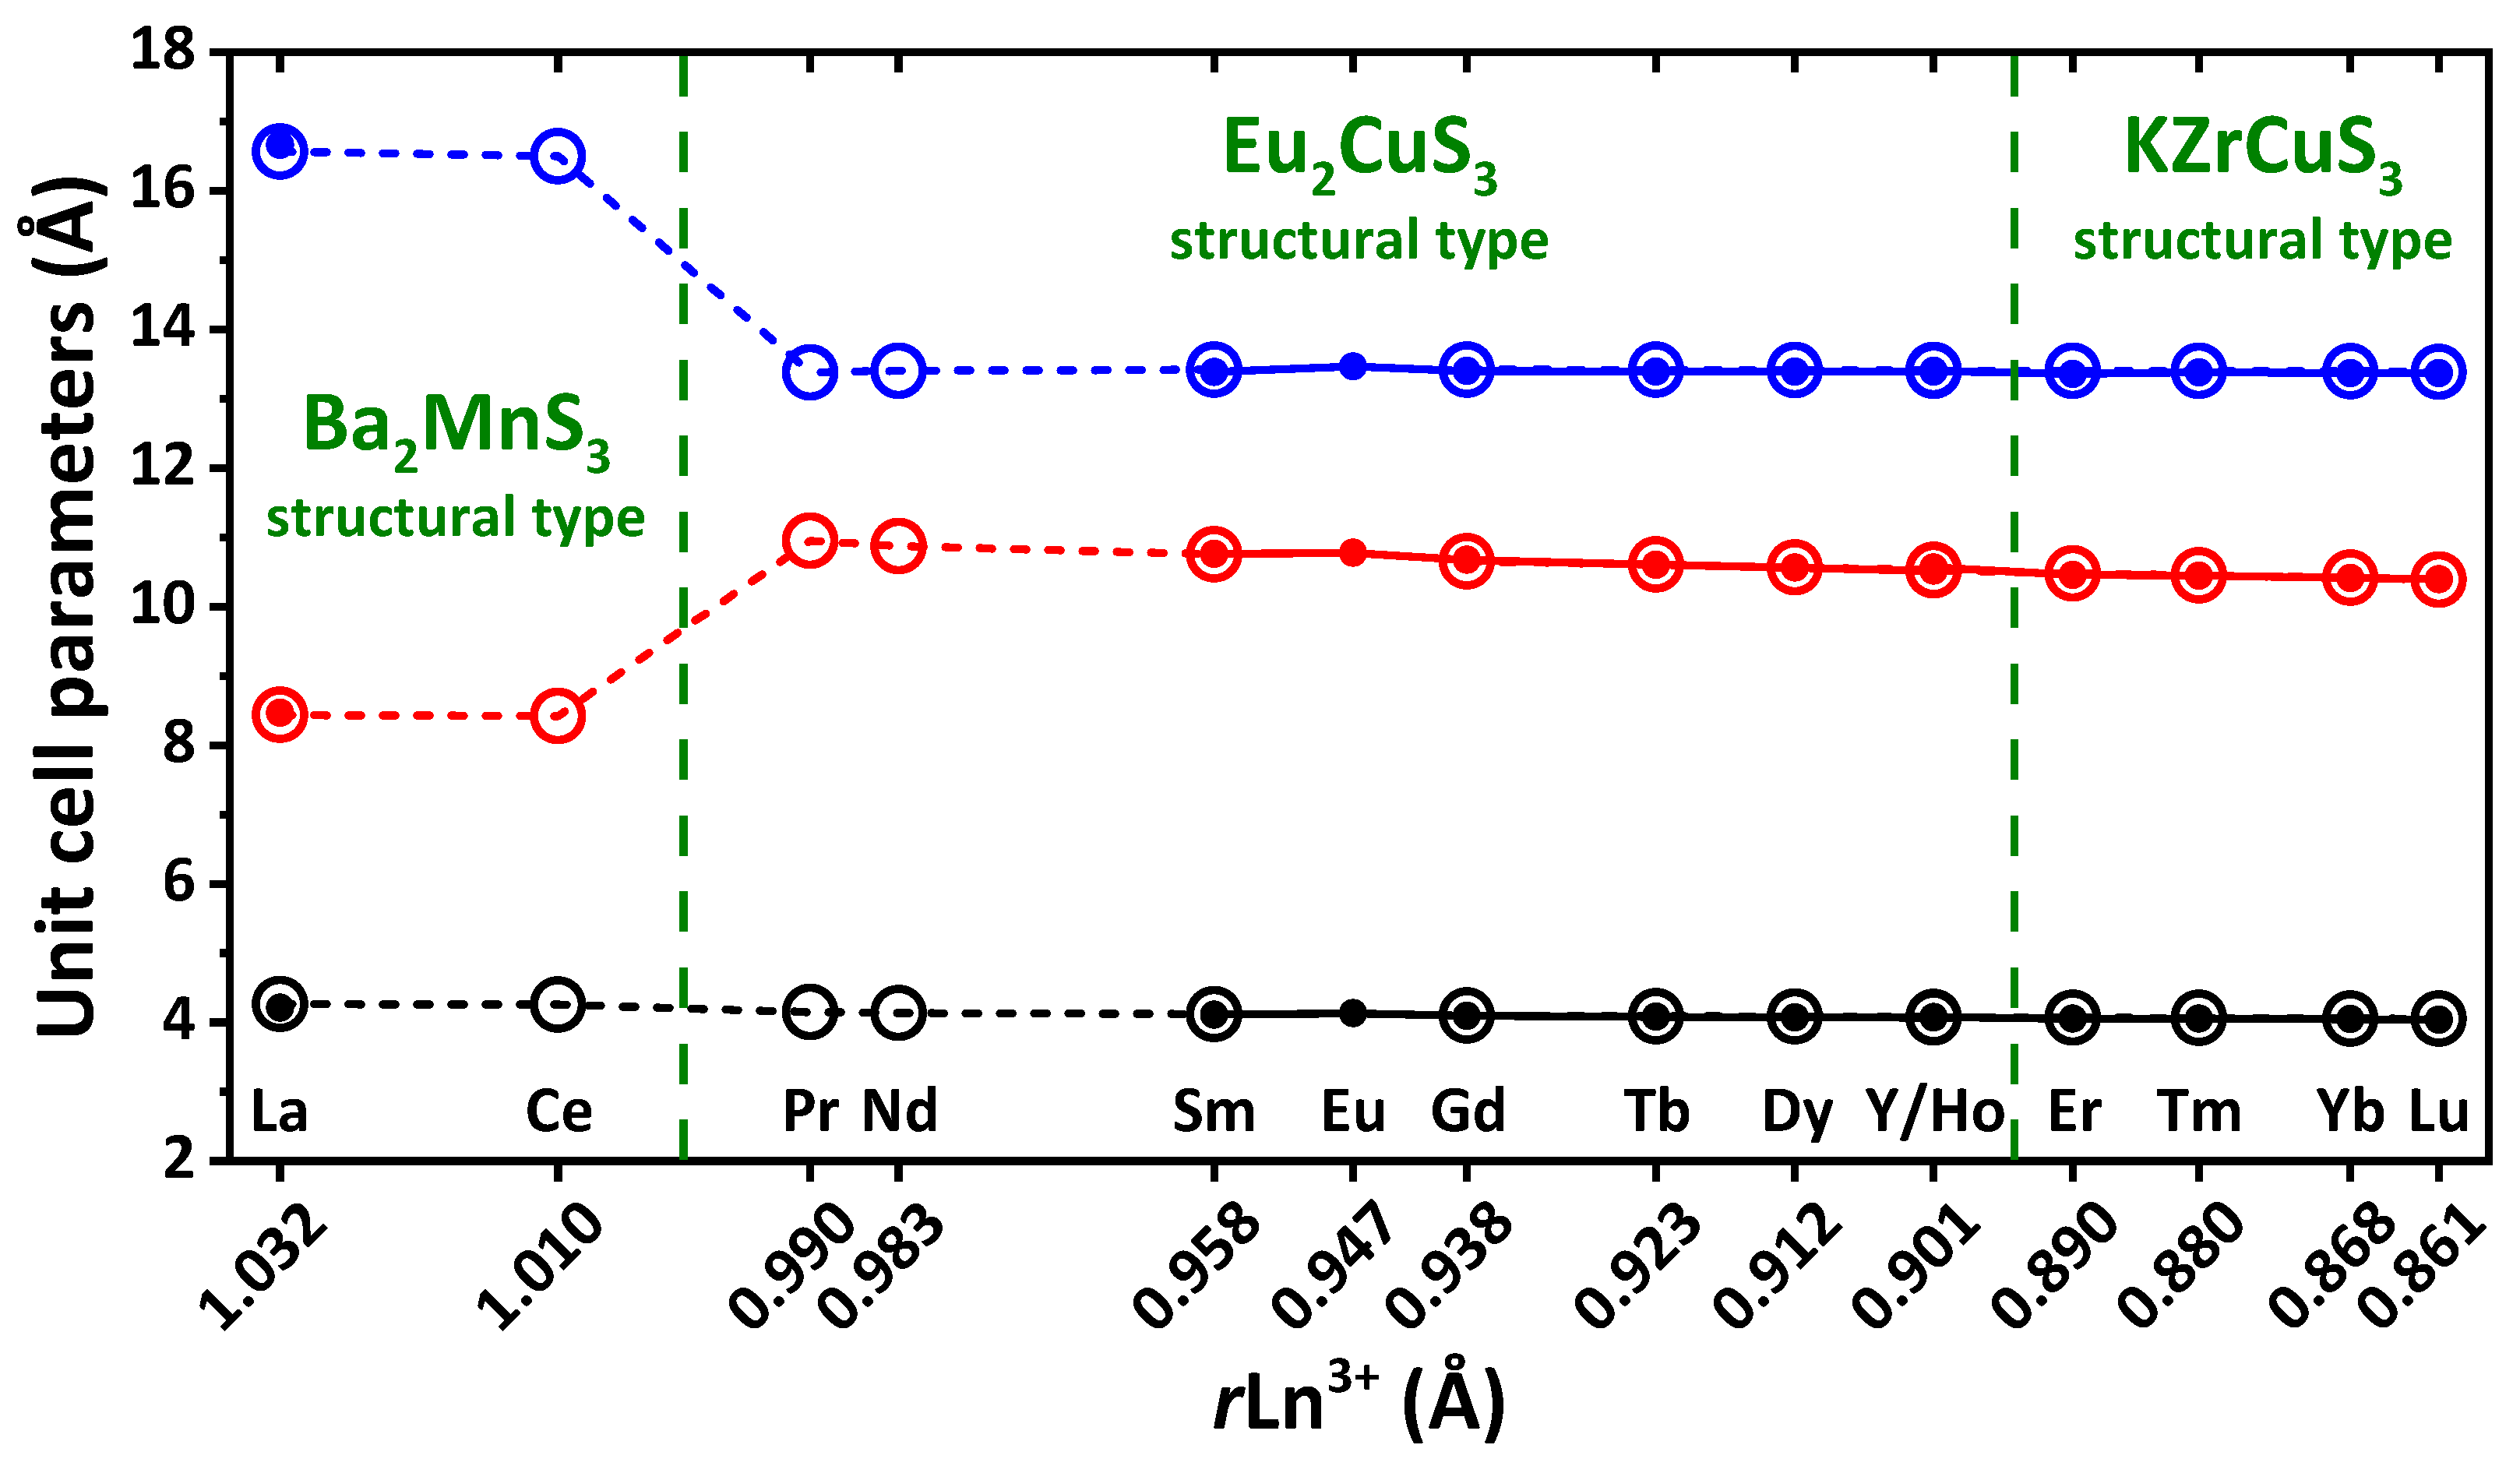
Figure S2 and Tables S2–S5 in the Supplementary Materials). The calculated unit cell parameters obtained using the PBE0 density functional theory (DFT) functional are in good agreement with the experimental values (
Figure 2,
Table 1 and
Table S6 in the Supplementary Materials). Notably, the PBE0 functional was recently shown to be efficient to reproduce crystal structures, phonon spectra and elastic properties of compounds with ionic and covalent bonds [
65]. Furthermore, it was also shown that the use of pseudopotentials for rare-earth ions replacing the inner shells, including 4
f orbitals, allows the successful description of the structure and dynamics of the lattice of compounds with a sublattice of rare-earth ions [
66].
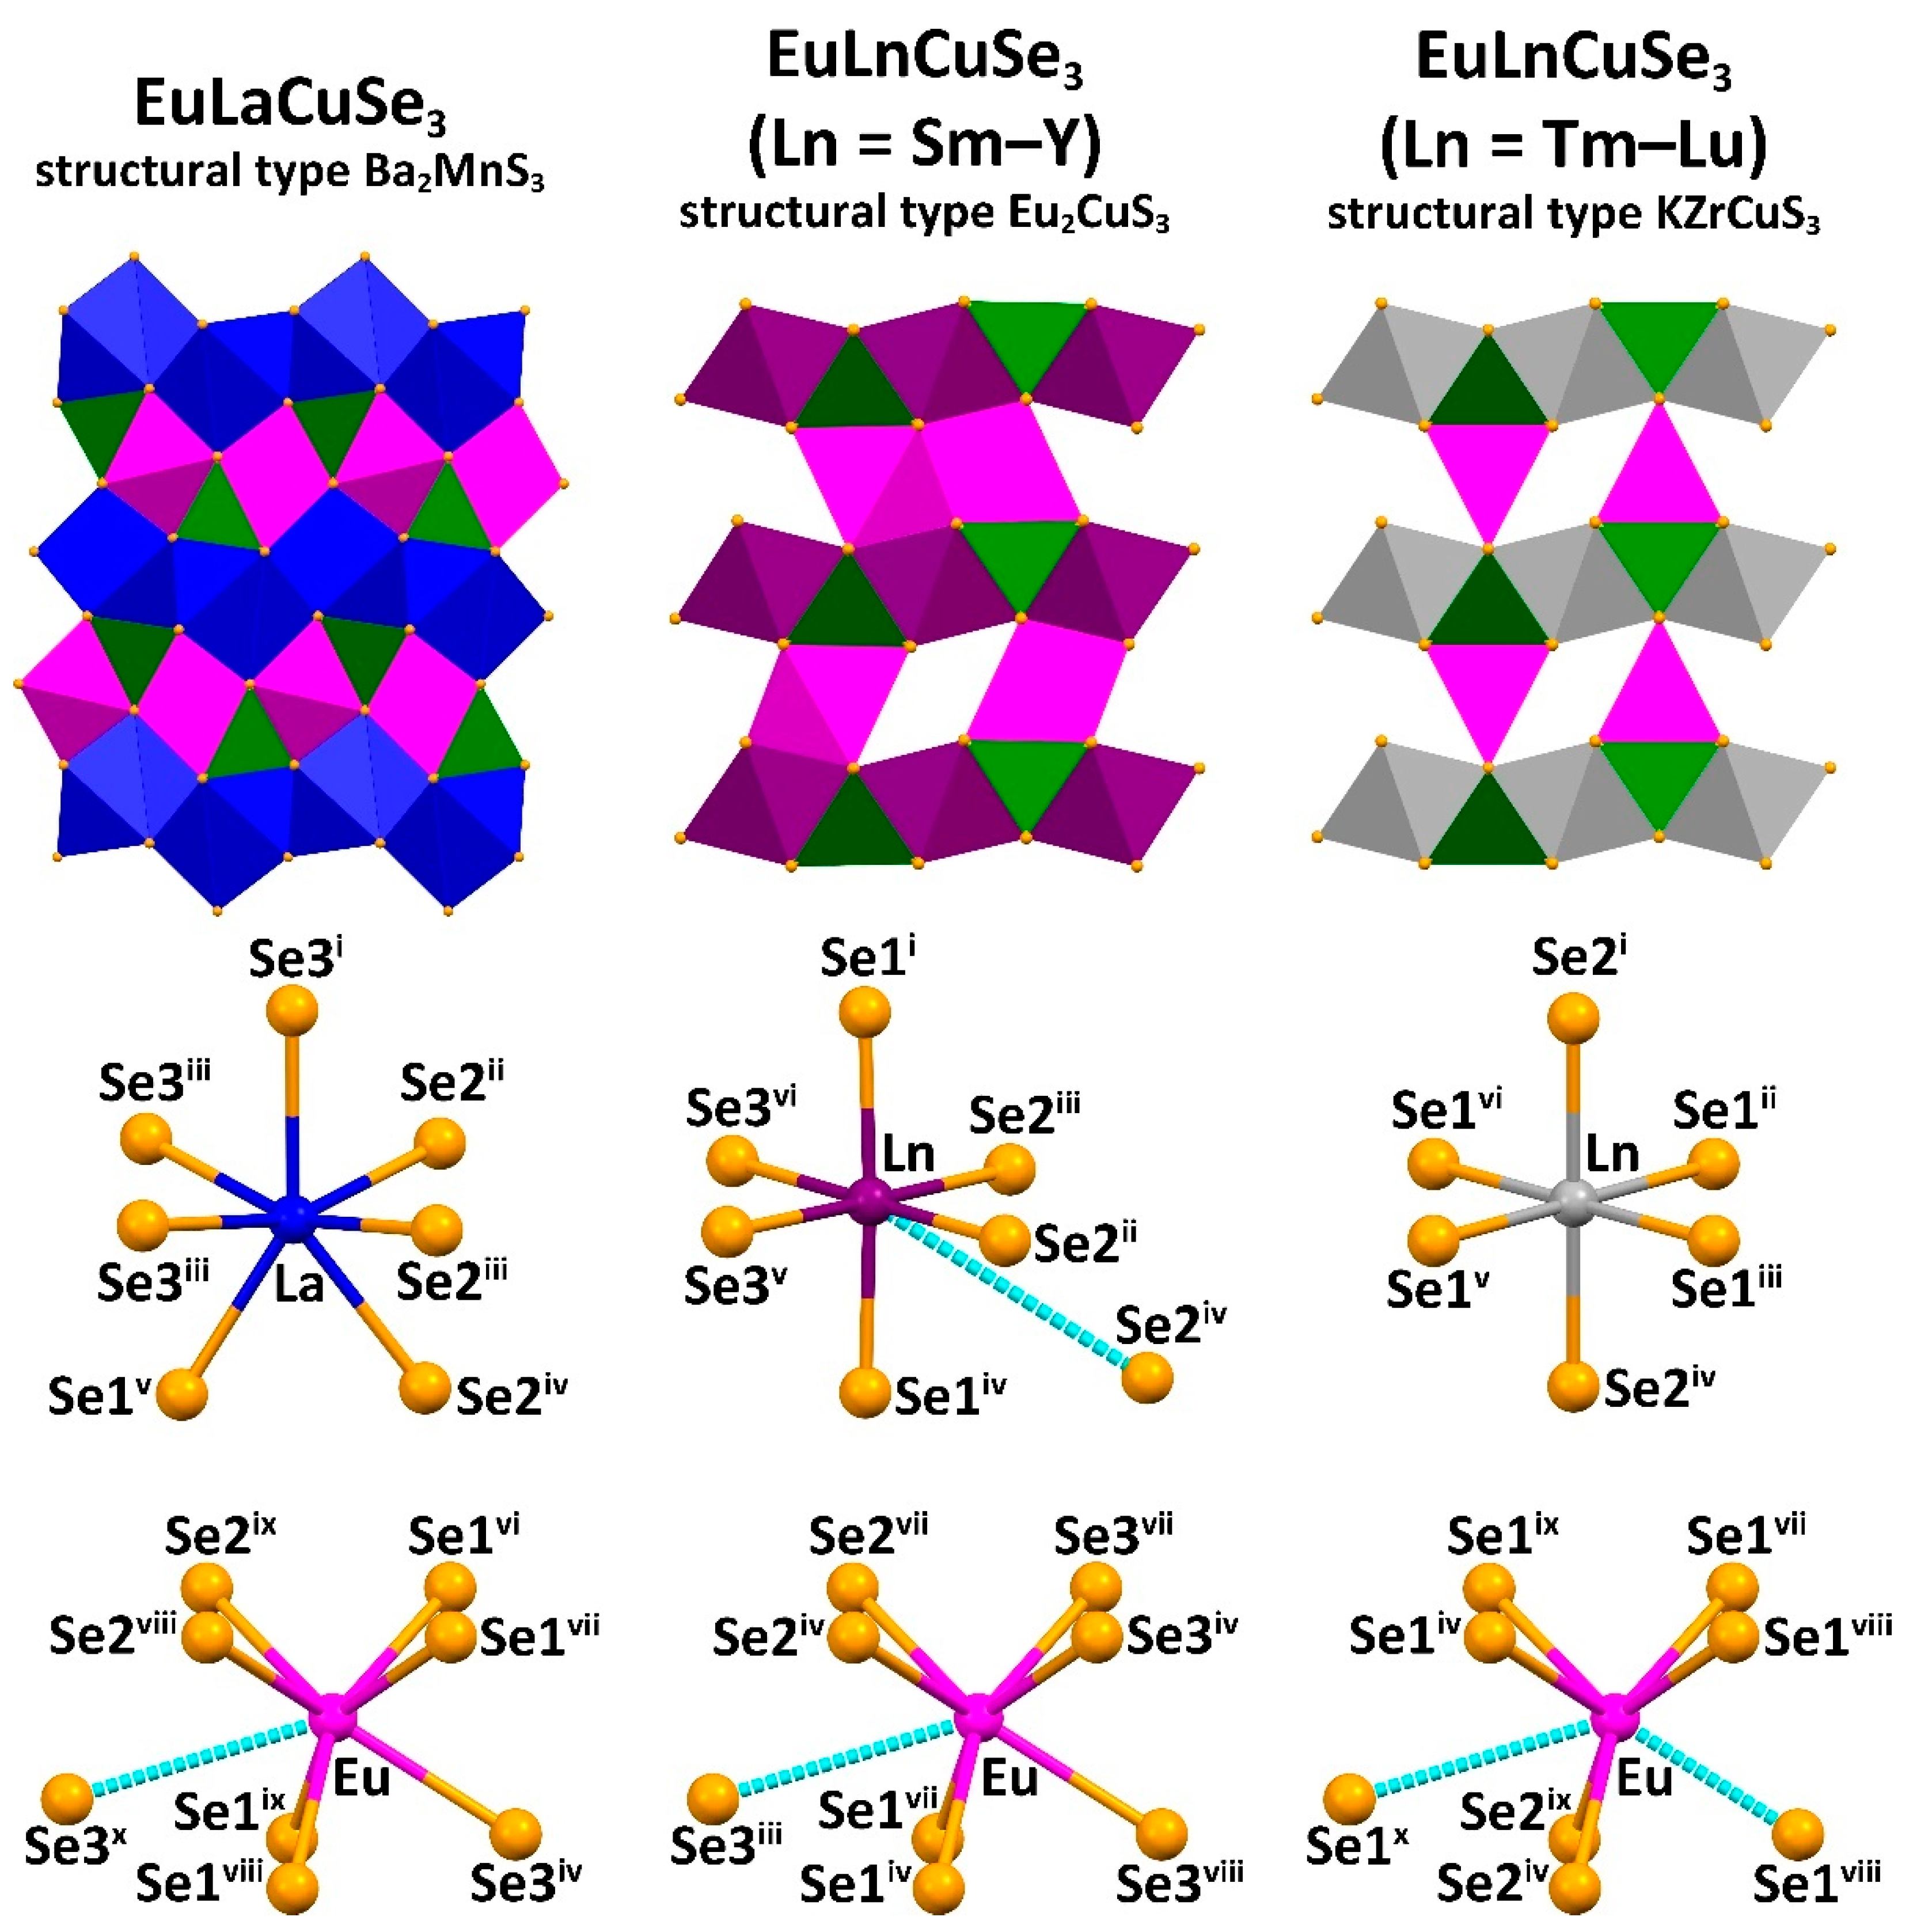
Two types of orthorhombic
Pnma and one type of orthorhombic
Cmcm crystal structures were revealed for EuLnCuSe
3 (
Figure 1 and
Figure 2). Compound EuLaCuSe
3 belongs to the structural type Ba
2MnS
3, while compounds EuLnCuSe
3 (Ln = Sm, Eu [
31], Gd, Tb, Dy, Ho, Y) are isostructural to Eu
2CuS
3. These crystal structures have the same type of symmetry but differ in the system of bonds and coordination of Ln
3+. Finally, selenides EuLnCuSe
3 (Ln = Tm, Yb, Lu) belong to the structural type KZrCuS
3. In all compounds, the Eu
2+ and Ln
3+ cations each occupy two crystallographically independent positions.
The distorted tetrahedra CuSe
4 are linked by vertex atoms yielding polymeric chains along the
b axis for the structural types Ba
2MnS
3 and Eu
2CuS
3, and along the
a axis for the structural type KZrCuS
3. In the structure of EuLaCuSe
3, the polyhedron EuSe
7 is formed from two atoms of Se1
i, two atoms of Se1
ii, two atoms of Se2
i and one atom of Se3 (
Table S4 in the Supplementary Materials) with all the Eu–Se distances being within the calculated sum of ionic radii 3.15–3.18 Å (
rSe
2− = 1.98 Å (coordination number = 6);
rEu
2+ = 1.17 Å (coordination number = 6);
rEu
2+ = 1.20 Å (coordination number = 7) [
61]). The eighth selenide ion is located at a distance that significantly exceeds the sum of ionic radii (>4 Å). The layered structures of EuLnCuSe
3 (Ln = Eu–Lu) are formed by two-dimensional layers [LnCuSe
3] in the
ab plane for EuLnCuSe
3 (Ln = Eu–Y) and in the
ac plane for EuLnCuSe
3 (Ln = Tm–Lu), between which the Eu
2+ ions are located.
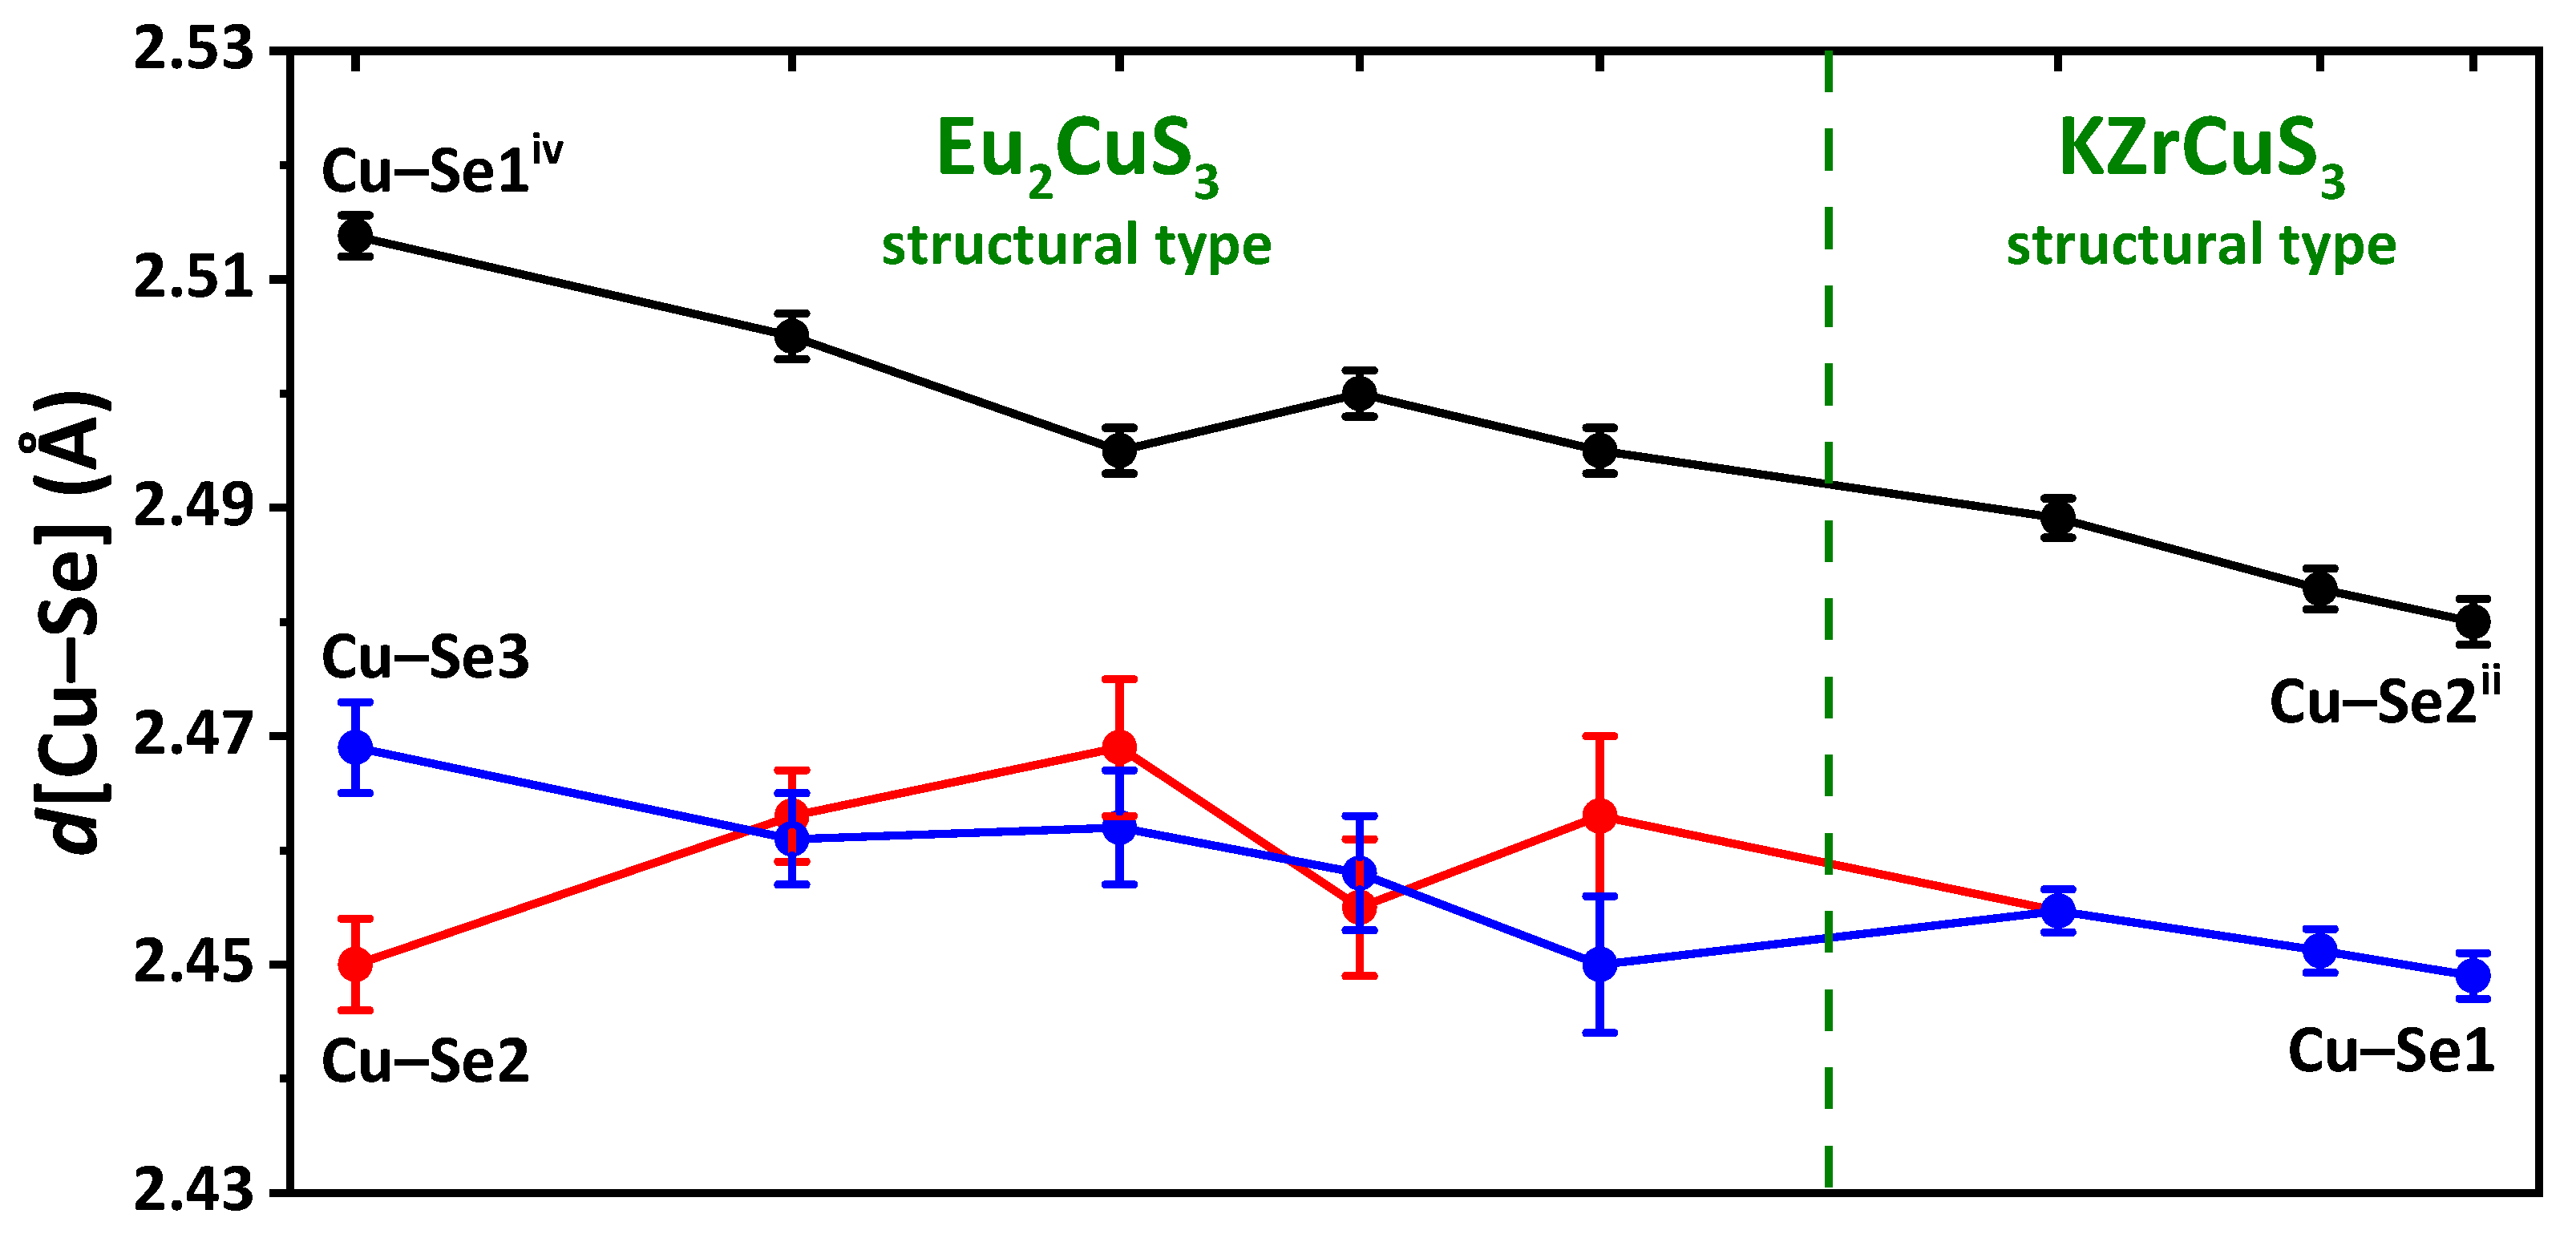
In the EuLnCuSe
3, as the radius
rLn
3+ decreases, the average Ln–Se distance gradually decreases from 3.09(7) Å down to 2.82(1) Å, while the Cu–Se distance remains intact and of 2.46(2)–2.48(3) Å (
Table S4 in the Supplementary Materials). Notably, since the distorted octahedra LnSe
6 are linked into layers with the CuSe
4 tetrahedra, as
rLn
3+ decreases, the crystal-chemical compression of these layers is observed. A decrease in the coordination saturation of the lanthanide cation leads to changes in the coordination polyhedron, structural type and space group (
Figure 1). Particularly, changing the coordination polyhedron from the monocapped trigonal prism LnSe
7 in EuLaCuSe
3 to the LnSe
6 octahedron (Ln = Eu–Y) leads to the change in the structural type Ba
2MnS
3 to Eu
2CuS
3, and the monocapped trigonal prism EuSe
7 in EuLnCuSe
3 (Ln = Eu–Y) to the trigonal prism EuSe
6 in EuLnCuSe
3 (Ln = Tm–Lu) leads to the change in the structural type Eu
2CuS
3 to KZrCuS
3. A similar change in the structural types was observed for SrLnCuSe
3 (Ln = La–Lu) [
26,
27,
28,
36,
42] and EuLnCuS
3 [
10]. Thus, the change in the structural type in EuLnCuSe
3 is dictated by the size of the Ln
3+ cation.
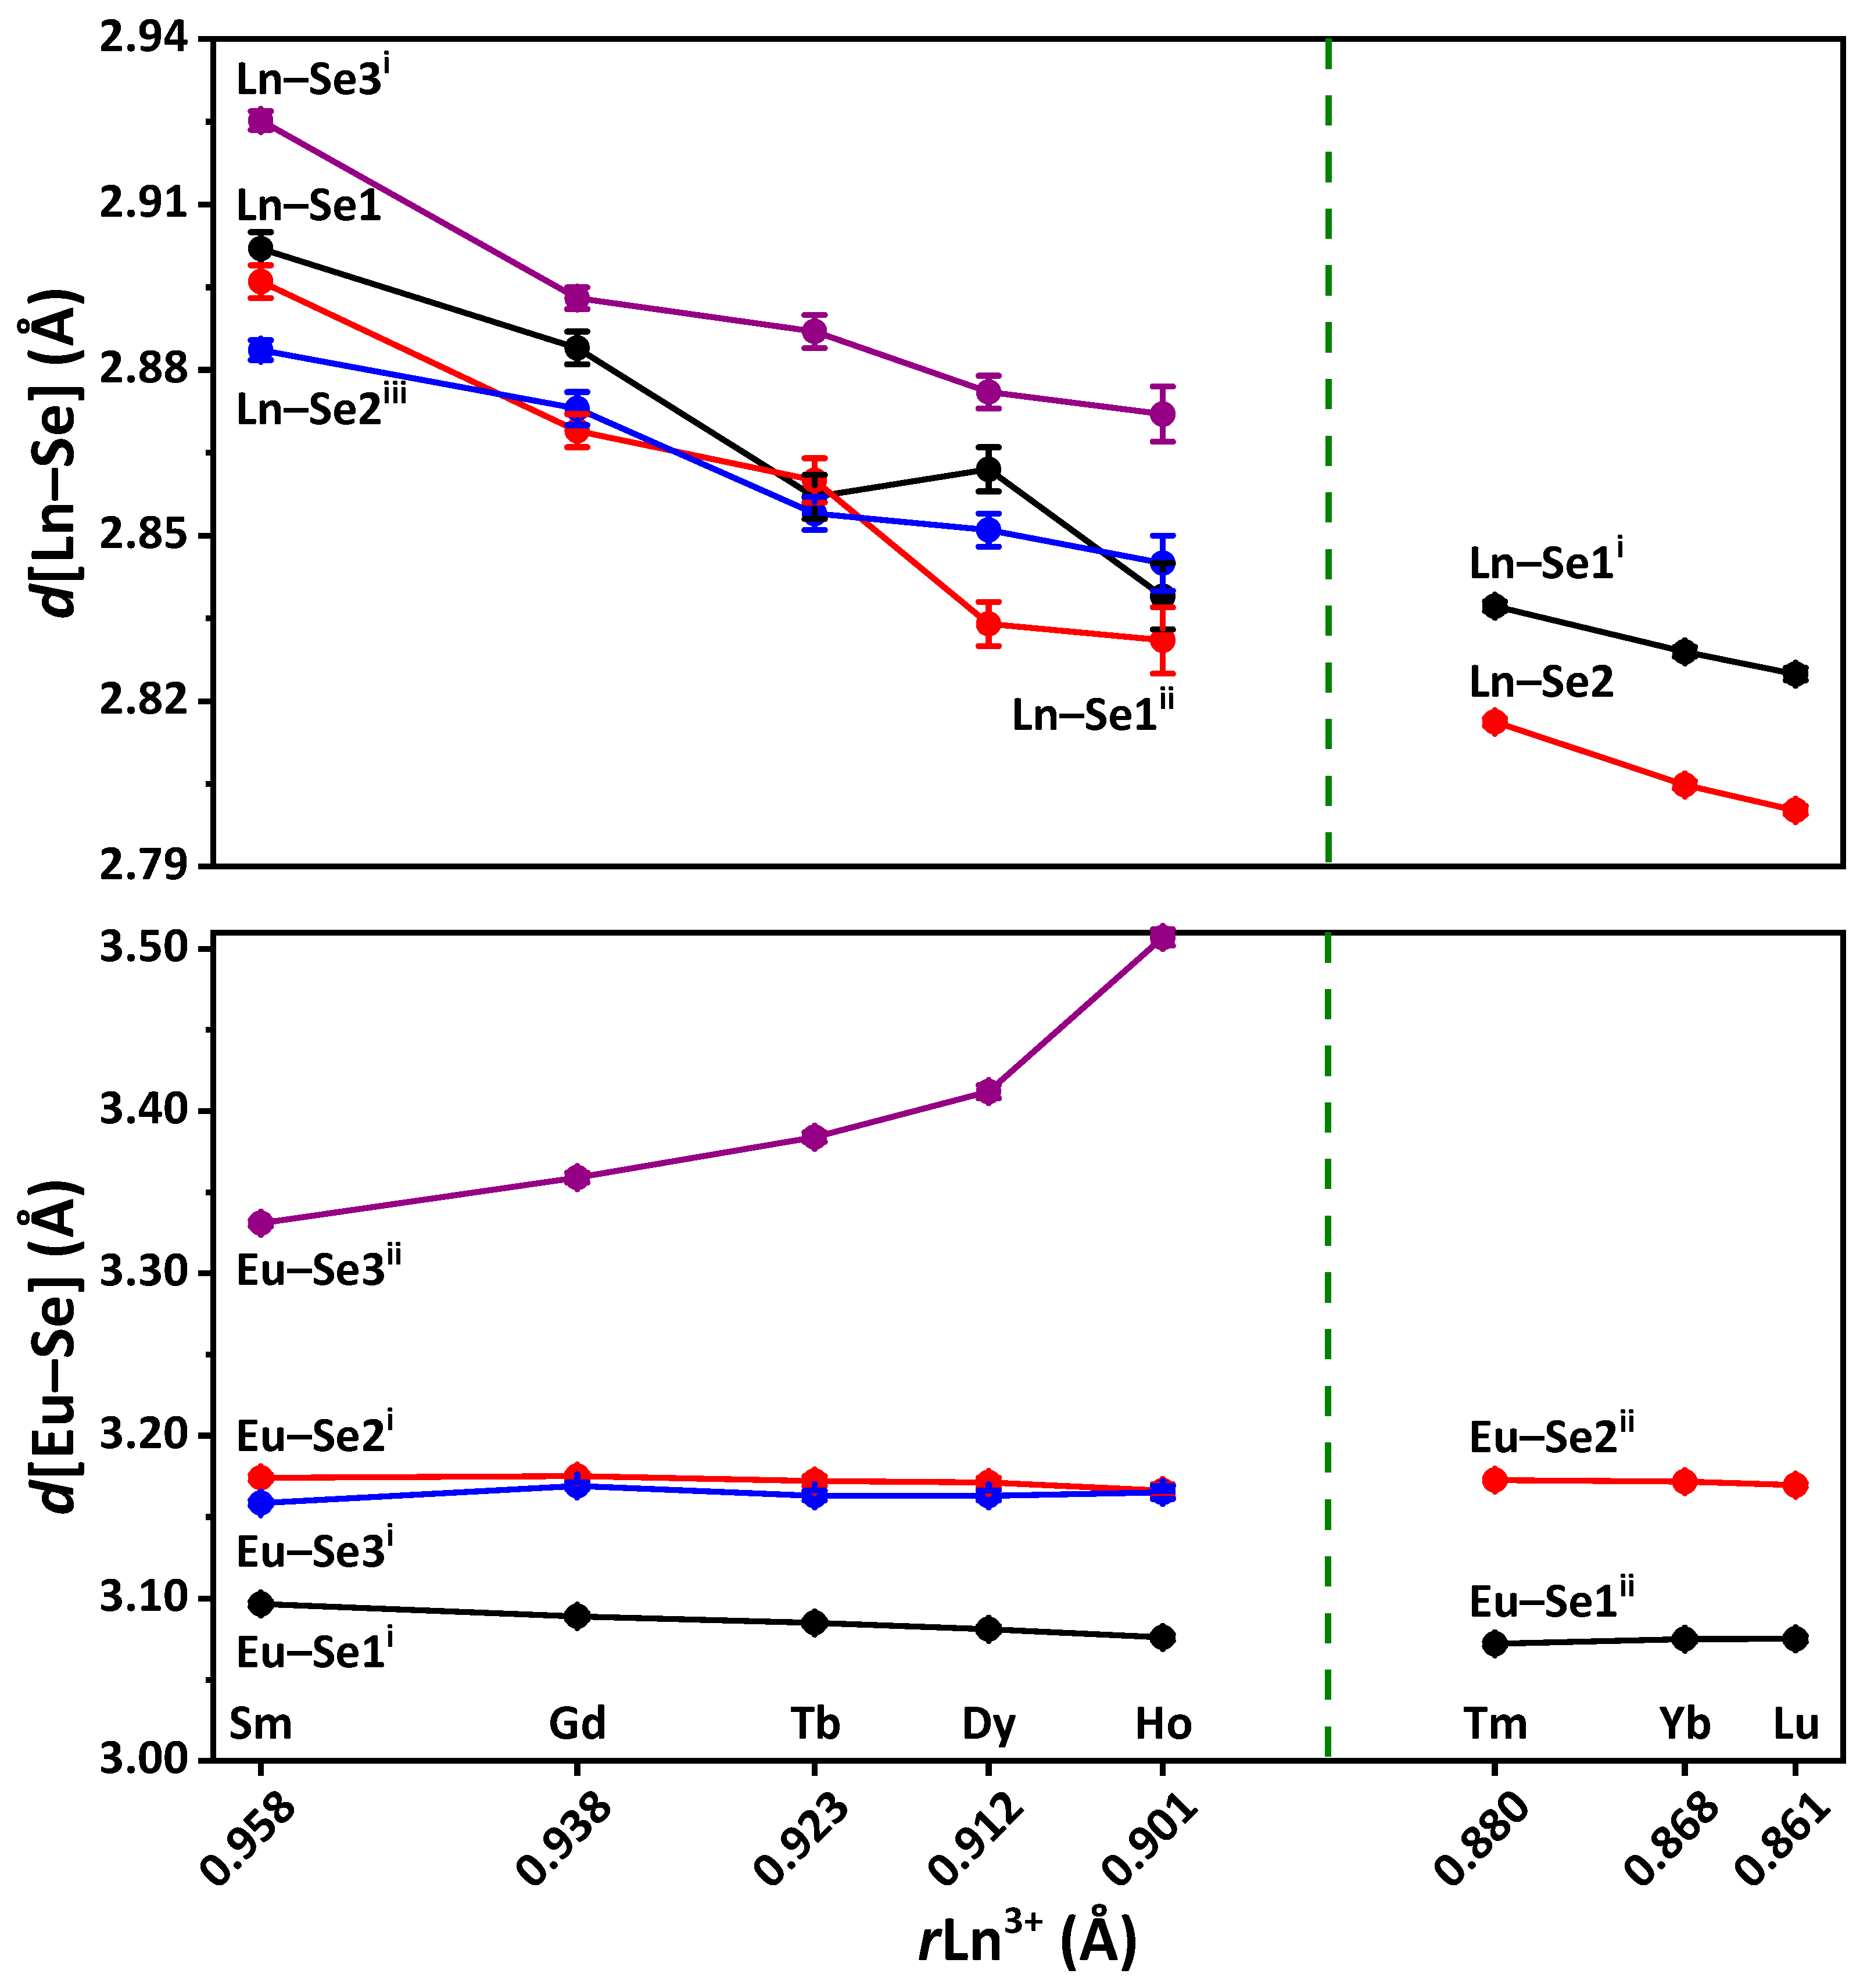
In the structures of EuLnCuSe
3 (Ln = Sm, Gd, Tb, Dy, Ho, Y; structural type Eu
2CuS
3), six Eu–Se distances, namely two Eu–Se1
i, two Eu–Se2
i and two Eu–Se3
i, are shorter than 3.2 Å, while the seventh and the longest distance Eu–Se3
ii gradually increases in the following sequence: 3.331 Å (EuSmCuSe
3) → 3.359 Å (EuGdCuSe
3) → 3.384 Å (EuTbCuSe
3) → 3.412 Å (EuDyCuSe
3) → 3.424 Å (EuYCuSe
3) → 3.507 Å (EuHoCuSe
3) (
Figure 3,
Table S4 in the Supplementary Materials). A similar trend was observed for isostructural compounds EuLnCuS
3 [
10] and SrLnCuS
3 [
67].
In the structures of EuLnCuSe
3 (Ln = Tm, Yb, Lu; structural type KZrCuS
3), six Eu–Se distances, namely four Eu–Se1
ii and two Eu–Se2
ii, are also shorter than 3.2 Å, while two more separations Eu–Se1 are longer than 3.55 Å and, thus, are not included in the coordination sphere of the metal ion (
Figure 1,
Table S4 in the Supplementary Materials).
In compounds EuLnCuSe
3 (Ln = La–Lu), the unit cell parameters
b (space group
Pnma) and
a (space group
Cmcm) decrease. The parameters
a (space group
Pnma) and
c (space group
Cmcm) also decrease within each structural type of EuLnCuSe
3 (Ln = Sm–Ho) and EuLnCuSe
3 (Ln = Tm–Lu). The unit cell parameters
a and
c (space group
Pnma) upon the changing of the structural type from Ba
2MnS
3 to Eu
2CuS
3 abruptly increase and decrease, respectively. The unit cell volume changes from EuHoCuSe
3 to EuTmCuSe
3 smoothly, despite the change in symmetry. A similar process was observed for isomorphic compounds ALnMX
3 (A = Sr, Eu, Ba; M = Cu, Ag; X = S, Se, Te) [
25,
29,
68]. All these changes clearly testify to morphotropy in a series of the reported EuLnCuSe
3 compounds.
Despite that EuYCuSe
3 belongs to the same structural type as EuLnCuSe
3 (Ln = Sm–Ho), and the yttrium ion radius is less than that of holmium, the unit cell parameters of the yttrium-based selenide are larger than those for EuDyCuSe
3 and EuHoCuSe
3, which is in agreement with the data obtained for isostructural quaternary sulfides ALnCuS
3 (A = Sr, Eu) [
10,
42,
68,
69]. This can be explained by the electronic structure of yttrium, which is a
d-element.
In general, the EuLnCuSe
3 compounds are isostructural to EuLnCuS
3 [
10]. When selenium is included instead of sulfur, the anionic sublattice expands, since selenium is a larger anion. A comparison of sulfide and selenide analogues EuLnCuX
3 (X = S, Se, Ln = La–Lu, Y) allows the reveal of the formation of different types of crystal structures with the same rare-earth metals (
Figure 4). Particularly, SrYCuS
3 and SrHoCuS
3 crystallize in space group
Pnma, while their selenide derivatives crystallize in space group
Cmcm (
Figure 4) [
28,
42,
53,
69].
In the structures of SrYCuSe
3 and EuYCuSe
3, the Sr
2+ and Eu
2+ ions exhibit different coordination polyhedra. Compound SrYCuSe
3 contains the SrSe
6 polyhedron with the most pronounced ionic character of the included atoms, having a local symmetry of 43
m (highly symmetric coordination), while EuYCuSe
3 contains the EuSe
7 polyhedron with a less pronounced ionic character of atoms, with the
mm2 symmetry (less symmetric coordination). As the ionic radius of the lanthanide
rLn
3+ decreases in ALnCuSe
3, the formation of a highly symmetric coordination of A
2+ occurs earlier in SrLnCuSe
3 than in EuLnCuSe
3. Particularly, SrSe
7 (
Pnma) transforms into SrSe
6 (
Cmcm) from Dy to Ho [
42], while the change in the coordination polyhedron of europium occurs later, viz. from Y to Er. A similar process was an observed trend for ALnCuS
3 (A = Eu, Sr) [
10,
42]. In SrLnCuS
3 and SrLnCuS
3, for example, the change in the strontium and europium coordination polyhedra is observed from Y to Er and from Er to Tm, respectively [
10,
42]. This is due to the more pronounced ionic characteristics of the alkaline earth elements in comparison with the rare earth metals.
Thus, with an increase in the degree of ionicity of the A2+–X bond, as well as the A2+ radius, the number of compounds, crystallized in the Cmcm space group, increases, and the A2+ ions become six-coordinated earlier.
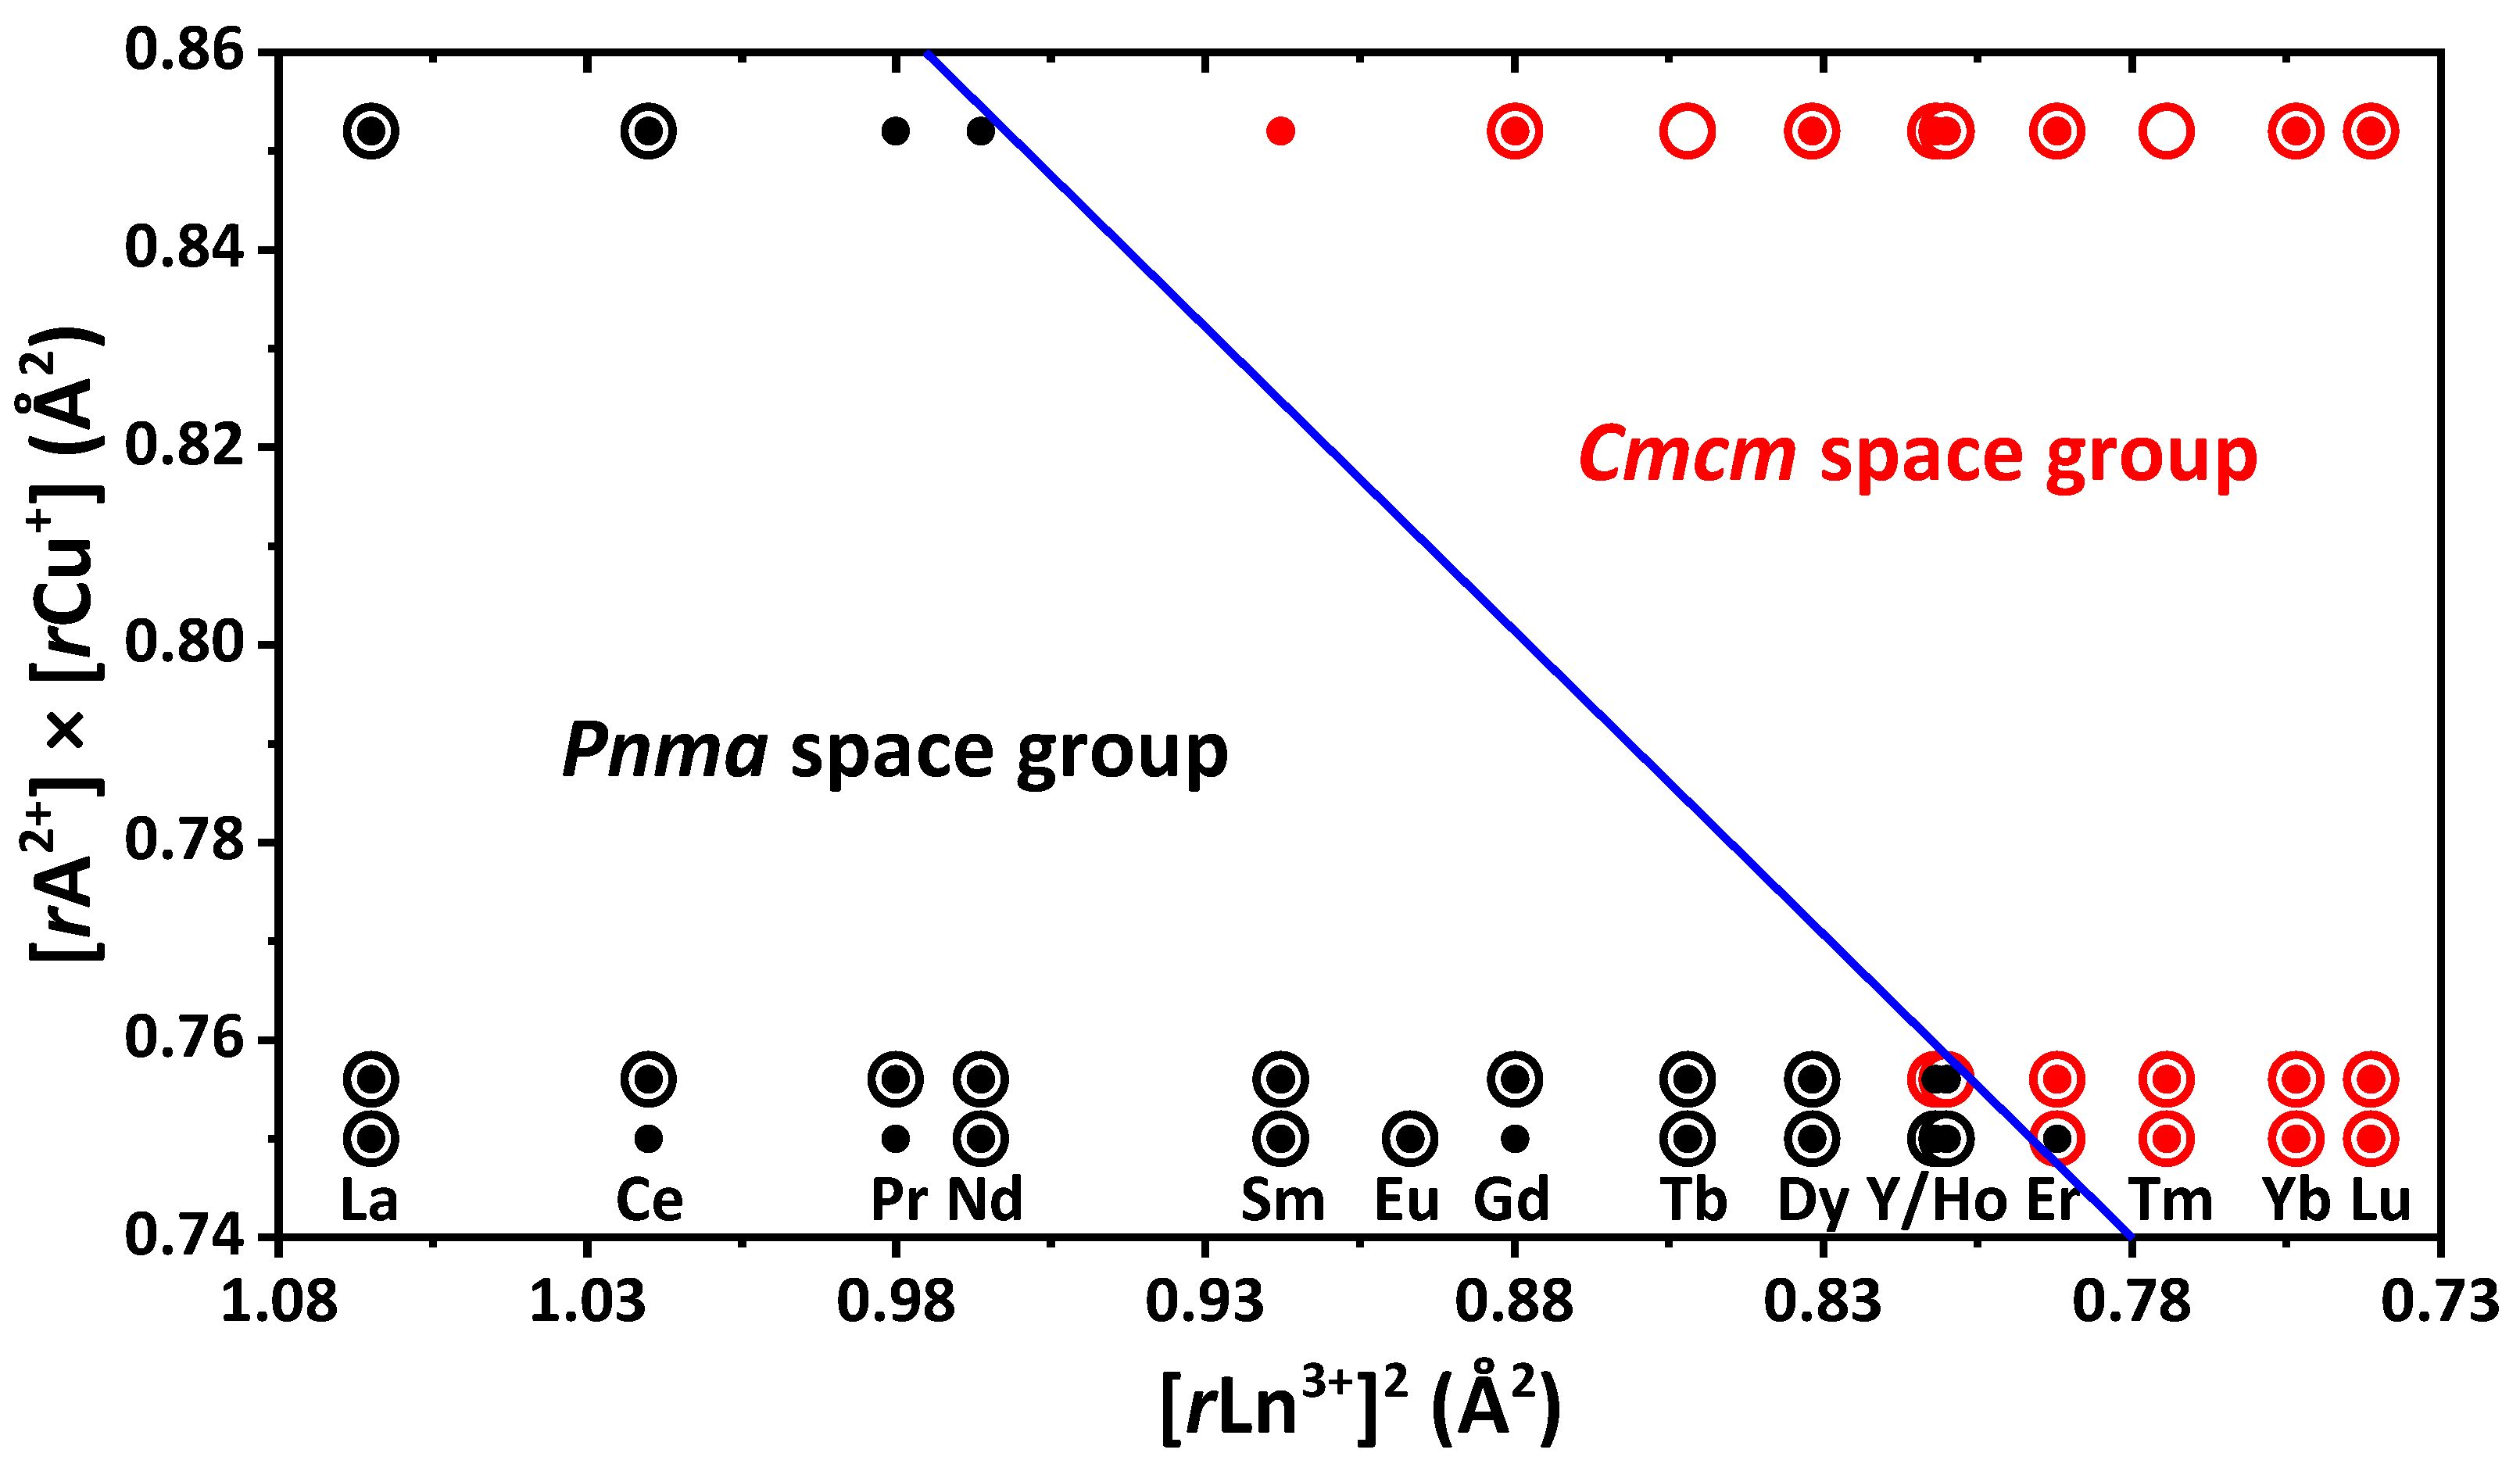
To separate orthorhombic space groups
Cmcm and
Pnma in sulfides ALnCuS
3 (A = Sr, Eu, Ba) clearly, the tolerance factor t′ = [
rA
2+] × [
rCu
+] + a × [
rLn
3+]
2 (a = −0.6, critical value of t′ = 0.28) was applied [
10,
70]. The experimental data on selenides ALnCuSe
3 obtained here allow for checking the formula for these compounds. Considering the data on both sulfides and selenides, the adjusted value of the tolerance factor is 0.273. A slight change in the value of t′ confirms the previous assumption that the change in the space group of compounds ALnCuX
3 is almost independent on the ionic radius of the chalcogen, but depends on the ionic radii of A
2+, Ln
3+ and Cu
+ [
70]. We assume that studying new compounds ALnCuX
3 (X = S, Se; A is an element with an ionic radius in the range of 1.2 Å (
rEu
2+) < (
rA
2+) < 1.35 Å (
rBa
2+)), the value of t′ can vary in the range from 0.273 to 0.285.
Thus, our results on the crystal structures of the reported quaternary selenides are in full agreement with the previously established structural types for compounds of the type A
2+Ln
3+Cu
+1X
3 (A = Eu, Sr, Pb, Ba; X = S, Se) [
8]. Furthermore, the formation of the most symmetric structure of the type KZrCuS
3 with the decreasing of
rLn
3+ and decreasing of the distortion of two-dimensional [LnCuSe
3] layers in a series of the discussed compounds is also confirmed.
In compounds EuLnCuS
3, the europium ion is Eu
2+ [
11,
68,
71]. An insignificant structural difference also anticipates a similarity of charges in EuLnCuX
3 (X = S, Se). The bond valence sum calculation is frequently used as an efficient tool to estimate the oxidation states of atoms.
The oxidation states of the Eu, Ln and Cu ions in EuLnCuSe
3 are close to 2, 3 and 1, respectively (
Table S7 in the Supplementary Materials). This is in agreement with the data for Eu
2CuSe
3 on the presence of both Eu
2+ and Eu
3+ [
31]. Moreover, the Eu
3+ ion occupies the same position in Eu
2+Eu
3+CuSe
3 as Ln
3+ in EuLnCuSe
3.
2.4. Phonon, Raman and IR Spectra
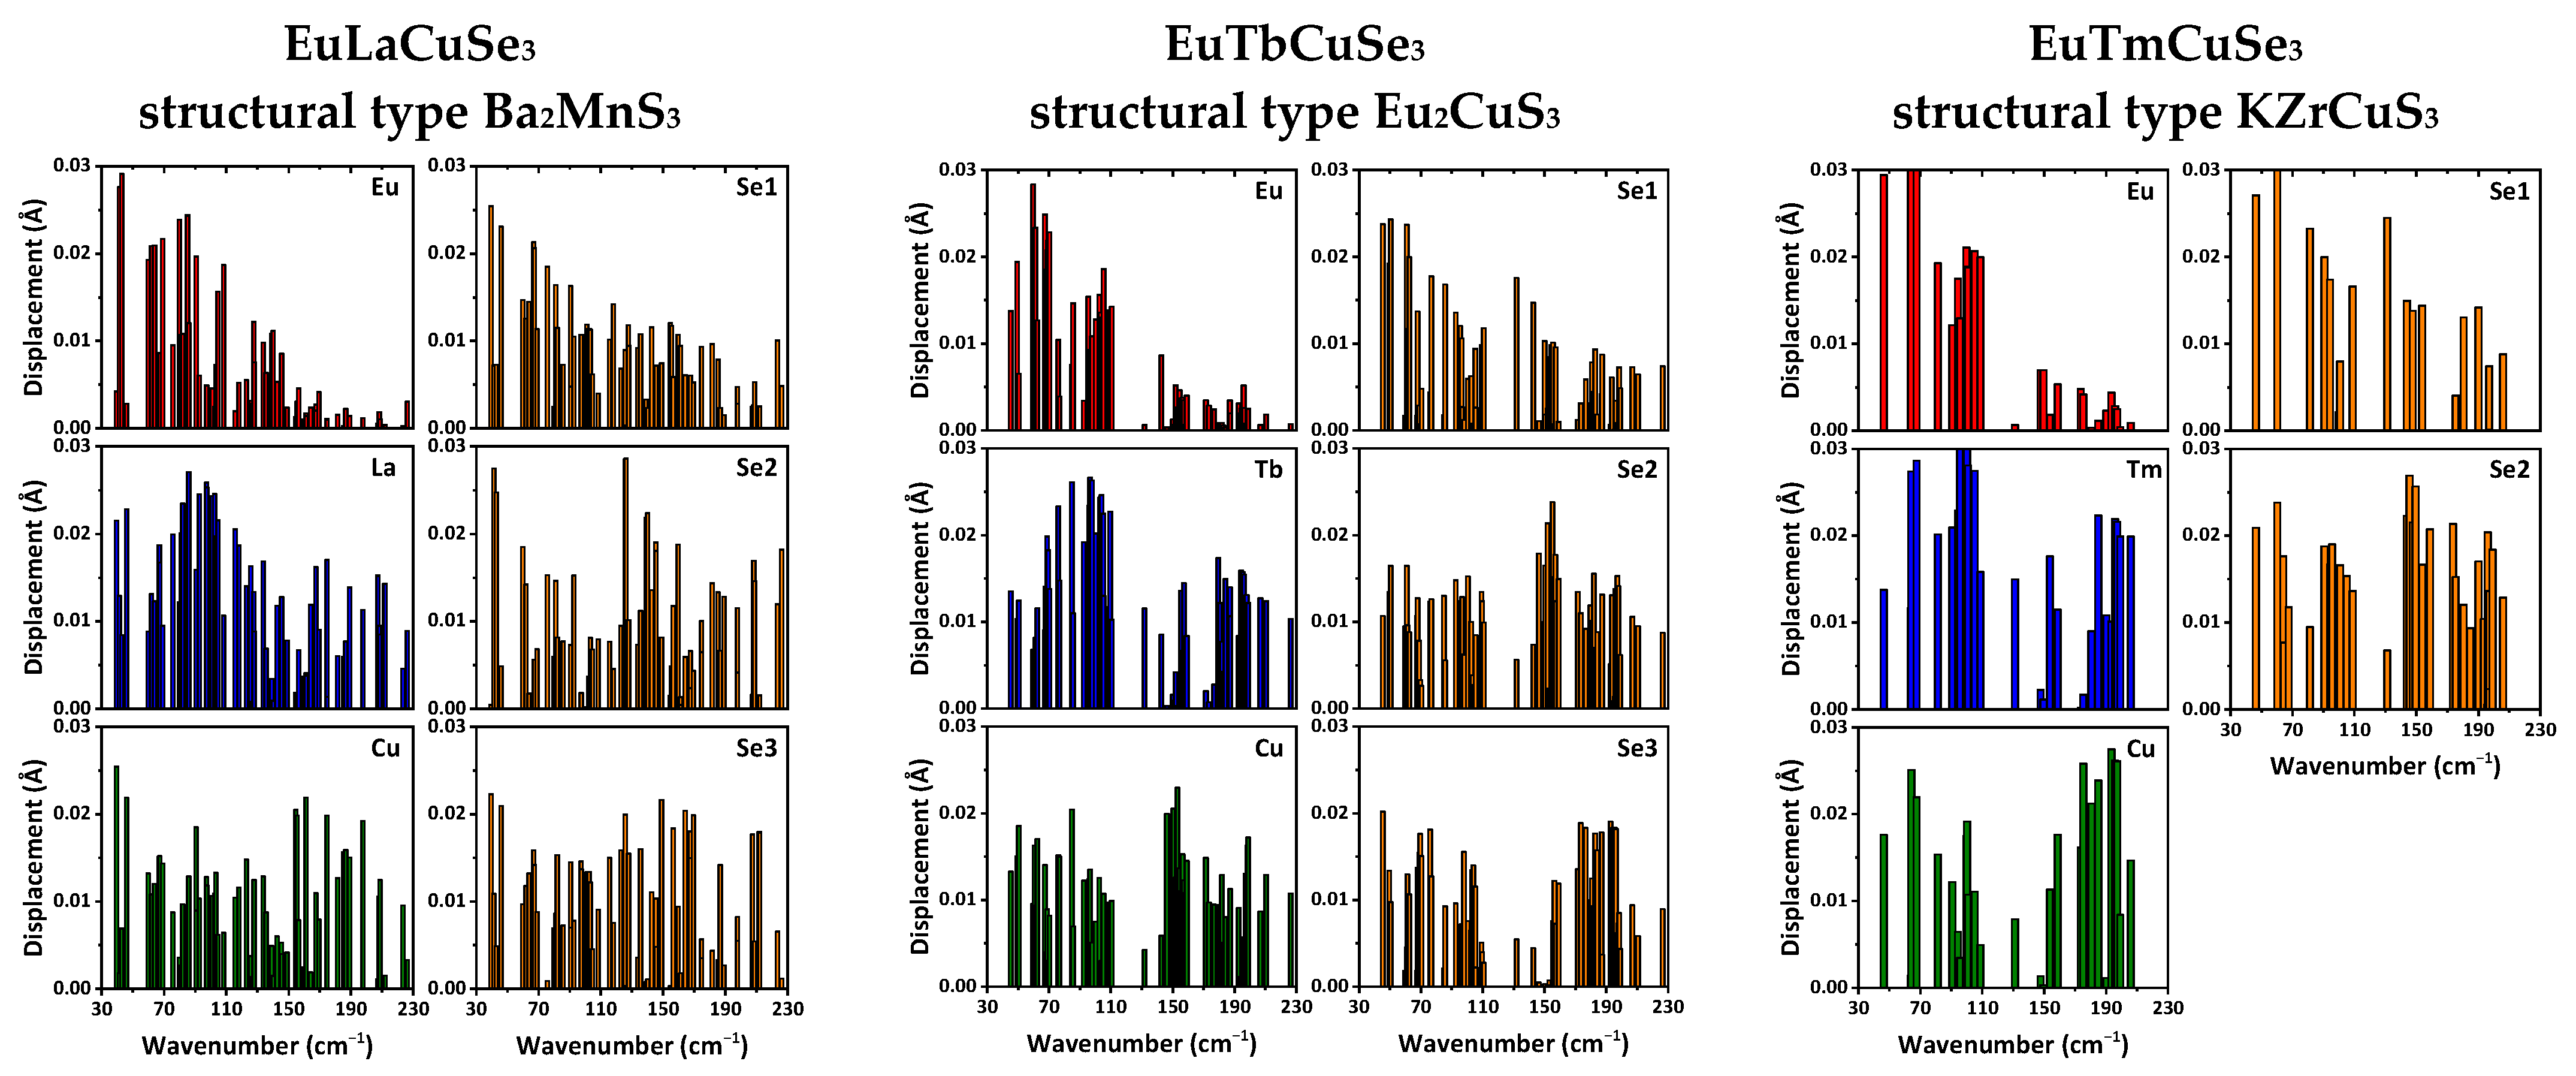
According to the obtained results, the phonon wavenumbers at the Γ-point do not exceed 230 cm
−1. In this range, not only light ions of selenium and copper but also heavy rare-earth ions are actively involved. In crystals of EuLnCuSe
3 with a structural type of Ba
2MnS
3, the europium ions actively participate in modes with wavenumbers up to about 150 cm
−1, while for the structural types of Eu
2CuS
3 and KZrCuS
3, the europium ions participate in modes with wavenumbers up to about 110 cm
−1, respectively (
Figure 6). Both the Ln
2+ and selenium ions are involved in almost all modes for all the reported structural types (
Figure 6).
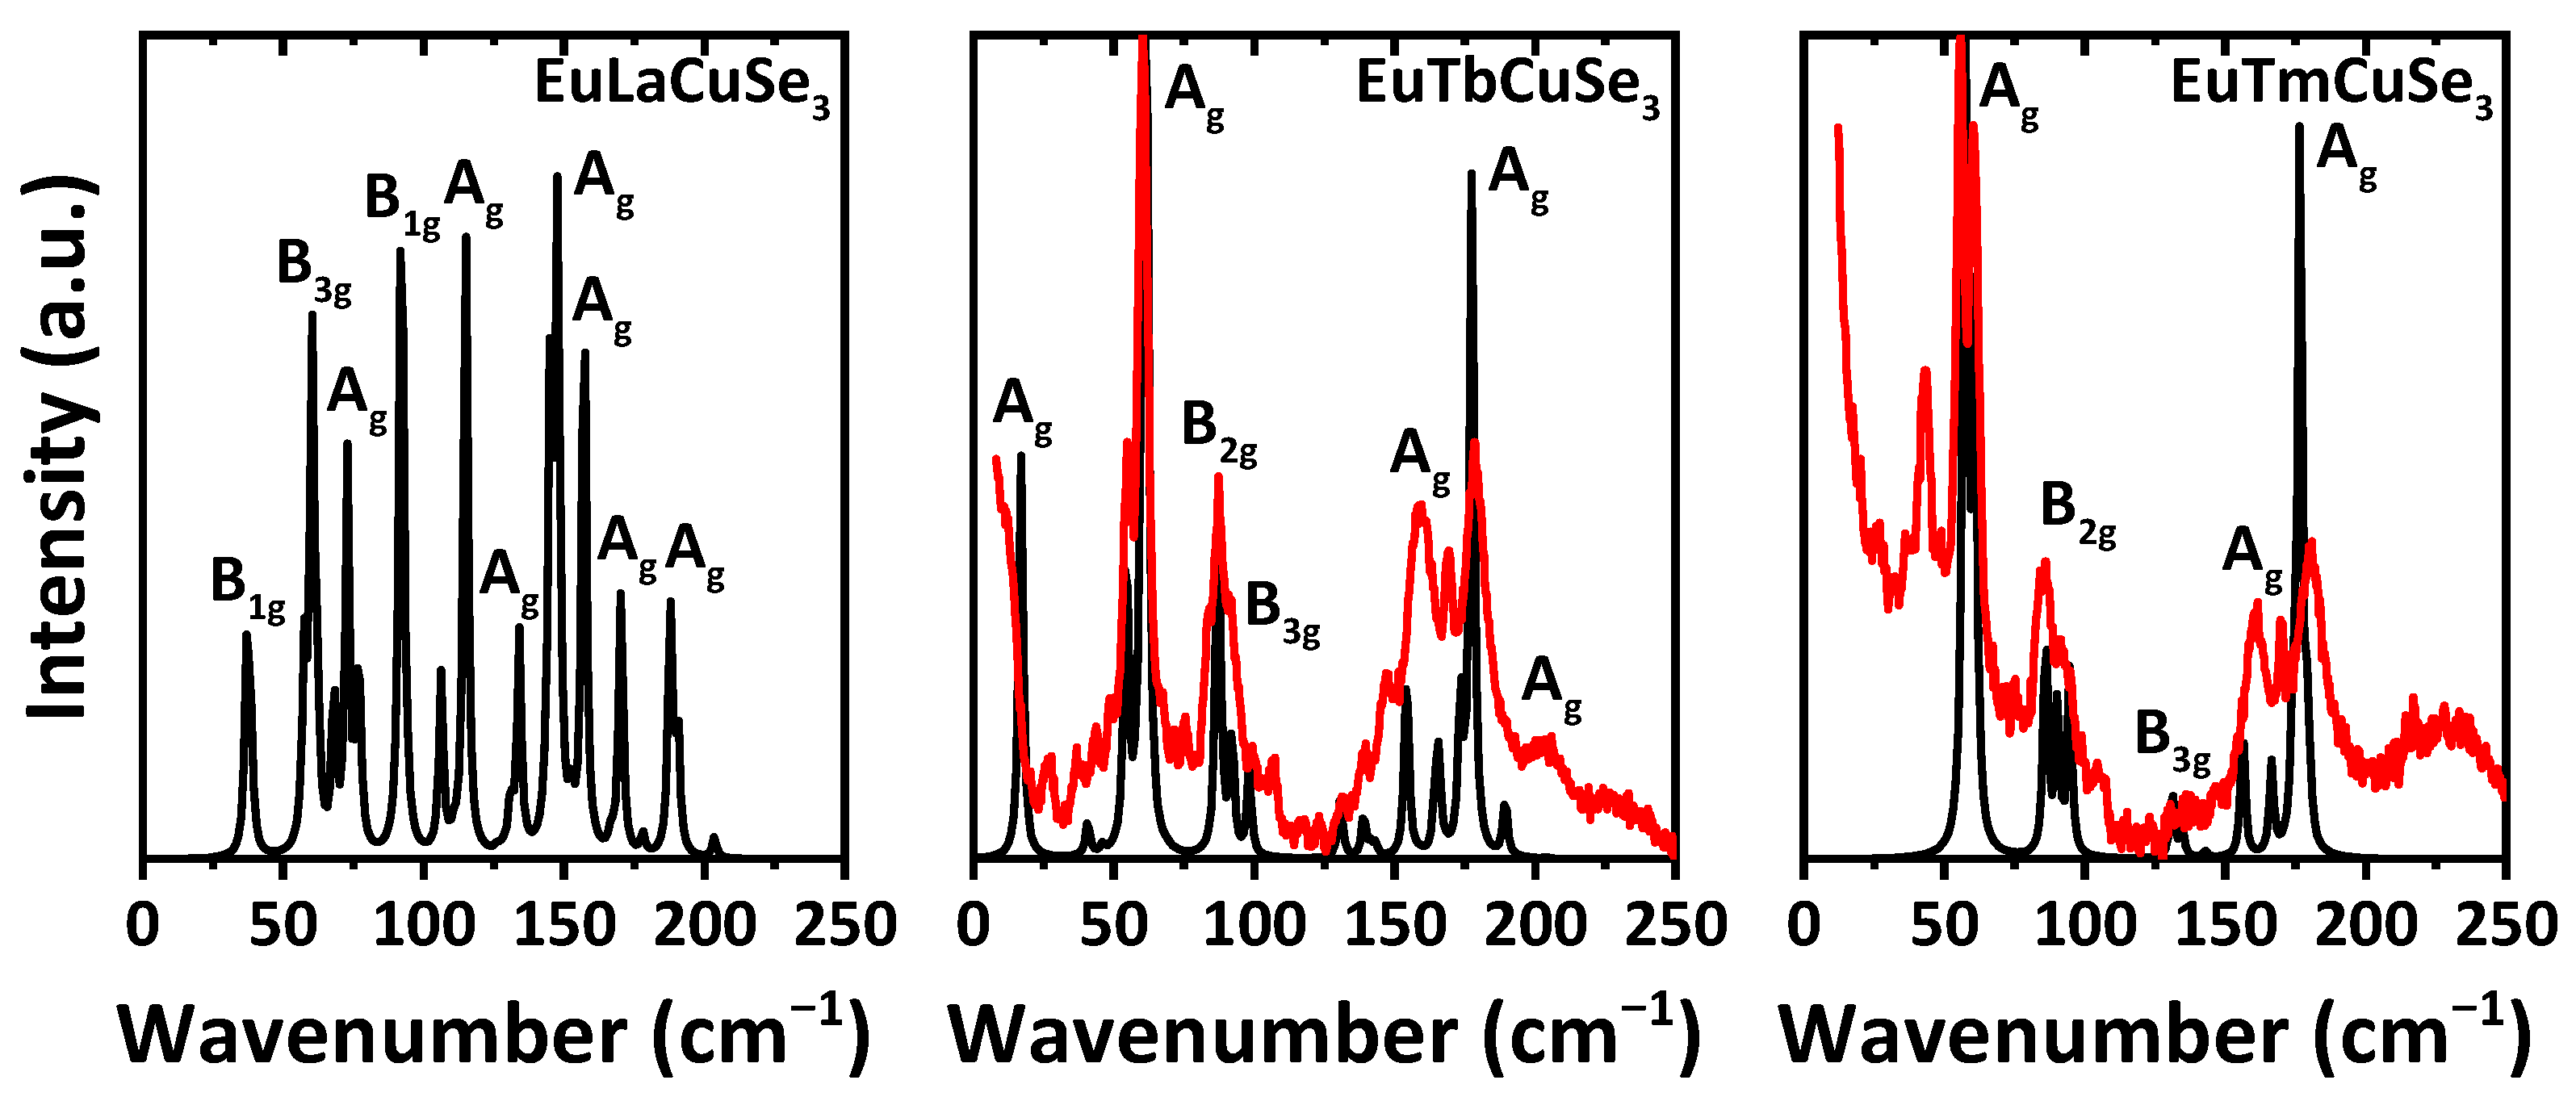
Unfortunately, contrarily to the corresponding sulfide analogues [
9,
11], we faced problems collecting Raman spectra for some of the reported selenides, and our numerous attempts failed. This can be explained by the narrower bandgap and sequent high absorption at the wavelengths of excitation and of the scattered Raman signal. As a result, we were able to record the Raman spectra for EuTbCuSe
3 and EuTmCuSe
3 (
Figure 7). Both the experimental and calculated Raman spectra, obtained using the PBE0 functional, for three typical representatives of each structural types of the reported selenides, namely EuLaCuSe
3 (structural type Ba
2MnS
3), EuTbCuSe
3 (structural type Eu
2CuS
3) and EuTmCuSe
3 (structural type KZrCuS
3), exhibit bands exclusively in the region up to about 250 cm
−1 (
Figure 7). Notably, the experimental and calculated spectra of the latter two compounds are pairwise very similar with the most intensive bands at about 60 and 180 cm
−1, each corresponding to active A
g modes. However, the spectrum of EuTbCuSe
3 contains an additional clearly visible band at about 15 cm
−1 also due to the A
g mode (
Figure 7). Both spectra further exhibit bands from B
2g and B
3g modes. Notably, the experimental spectrum of EuTmCuSe
3 exhibits an additional clearly defined band at about 45 cm
−1 (
Figure 7). We can tentatively assign the origin of this band to the Raman active mode of the Tm
4Se
3O
4 impurity. Unfortunately, our numerous attempts to calculate the Raman spectrum of Tm
4Se
3O
4 failed and was found to be highly time-consuming, which can be explained by the nonstoichiometric occupancy of the selenium ions.
Interestingly, the calculated spectrum of EuLaCuSe
3 is characterized by a noticeably larger number of bands (
Figure 7). An overwhelming majority of these bands are due to A
g modes, with the most intensive one at about 150 cm
−1, accompanied with two bands at about 60 and 90 cm
−1, arising from B
3g and B
1g modes, respectively, and one band at about 115 cm
−1, corresponding to the A
1g mode (
Figure 7).
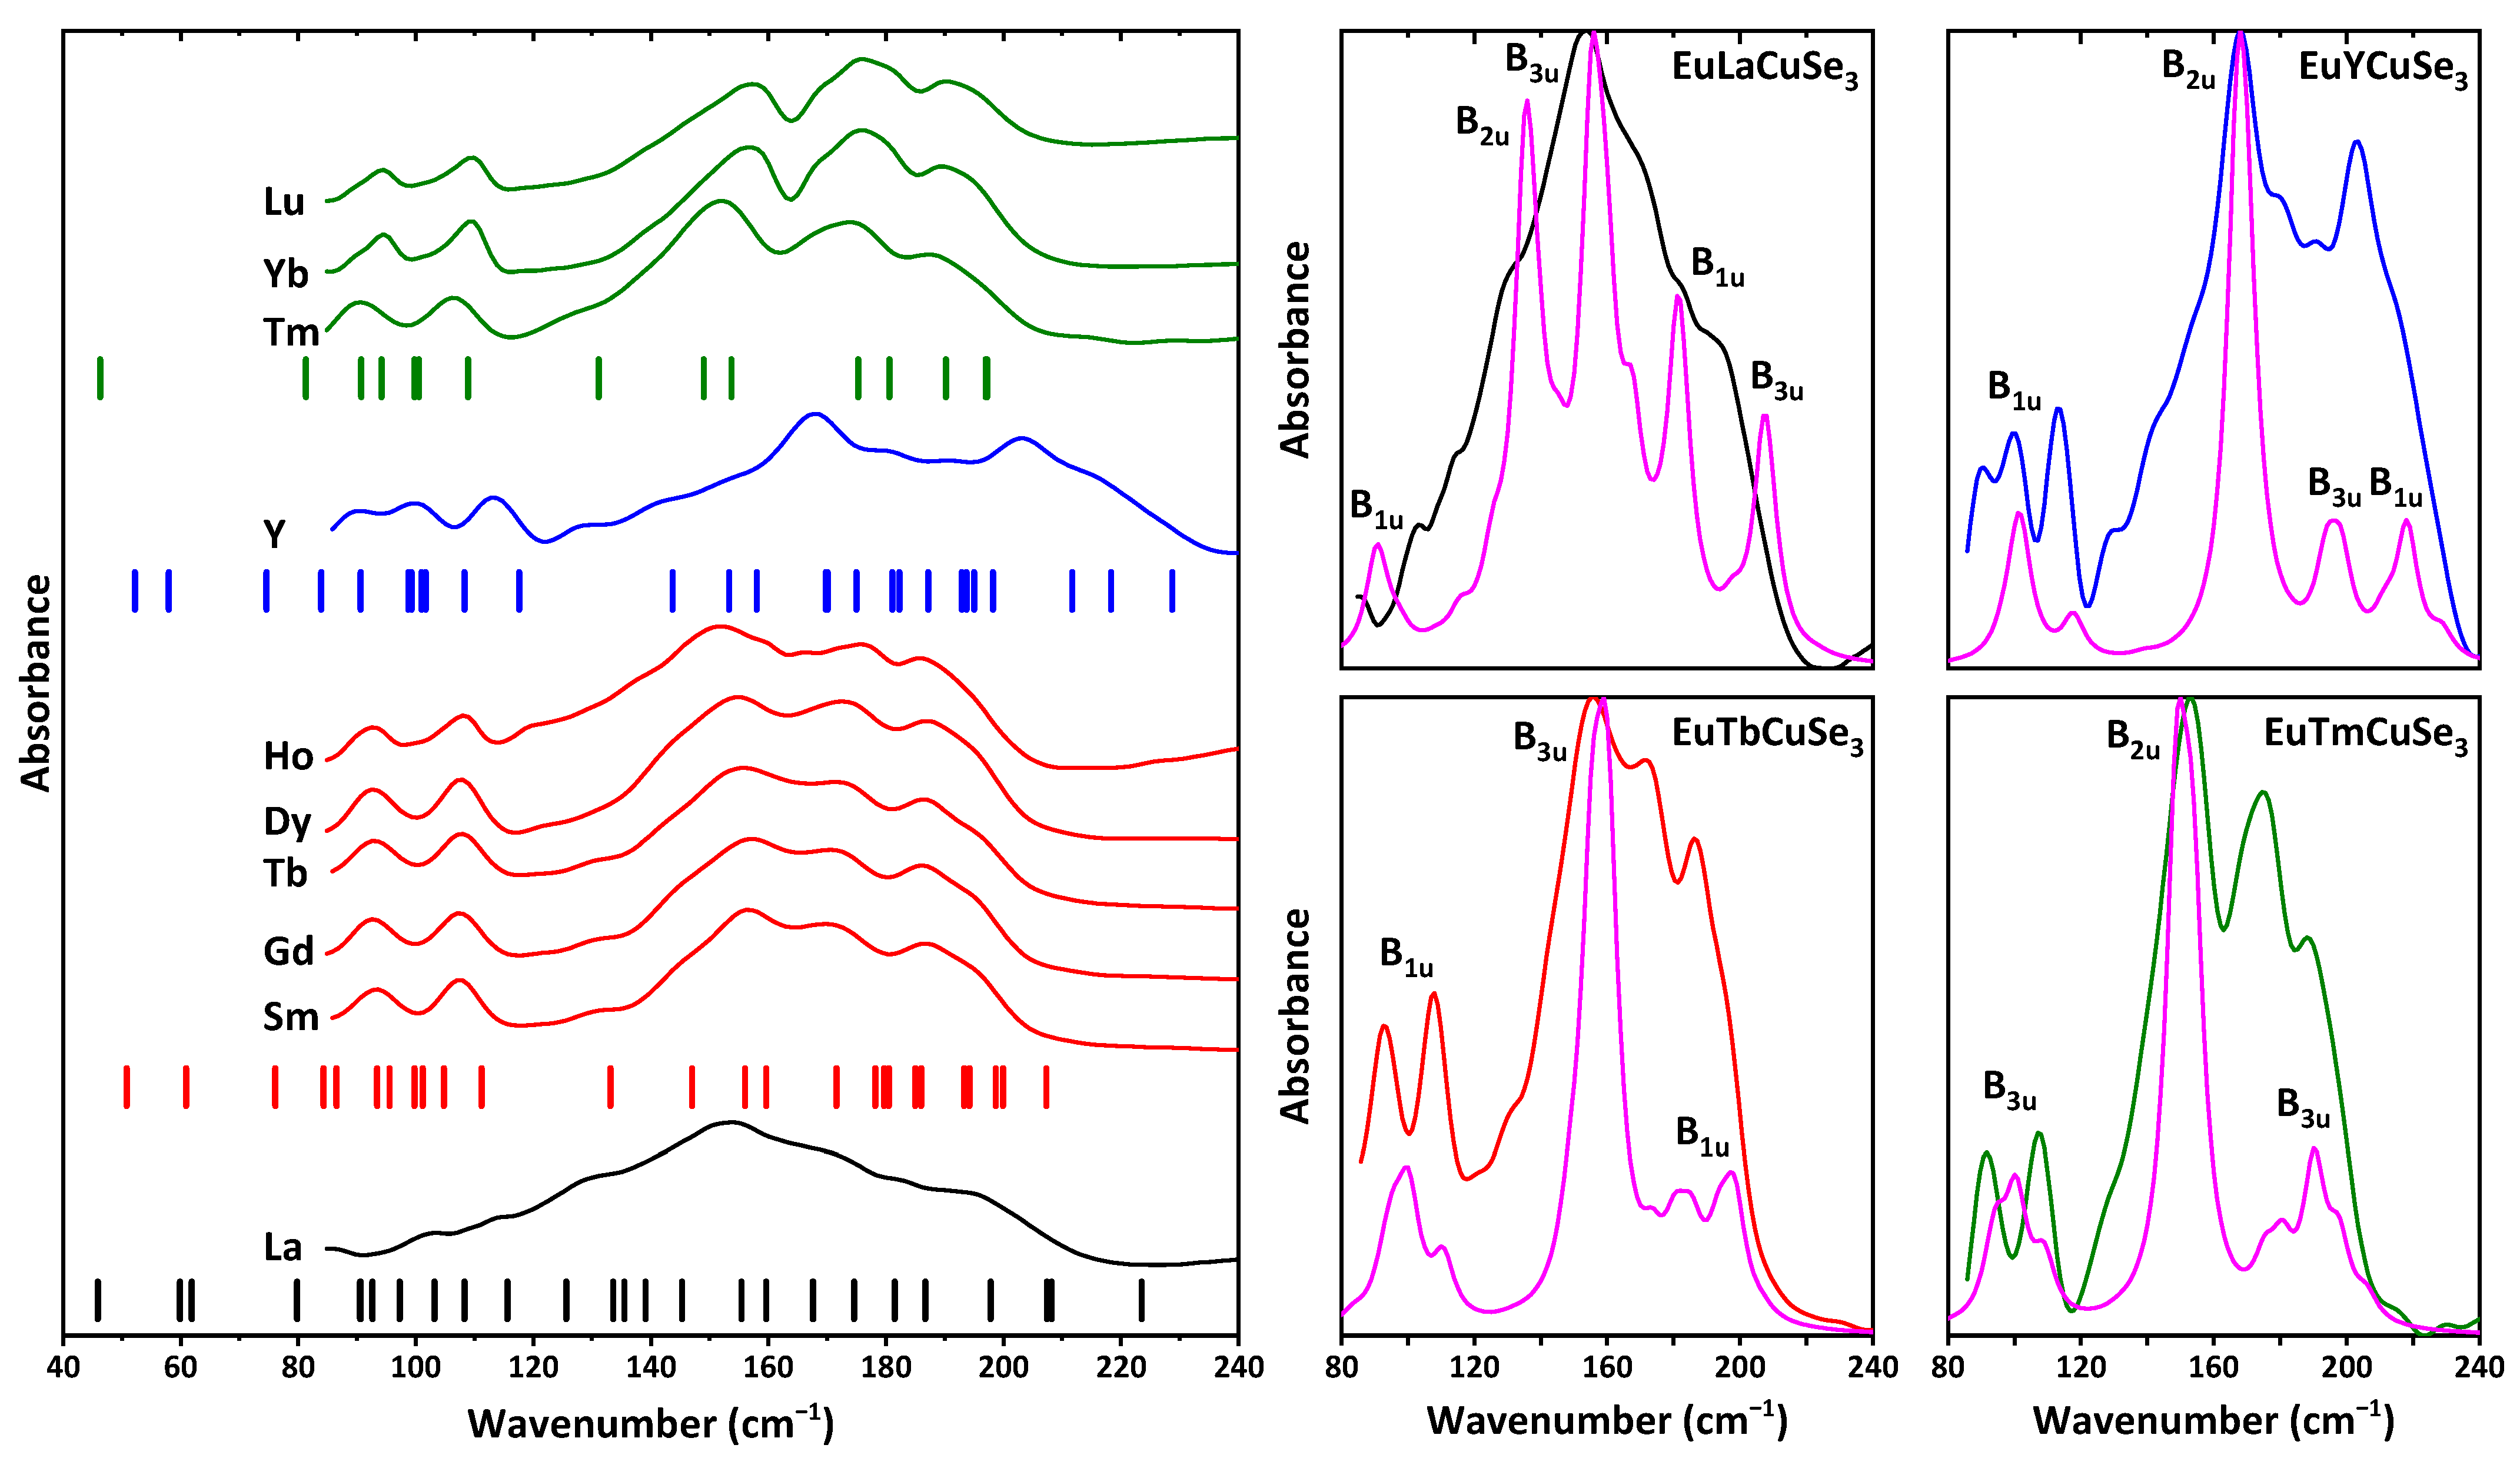
The structures of EuLnCuSe
3 were also studied by IR spectroscopy. Notably, all the reported selenides were found to be transparent for IR radiation in the range of 250–4000 cm
−1. However, a close inspection of the range of 85–250 cm
−1 revealed a set of absorption bands in the IR spectra of compounds (
Figure 8).
Mechanical representation in the center of the Brillouin zone for EuLnCuSe3 with the structural types Ba2MnS3 and Eu2CuS3 is described as Γvibr = 12Ag + 6Au + 6B1g + 12B1u + 12B2g + 6B2u + 6B3g + 12B3u. Mechanical representation for the structural type KZrCuS3 is the sum of 36 irreducible representations: 5Ag + 2Au + 4B1g + 7B1u + B2g + 7B2u + 5B3g + 5B3u. Notably, the g and u labeled modes are Raman and IR active, respectively, except for the “silent” Au modes. Thus, the number of IR active modes is 16 and 27 for the structural types KZrCuS3, and Eu2CuS3 and Ba2MnS3, respectively.
The experimental IR spectra of the discussed selenides are of three different profiles and in good agreement with the calculated ones (
Figure 8). Particularly, the spectra of the structural types KZrCuS
3 and Eu
2CuS
3 (except for EuYCuSe
3) are very similar, and a set of bands is observed at about 80–210 cm
−1. This is also supported by the positions of the calculated IR active bands for these selenides, although the total number of these bands differs significantly (
Figure 8). The experimental IR spectrum of the yttrium-based selenide exhibits bands in a broader range at about 80–240 cm
−1. Although the structure of this compound also belongs to the structural type Eu
2CuS
3 as for the Sm-, Gd-, Tb-, Dy- and Ho-based derivatives, again the different nature of yttrium (
d-element) is reflected. EuLaCuSe
3 is the only described herein selenide of the structural type Ba
2MnS
3. Its experimental IR spectrum is, in general, the result of overlapping of closely positioned bands without any large gaps between the IR active vibrations (
Figure 8). It should also be noted that all the reported selenides, except for the La-based one, are contaminated by the Ln
4O
4Se
3 [
74] or Ln
2SeO
2 [
75] impurities (see discussion above). Thus, additional bands from the Ln–Se vibrations of the oxyselenides are also expected in the same range as for the quaternary selenides. However, their impact is negligible as evidenced from very weak bands of the oxyselenides Ln–O vibrations found at about 300–600 cm
−1 [
76].
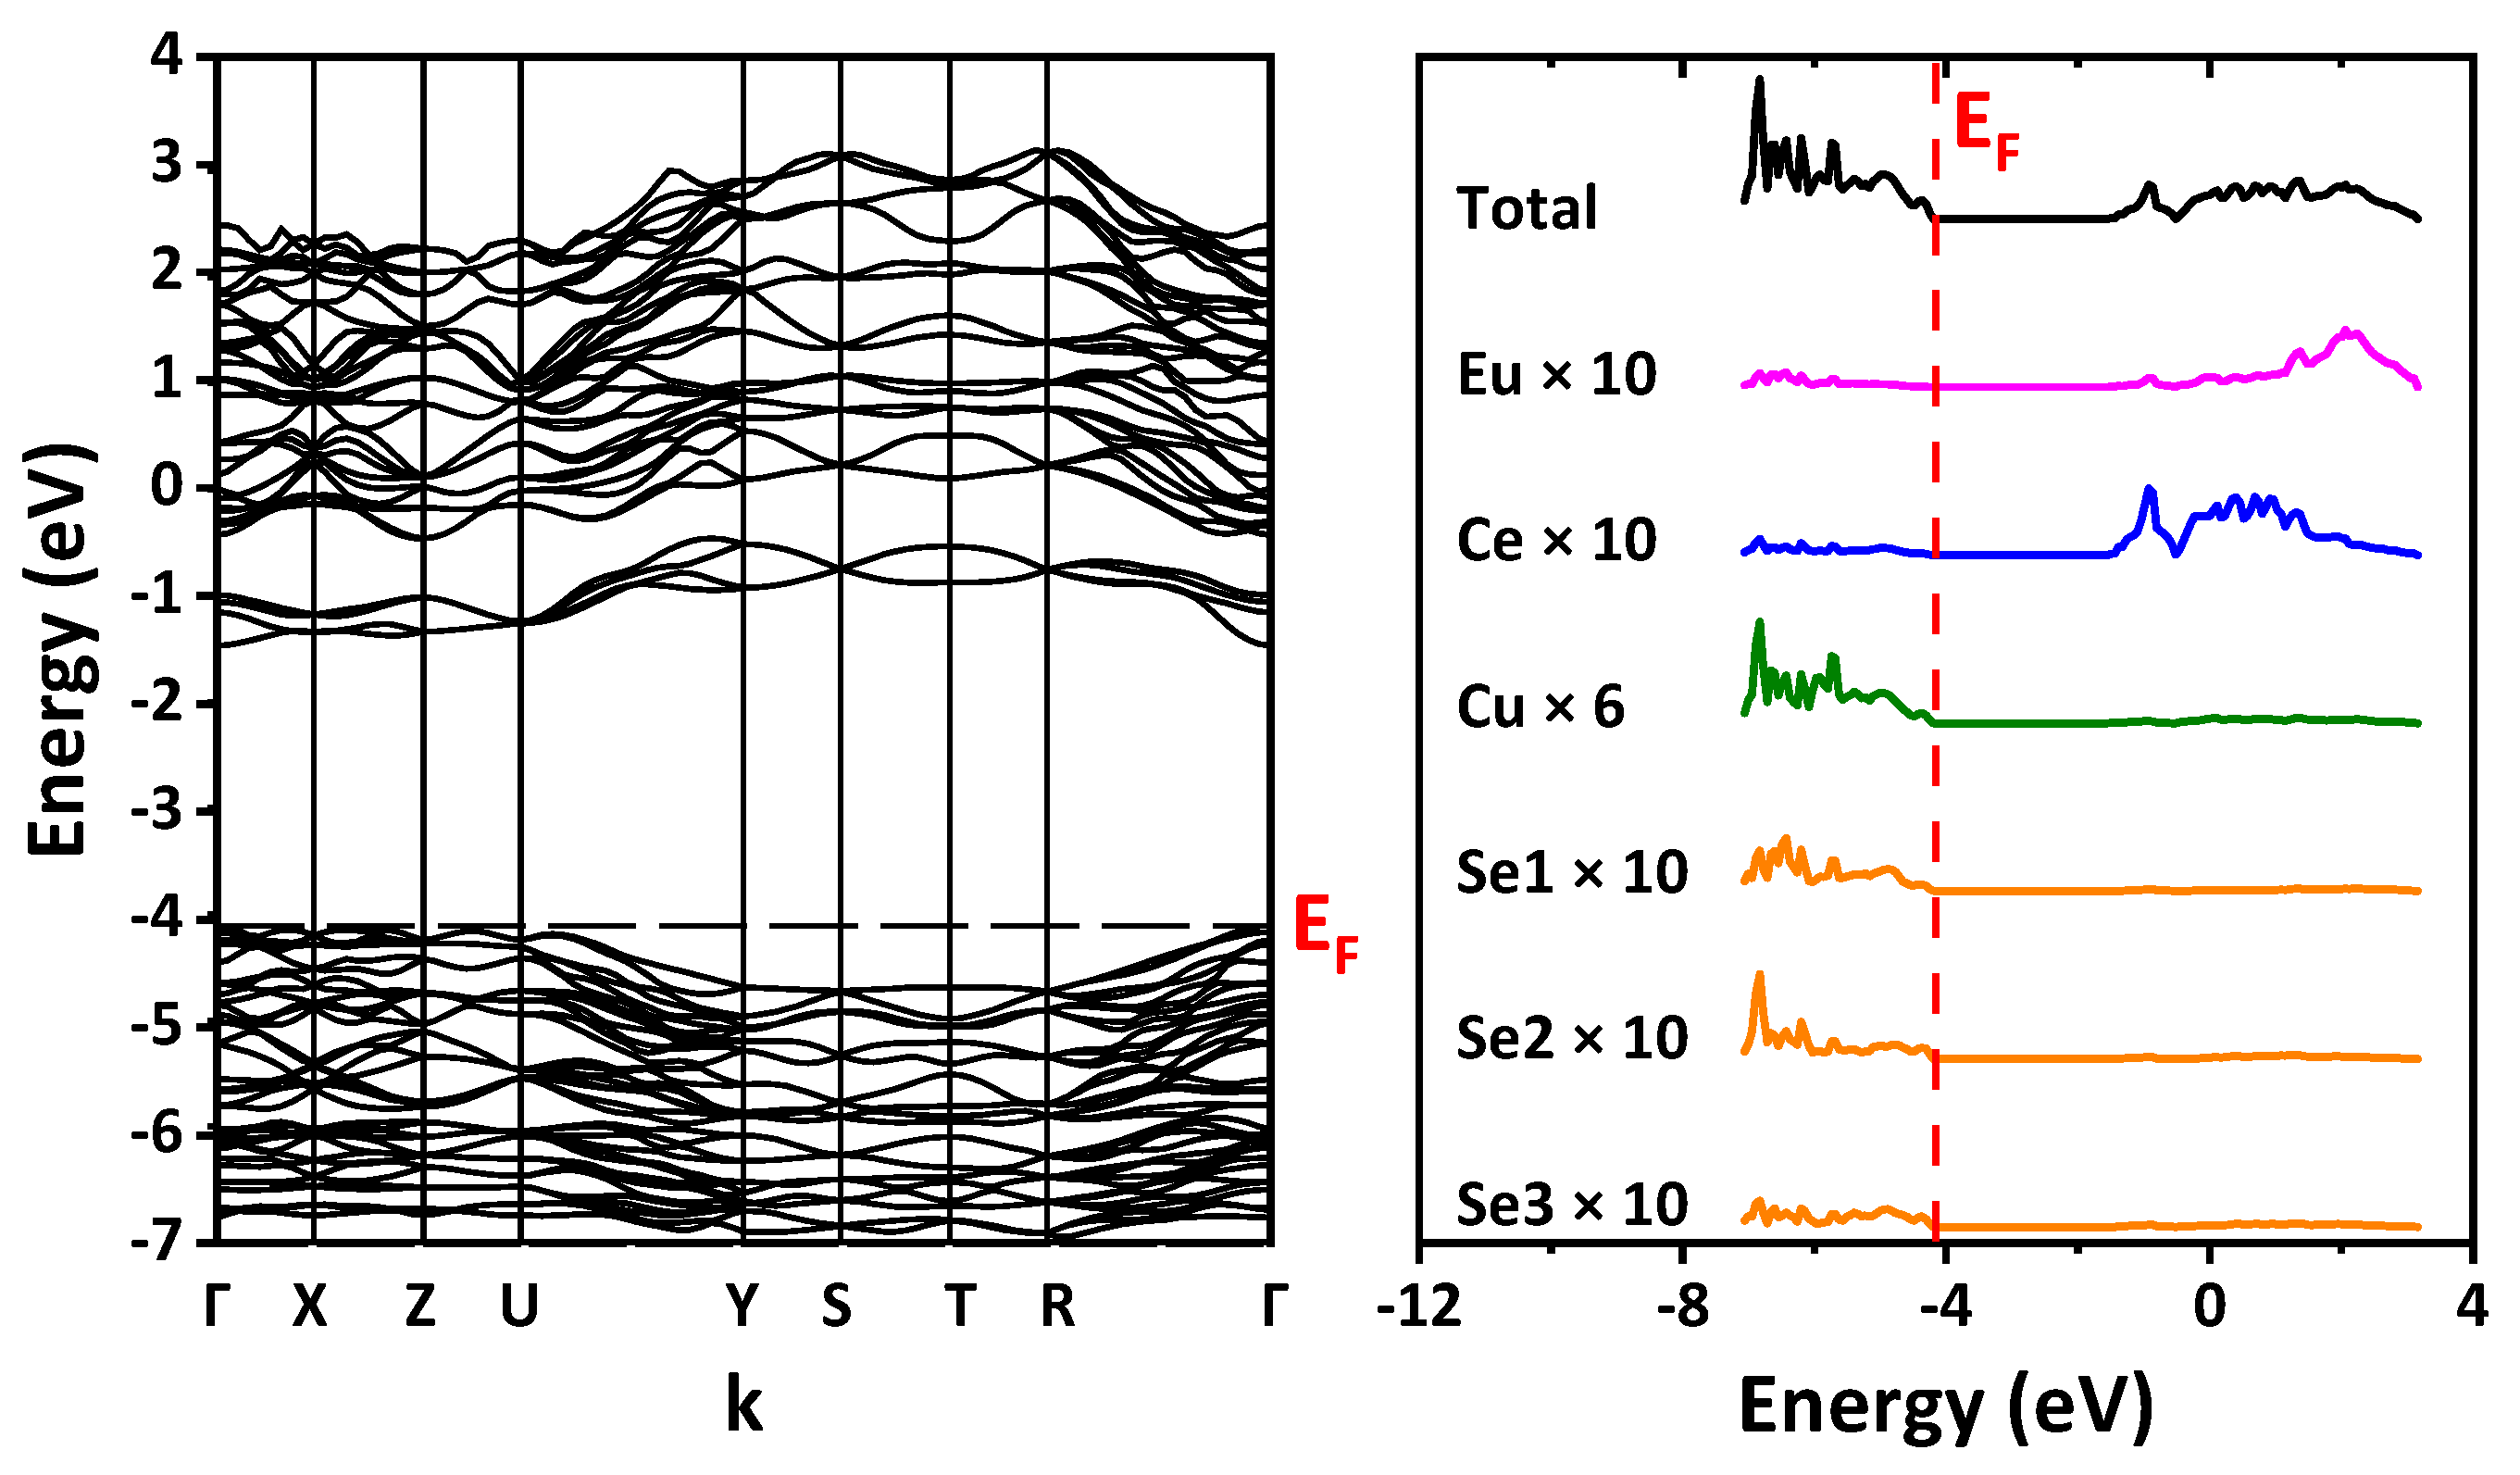
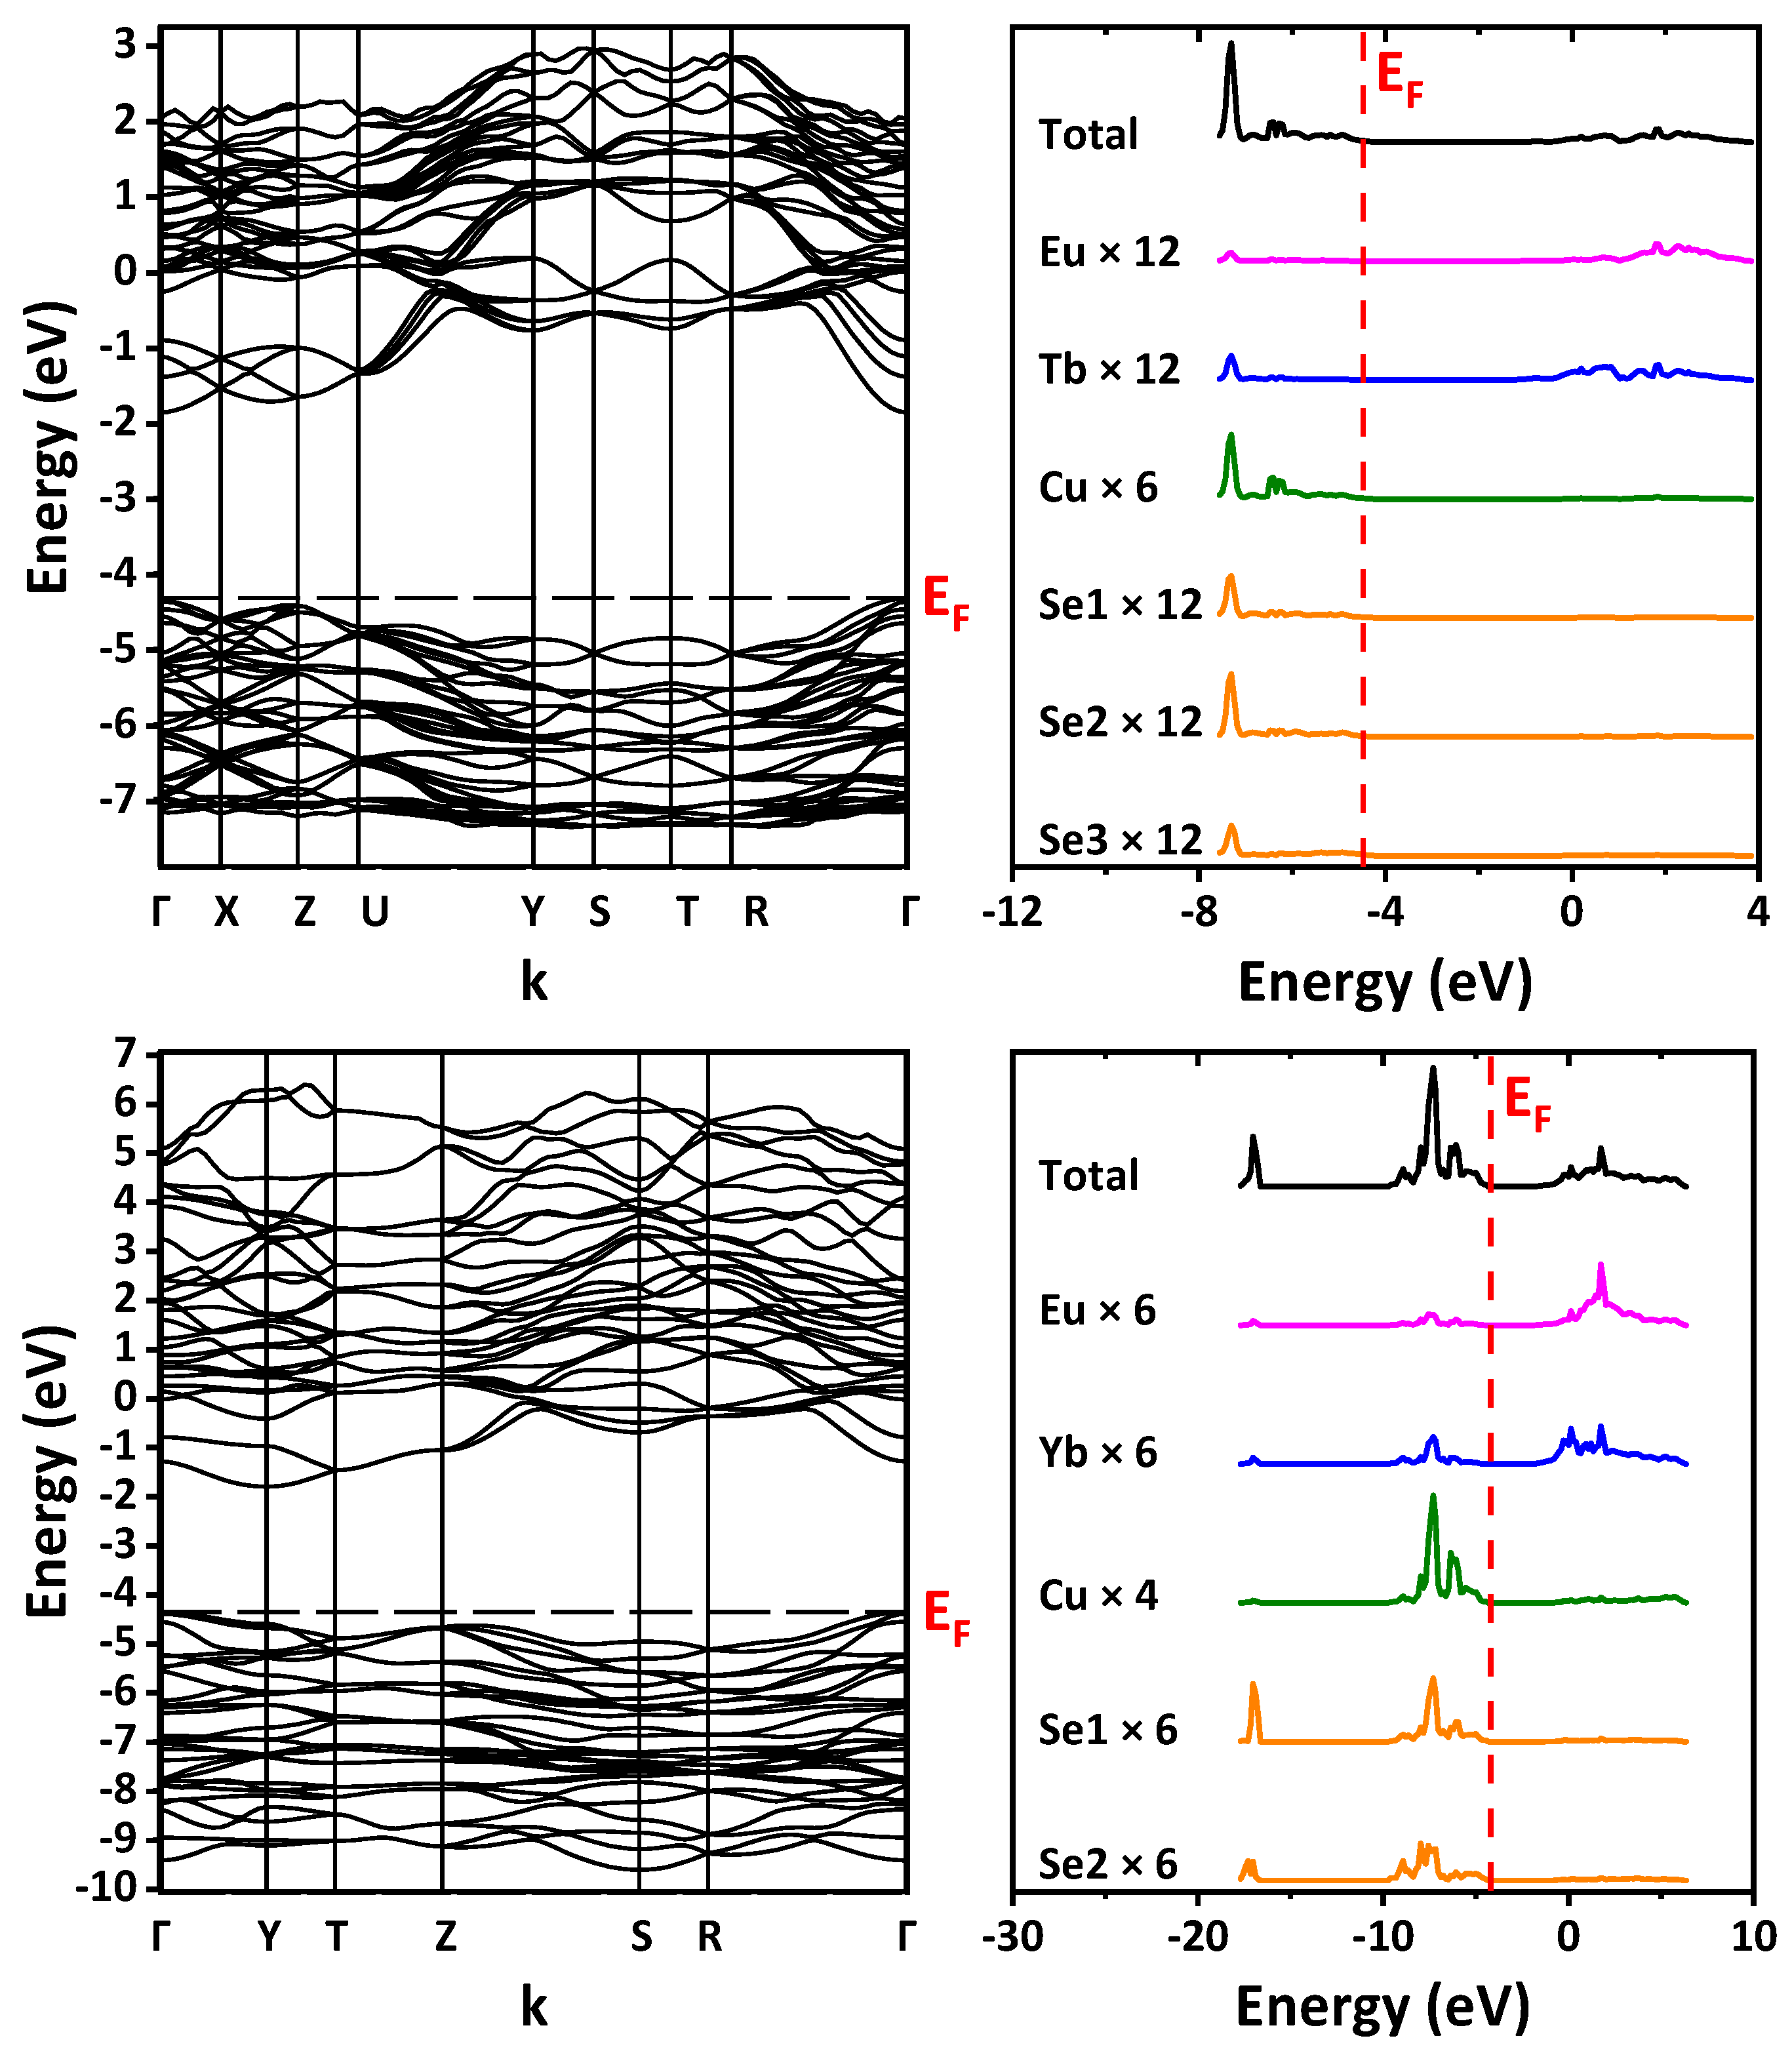
2.5. Band Structure and Optical Properites
The DFT/B3LYP-calculated band structure and the density of states were examined (
Figure 9). The path in the Brillouin zone is plotted through the most highly symmetric points for the orthorhombic lattice. For space group
Pnma (no. 62), the path is built through Γ–X–Z–U–Y–S–T–R–Γ with the coordinates of points of (0,0,0), (1/2,0,0), (0,0,1/2), (1/2,0,1/2), (0,1/2,0), (1/2,1/2,0), (0,1/2,1/2), (1/2,1/2,1/2), (0,0,0), respectively. For space group
Cmcm (no. 63), the path is built through Γ–Y–T–Z–S–R–Γ, and the coordinates of points are (0,0,0), (1/2,1/2,0), (1/2,1/2,1/2), (0,0,1/2), (0,1/2,0), (0,1/2,1/2), (0,0,0), respectively. Since for the rare-earth ions pseudopotentials that replaced their core shells, including 4
f, were used, the band structure does not include 4
f states. According to calculations, the top of the valence band is formed mainly by the states of copper and selenium, while the bottom of the conduction band is formed by the states of the Ln ion and europium. The band gap was defined as the difference in energy between the top of the valence band and the bottom of the conduction band, namely the HOMO–LUMO value (
Table 2 and
Figure S3 in the Supplementary Materials). Calculations predict the direct band gap Γ–Γ for EuLnCuSe
3 with space group
Pnma (structural types Ba
2MnS
3 and Eu
2CuS
3) and the indirect band gap Γ–Y for EuLnCuSe
3 with space group
Cmcm (structural type KZrCuS
3). A small jump was also revealed in the band gap value from the structural type Ba
2MnS
3 to the structural type Eu
2CuS
3 (
Figure S3 in the Supplementary Materials).
It is known that, for the same compound, hybrid functionals yield a higher value of the gap width than non-hybrid ones. For example, it was shown that the hybrid functional PBE0 overestimates, while the non-hybrid functional PBE underestimates the gap in some oxides [
65]. The same is true for the discussed selenides EuLnCuSe
3 (
Table 2). Furthermore, the non-hybrid PBE functional also yielded an underestimated value of the gap width for selenides as reported earlier (
Table 2 and
Figure S3 in the Supplementary Materials) [
32].
The PBE-based calculation performed in this revealed the gap width close to the results of the PBE calculations reported earlier (
Table 2), where the
f-shell of the rare-earth ions was considered explicitly and was not replaced by a pseudopotential [
32]. We also performed a test calculation with the PBE functional for EuLaCuSe
3, where the
f-electrons of europium were considered explicitly. The obtained gap of about 1 eV is in good agreement with the reported one [
32] and is close to the results, which were obtained by replacing the
f-shell of europium with a pseudopotential.
The experimental band gaps of EuLnCuSe
3 were determined from the Kubelka-Munk functions (
Figure S4 in the Supplementary Materials). A recent study suggested that use of the simple Kubelka-Munk function may lead to errors in band gap values of the order of several tenths of eV [
77]. Landi et al. argue that the Tauc-type modification of the Kubelka-Munk functions, though containing approximations, leads to more correct band gap values. Therefore, we tested both uncorrected (
Figure S4 in the Supplementary Materials) and modified Kubelka-Munk functions (
Table 2 and
Figure S3 in the Supplementary Materials). For some samples, the Kubelka-Munk functions modified for an indirect band gap failed, and the corresponding cells in
Table 2 were left empty. Most of the unmodified Kubelka-Munk spectra exhibit a shoulder at longer wavelengths preceding the onset of an evident fundamental absorption. This shoulder is associated with oxyselenide impurities (
Table 1) that are known to be semiconductors with the band gap of 1.02–1.46 eV [
74]. Thus, to estimate the band gap value of the discussed selenides, an additional correction was applied with respect to impurities [
78]. For the Dy- and Sm-based selenides, such a correction was less than 0.01 eV, while no correction was applied for the Y-based derivative since additional data on impurities are required. For the Gd-, Ho-, Tb-, Lu- and Yb-derived compounds, a correction of several hundredths of eV was revealed for the samples containing about 1% of impurities (
Table 2).
The obtained values of the band gap are close to those obtained for isostructural sulfides EuLnCuS
3 (
Figure S4 in the Supplementary Materials). The band gap of BaLnCuS
3 is much higher than that of EuLnCuX
3 (X = S, Se) [
70,
79].
Narrowing of the band gap is well-known for the majority of ab initio calculations using the PBE functional. We applied the B3LYP and PBE0 functionals to calculate the electronic band structure, which yielded overestimated band gap values in comparison to the experimental ones, while calculations preformed earlier using the PBE functional and considering
f-electrons, in general, underestimated the band gap values [
32].
The most probable ion that could be responsible for this narrowing is Eu
2+, which is present in all of the discussed compounds. We suggest that interband transitions between sub-bands originating from partially occupied orbitals of
f-electrons of Eu
2+ to, e.g., unoccupied bands originating from
d-orbitals of the same ion, are not correctly described by a pseudopotential, and these sub-bands are the factor that determines experimental behavior of band gaps (
Figure S3 in the Supplementary Materials). More specifically, experimental values of the direct band gap in all selenides containing divalent europium and trivalent lanthanide with
f-electrons vary from 1.87 eV to 1.97 eV for the
Pnma space group, and from 2.02 eV to 2.1 eV for the
Cmcm space group (Tm, Lu).
The B3LYP-based calculation with the europium pseudopotential predicts direct band gaps in the range 2.38–2.63 eV and 2.52–2.59 eV for
Pnma and
Cmcm space groups, respectively. An indirect band gap for the
Cmcm space group is predicted to be narrower than the direct one in contrast to the
Pnma space group. However, for consistency, we compare direct band gaps produced by stronger direct transitions for all crystals. The discrepancy between the B3LYP-based calculations and experimental values of the order of 0.6 eV is ascribed to a lower position of excited
d-bands of europium in comparison with the B3LYP calculation. This explanation is valid for all the discussed compounds except for the La-, Y- and Yb-derived ones, which exhibit much narrower experimental band gaps. For the Yb containing selenide, the narrower band gap can be explained as similar to BaYbCuS
3 [
79]. The Yb
3+ ion with the
f13-electronic configuration is characterized by a low-lying charge transfer transition to the
f14-configuration with enhanced stability. In selenides, this charge transfer transition is expected to lie at even lower energies than in sulfides, resulting in additional narrowing of the EuYbCuSe
3 band gap with respect to calculations. To explain the narrowing of the band gap of compounds where Ln
3+ completely lack
f-electrons, i.e., La and Y are more challenging, one may expect that the lack of
f-electrons results in certain structural changes that lead to enhancement of the crystal field acting upon europium ions and sequent narrowing of the band gap. Let us compare, e.g., a local environment of the europium ion in EuYCuSe
3 and in EuHoCuSe
3 with the ionic radius of Ln
3+ closest to that of Y
3+. The europium ion is coordinated by seven selenium ions at distances of the order of 3 Å. Specifically, one of the selenium ions is positioned at a much longer distance of about 3.4–3.5 Å for the Ho- and Y-based selenides, respectively. Thus, asymmetry of the crystal field for EuYCuSe
3 is the largest one. Hypothetically, it can be the reason for the narrowing of the EuYCuSe
3 band gap. However, since the increase of asymmetry is rather small, this explanation must be considered as a hypothesis.
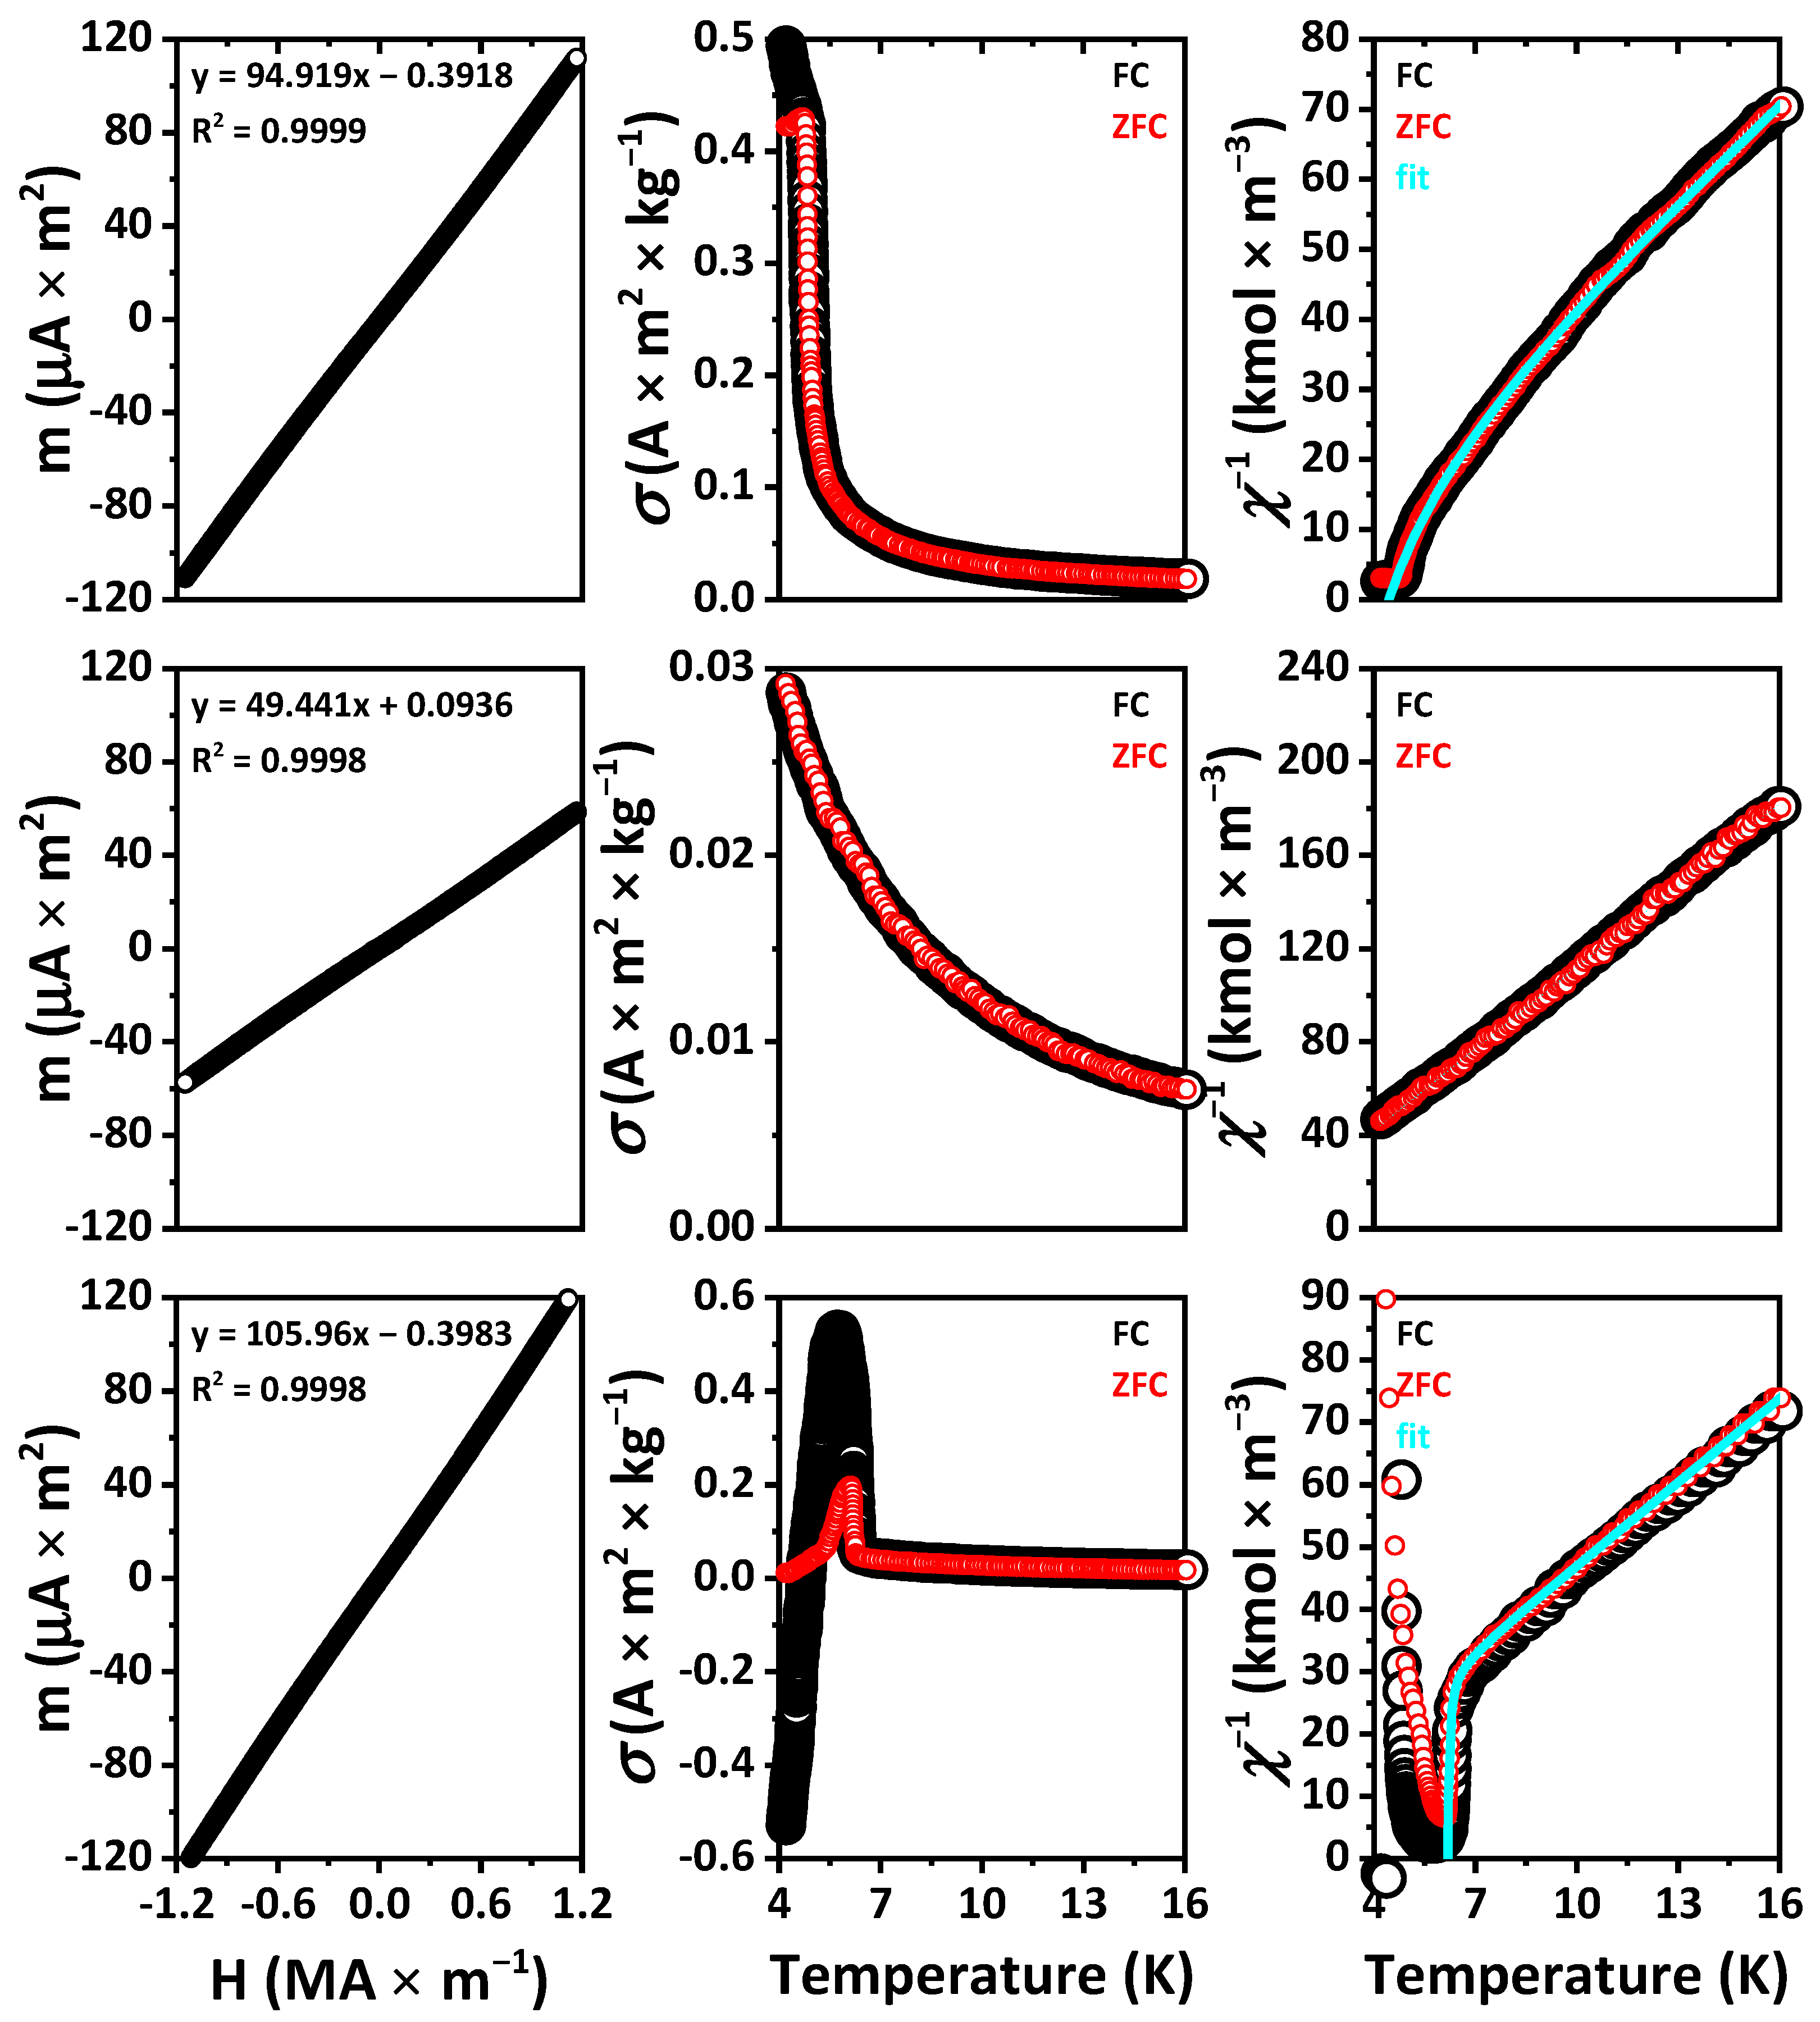
2.6. Magnetic Properties
The external field dependent magnetic moments of the samples at room temperature exhibit a linear plot, corresponding to the Curie law for paramagnets and differ only in the slope of the line (
Figure 10 and
Figure S5 in the Supplementary Materials).
The calculated values of μ and
C for EuYCuSe
3, EuLaCuSe
3 and EuLuCuSe
3 are the same since the cations Y
3+, La
3+ and Lu
3+ are diamagnetic, and the final magnetic properties of these selenides are exclusively associated with the Eu
2+ cation. The experimental values of the effective magnetic moments of EuYCuSe
3 and EuLaCuSe
3 are equal within the error and differ from the calculated ones by about 1%, while the experimental magnetic moment of EuLuCuSe
3 is about 5.5% larger in comparison to the calculated one (
Table 3). For the other selenides, the relative deviations of the calculated values of the magnetic moments from the calculated ones do not exceed 3%. As for the corresponding Curie constants, this value of deviation is as twice as large due to the quadratic dependence on the values of the effective magnetic moments.
Plots of both specific magnetization and reciprocal magnetic susceptibility of EuLaCuSe
3 and EuLuCuSe
3 at 4.2–20 K indicate that, upon cooling down to 4.2 K, the compounds remain paramagnetic with the corresponding (asymptotic) Curie temperature θ
p = 0.2 and 3.1 K, respectively (
Figure 10 and
Figure S5 in the Supplementary Materials). At these temperatures, the samples are most likely to be ferromagnetic. This assumption is supported by the presence of one type of magnetic ions in the compounds (Eu
2+), the coincidence of the data for the FC and ZFC measurements and the linearity of the temperature dependent reciprocal susceptibility down to the lowest temperatures.
The magnetic behavior of EuYCuSe
3 is similar to that of EuLaCuSe
3 and EuLuCuSe
3. However, below 12 K, the FC and ZFC curves slightly diverge, although there are no noticeable points in these dependences (
Figure S5 in the Supplementary Materials). The paramagnetic Curie temperatures were found to be 4.2 and 3.3 K for FC and ZFC, respectively. The second value is more reliable since the dependence in this case is more linear. Probably, a transition to a ferromagnetic state occurs at this point. The thermomagnetic dependences for EuYbCuSe
3 are similar with the FC and ZFC curves being less diverged, and the transition to a ferromagnetic state occurs, most likely, very close to 4 K.
Curves for EuTbCuSe
3, EuDyCuSe
3 (ZFC), EuHoCuSe
3 and, to a lesser extent, EuTmCuSe
3 with decreasing temperatures exhibit an abrupt drop in the linear dependence of the reciprocal susceptibility, characteristic of ferrimagnets (
Figure 10 and
Figure S5 in the Supplementary Materials). Paramagnetic Curie temperatures, calculated from linear sections of the curves, are negative except for EuTmCuSe
3. This testifies to the antiparallel coordination of the magnetic sublattices. The approximation of these curves at temperatures above the points of local minima
χ−1, according to the Néel theory for ferrimagnets, reveals the data, including the Néel temperatures, gathered in
Table 4.
The decreasing of the χ−1 values of EuDyCuSe3 and EuTbCuSe3 in the FC mode in comparison to the ZFC mode at low temperatures corresponds to an increase in the magnetic moment of the sample cooled in the presence of an external field. Apparently, when heated above the Néel point, the effect of this initial magnetization persists up to some higher temperatures. A similar explanation can be proposed for the divergence of the FC and ZFC curves of EuYCuSe3 and EuYbCuSe3, discussed above, although the temperature did not decrease below the points of magnetic transitions. The positive value of the paramagnetic Curie point calculated for EuTmCuSe3 contradicts the conclusion about ferrimagnetic ordering, but this value is rather close to zero.
The magnetization of EuHoCuSe
3 below the Néel point looks significantly different, and its value is negative at temperatures from 4.2 to 4.8 K. This recently attracted increased interest for possible practical applications [
81,
82]. Several mechanisms of this phenomenon are considered: negative exchange coupling among ferromagnetic sublattices, negative exchange coupling among canted antiferromagnetic sublattices, negative exchange coupling among ferromagnetic/canted antiferromagnetic and paramagnetic sublattices, imbalance of spin and orbital moments, interfacial exchange coupling between ferromagnetic and antiferromagnetic phases [
81]. Similar temperature dependences of the reciprocal susceptibility were obtained for (Tm
0.8Mn
0.2)MnO
3 [
82]. It was established that the negative magnetization is determined by the first mechanism. Most likely, EuHoCuSe
3 exhibits similar properties and belongs to the N-type ferrimagnets according to Néel [
80].
The magnetic properties of EuYCuSe
3 and EuLnCuSe
3 (Ln = La, Tb, Dy, Ho, Tm, Yb, Lu) correlate well with the properties of isostructural sulfides (
Table 5) [
9,
10,
68].


 ,
, 


