Abstract
Long non-coding RNAs (lncRNAs) play important biological roles. Here, the roles of the lncRNA KCNQ1OT1 in cellular senescence and calorie restriction were determined. KCNQ1OT1 knockdown mediated various senescence markers (increased senescence-associated β-galactosidase staining, the p53-p21Cip1/WAF1 pathway, H3K9 trimethylation, and expression of the senescence-associated secretory phenotype) and reactive oxygen species generation via CK2α downregulation in human cancer HCT116 and MCF-7 cells. Additionally, KCNQ1OT1 was downregulated during replicative senescence, and its silencing induced senescence in human lung fibroblast IMR-90 cells. Additionally, an miR-760 mimic suppressed KCNQ1OT1-mediated CK2α upregulation, indicating that KCNQ1OT1 upregulated CK2α by sponging miR-760. Finally, the KCNQ1OT1–miR-760 axis was involved in both lipopolysaccharide-mediated CK2α reduction and calorie restriction (CR)-mediated CK2α induction in these cells. Therefore, for the first time, this study demonstrates that the KCNQ1OT1–miR-760–CK2α pathway plays essential roles in senescence and CR, thereby suggesting that KCNQ1OT1 is a novel therapeutic target for an alternative treatment that mimics the effects of anti-aging and CR.
1. Introduction
Long non-coding RNAs (lncRNAs) are transcripts with a size greater than 200 nucleotides that are not translated into proteins. LncRNAs are responsible for diverse functions, including transcriptional regulation in cis or trans, organization of nuclear domains, and interaction with microRNAs (miRNAs) [1,2,3]. In particular, understanding the interaction network of lncRNAs and miRNAs provides a new perspective on the regulatory mechanisms of genes. The lncRNA KCNQ1OT1, the full name of which is KCNQ1 overlapping transcript 1, is a 91 kb transcript that is transcribed by RNA polymerase II in an antisense orientation, relative to KCNQ1 [4,5]. KCNQ1OT1 is present in intron 10 of the KCNQ1 gene. The KCNQ1 locus is located on the short arm of human chromosome 11 (11p15.5). Through recruiting G9a and the H3K27 histone methyltransferase PRC2 (polycomb repressive complex 2), KCNQ1OT1 interacts with chromatin to form a complex folding structure and then silences multiple target genes [6]. Additionally, KCNQ1OT1 is involved in several disorders, including heart disease, cerebral ischemic stroke, atherosclerosis, pyroptosis, and various cancers (gastric, ovarian, and colorectal) by binding to various miRNAs (for example, miR-760, miR-200a, miR-452-3p, miR-320a, miR-701-3p, and miR-2054), all of which regulate the expression of their target genes [7,8,9,10,11,12,13]. Nevertheless, the biological roles of KCNQ1OT1 in senescence and calorie restriction (CR) remain unclear.
Cellular senescence is the terminal arrest of proliferation, stimulated by several cellular stresses such as telomere shortening, oncogenic activation, and oxidative stress [14,15]. Previous studies identified the protein kinase CK2 (CK2), composed of two catalytic (α and/or α′) subunits and two regulatory β subunits, as a senescence regulator. CK2 inhibition triggers the expression of several senescence markers, including senescence-associated β-galactosidase (SA-β-gal) activity [16], p53–p21Cip1/WAF1 axis activation [17], reactive oxygen species (ROS) production [18], senescence-associated heterochromatin foci (SAHF) formation [19], and senescence-associated secretory phenotype (SASP) expression [20]. miR-186, miR-216b, miR-337-3p, and miR-760 promote cellular senescence by inhibiting CK2α [21,22]. Calorie restriction (CR), consisting of a chronic reduction in total calorie intake without malnutrition, is the most successful strategy to delay cellular senescence [23]. It has recently been reported that CK2 is upregulated by CR and induces autophagy [24]. However, the molecular mechanism underlying CR-mediated CK2 upregulation remains unclear.
In this study, the potential role of KCNQ1OT1 in senescence and CR was assessed. KCNQ1OT1 knockdown promoted a senescence phenotype via downregulating CK2α in human cancer MCF-7 and HCT116 cells, and lung fibroblast IMR-90 cells. This research indicates that KCNQ1OT1 upregulates CK2α expression through interaction with miR-760 during senescence and CR, suggesting that KCNQ1OT1 may be a novel therapeutic target for aging-associated diseases.
2. Results
2.1. KCNQ1OT1 Knockdown Induced Activation of SA-β-gal Staining, the p53-p21Cip1/WAF1 Pathway, and H3K9 Trimethylation Via CK2α Silencing in Human Cancer Cells
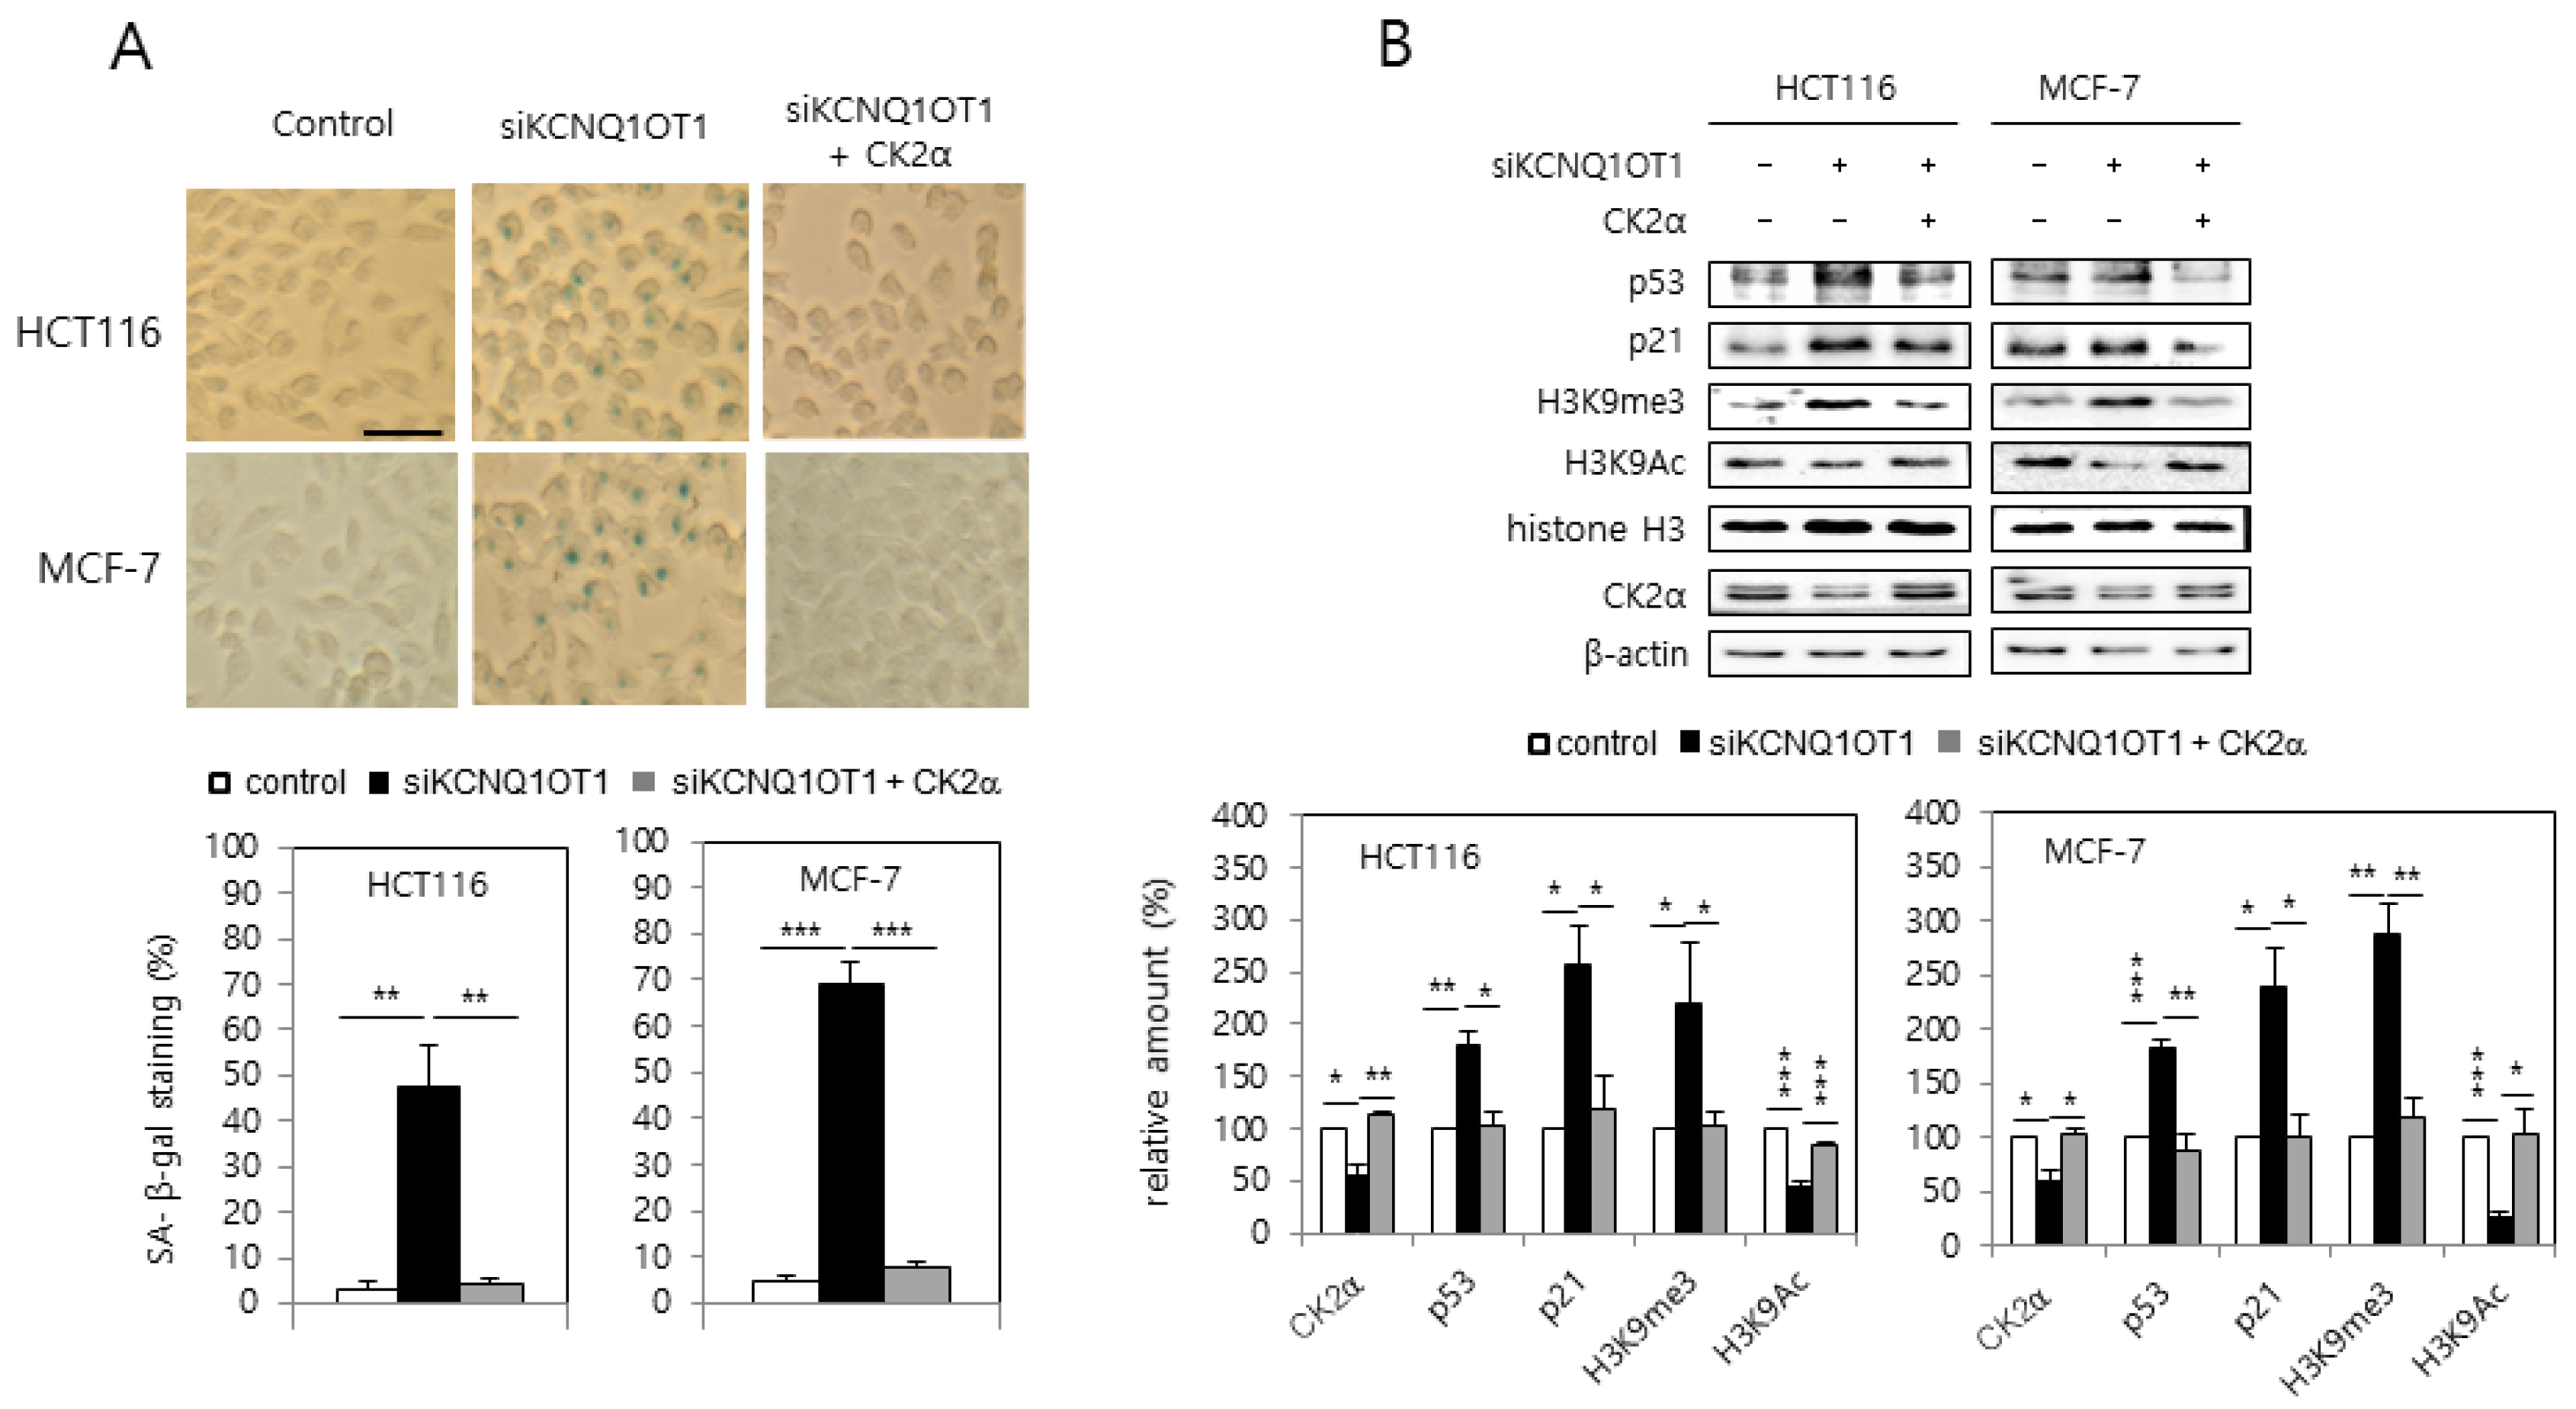
MCF-7 and HCT116 cells were transfected with KCNQ1OT1 siRNA to investigate the involvement of KCNQ1OT1 in senescence. KCNQ1OT1 knockdown upregulated SA-β-gal activity (Figure 1A). Additionally, immunoblot results indicated that KCNQ1OT1 knockdown upregulated the levels of p53 and p21Cip1/WAF1, and hallmarks of SAHF (increased H3K9 trimethylation (H3K9me3) and decreased H3K9 acetylation (H3K9Ac)) (Figure 1B). It was previously reported that CK2 downregulation induces these senescence markers (activation of SA-β-gal staining, the p53-p21Cip1/WAF1 pathway, and SAHF) [16,17,19]. Therefore, it was examined whether KCNQ1OT1 interacts with CK2. Interestingly, ectopic CK2α expression abrogated the induction of SA-β-gal activity, p53, p21Cip1/WAF1, and H3K9me3, mediated by KCNQ1OT1 downregulation (Figure 1A,B). Furthermore, KCNQ1OT1 knockdown reduced the protein level of CK2α (Figure 1B). These results collectively suggest that KCNQ1OT1 knockdown induces cellular senescence by downregulating CK2.
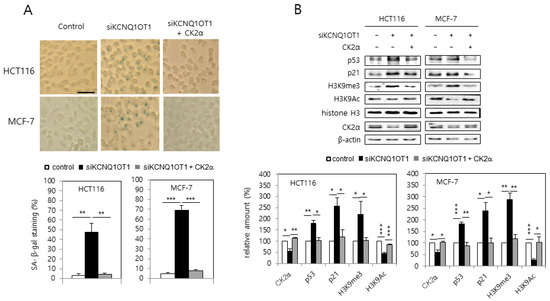
Figure 1.
KCNQ1OT1 knockdown induced activation of SA-β-gal staining, the p53-p21Cip1/WAF1 pathway, and H3K9 trimethylation via CK2α silencing in human cancer cells. HCT116 and MCF-7 cells were transfected with KCNQ1OT1 siRNA for two days in the absence or presence of pcDNA3.1-HA-CK2α. (A) Cells were stained with 5-bromo-4-chloro-3-indolyl-β-D-galactoside, and representative images were obtained at 20× magnification (upper). Scale bar = 100 μm. Representative data from three independent experiments are shown. The graphs represent the percentage of blue-stained cells (bottom). (B) Immunoblotting was used to determine the level of each protein using specific antibodies (upper). β-Actin was used as a control. The graphs represent the quantitation of each protein relative to β-actin (bottom). Data are reported as mean ± SEM. * p < 0.05; ** p < 0.01; *** p < 0.001. H3K9me3, histone H3 Lys9 trimethylation; H3K9Ac, H3 Lys9 acetylation.
2.2. KCNQ1OT1 Knockdown Induced SASP Factor Expression and ROS Generation Via CK2α Silencing in Human Cancer Cells
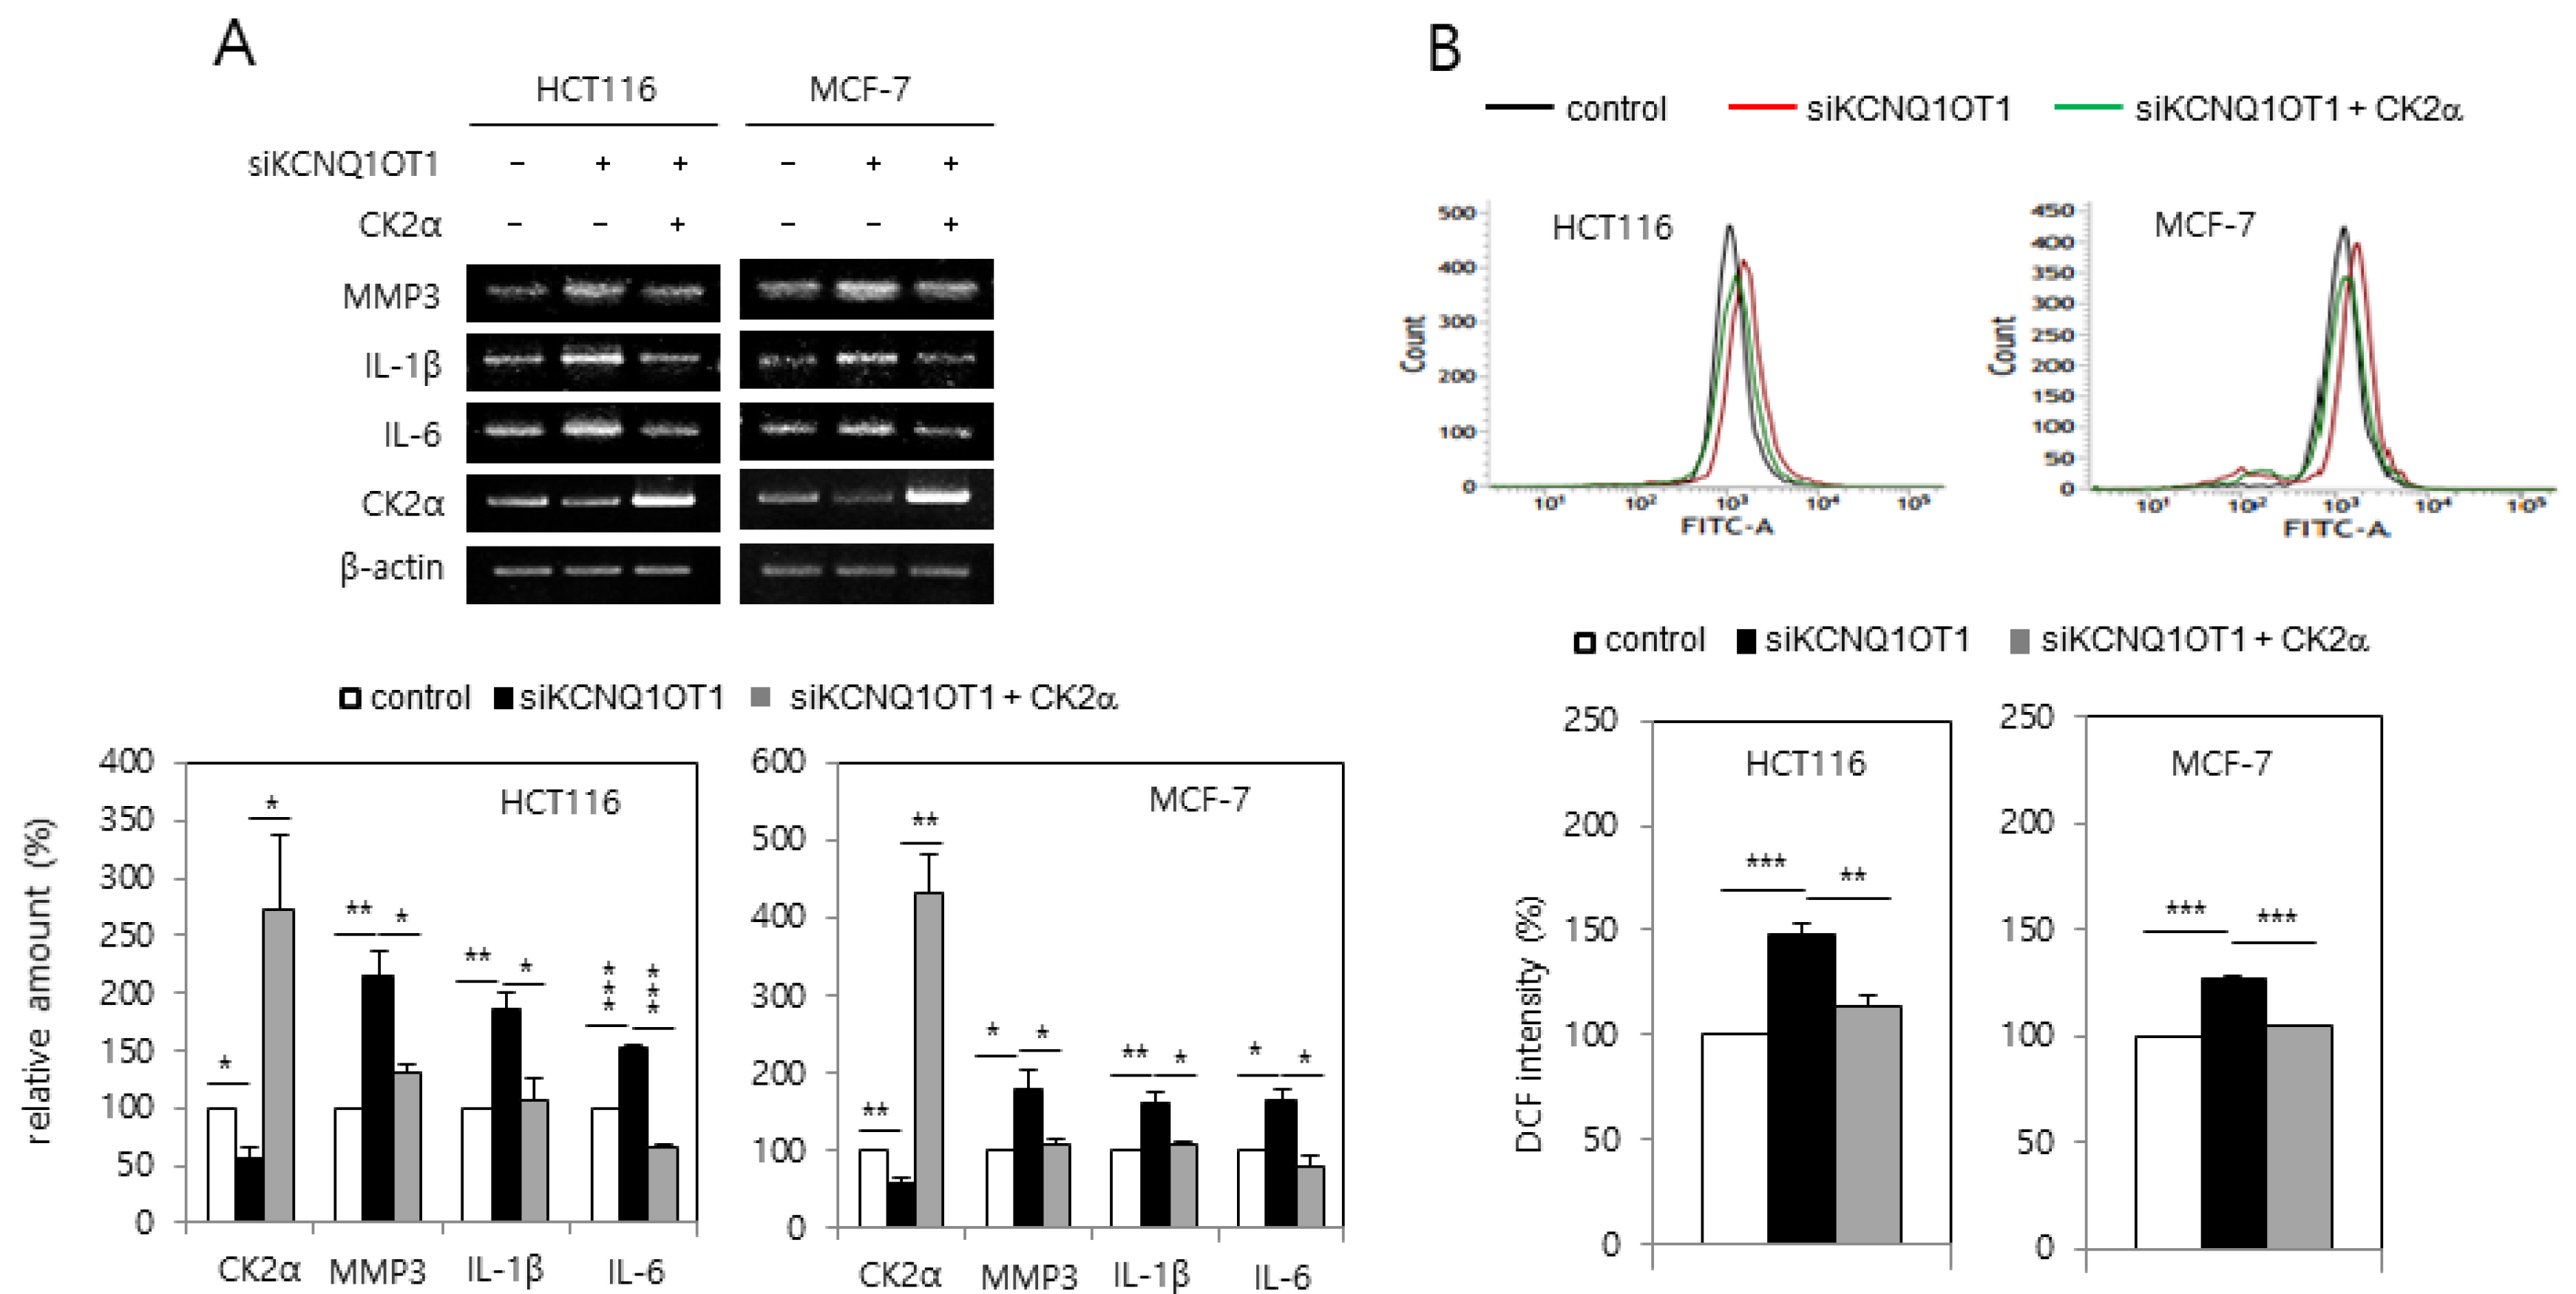
It was investigated whether KCNQ1OT1 downregulation increased the expression of SASP factors due to reports that senescent cells secrete pro-inflammatory factors [14,15]. KCNQ1OT1 knockdown induced the expression of SASP factors, including interleukin (IL)-1β, IL-6, and matrix metalloproteinase (MMP) 3 (Figure 2A). KCNQ1OT1 downregulation increased the amount of intracellular ROS because oxidative stress is a major cause of senescence [14,15]. For this purpose, HCT116 and MCF-7 cells were transfected with KCNQ1OT1 siRNA and stained with CM-H2DCFDA. KCNQ1OT1 knockdown increased ROS production, as indicated by the right shift in fluorescence during flow cytometry (Figure 2B). It was previously reported that CK2 downregulation induces SASP expression [20] and ROS generation [18]. Ectopic expression of CK2α abrogated the induction of SASP factor expression and ROS generation, mediated by KCNQ1OT1 downregulation (Figure 2A,B). Collectively, these results indicate that KCNQ1OT1 knockdown induces ROS generation and inflammation through downregulating CK2.
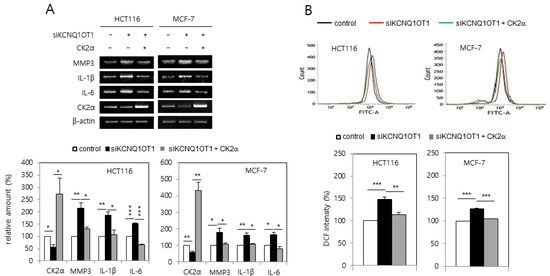
Figure 2.
KCNQ1OT1 knockdown induced senescence-associated secretory phenotype (SASP) factor expression and reactive oxygen species (ROS) generation via CK2α silencing in human cancer cells. HCT116 and MCF-7 cells were transfected with KCNQ1OT1 siRNA for two days in the absence or presence of pcDNA3.1-HA-CK2α. (A) The level of each mRNA was determined by reverse transcription-polymerase chain reaction (RT-PCR) using specific primers (upper). Representative data from three independent experiments are shown. The graphs represent the quantitation of each mRNA relative to β-actin (bottom). (B) The cells were incubated with 10 μM CM-H2DCFDA. Fluorescence intensity was determined by flow cytometry analysis (upper). Representative data from three independent experiments are shown. The graphs show the relative fluorescence level (bottom). Data are reported as mean ± SEM. * p < 0.05; ** p < 0.01; *** p < 0.001.
2.3. KCNQ1OT1 Was Involved in Lipopolysaccharide (LPS)-Mediated SASP Factor Expression Via Silencing CK2α in Human Cancer Cells
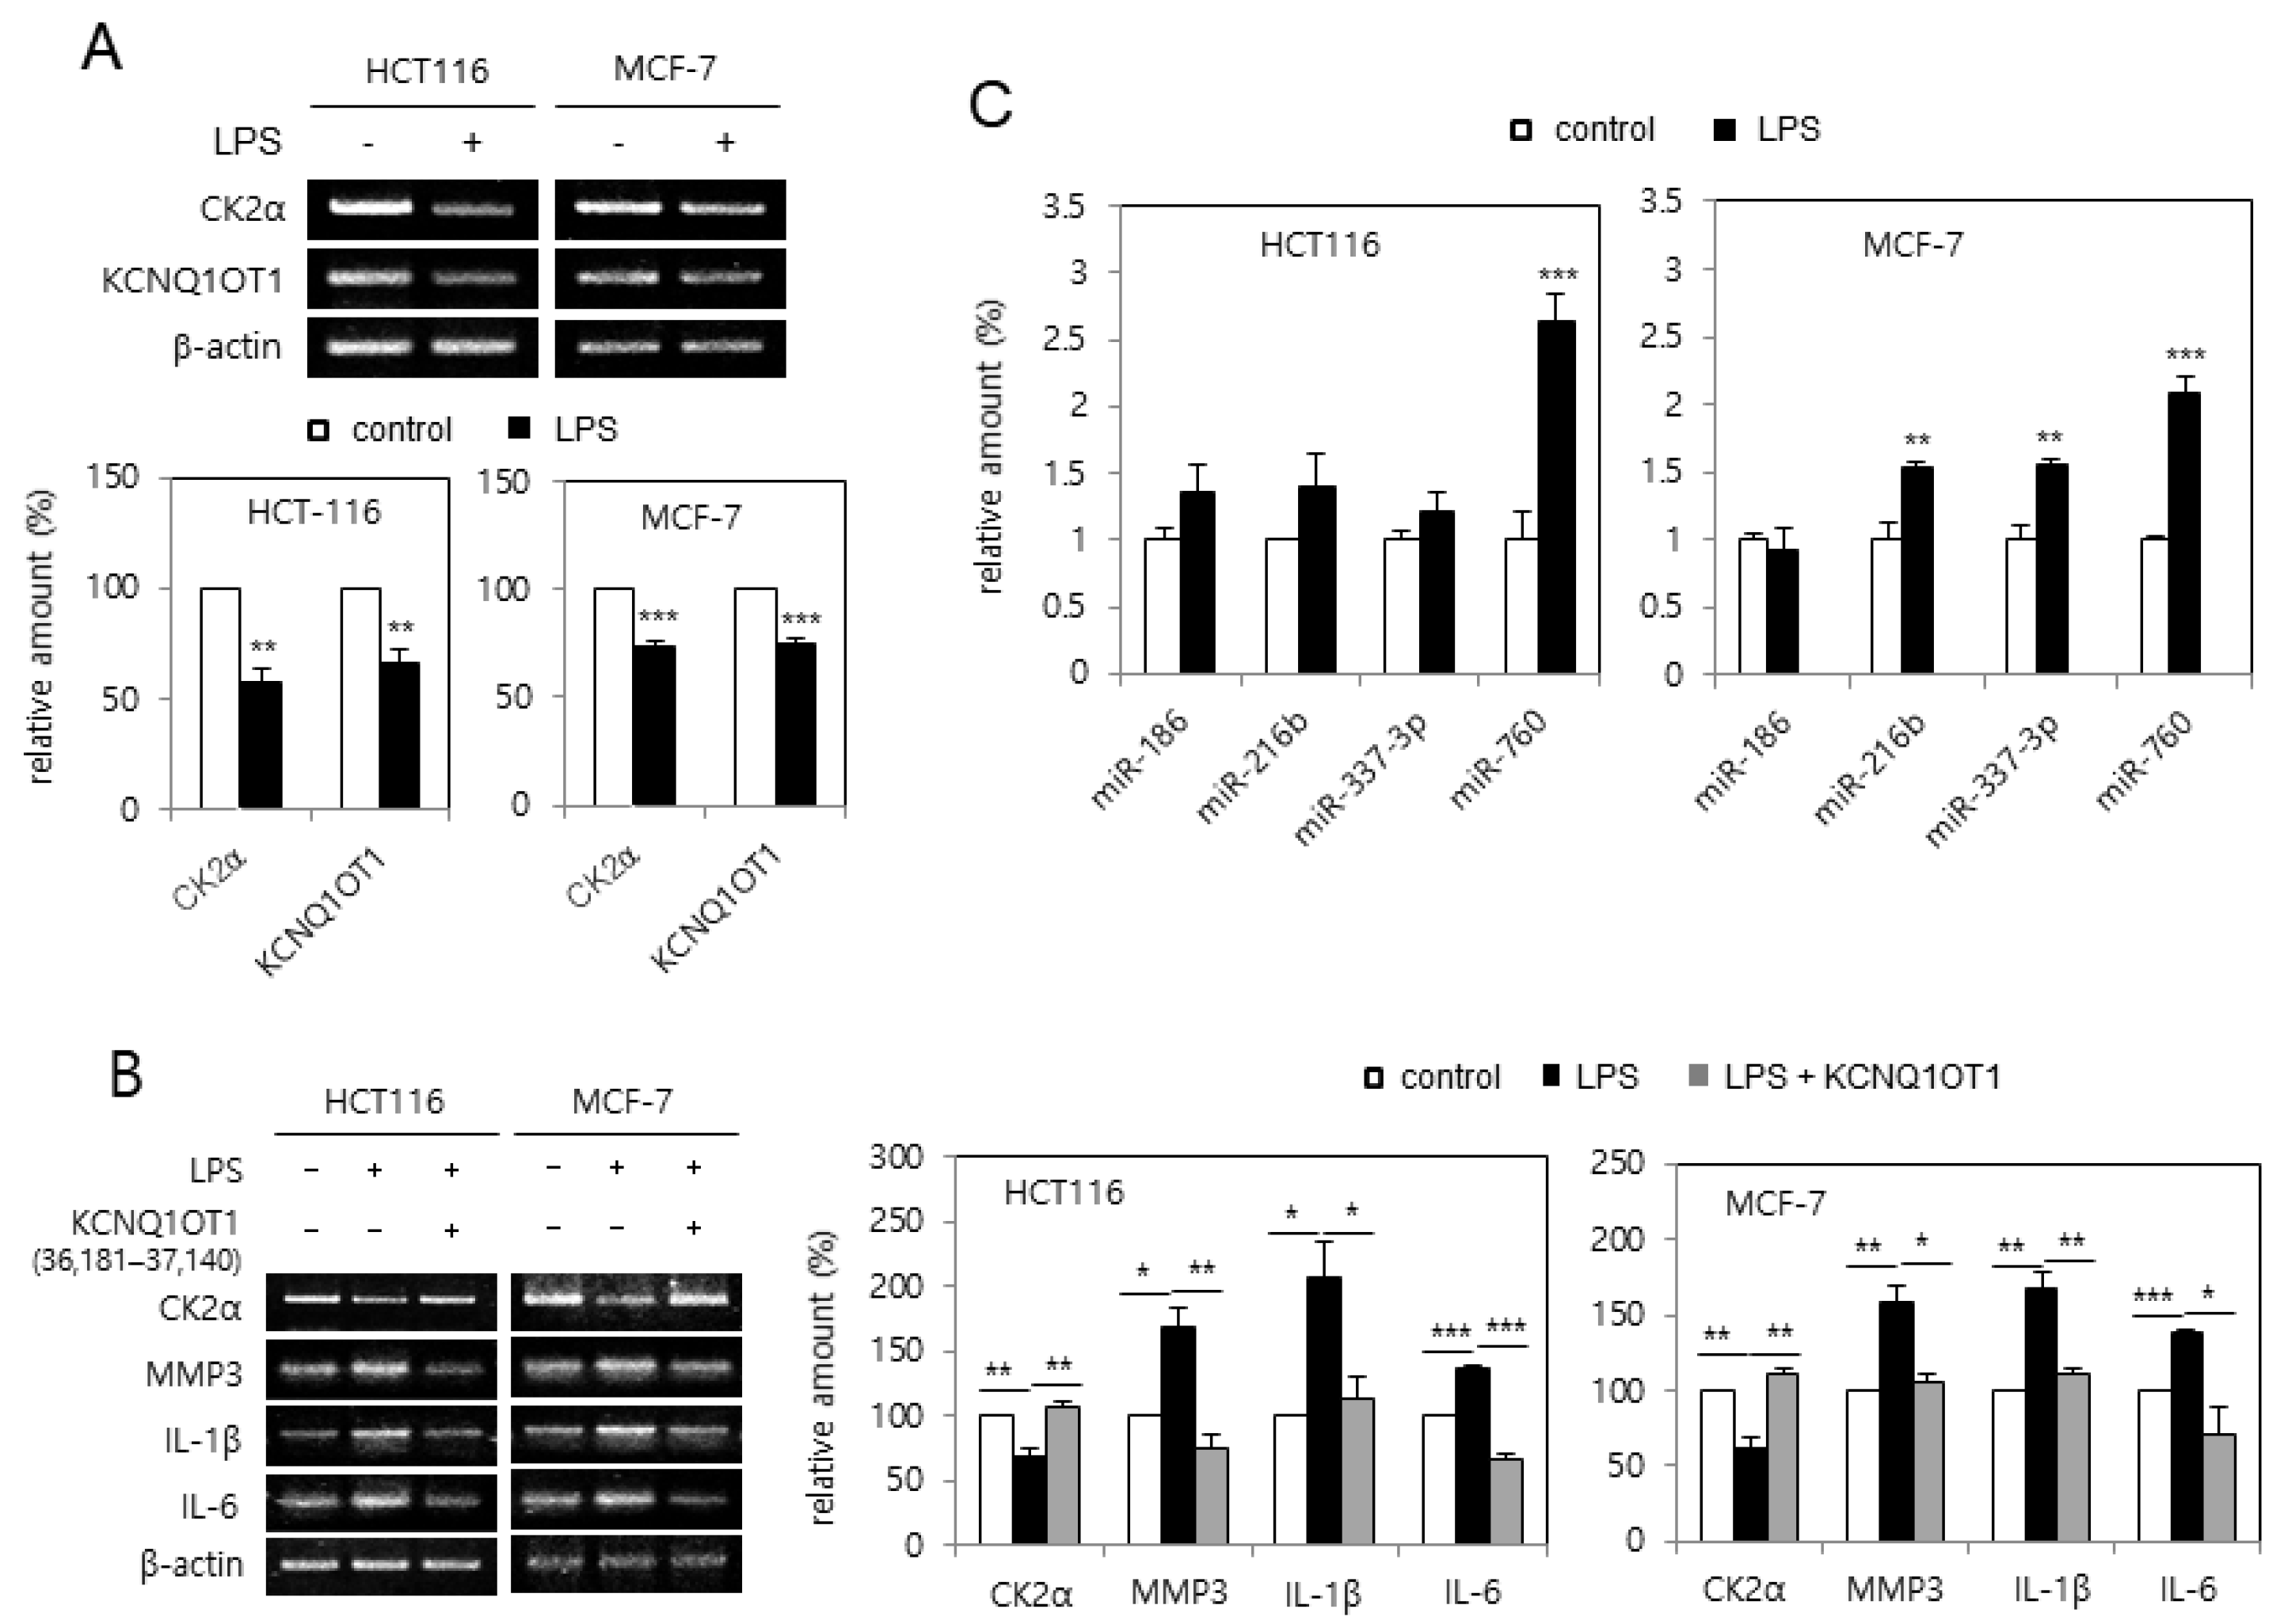
Because treatment with LPS causes cellular senescence by downregulating CK2α [20], it was tested whether LPS downregulated KCNQ1OT1 expression. Treatment with LPS (6 μg/μL) reduced the transcript levels of CK2α and KCNQ1OT1 in human cancer cells (Figure 3A). Furthermore, the effect of KCNQ1OT1 on SASP factor expression in cells treated with LPS was investigated. However, treatment with LPS (6 μg/μL) increased SASP factor (IL-1β, IL-6, and MMP3) expression in human cancer cells; additional treatment with pcDNA3.1-KCNQ1OT1 (36,181–37,140) abrogated the LPS-mediated induction of SASP factors (Figure 3B). It was previously shown that the concerted action of miR-760, miR-186, miR-337-3p, and miR-216b stimulated premature senescence through silencing the CK2α protein in HCT116 cells [21], and that miR-760 and miR-186 were upregulated in replicative senescent IMR-90 cells [22]. The expression patterns of these miRNAs affected by treatment with LPD were determined. Quantitative real-time polymerase chain reaction (qPCR) analysis revealed that the amount of miR-760 increased by more than 200% in both HCT116 and MCF-7 cells treated with LPS (6 μg/μL), in comparison with the control cells. miR-186 was not upregulated by LPS treatment, and miR-337-3p and miR-216b were differently regulated in these cells (Figure 3C). Thus, these results collectively indicate that LPS increased miR-760 amounts via downregulating KCNQ1OT1, resulting in CK2α downregulation-mediated senescence.

Figure 3.
KCNQ1OT1 was involved in lipopolysaccharide (LPS)-mediated senescence-associated secretory phenotype (SASP) factor expression via silencing CK2α in human cancer cells. (A) HCT116 and MCF-7 cells were treated with LPS (6 μg/μL) for two days. The level of each mRNA was determined by RT-PCR using specific primers (top). Representative data from three independent experiments are shown. β-Actin was used as a control. The graphs represent the quantitation of each mRNA relative to β-actin (bottom). (B) Cells were treated with LPS (6 μg/μL) in the absence or presence of pcDNA3.1-KCNQ1OT1 (36,181–37,140) for two days. The level of each mRNA was determined by RT-PCR using specific primers (left). Representative data from three independent experiments are shown. β-Actin was used as a control. The graphs represent the quantitation of each mRNA relative to β-actin (right). (C) Cells were treated with LPS (6 μg/μL) for two days. Total RNA was isolated from cells and subjected to qPCR analysis to determine the relative levels of miR-760, miR-186, miR-337-3p, and miR-216b using RNU48 for normalization. Data are shown as the means ± SEM. * p < 0.05; ** p < 0.01; *** p < 0.001.
2.4. KCNQ1OT1 Upregulated CK2α by Sponging miR-760 in Human Cancer Cells
Next, it was examined whether KCNQ1OT1 regulates CK2α expression via miR-760. HCT116 and MCF-7 cells were transfected with pcDNA3.1-KCNQ1OT1 (36,181–37,140) or KCNQ1OT1 siRNA, along with an miR-760 mimic or inhibitor (sequences shown in Supplementary Table S1). Ectopic expression of KCNQ1OT1 (36,181–37,140) increased the mRNA level of CK2α, whereas additional treatment with the miR-760 mimic suppressed KCNQ1OT1-mediated CK2α upregulation (Figure 4A). In contrast, KCNQ1OT1 knockdown reduced the mRNA level of CK2α, whereas additional treatment with an miR-760 inhibitor suppressed KCNQ1OT1 knockdown-mediated CK2α downregulation (Figure 4B). Both the miR-760 mimic and inhibitor could not change the amount of KCNQ1OT1, indicating that miR-760 was not an upstream regulator of KCNQ1OT1. Altogether, these results indicate that KCNQ1OT1 increases the amount of CK2α mRNA by sponging miR-760. Supplementary Figure S1 shows the sequences and binding sites of KCNQ1OT1, miR-760, and CK2α mRNA, determined using TargetScan and miRanda.
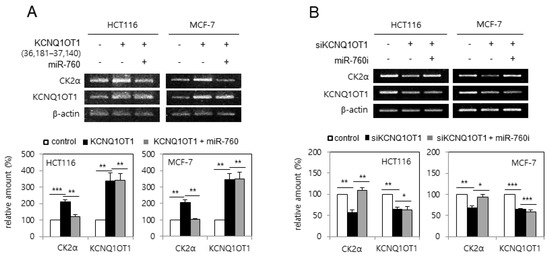
Figure 4.
KCNQ1OT1 upregulated CK2α by sponging miR-760 in human cancer cells. (A) HCT116 and MCF-7 cells were transfected with pcDNA3.1-KCNQ1OT1 (36,181–37,140) for two days in the absence or presence of miR-760. (B) HCT116 and MCF-7 cells were transfected with KCNQ1OT1 siRNA for two days in the absence or presence of miR-760 inhibitor. The level of each mRNA was determined by RT-PCR using specific primers (top). Representative data from three independent experiments are shown. The graphs represent the quantitation of each mRNA relative to β-actin (bottom). Data are reported as mean ± SEM. * p < 0.05; ** p < 0.01; *** p < 0.001.
2.5. CR Condition Upregulated CK2α by miR-760 Downregulation Via KCNQ1OT1 Upregulation in Human Cancer Cells
It was supposed that KCNQ1OT1 expression was upregulated in the CR condition because the level of CK2α mRNA was upregulated in the CR condition [24]. HCT116 and MCF-7 cells were incubated in CR conditions to test this hypothesis. As shown in Figure 5A, the expression of KCNQ1OT1 and CK2α was induced by CR in these cells, whereas additional treatment with KCNQ1OT1 siRNA suppressed CR-mediated CK2α induction, indicating KCNQ1OT1 as a positive regulator of CK2α in CR conditions. Additionally, analysis with real-time qPCR indicated that the level of miR-760 decreased by 70% in CR conditions, whereas the levels of miR-186, miR-216b, and miR-337-3p in CR conditions were unchanged or increased (Figure 5B). Next, the effect of miR-760 on CR-mediated CK2α upregulation was examined. Treatment with an miR-760 mimic suppressed CR-mediated CK2α upregulation, indicating miR-760 as a major negative regulator of CK2α in CR conditions (Figure 5C). Finally, real-time qPCR analysis revealed that treatment with KCNQ1OT1 siRNA increased the levels of miR-760, whereas CR suppressed KCNQ1OT1 knockdown-mediated miR-760 induction (Figure 5D). Altogether, these results indicate that CR downregulated miR-760 by upregulating KCNQ1OT1, resulting in CK2α upregulation in human cancer cells. Because it has been reported that the lncRNA SNHG6 also acts as a sponge of miR-760 in CRC cells [25], it was tested whether CR upregulates SNHG6 expression. However, SNHG6 expression was unchanged in the CR condition (data not shown).
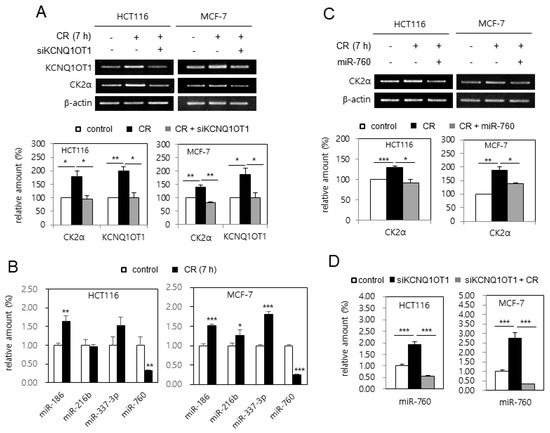
Figure 5.
Calorie restriction (CR) condition upregulated CK2α by miR-760 downregulation via KCNQ1OT1 upregulation in human cancer cells. (A,C and D) HCT116 and MCF-7 cells were transfected with KCNQ1OT1 siRNA (A and D) or miR-760 (C) for 1.5 days and then incubated under CR conditions for seven hours. (B) HCT116 and MCF-7 cells were incubated under CR conditions for seven hours. (A,C) The level of each mRNA was determined by RT-PCR using specific primers (top). Representative data from three independent experiments are shown. β-Actin was used as a control. The graphs represent the quantitation of each mRNA relative to β-actin (bottom). (B,D) Total RNA was isolated from cells and subjected to analysis by qPCR using RNU48 for normalization to determine the relative levels of the indicated miRNAs. Data are shown as the means ± SEM. * p < 0.05; ** p < 0.01; *** p < 0.001.
2.6. KCNQ1OT1 Was Downregulated during Replicative Senescence in Human Lung Fibroblast Cells, Which Was Rescued by CR Conditions
Since CK2α is downregulated in replicative senescent cells and aged tissues [16], it was examined whether KCNQ1OT1 is downregulated during senescence in human lung fibroblast IMR-90 cells. KCNQ1OT1 knockdown decreased the mRNA level of CK2α in IMR-90 cells (Figure 6A). Conversely, KCNQ1OT1 knockdown upregulated SA-β-gal activity in IMR-90 cells, and ectopic expression of CK2α abrogated the induction of SA-β-gal activity mediated by KCNQ1OT1 downregulation (Figure 6B). To determine how KCNQ1OT1 expression decreased by replicative senescence, IMR-90 cells were repeatedly passaged until a senescence-like state was observed. Most cells at PDL 47 stained positively for SA-β-gal, whereas only a few stained positively for SA-β-gal among early-passage (PDL 34) cells (data not shown). The transcript levels of KCNQ1OT1 decreased by 60% in replicative senescent cells (PDL 47), compared to early-passage (PDL 34) cells, indicating that KCNQ1OT1 was downregulated during replicative senescence. Finally, CR conditions increased KCNQ1OT1 by 150% in early-passage (PDL 34) cells compared with normal calorie conditions. However, CR conditions increased KCNQ1OT1 more strongly (by 250%) in replicative senescent cells (PDL 47) compared with normal calorie conditions, indicating that CR can rescue the decreased expression of KCNQ1OT1 and CK2α, mediated by replicative senescence (Figure 6C). Collectively, these data indicate that replicative senescence decreases CK2α expression via downregulating KCNQ1OT1, and that CR can suppress replicative senescence via a KCNQ1OT1–CK2 axis.
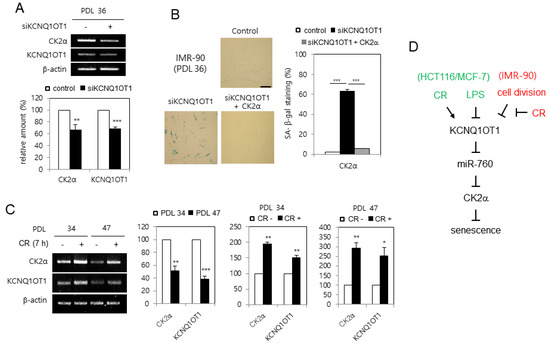
Figure 6.
KCNQ1OT1 was downregulated during replicative senescence in human lung fibroblast cells, which was able to be rescued by calorie restriction (CR) conditions. (A) IMR-90 cells (PDL 36) were transfected with KCNQ1OT1 siRNA. The level of each mRNA was determined by RT-PCR using specific primers (top). Representative data from three independent experiments are shown. β-Actin was used as a control. The graphs represent the quantitation of each mRNA relative to β-actin (bottom). (B) IMR-90 cells (PDL 36) were transfected with KCNQ1OT1 siRNA for two days in the absence or presence of pcDNA3.1-HA-CK2α. Cells were stained with 5-bromo-4-chloro-3-indolyl-β-D-galactoside, and representative images were obtained at 20× magnification (left). Scale bar = 100 μm. Representative data from three independent experiments are shown. The graphs represent the percentage of blue-stained cells (right). (C) IMR-90 cells of PDL 34 and PDL 47 were incubated under CR conditions for seven hours. The level of each mRNA was determined by RT-PCR using specific primers (left). Representative data from three independent experiments are shown. β-Actin was used as a control. The graphs represent the quantitation of each mRNA relative to β-actin (right). Data are reported as mean ± SEM. * p < 0.05; ** p < 0.01; *** p < 0.001. (D) Possible model illustrating the roles of KCNQ1OT1 for senescence and CR. PDL, population doubling level.
3. Discussion
Epigenetic regulation mechanisms, including microRNAs (miRNAs), nucleosome remodeling, DNA methylation, and histone modification, can change heritable phenotypes without changing the DNA sequence [26]. There are two main classes of non-coding RNAs (ncRNAs): the larger long ncRNAs (lncRNAs; >200 nucleotides), and the smaller miRNAs (21–25 nucleotides) [1,2,3]. KCNQ1OT1 was initially identified as an lncRNA, which silences several genes within the kcnq1 locus via establishing a higher-order structure of chromatin [4,5,6]. Recently, other biological functions of KCNQ1OT1 have been reported, including those associated with fibrosis, cerebral ischemia, stroke atherosclerosis, oncogenesis, osteogenic differentiation, fracture healing, and cardiac hypertrophy [7,8,9,10,11,12,13]. However, the detailed mechanisms by which KCNQ1OT1 regulates cellular senescence and CR are still unknown. Therefore, we attempted to clarify whether KCNQ1OT1 was involved in senescence and CR. This study shows that KCNQ1OT1 knockdown induced several cellular senescence markers, including induction of SA-β-gal activity, activation of the p53-p21Cip1/WAF1 pathway, increased H3K9 trimethylation required for SAHF formation, and SASP factor (IL-1β, IL-6, and MMP3) expression, in human cancer HCT116 and MCF-7 cells (Figure 1 and Figure 2A). Because oxidative stress is a significant cause of senescence [14,15], the effect of KCNQ1OT1 on ROS generation was investigated. As expected, KCNQ1OT1 knockdown increased intracellular ROS in HCT116 and MCF-7 cells (Figure 2B). Additionally, the level of KCNQ1OT1 mRNA was reduced in LPS-induced senescent cells, and ectopic expression of KCNQ1OT1 suppressed LPS-mediated SASP factor expression in these cancer cells (Figure 3A,B). Furthermore, KCNQ1OT1 knockdown induced SA-β-gal activity in human lung fibroblast IMR-90 cells, and KCNQ1OT1 expression was decreased during replicative senescence in IMR-90 cells (Figure 6). Collectively, these results indicate that KCNQ1OT1 acts as an anti-aging reagent and antioxidant in human cancer cells and lung fibroblasts.
It was previously shown that CK2 knockdown induces senescence markers such as SA-β-gal staining [16], activation of the p53-p21Cip1/WAF1 pathway [17], ROS generation [18], SAHF formation [19], and SASP factor expression [20]. Therefore, the relationship between KCNQ1OT1 and CK2 was examined. This study shows that CK2α overexpression abrogated these senescence markers caused by KCNQ1OT1 knockdown (Figure 1, Figure 2, and Figure 6B). Additionally, KCNQ1OT1 knockdown decreased the protein and mRNA levels of CK2α (Figure 1B, Figure 2A, and Figure 4B), and KCNQ1OT1 (36,181–37,140) overexpression stimulated the mRNA level of CK2α (Figure 4A), indicating that KCNQ1OT1 functions as a positive regulator of CK2α in cells. Recent studies have revealed that lncRNAs can sponge miRNAs, inhibiting the expression of target mRNA [1,2,3]. Because previous studies have shown that miR-760 interacts with CK2α [21,22] and KCNQ1OT1 [27], a signaling network of KCNQ1OT1, CK2α, and miR-760 was examined. This study shows that additional treatment with an miR-760 mimic suppressed KCNQ1OT1-mediated CK2α upregulation, and additional treatment with an miR-760 inhibitor suppressed KCNQ1OT1 knockdown-mediated CK2α downregulation (Figure 4). Consistently, treatment with LPS, which decreased KCNQ1OT1 expression, increased the level of miR-760 (Figure 3C). Hence, these studies suggest that the amount of KCNQ1OT1 RNA can titrate miR-760 and thereby regulate miR-760 availability for binding to the mRNA of CK2α. KCNQ1OT1 and CK2α can crosstalk through their transcript’s ability to compete for miR-760 binding.
Because CR provides an anti-aging effect [23], how CR regulates KCNQ1OT1 and miR-760 was examined. This study shows that the CR condition increased the expression of KCNQ1OT1 and CK2α and decreased the level of miR-760 (Figure 5A,B). Furthermore, treatment with an miR-760 mimic suppressed CR-mediated CK2α upregulation (Figure 5C). Consistently, KCNQ1OT1 knockdown increased the levels of miR-760, whereas additional CR conditions suppressed KCNQ1OT1 knockdown-mediated miR-760 induction (Figure 5D). Finally, the CR condition rescued the decreased expression of KCNQ1OT1 and CK2α, mediated by replicative senescence (Figure 6C). Altogether, these results reveal that the CR condition downregulated miR-760 via upregulating KCNQ1OT1, resulting in CK2α upregulation in human cells. Although lncRNA SNHG6 acts as a sponge of miR-760 in CRC cells [25], CR did not change the SNHG6 expression under experimental conditions (data not shown). How does CR upregulate KCNQ1OT1 expression? Other groups have previously demonstrated that the transcription factors NFY and β-catenin regulate KCNQ1OT1 [28,29]. However, CR could not regulate the expression of NF-Y and β-catenin, at least under experimental conditions (data not shown). Thus, additional studies are required to identify a specific upstream regulator of KCNQ1OT1 in CR conditions.
In conclusion, on the basis of this study’s results, a model for the role of KCNQ1OT1 in senescence and CR was proposed. KCNQ1OT1 upregulates CK2α by sponging miR-760. The KCNQ1OT1–miR-760–CK2 pathway is involved in senescence and CR. LPS treatment and cell division in fibroblasts induce senescence by downregulating KCNQ1OT1. CR suppresses senescence by activating the KCNQ1OT1–miR-760–CK2 pathway (Figure 6D). Therefore, this study suggests KCNQ1OT1 as a novel therapeutic target in aging and age-related diseases, as well as an alternative treatment that mimics the effects of CR.
4. Materials and Methods
4.1. Materials
Antibodies against CK2α (#sc-373894), p53 (#sc-71820), p21Cip1/WAF1 (#sc-6246), and β-actin (#sc-47778) were obtained from Santa Cruz Biotechnology (Santa Cruz, CA, USA). Antibodies specific for histone H3- (#ab1791) and histone H3 Lys9 trimethylation (H3K9me3) (#ab8898) were purchased from Abcam (Cambridge, England). Antibodies specific for H3 Lys9 acetylation (H3K9Ac) (#06-942), 5-bromo-4-chloro-3-indolyl-β-D-galactoside, and LPS were obtained from Sigma Chemical Co. (St. Louis, MO, USA). CM-H2DCFDA was obtained from Invitrogen (Carlsbad, CA, USA).
4.2. Cell Culture and CR
Human diploid fibroblast IMR-90 cells were obtained from the American Type Culture Collection (ATCC, Manassas, VA, USA) at a population doubling level (PDL) of 24. Human breast cancer MCF-7 cells, colon cancer HCT116 cells (ATCC), and IMR-90 cells were cultured in Dulbecco’s modified Eagle’s medium containing 10% (v/v) fetal bovine serum and 1% (v/v) penicillin-streptomycin, in a humidified atmosphere of 95% (v/v) air and 5% (v/v) CO2 at 37 °C. The PDL of IMR-90 cells was calculated using the formula PD = log(Nf/Ni)/log2, where Nf is the final cell number, and Ni is the initial number of seeded cells. For cell starvation (calorie restriction), the cells with phosphate-buffered saline were washed twice and cultured in Earle’s balanced salt solution (Thermo Fisher, Waltham, MA, USA), with 5.5 mM glucose, without amino acids, for seven hours.
4.3. RNA Extraction and miRNA Quantitative Real-Time PCR
RNA was extracted from cells using TRIzol reagent (Invitrogen). miRNA quantitative real-time PCR (qPCR) was performed using a TaqMan miRNA reverse transcription kit, and via an miRNA assay with an ABI PRISM 7000 HT system (Applied Biosystems, CA, USA), following the manufacturer’s instructions. The U48 small nucleolar RNA (RNU48) was chosen as the housekeeping small RNA reference gene. Real-time PCRs were performed in triplicate from three different cDNA samples.
4.4. DNA Transfection and RNA Interference
To generate pcDNA3.1-KCNQ1OT1 (36,181–37,140), the fragment of nucleotides from 36,181 to 37,140 of KCNQ1OT1 was chemically synthesized and ligated into the BamHI/NotI site of the pcDNA3.1 vector (Invitrogene). Cells were transfected with pcDNA3.1-HA-CK2α and pcDNA3.1-KCNQ1OT1 (36,181– 37,140) using Polyfect (Qiagen, Hilden, Germany), according to the manufacturer’s instructions. Mimics for miR-760 and control miRNA were purchased from Genolution, Inc. (Seoul, Korea). The antisense inhibitor for miR-760 was obtained from Panagene, Inc. (Seoul, Korea). The siRNA sequence for CK2α was 5′-GAUGACUACCAGCUGGUUCdTdT-3′. The siRNA sequence for KCNQ1OT1 was 5′–GCCAAUGGAUAGAGAGCAAdTdT-3′. The siRNA sequence for the negative control was 5′-GCUCAGAUCAAUACGGAGAdTdT-3′. RNAs were transfected into cells using Lipofectamine (Invitrogen) for 48 h.
4.5. SA-β-gal Activity Assay
Cells in sub-confluent cultures were washed with ice-cold phosphate-buffered saline (PBS), fixed with 3% (v/v) formaldehyde in PBS for 10 min at room temperature, and then incubated with a staining solution containing 1 mg/mL 5-bromo-4-chloro-3-indolyl β-D-galactoside, 40 mM citric acid-sodium phosphate (pH 6.0), 5 mM potassium ferricyanide, 5 mM potassium ferrocyanide, 150 mM NaCl, and 2 mM MgCl2 for 24 h at 37 °C. Blue-stained cells were counted in at least ten fields at 400 × magnification and expressed as a percentage of positive cells.
4.6. Measurement of Intracellular ROS Levels
The oxidation-sensitive fluorescent probe CM-H2DCFDA was used to evaluate ROS levels. Cells were treated with 5 μM CM-H2DCFDA for 20 min at 37 °C in the dark, detached by trypsinization, and then washed with PBS. Fluorescence intensity was determined using a Coulter Elite ESP Cell Sorter (Beckman Coulter Inc., Brea, CA, USA). The forward- and side-scatter gates were set to exclude any dead cells from the analysis; at least 10,000 events within the gate were acquired per sample.
4.7. Reverse Transcription (RT)-PCR
Total RNA was extracted from cells. RNA was reverse transcribed using gene-specific primers and reverse transcriptase (Takara Bio Inc., Japan), and the resulting cDNA was PCR amplified. The primers used for the assays are listed in Supplementary Table S2. The PCR products were resolved on a 1.5% agarose gel. Quantification of the reverse transcription-PCR bands was performed using densitometry. β-Actin RNA levels were used to standardize the amount of RNA in each sample.
4.8. Immunoblotting
Proteins were separated on 10% polyacrylamide gels in the presence of SDS and then transferred onto nitrocellulose membranes. The membranes were blocked with 5% (w/v) non-fat, dried skim milk in TBST (20 mM Tris-HCl (pH 7.4), 150 mM NaCl, and 0.05% Tween 20) for 2 h and then incubated with specific antibodies in 1% (w/v) non-fat, dried skim milk for 1 h. The membranes were washed thrice with TBST and then treated with the ECL system to develop the signals (GE Healthcare, Little Chalfont, UK). When deemed necessary, membranes were stripped with stripping buffer (2% SDS, 100 mM β-mercaptoethanol, and 50 mM Tris-HCl (pH 7.0)) at 50 °C for 1 h with gentle shaking and then re-probed with anti-β-actin antibody as an internal loading control.
4.9. Statistical Analysis
One-way analysis of variance testing of the data was conducted using the SPSS package program (IBM, Armonk, NY, USA). The results were considered significant if the p-value was <0.05. Duncan’s multiple range test was conducted if the differences between the groups were identified as α = 0.05.
Supplementary Materials
The following supporting information can be downloaded at: https://www.mdpi.com/article/10.3390/ijms23031888/s1.
Author Contributions
Y.-S.B. conceived and designed the experiments, Y.L. performed the experiments, and Y.-S.B. wrote the paper. All authors have read and agreed to the published version of the manuscript.
Funding
This research was supported by the Basic Science Research Program, through the National Research Foundation of Korea (NRF) funded by the Ministry of Science, ICT and Future Planning (NRF-2019R1A2C1005219).
Institutional Review Board Statement
Not applicable.
Informed Consent Statement
Not applicable.
Data Availability Statement
Not applicable.
Conflicts of Interest
The authors declare no conflict of interest.
References
- Ulitsky, I.; Bartel, D.P. lincRNAs: Genomics, evolution, and mechanisms. Cell 2013, 154, 26–46. [Google Scholar] [CrossRef] [PubMed] [Green Version]
- Esteller, M. Non-coding RNAs in human disease. Nat. Rev. Genet. 2011, 12, 861–874. [Google Scholar] [CrossRef] [PubMed]
- Quinn, J.J.; Chang, H.Y. Unique features of long non-coding RNA biogenesis and function. Nat. Rev. Genet. 2016, 17, 47–62. [Google Scholar] [CrossRef] [PubMed]
- Mancini-Dinardo, D.; Steele, S.J.; Levorse, J.M.; Ingram, R.S.; Tilghman, S.M. Elongation of the Kcnq1ot1 transcript is required for genomic imprinting of neighboring genes. Genes Dev. 2006, 20, 1268–1282. [Google Scholar] [CrossRef] [PubMed] [Green Version]
- Pandey, R.R.; Mondal, T.; Mohammad, F.; Enroth, S.; Redrup, L.; Komorowski, J.; Nagano, T.; Mancini-Dinardo, D.; Kanduri, C. Kcnq1ot1 antisense noncoding RNA mediates lineage-specific transcriptional silencing through chromatin-level regulation. Mol. Cell 2008, 32, 232–246. [Google Scholar] [CrossRef]
- Kanduri, C. Kcnq1ot1: A chromatin regulatory RNA. Semin. Cell. Dev. Biol. 2011, 22, 343–350. [Google Scholar] [CrossRef]
- Yang, F.; Qin, Y.; Lv, J.; Wang, Y.; Che, H.; Chen, X.; Jiang, Y.; Li, A.; Sun, X.; Yue, E.; et al. Silencing long non-coding RNA Kcnq1ot1 alleviates pyroptosis and fibrosis in diabetic cardiomyopathy. Cell Death Dis. 2018, 9, 1000. [Google Scholar] [CrossRef]
- Yu, S.; Yu, M.; He, X.; Wen, L.; Bu, Z.; Feng, J. KCNQ1OT1 promotes autophagy by regulating miR-200a/FOXO3/ATG7 pathway in cerebral ischemic stroke. Aging Cell 2019, 18, e12940. [Google Scholar] [CrossRef]
- Yu, X.H.; Deng, W.Y.; Chen, J.J.; Xu, X.D.; Liu, X.X.; Chen, L.; Shi, M.W.; Liu, Q.X.; Tao, M.; Ren, K. LncRNA kcnq1ot1 promotes lipid accumulation and accelerates atherosclerosis via functioning as a ceRNA through the miR-452-3p/HDAC3/ABCA1 axis. Cell Death Dis. 2020, 11, 1043. [Google Scholar] [CrossRef]
- Cagle, P.; Qi, Q.; Niture, S.; Kumar, D. KCNQ1OT1: An oncogenic long noncoding RNA. Biomolecules 2021, 11, 1602. [Google Scholar] [CrossRef]
- Wang, J.L.; Wei, X.; Wang, A.G.; Bai, Y.; Wu, X.J. KCNQ1OT1 regulates osteogenic differentiation of hBMSC by miR-320a/Smad5 axis. Eur. Rev. Med. Pharmacol. Sci. 2020, 24, 2843–2854. [Google Scholar] [PubMed]
- Chen, L.; Xiong, Y.; Yan, C.; Zhou, W.; Endo, Y.; Xue, H.; Hu, Y.; Hu, L.; Leng, X.; Liu, J.; et al. LncRNA KCNQ1OT1 accelerates fracture healing via modulating miR-701-3p/FGFR3 axis. FASEB J. 2020, 34, 5208–5222. [Google Scholar] [CrossRef] [PubMed] [Green Version]
- Chen, Y.; Zhang, Z.; Zhu, D.; Zhao, W.; Li, F. Knockdown of KCNQ1OT1 attenuates cardiac hypertrophy through modulation of the miR-2054/AKT3 axis. J. Thorac. Dis. 2020, 12, 4771–4780. [Google Scholar] [CrossRef] [PubMed]
- Childs, B.G.; Durik, M.; Baker, D.J.; van Deursen, J.M. Cellular senescence in aging and age-related disease: From mechanisms to therapy. Nat. Med. 2015, 21, 1424–1435. [Google Scholar] [CrossRef] [Green Version]
- McHugh, D.; Gil, J. Senescence and aging: Causes, consequences, and therapeutic avenues. J. Cell Biol. 2018, 217, 65–77. [Google Scholar] [CrossRef]
- Ryu, S.W.; Woo, J.H.; Kim, Y.H.; Lee, Y.S.; Park, J.W.; Bae, Y.S. Downregulation of protein kinase CKII is associated with cellular senescence. FEBS Lett. 2006, 580, 988–994. [Google Scholar] [CrossRef] [Green Version]
- Kang, J.Y.; Kim, J.J.; Jang, S.Y.; Bae, Y.S. The p53-p21Cip1/WAF1 pathway is necessary for cellular senescence induced by the inhibition of protein kinase CKII in human colon cancer cells. Mol. Cells 2009, 28, 489–494. [Google Scholar] [CrossRef]
- Jeon, S.M.; Lee, S.J.; Kwon, T.K.; Kim, K.J.; Bae, Y.S. NADPH oxidase is involved in protein kinase CKII down-regulation-mediated senescence through elevation of the level of reactive oxygen species in human colon cancer cells. FEBS Lett. 2010, 584, 3137–3142. [Google Scholar] [CrossRef] [Green Version]
- Park, J.W.; Kim, J.J.; Bae, Y.S. CK2 downregulation induces senescence-associated heterochromatic foci formation through activating SUV39h1 and inactivating G9a. Biochem. Biophys. Res. Commun. 2018, 505, 67–73. [Google Scholar] [CrossRef]
- Song, J.; Bae, Y.S. CK2 down-regulation increases the expression of senescence-associated secretory phenotype factors through NF-κB activation. Int. J. Mol. Sci. 2021, 22, 406. [Google Scholar] [CrossRef]
- Kim, S.Y.; Lee, Y.H.; Bae, Y.S. miR-186, miR-216b, miR-337-3p, and miR-760 cooperatively induce cellular senescence by targeting α subunit of protein kinase CKII in human colorectal cancer cells. Biochem. Biophys. Res. Commun. 2012, 429, 173–179. [Google Scholar] [CrossRef] [PubMed]
- Lee, Y.H.; Kim, S.Y.; Bae, Y.S. Upregulation of miR-760 and miR-186 is associated with replicative senescence in human lung fibroblast cells. Mol. Cells 2014, 37, 620–627. [Google Scholar] [CrossRef] [PubMed] [Green Version]
- Sinclair, D.A. Toward a unified theory of caloric restriction and longevity regulation. Mech. Ageing Dev. 2005, 126, 987–1002. [Google Scholar] [CrossRef] [PubMed]
- Park, J.W.; Jeong, J.; Bae, Y.S. Protein kinase CK2 is upregulated by calorie restriction and induces autophagy. Mol. Cells 2022, 45, 1–50. [Google Scholar] [CrossRef]
- Zhu, Y.; Xing, Y.; Chi, F.; Sun, W.; Zhang, Z.; Piao, D. Long noncoding RNA SNHG6 promotes the progression of colorectal cancer through sponging miR-760 and activation of FOXC1. Onco. Targets Ther. 2018, 11, 5743–5752. [Google Scholar] [CrossRef] [Green Version]
- Ramzan, F.; Vickers, M.H.; Mithen, R.F. Epigenetics, microRNA and metabolic syndrome: A comprehensive review. Int. J. Mol. Sci. 2021, 22, 5047. [Google Scholar] [CrossRef]
- Xian, D.; Zhao, Y. LncRNA KCNQ1OT1 enhanced the methotrexate resistance of colorectal cancer cells by regulating miR-760/PPP1R1B via the cAMP signalling pathway. J. Cell. Mol. Med. 2019, 23, 3808–3823. [Google Scholar] [CrossRef]
- Pandey, R.R.; Ceribelli, M.; Singh, P.B.; Ericsson, J.; Mantovani, R.; Kanduri, C. NF-Y regulates the antisense promoter, bidirectional silencing, and differential epigenetic marks of the Kcnq1 imprinting control region. J. Biol. Chem. 2004, 279, 52685–52693. [Google Scholar] [CrossRef] [Green Version]
- Sunamura, N.; Ohira, T.; Kataoka, M.; Inaoka, D.; Tanabe, H.; Nakayama, Y.; Oshimura, M.; Kugoh, H. Regulation of functional KCNQ1OT1 lncRNA by β-catenin. Sci. Rep. 2016, 6, 20690. [Google Scholar] [CrossRef] [Green Version]


Publisher’s Note: MDPI stays neutral with regard to jurisdictional claims in published maps and institutional affiliations. |
© 2022 by the authors. Licensee MDPI, Basel, Switzerland. This article is an open access article distributed under the terms and conditions of the Creative Commons Attribution (CC BY) license (https://creativecommons.org/licenses/by/4.0/).