Article

MicroRNA-mRNA Regulatory Network Mediates Activation of mTOR and VEGF Signaling in African American Prostate Cancer

1
Department of Pharmaceutical Sciences, School of Pharmacy, University of Maryland Eastern Shore, Princess Anne, MD 21853, USA
2
Toxicology Program, University of Maryland Eastern Shore, Princess Anne, MD 21853, USA
3
Hormone Related Cancers Program, University of Maryland Greenebaum Comprehensive Cancer Center, Baltimore, MD 21201, USA
*
Author to whom correspondence should be addressed.
These authors contributed equally to this work.
Int. J. Mol. Sci. 2022, 23(6), 2926; https://doi.org/10.3390/ijms23062926
Submission received: 1 February 2022 / Revised: 25 February 2022 / Accepted: 5 March 2022 / Published: 8 March 2022
(This article belongs to the Special Issue RNA Regulatory Networks at the Crossroad of Human Diseases 2.0)

Abstract

:
African American (AA) men exhibit 1.6-fold higher prostate cancer (PCa) incidence and 2.4-fold higher mortality rates compared to European American (EA) men. In addition to socioeconomic factors, emerging evidence suggests that intrinsic biological differences may explain part of PCa disparities. In this study, we applied microRNA (miRNA)-driven bioinformatics to evaluate whether differential miRNA-mRNA regulatory networks play a role in promoting the AA PCa disparities. 10 differentially expressed miRNAs were imported to mirPath V.3 algorithm, leading to identification of 58 signaling pathways differentially regulated in AA PCa versus EA PCa. Among these pathways, we particularly focused on mTOR and VEGF signaling, where we identified 5 reciprocal miRNA-mRNA pairings: miR-34a-5p/HIF1A, miR-34a-5p/PIK3CB, miR-34a-5p/IGFBP2, miR-99b-5p/MTOR and miR-96-5p/MAPKAPK2 in AA PCa versus EA PCa. RT-qPCR validation confirmed that miR-34a-5p, miR-99b-5p and MAPKAPK2 were downregulated, while miR-96-5p, IGFBP2, HIF1A, PIK3CB and MTOR were upregulated in AA PCa versus EA PCa cells. Transfection of miRNA mimics/antagomir followed by RT-qPCR and Western blot analysis further verified that IGFBP2, HIF1A and PIK3CB are negatively regulated by miR-34a-5p, whereas MTOR and MAPKAPK2 are negatively regulated by miR-99b-5p and miR-96-5p, respectively, at mRNA and protein levels. Targeting reciprocal pairings by miR-34a-5p mimic, miR-99b-5p mimic or miR-96-5p antagomir downregulates HIF1α, PI3Kβ, mTOR, IGFBP2 but upregulates MAPKAPK2, subsequently reducing cell proliferation and sensitizing docetaxel-induced cytotoxicity in PCa cells. These results suggest that miRNA-mRNA regulatory network plays a critical role in AA PCa disparities, and targeting these core miRNA-mRNA pairings may reduce PCa aggressiveness and overcome the chemoresistance in AA patients.

1. Introduction

Human microRNAs (miRNAs) are ~22 nucleotide (nt) non-coding RNAs, involved in the regulation of post-transcriptional gene expression profile. It is estimated that more than 60% of human protein coding genes are regulated by the miRNAs [1,2]. MiRNAs play critical roles in biological processes such as cell proliferation, cell growth, intracellular signaling, cell differentiation, cell apoptosis, cellular metabolism and carcinogenesis [3,4]. They usually bind to the 3′-untranslated region (3′-UTR) of the target mRNAs, destabilizing the mRNA and control protein production through translational silencing [5]. The genes encoding miRNAs locate in exonic or intronic regions and are transcribed by RNA polymerase II, resulting in pri-miRNAs. The pri-miRNAs are further processed by Drosha complex to form the ~70 nt stem-loop pre-miRNAs [6]. Exportin-5 and Ran-GTP transports pre-miRNAs from the nucleus to cytoplasm, where Dicer further processes pre-miRNAs into 20–25 nucleotide long mature miRNA-miRNA duplexes. These mature miRNAs are then loaded onto Argonaute 2 protein (AGO2) and RNA-induced silencing complex (RISC) to achieve site-specific cleavage/degradation or translational inhibition of the target mRNAs [7,8].
Prostate cancer (PCa) is now the most frequently diagnosed cancer and the second leading cause of cancer deaths among American men [9]. Notably, African Americans (AAs) are 1.6 times more likely to develop PCa, and 2.4 times more likely to die from this disease compared to their European American (EA) counterparts [9]. Multiple socioeconomic factors have been postulated to explain the observed PCa disparities [10,11]. However, higher mortality and recurrence is still observed in AAs after adjustment for socioeconomic status [12,13], indicating that intrinsic biological differences account for at least part of the PCa disparities [10,13,14].
MiRNAs play important roles in either promoting or preventing cancer development and/or progression. MiRNAs promoting tumorigenesis are referred as oncogenic miRNAs or ‘oncomirs’, while miRNAs function as tumor suppressor are termed tumor suppressive miRNAs [15,16]. Accumulating evidence indicates that miRNAs and their regulatory and biogenesis mechanisms are involved in the development of prostate cancer. Previous studies have shown that let-7a, let-7c, miR-15a, miR-20, miR-24, miR-29, miR-125b, miR-128a, miR-143, miR-145, miR-181a, miR-181b, and miR-222 are downregulated in both PCa cell lines and/or tissues [17,18,19,20,21], whereas let-7d*, miR-17-5p, miR-21, miR-141, miR-148a, miR-182, miR-200b, miR-200c, and miR-375 are upregulated in PCa cells and/or tissues [18,20,21]. Recent studies further shed light on deciphering the miRNA-mediated mechanisms underlying PCa disparities. For instance, overexpression of miR-130b has been linked to PCa aggressiveness and poor clinical outcome in AA [22]. Previous study has also shown that miR-182 is upregulated in AA PCa vs. EA PCa, and the high-level miR-182 is correlated with poorer survival rate in AA PCa [23]. In addition, downregulation of miR-34b and miR-146a have been observed in AA PCa vs. EA PCa [24,25]. AR and ETV1 were shown to be directly targeted by miR-34b, and the downregulation of miR-34b enhances AR expression and promotes cell proliferation in AA PCa [25]. Moreover, we previously employed a systems biology approach to evaluate the functional impacts of population-associated miRNAs and mRNAs in a three-way comparison in PCa (AA PCa vs. EA PCa, AA PCa vs. AA normal, EA PCa vs. EA normal). ErbB signaling has been identified as a critical cascade significantly upregulated by miRNA-mRNA regulatory network in AA PCa [26]. In this study, we revisited our genomic data and particularly focused on the 10 differently expressed miRNAs identified between AA and EA PCa, to further assess their functional impacts in AA PCa disparities. Specifically, we performed an integrative genomic approach, combining a miRNA-driven pathway analysis algorithm with miRNA target prediction and unique mRNA mapping, to identify cancer signaling pathways significantly influenced by the miRNA-mRNA regulatory network in AA PCa. Through this analysis, we have identified 58 significant pathways regulated by miRNAs and their target mRNAs in AA PCa. Notably, ErbB-PI3K-AKT-mTOR-HIF-VEGF axis was identified as central signaling cascade highly regulated by AA-depleted/enriched miRNAs and mRNAs in AA PCa. A novel panel of reciprocal miRNA-mRNA pairings were defined as core miRNA-mRNA regulatory components within mTOR and VEGF signaling, potentially serving as potential precision biomarkers and novel therapeutic targets for AA PCa.

2. Results

2.1. MirPath v.3 Analysis Reveals 68 Signaling Pathways Differentially Regulated by miRNA-mRNA Networks in AA PCa and EA PCa

In previous genomic studies, total RNA samples isolated from 20 AA and 15 EA PCa specimens were subjected to miRNA profiling [26] and mRNA profiling [26,27] analysis. 10 miRNAs were found differentially expressed between AA and EA PCa, including 8 AA-depleted miRNAs (downregulated in AA PCa vs. EA PCa) and 2 AA-enriched miRNAs (upregulated in AA PCa vs. EA PCa) (Supplemental Table S1) [26]. By importing these 10 AA-depleted/enriched miRNAs into the mirPath v.3 algorithm [28], 58 KEGG pathways were identified as significant pathways (adjusted p-value < 0.05) differentially regulated between AA PCa and EA PCa (Table 1). Several canonical oncogenic signaling pathways (such as ErbB, mTOR, HIF-1, VEGF and focal adhesion pathways) were significantly influenced by the AA-depleted/enriched miRNAs (Table 1). In addition, critical signaling pathways related to cancer, cell cycle, inflammation and cell death regulations (such as p53, cell cycle, insulin, NF-kappa B and TNF signaling) were also differentially regulated in AA PCa vs. EA PCa (Table 1).

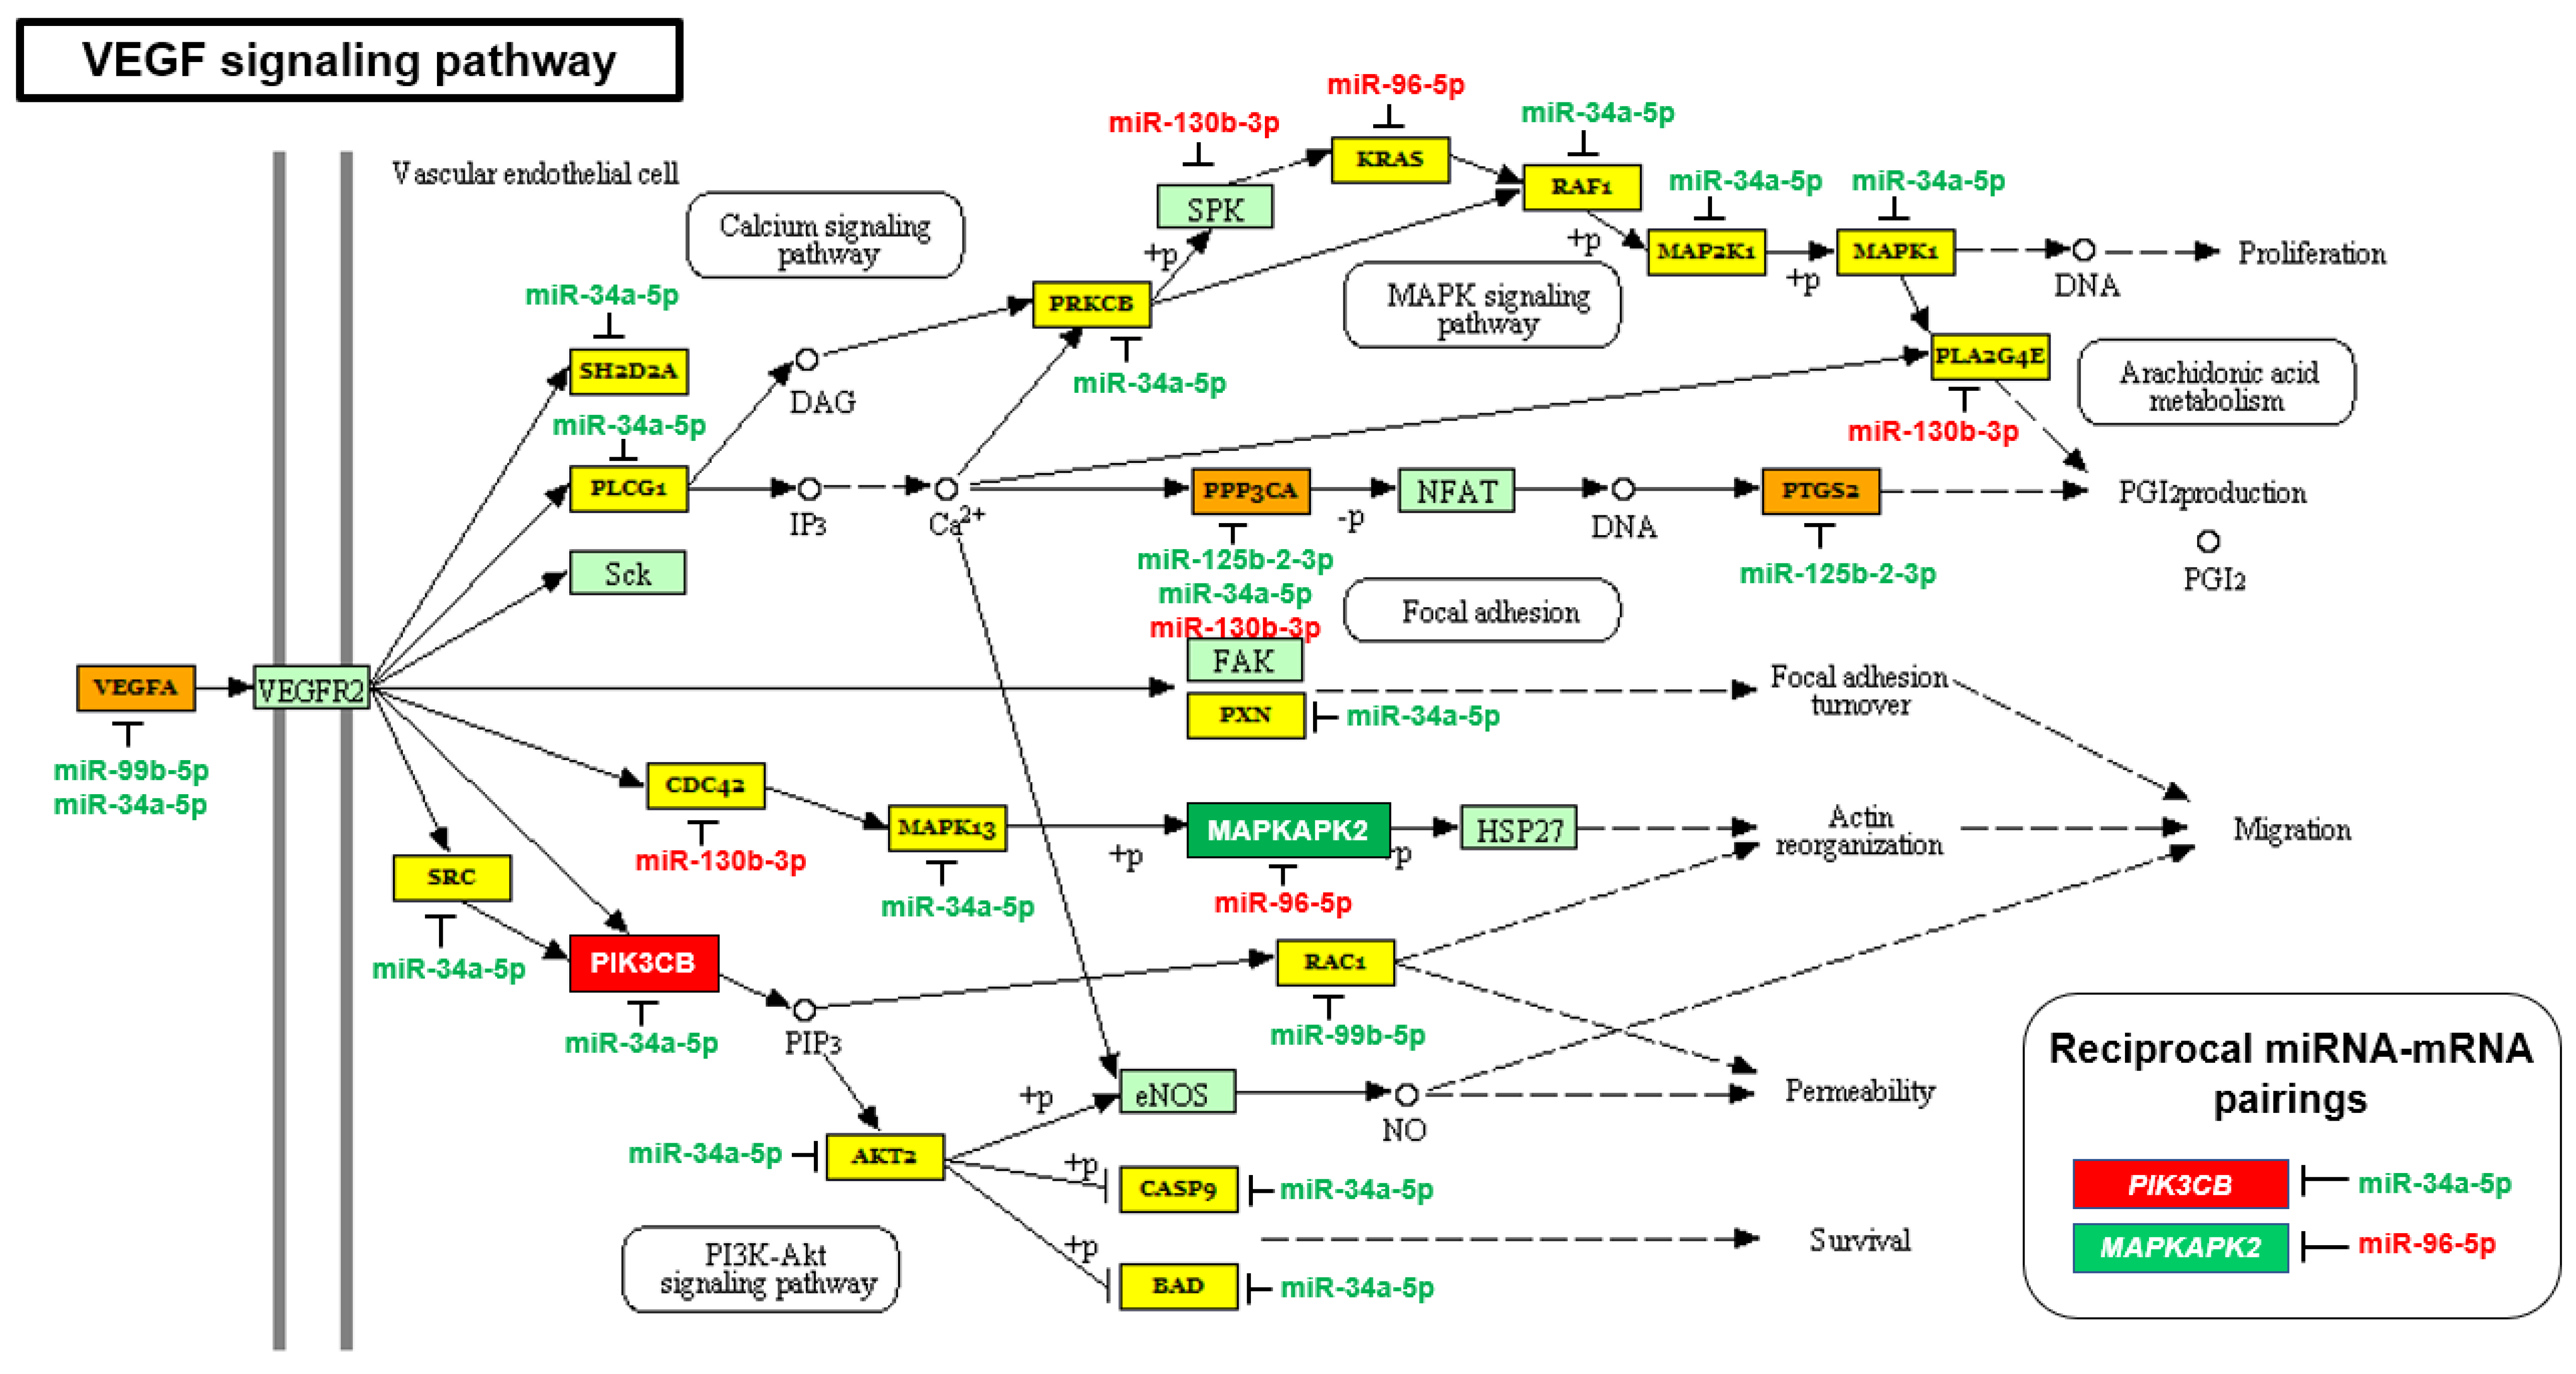
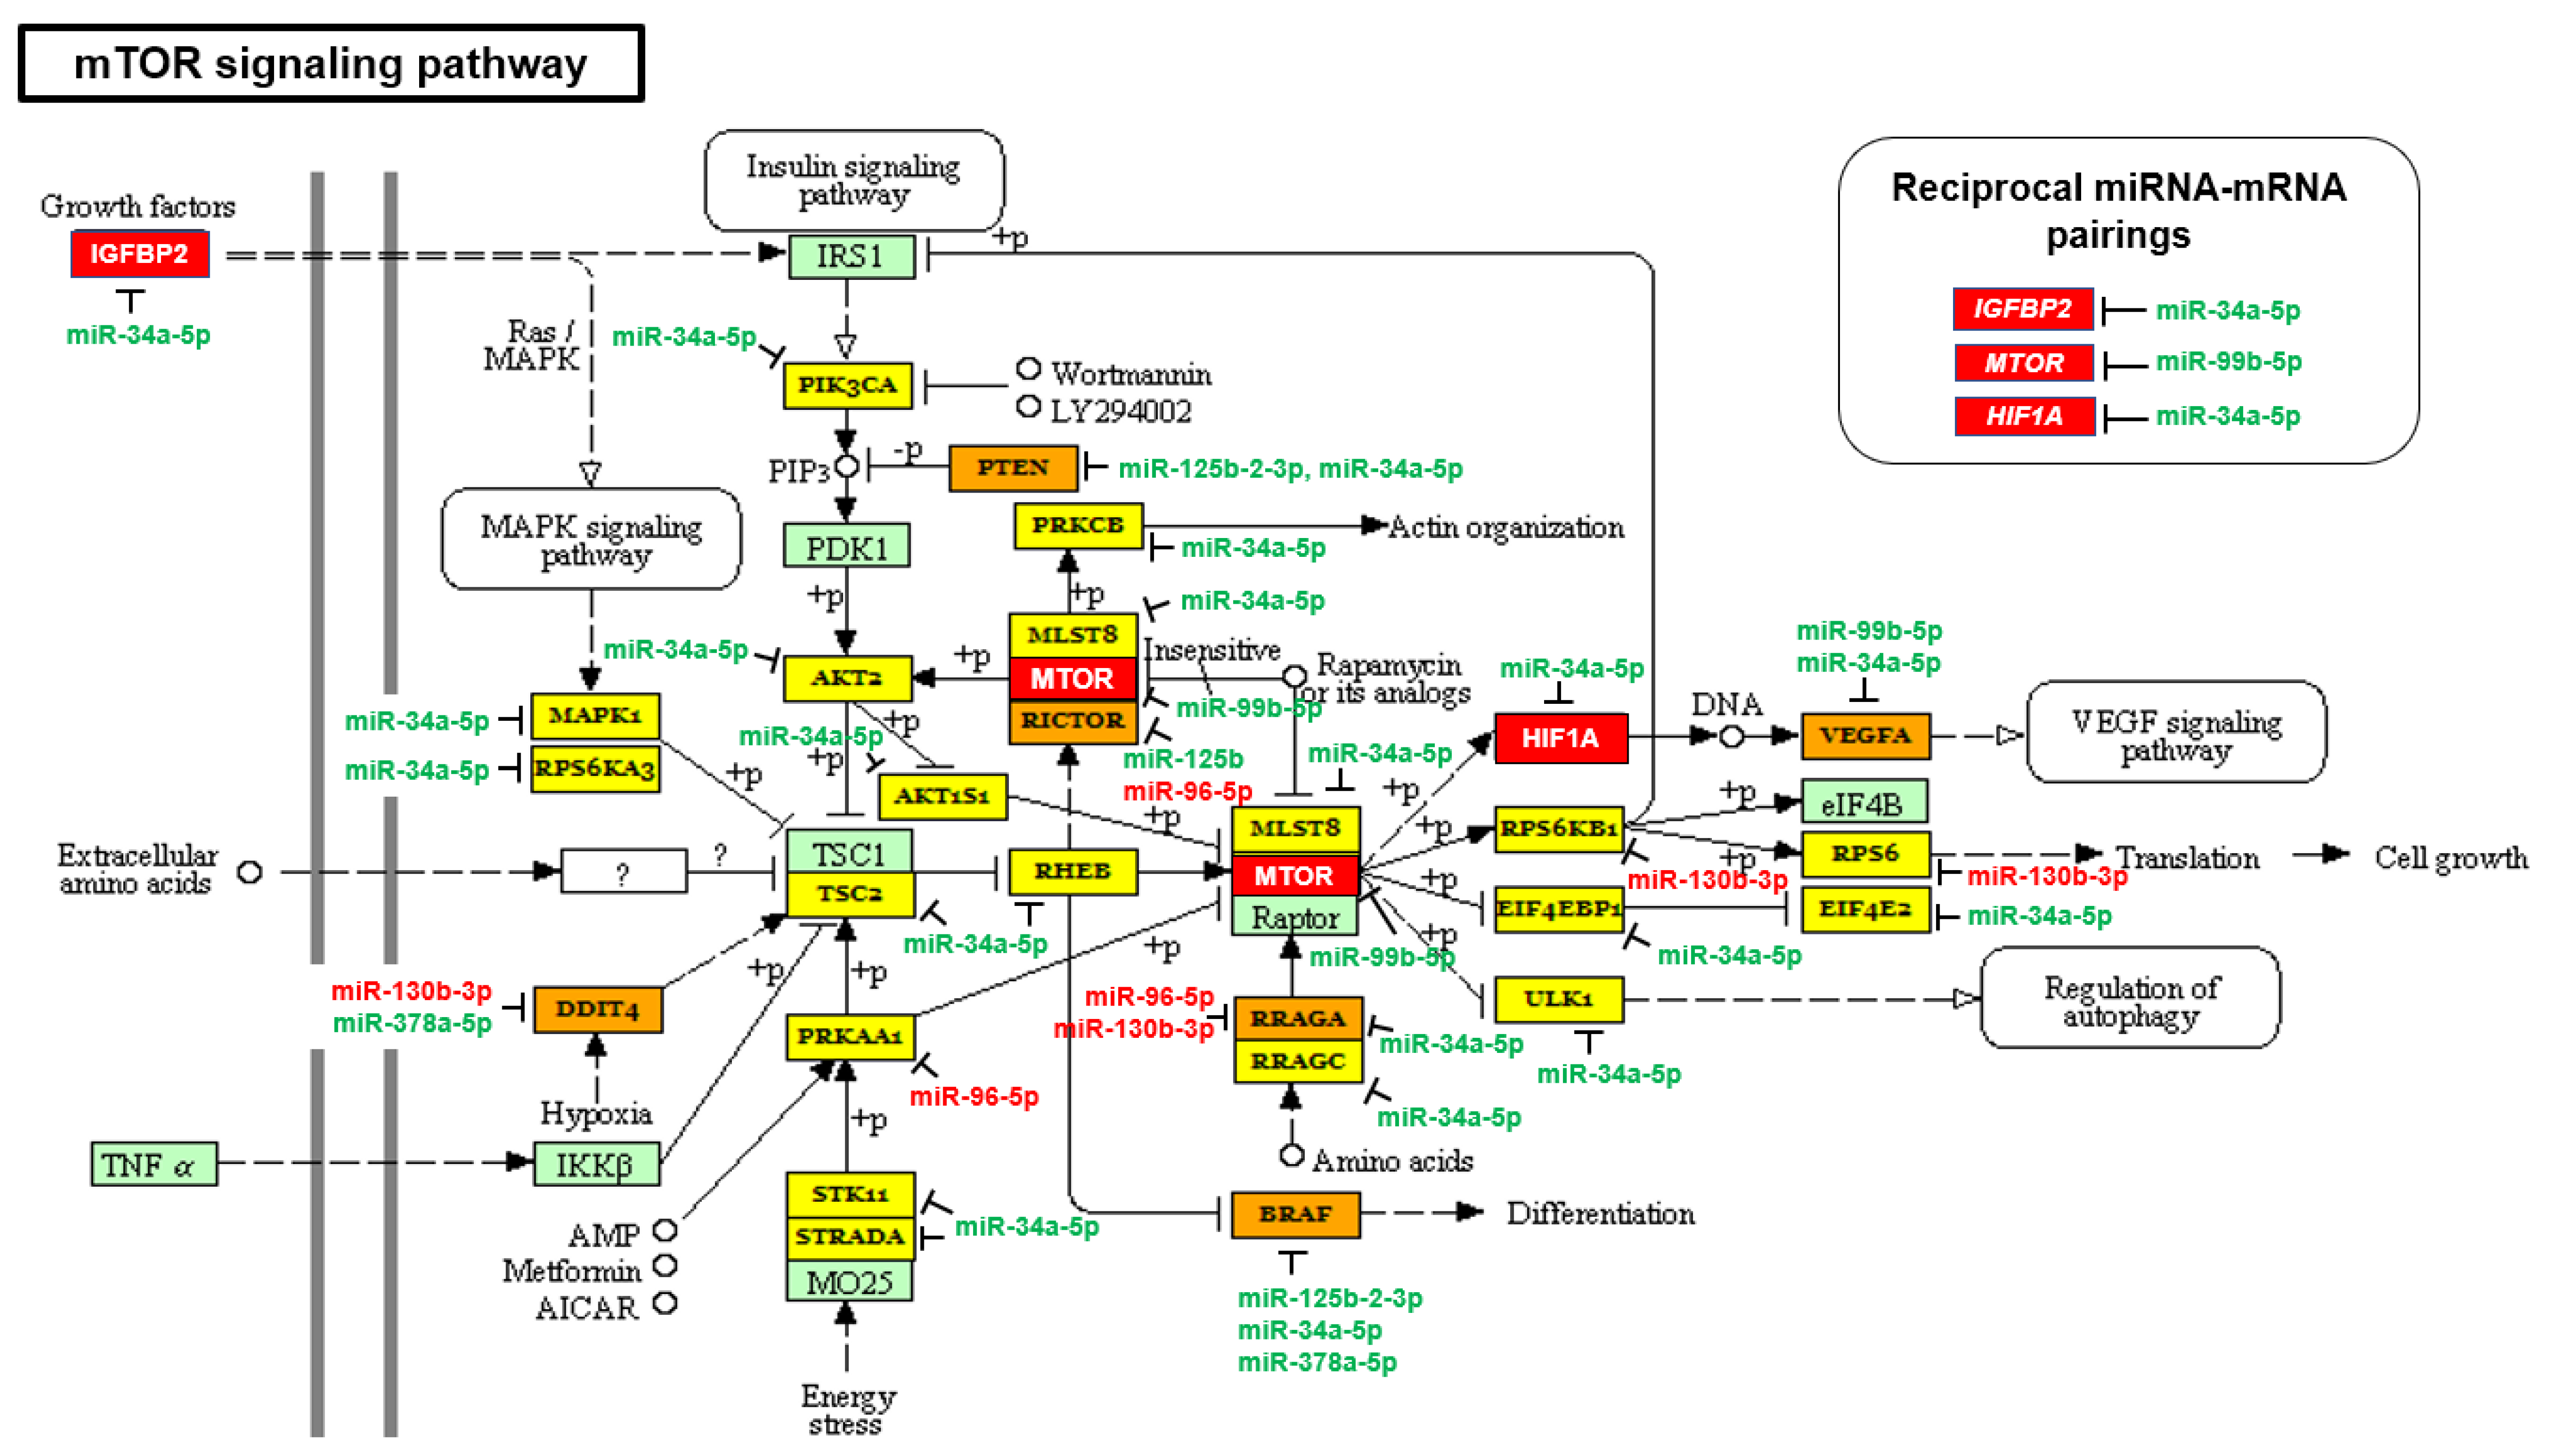
2.2. The mTOR and VEGF Signaling Pathways Are Upregulated in AA PCa Compared to EA PCa

Previously, we identified ErbB signaling pathway, by employing global test using mRNA profiling data and coupling with miRNA mapping, as a significant pathway that is highly activated by miRNA-mRNA interaction in AA PCa [26]. In this study, we first performed the miRNA-driven pathway analysis using mirPath v3 [28] then followed by mapping of differentially expressed mRNAs [26] in the identified pathways. Consistent with the previous finding [26], ErbB signaling ranks as a top canonical pathway significantly regulated by AA depleted/enriched miRNAs and mRNAs (adjusted p-value = 1.35 × 10⁻⁵, Table 1). Notably, downstream of ErbB (or EGFR) signaling, the mTOR, HIF1A and VEGF signaling were also identified as significant signaling pathways influenced by AA depleted/enriched miRNAs and mRNAs (Table 1). These results suggest that ErbB (EGFR)-mTOR-HIF1A-VEGF axis as a critical signaling cascade mediated by miRNA-mRNA regulatory network in AA PCa. To understand the miRNA-mRNA regulation in this signaling cascade, we conducted a detailed miRNA/mRNA mapping in mTOR (HIF1A is part of the KEGG mTOR signaling) and VEGF signaling in AA PCa vs. EA PCa. In KEGG mTOR signaling (Figure 1), three oncogenes (IGFBP2, MTOR and HIF1A) were upregulated in AA PCa vs. EA PCa. The majority of KEGG mTOR signaling components (25 out of 38 genes) were predicted to be targeted by AA-depleted miRNAs (miR-34a-5p, miR-99b-5p, miR-125b-2-3p and miR-378a-5p, which were downregulated in AA PCa vs. EA PCa), and only five genes were predicted to be targeted by AA-enriched miRNAs (miR-96-5p and miR-130b-3p, which were upregulated in AA PCa vs. EA PCa). From the observed miRNA/mRNA mapping results, the mTOR signaling is theoretically upregulated in AA PCa compared to EA PCa. Similarly, 60% of VEGF signaling components (17 out of 28 genes) were predicted to be targeted by AA-depleted miRNAs (miR-34a-5p and miR-125b-2-3p), and six genes targeted by AA-enriched miRNAs (miR-96-5p and miR-130b-3p) (Figure 2). These results implicate that VEGF signaling is preferably upregulated in AA PCa when compared to EA PCa. As noted in our previous study, reciprocal miRNA-mRNA pairings defined from miRNA and mRNA profiling data (down/up or up/down in miRNA/mRNA expression in AA PCa vs. EA PCa) represent the most robust miRNA-mRNA interaction that can be experimentally validated [26]. In the mTOR and VEGF signaling pathways, we have identified five miRNA-mRNA reciprocal pairings in AA PCa. These miRNA-mRNA pairings included: miR-34a-5p/IGFBP2 (down/up), miR-34a-5p/HIF1A (down/up), miR-34a-5p/PIK3CB (down/up), miR-99b-5p/MTOR (down/up), and miR-96-5p/MAPKAPK2 (up/down) (Figure 1 and Figure 2).

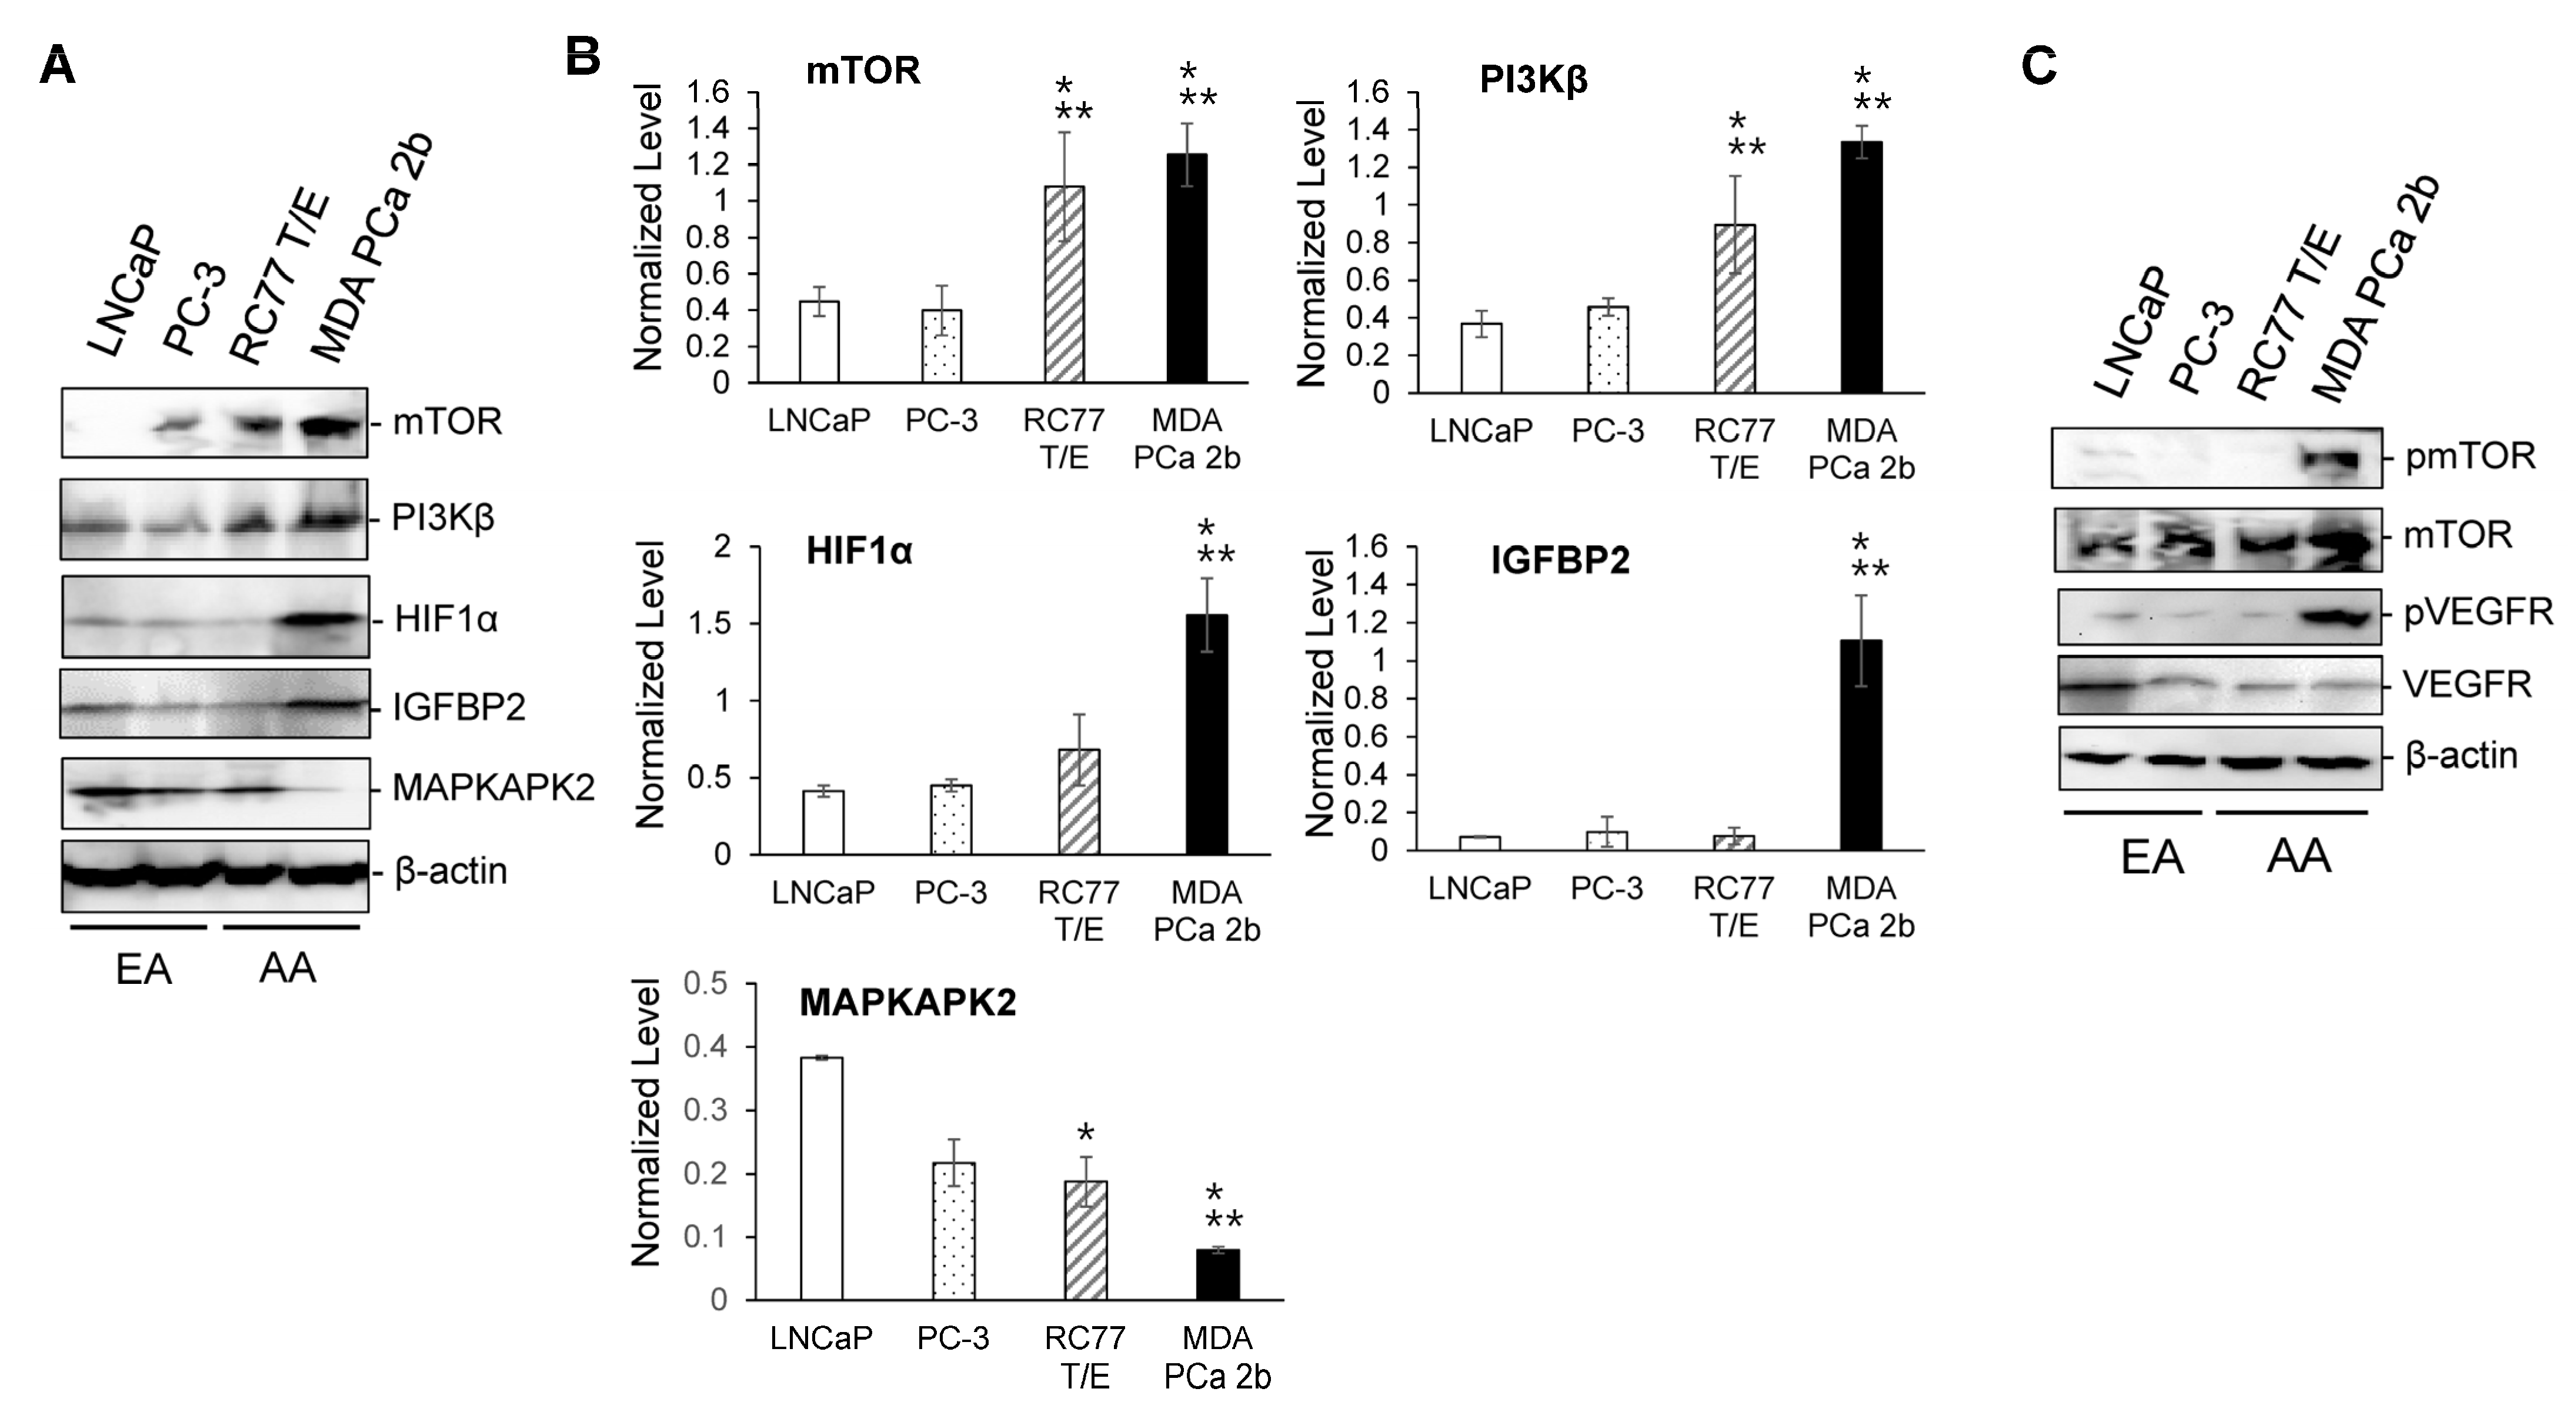
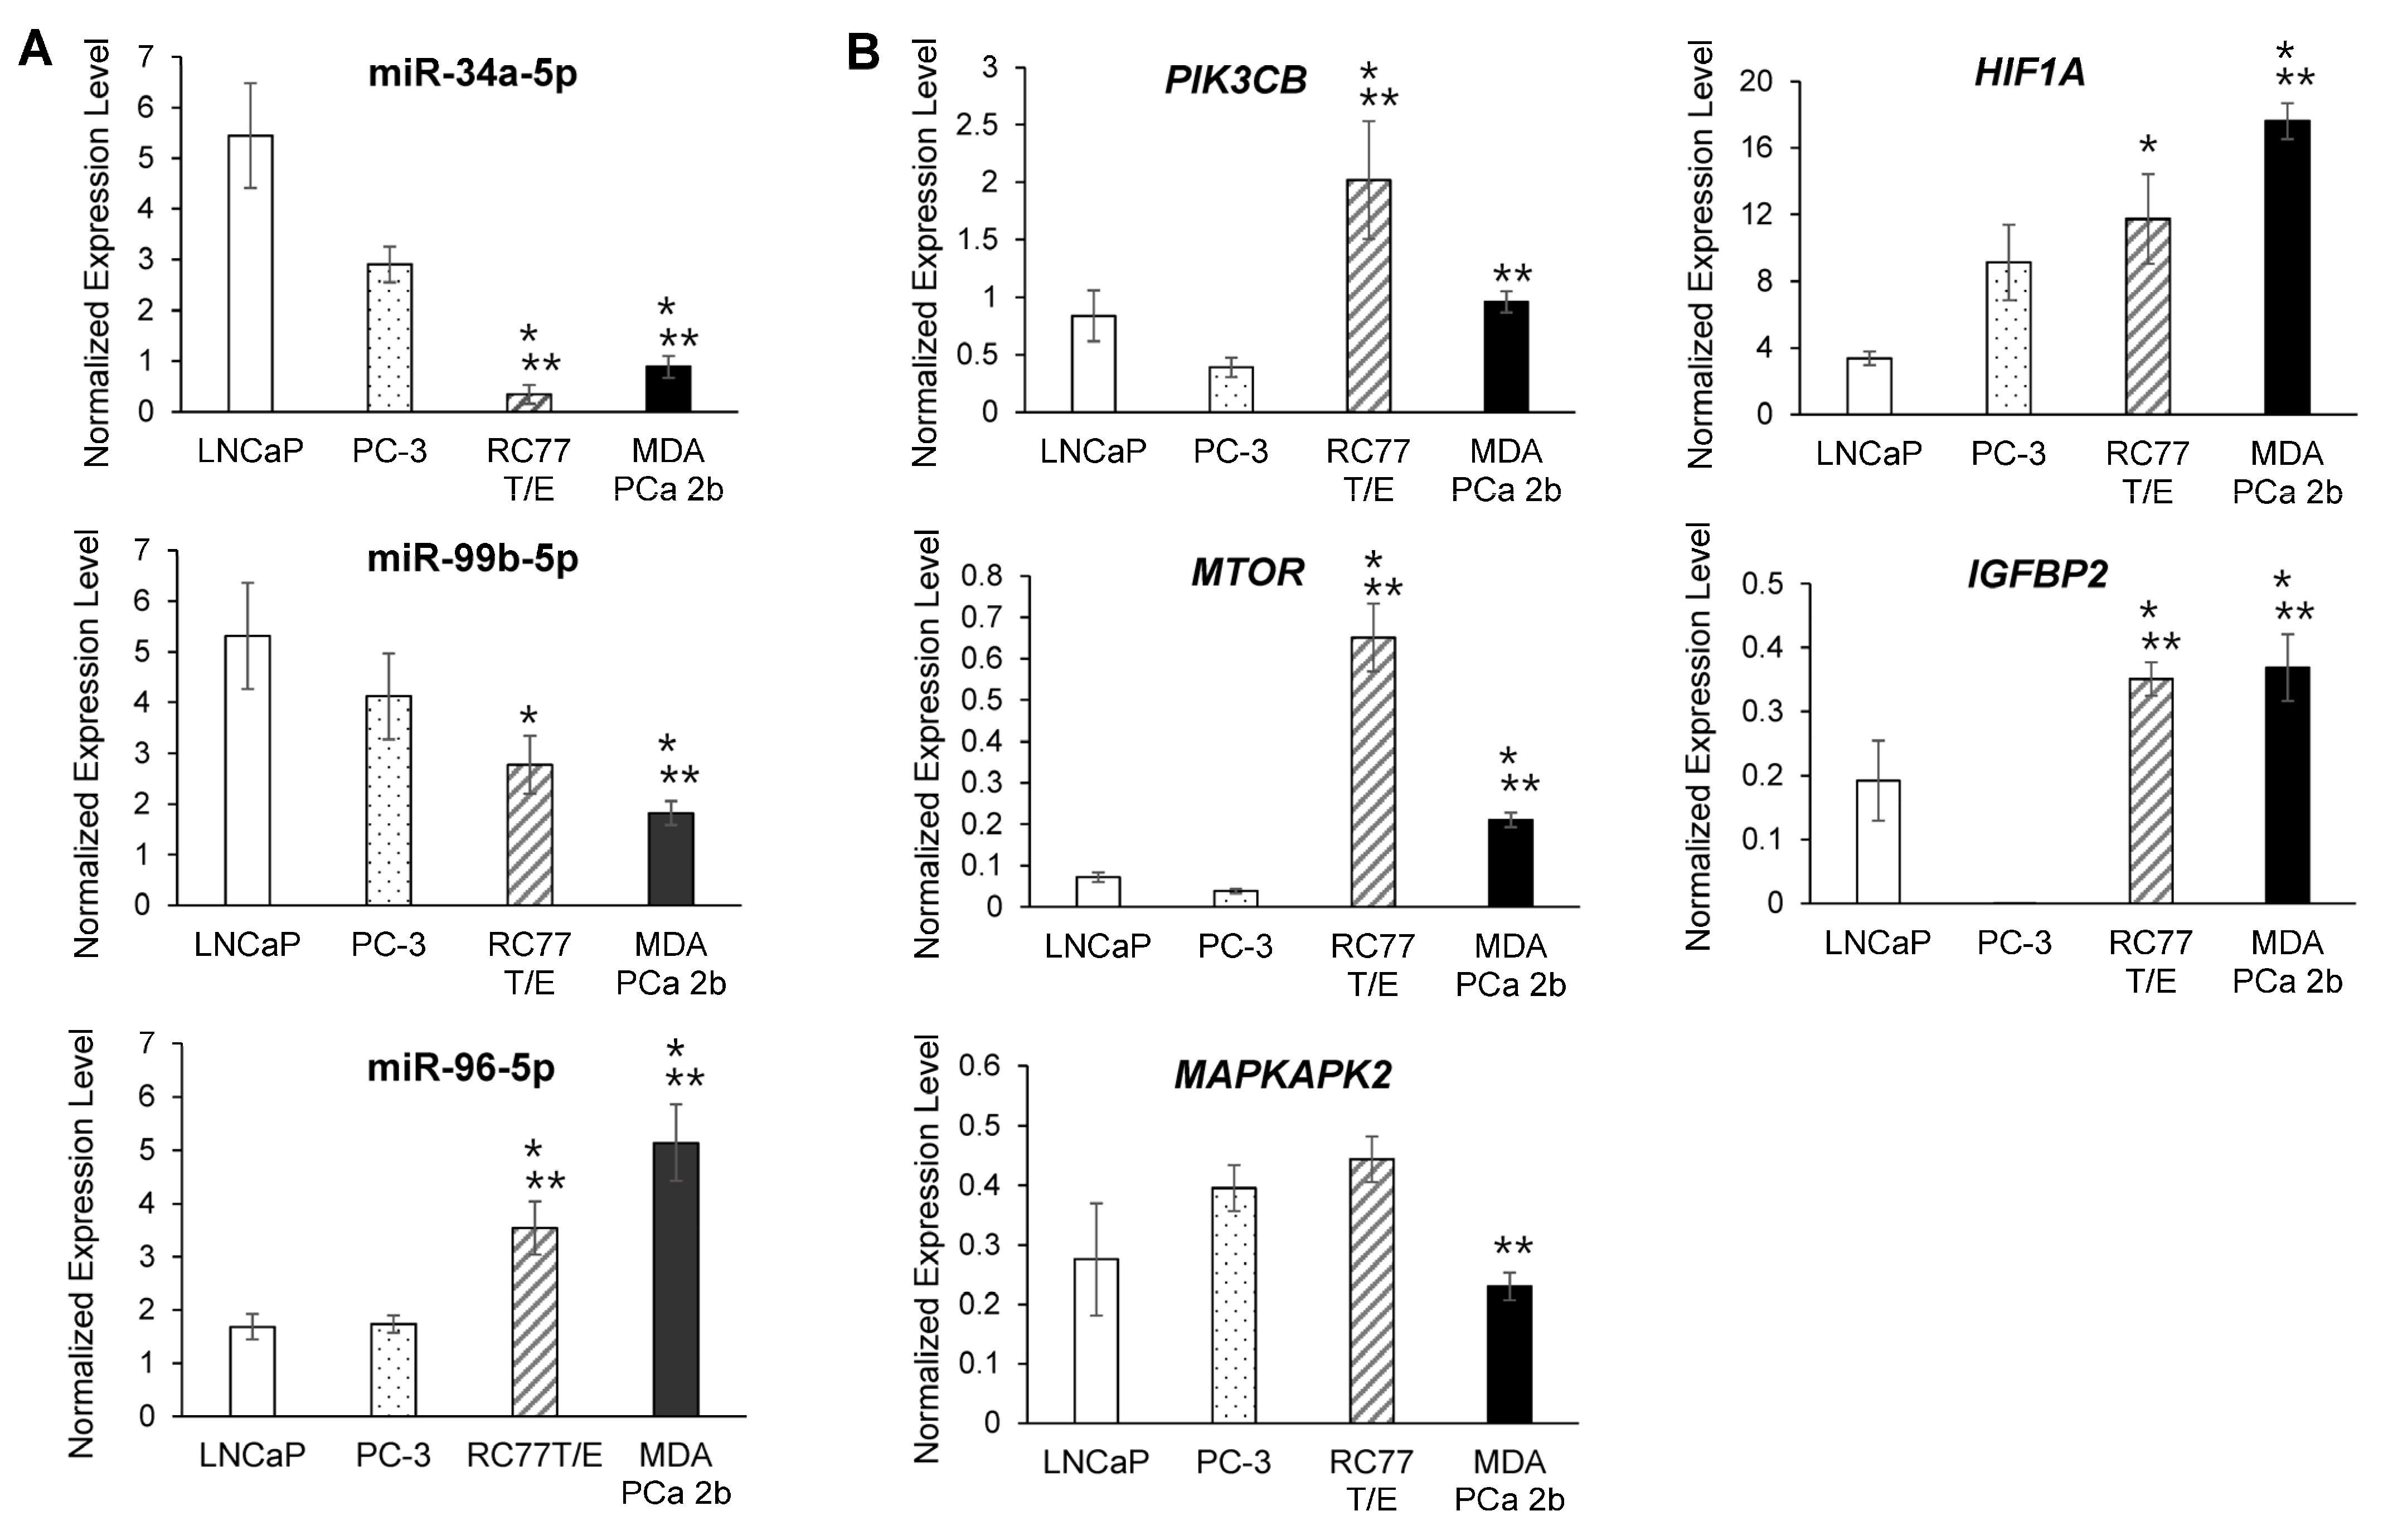
2.3. RT-qPCR Validations and Western Blot Analysis for the Candidate Reciprocal miRNA-mRNA Pairings in EA and AA PCa Tissues and Cell Models

To verify the expression level of the candidate miRNA-mRNA pairings, RT-qPCR assays were performed to examine the miRNA and mRNA expression levels in EA PCa and AA PCa patient specimens and cell line models. RNA samples from 11 EA PCa and 10 AA PCa needle biopsy specimens were subjected to RT-qPCR validation of miR-34a-5p, miR-99b-5p, and miR-96-5p expression levels. The RT-qPCR validation confirmed that miR-34a-5p and miR-99b-5p were downregulated, while miR-96-5p was upregulated in AA PCa vs. EA PCa (Supplemental Figure S1), which is consistent with the miRNA array data [26]. To further elucidate the functional impacts of these AA-depleted/enriched miRNAs in PCa disparities, four PCa cell lines derived from EA and AA patients were used as in-vitro cell line models. LNCaP and PC-3, lymph node and bone metastasis derived from EA patients respectively, were used as metastatic EA PCa cell models. RC77 T/E, a primary PCa derived from AA patient, represents a primary AA PCa. While MDA PCa 2b, a bone metastasis derived from AA PCa patient, was used as a metastatic AA PCa cell model. To verify whether the proposed PCa cell lines can serve as in-vitro EA and AA cell models, RT-qPCR assays of AA-depleted/enriched miRNAs and mRNAs were performed. The RT-qPCR results from these EA and AA PCa cells have again confirmed the microarray data [26] and the RT-qPCR results (Supplemental Figure S1) from EA and AA PCa patient samples. Consistent with RT-qPCR results from patient samples, miR-34a-5p and miR-99b-5p were downregulated in AA PCa vs. EA PCa cell lines (Figure 3A), while their predicted targets PIK3CB, MTOR, HIF1A and IGFBP2 were upregulated in AA PCa vs. EA PCa cells (Figure 3B). In contrast, RT-qPCR results confirmed that miR-96-5p was upregulated, while the its predicted target MAPKAPK2 was downregulated in AA PCa vs. EA PCa cells (Figure 3A,B). Western blot analysis was performed to assess the protein levels of mTOR, PI3Kβ, HIF1α, IGFBP2 and MAPKAPK2. Immunoblot analysis again confirmed that mTOR, PI3Kβ, HIF1α, and IGFBP2 were significantly upregulated, while MAPKAPK2 was downregulated in AA PCa (especially in MDA PCa 2b) in comparison with EA PCa cell lines (Figure 4A,B). Furthermore, immunoblot analysis was performed to assess the activation status of mTOR and VEGF signaling in EA and AA PCa cells. The Western blot assays have revealed increased phosphorylation states of mTOR and VEGF in the metastatic AA PCa cell line MDA PCa 2b, but not in metastatic EA PCa cell line (LNCaP and PC-3) and primary AA PCa cell line RC77 T/E (Figure 4C). These results, again, confirmed that mTOR and VEGF signaling pathways are preferentially upregulated in metastatic AA PCa vs. metastatic EA PCa.

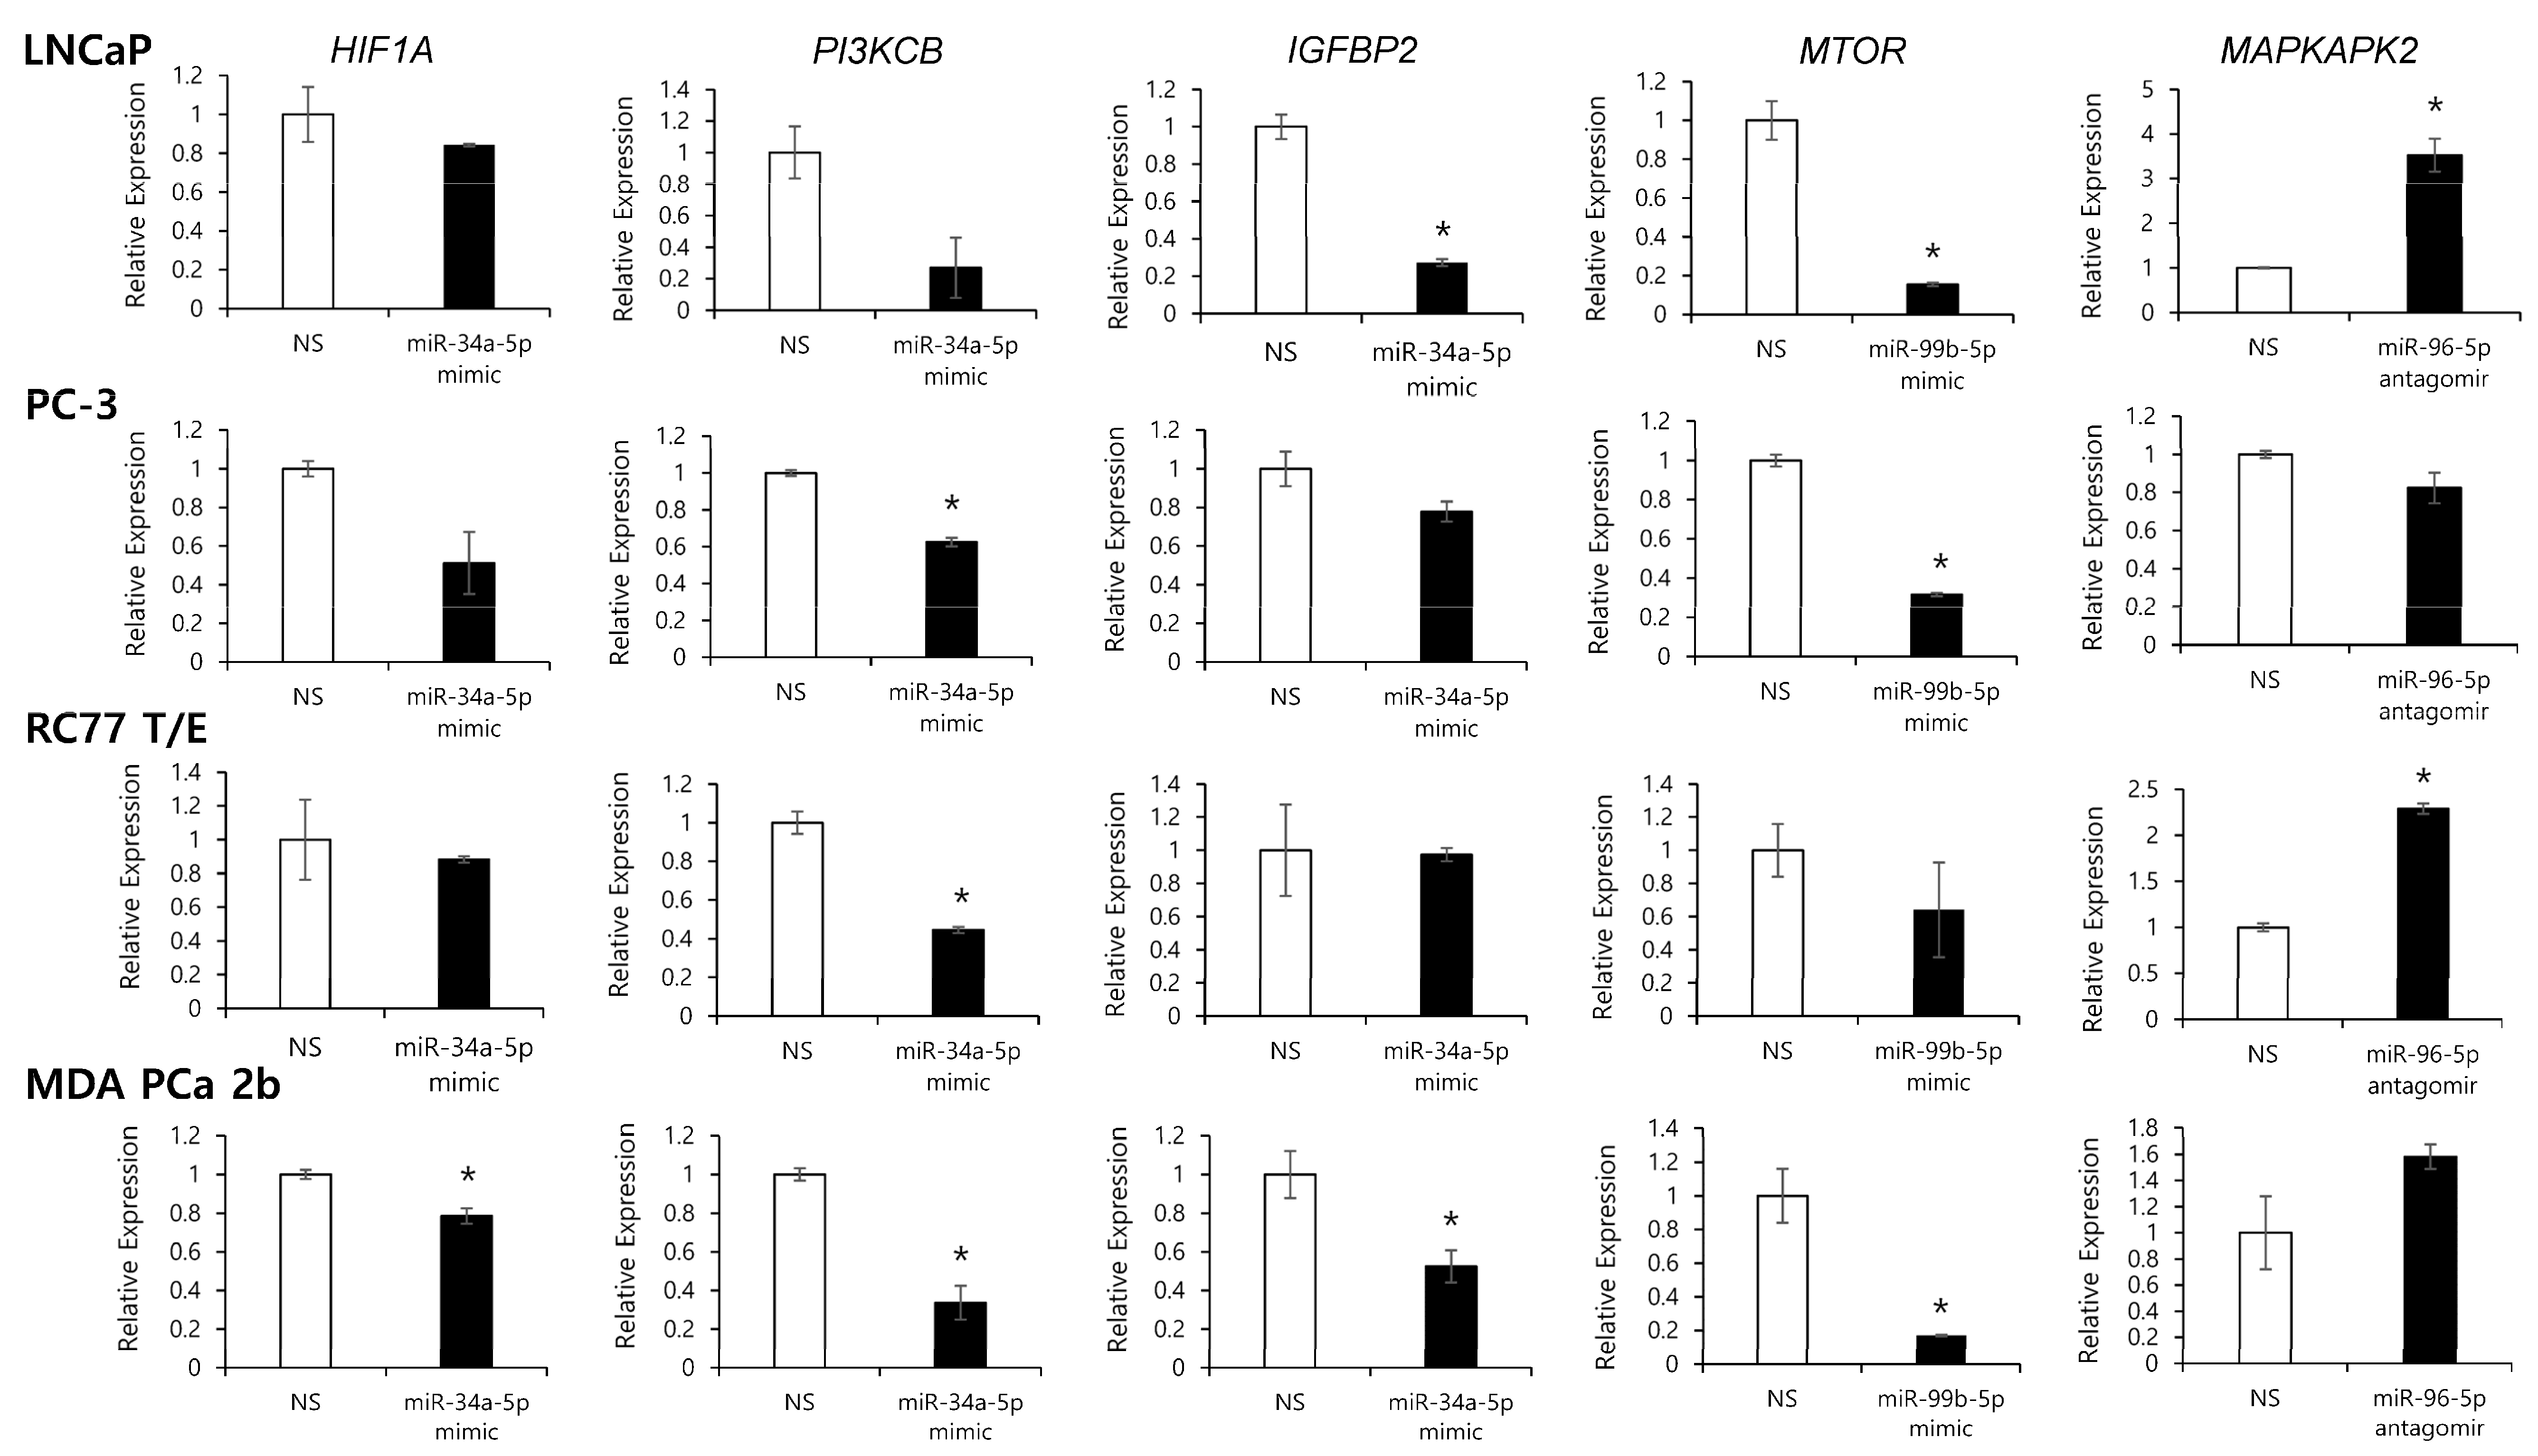
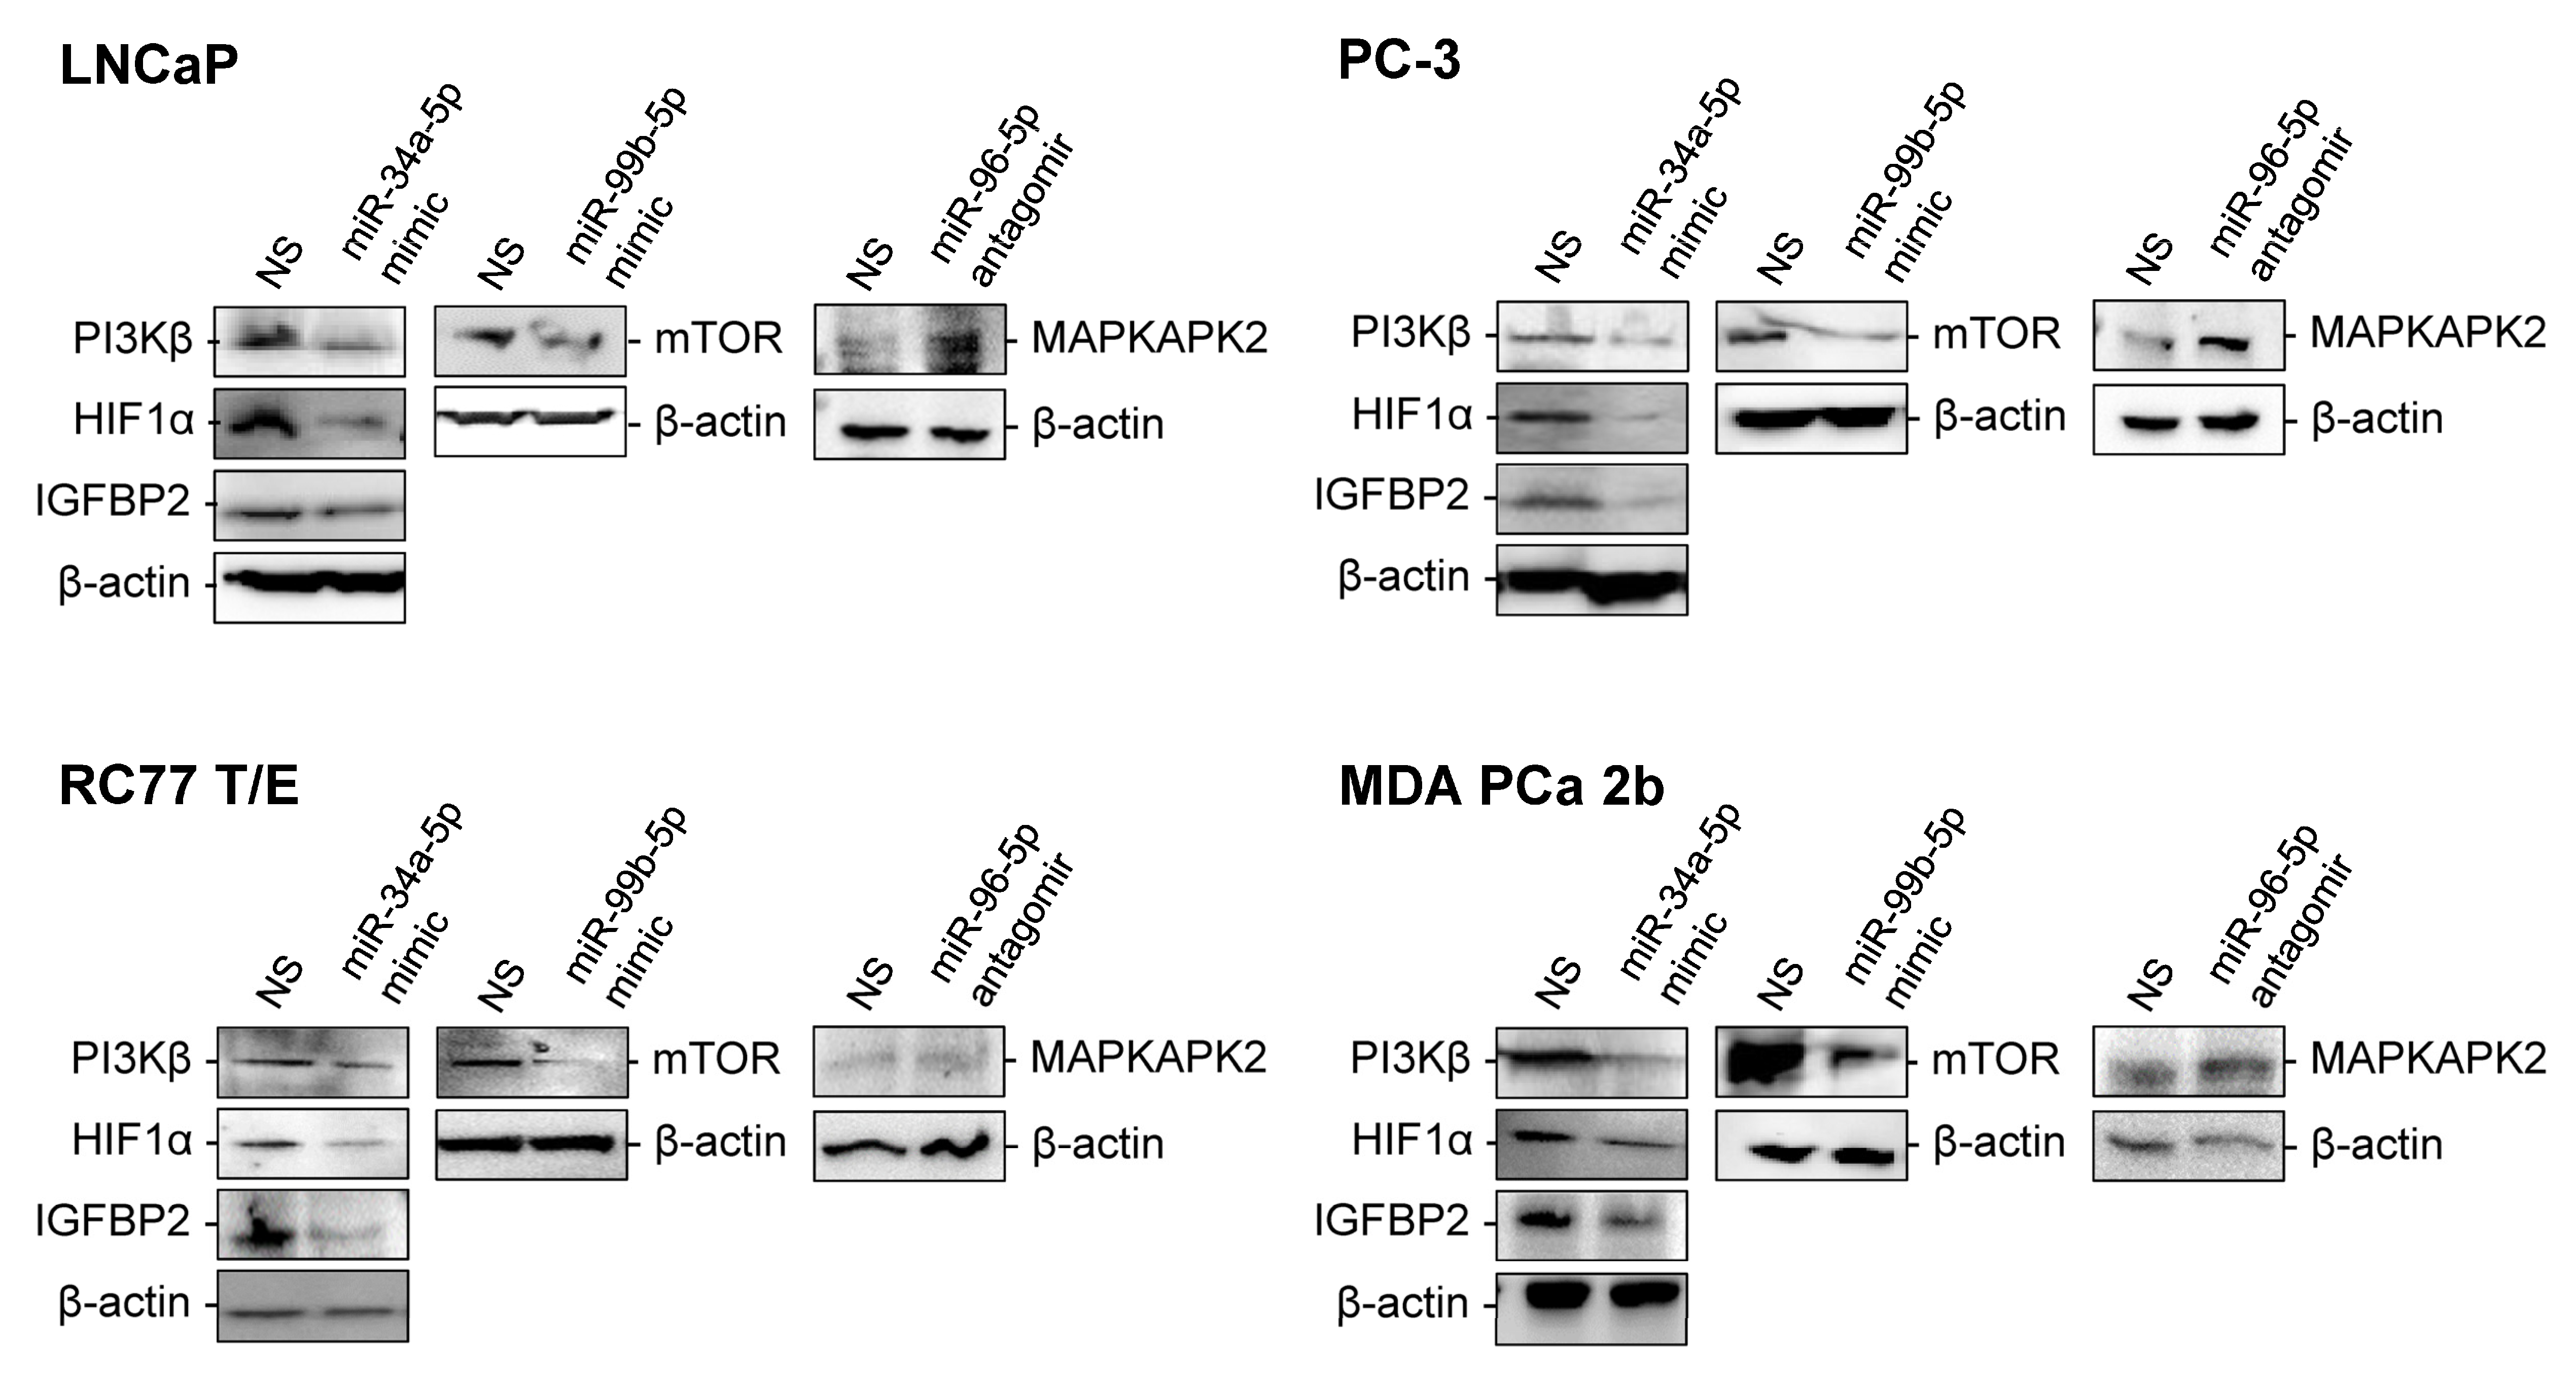
2.4. Assessment of Regulatory Relationship in Reciprocal miRNA-mRNA Pairings by Modulating AA-Depleted or AA-Enriched miRNA Expression Level

To further verify regulatory relationship in these reciprocal miRNA-mRNA pairings, EA and AA PCa cell lines were transfected with miR-34a-5p mimic, miR-99b-5p mimic or miR-96-5p antagomir then followed by RT-qPCR and Western blot analysis to examine the expression of the predicted miRNA target genes (miR-34a-5p targets genes PIK3CB, HIF1A, and IGFBP2; miR-99b-5p target gene MTOR; and miR-96-5p target gene MAPKAPK2) at mRNA and protein levels. Note that similar transfection efficiencies of miRNA mimics or antagomir in four PCa cell lines were confirmed by RT-qPCR assays (Supplemental Figure S2). As anticipated, transfection of miR-34a-5p mimic and miR-99b-5p mimic resulted in decreased PIK3CB, HIF1A, IGFBP2 and MTOR expression in AA and EA PCa cells when compared to PCa cells transfected with nonsense/scrambled (NS) miRNA control (Figure 5). Whereas, transfection of miR-96-5p antagomir increased the expression of MAPKAPK2 transcript in LNCaP, RC77 T/E and MDA PCa 2b cells when compared to the NS-transfected cells (Figure 5). Since miRNA targeting causes either mRNA degradation or translational repression, we further investigated the protein levels of mTOR, PI3Kβ, HIF1α, IGFBP2 and MAPKAPK2 in PCa cells transfected with NS, miR-34a-5p mimic, miR-99b-5p mimic, or miR-96-5p antagomir. As shown in Figure 6, PI3Kβ, HIF1α, and IGFBP2 were downregulated in miR-34a-5p mimic transfected vs. NS transfected PCa cells. Similarly, mTOR level was downregulated in PCa cells with miR-99b-5p mimic transfection vs. NS transfection. In contrast, MAPKAPK2 was upregulated in miR-96-5p antagomir transfected vs. NS transfected cells (Figure 6). Taken together, the RT-qPCR and immunoblot assays confirmed that PIK3CB, HIF1A and IGFBP2 expressions are negatively regulated by miR-34a-5p, while MTOR and MAPKAPK2 are negatively regulated by miR-99b-5p and miR-96-5p, respectively.

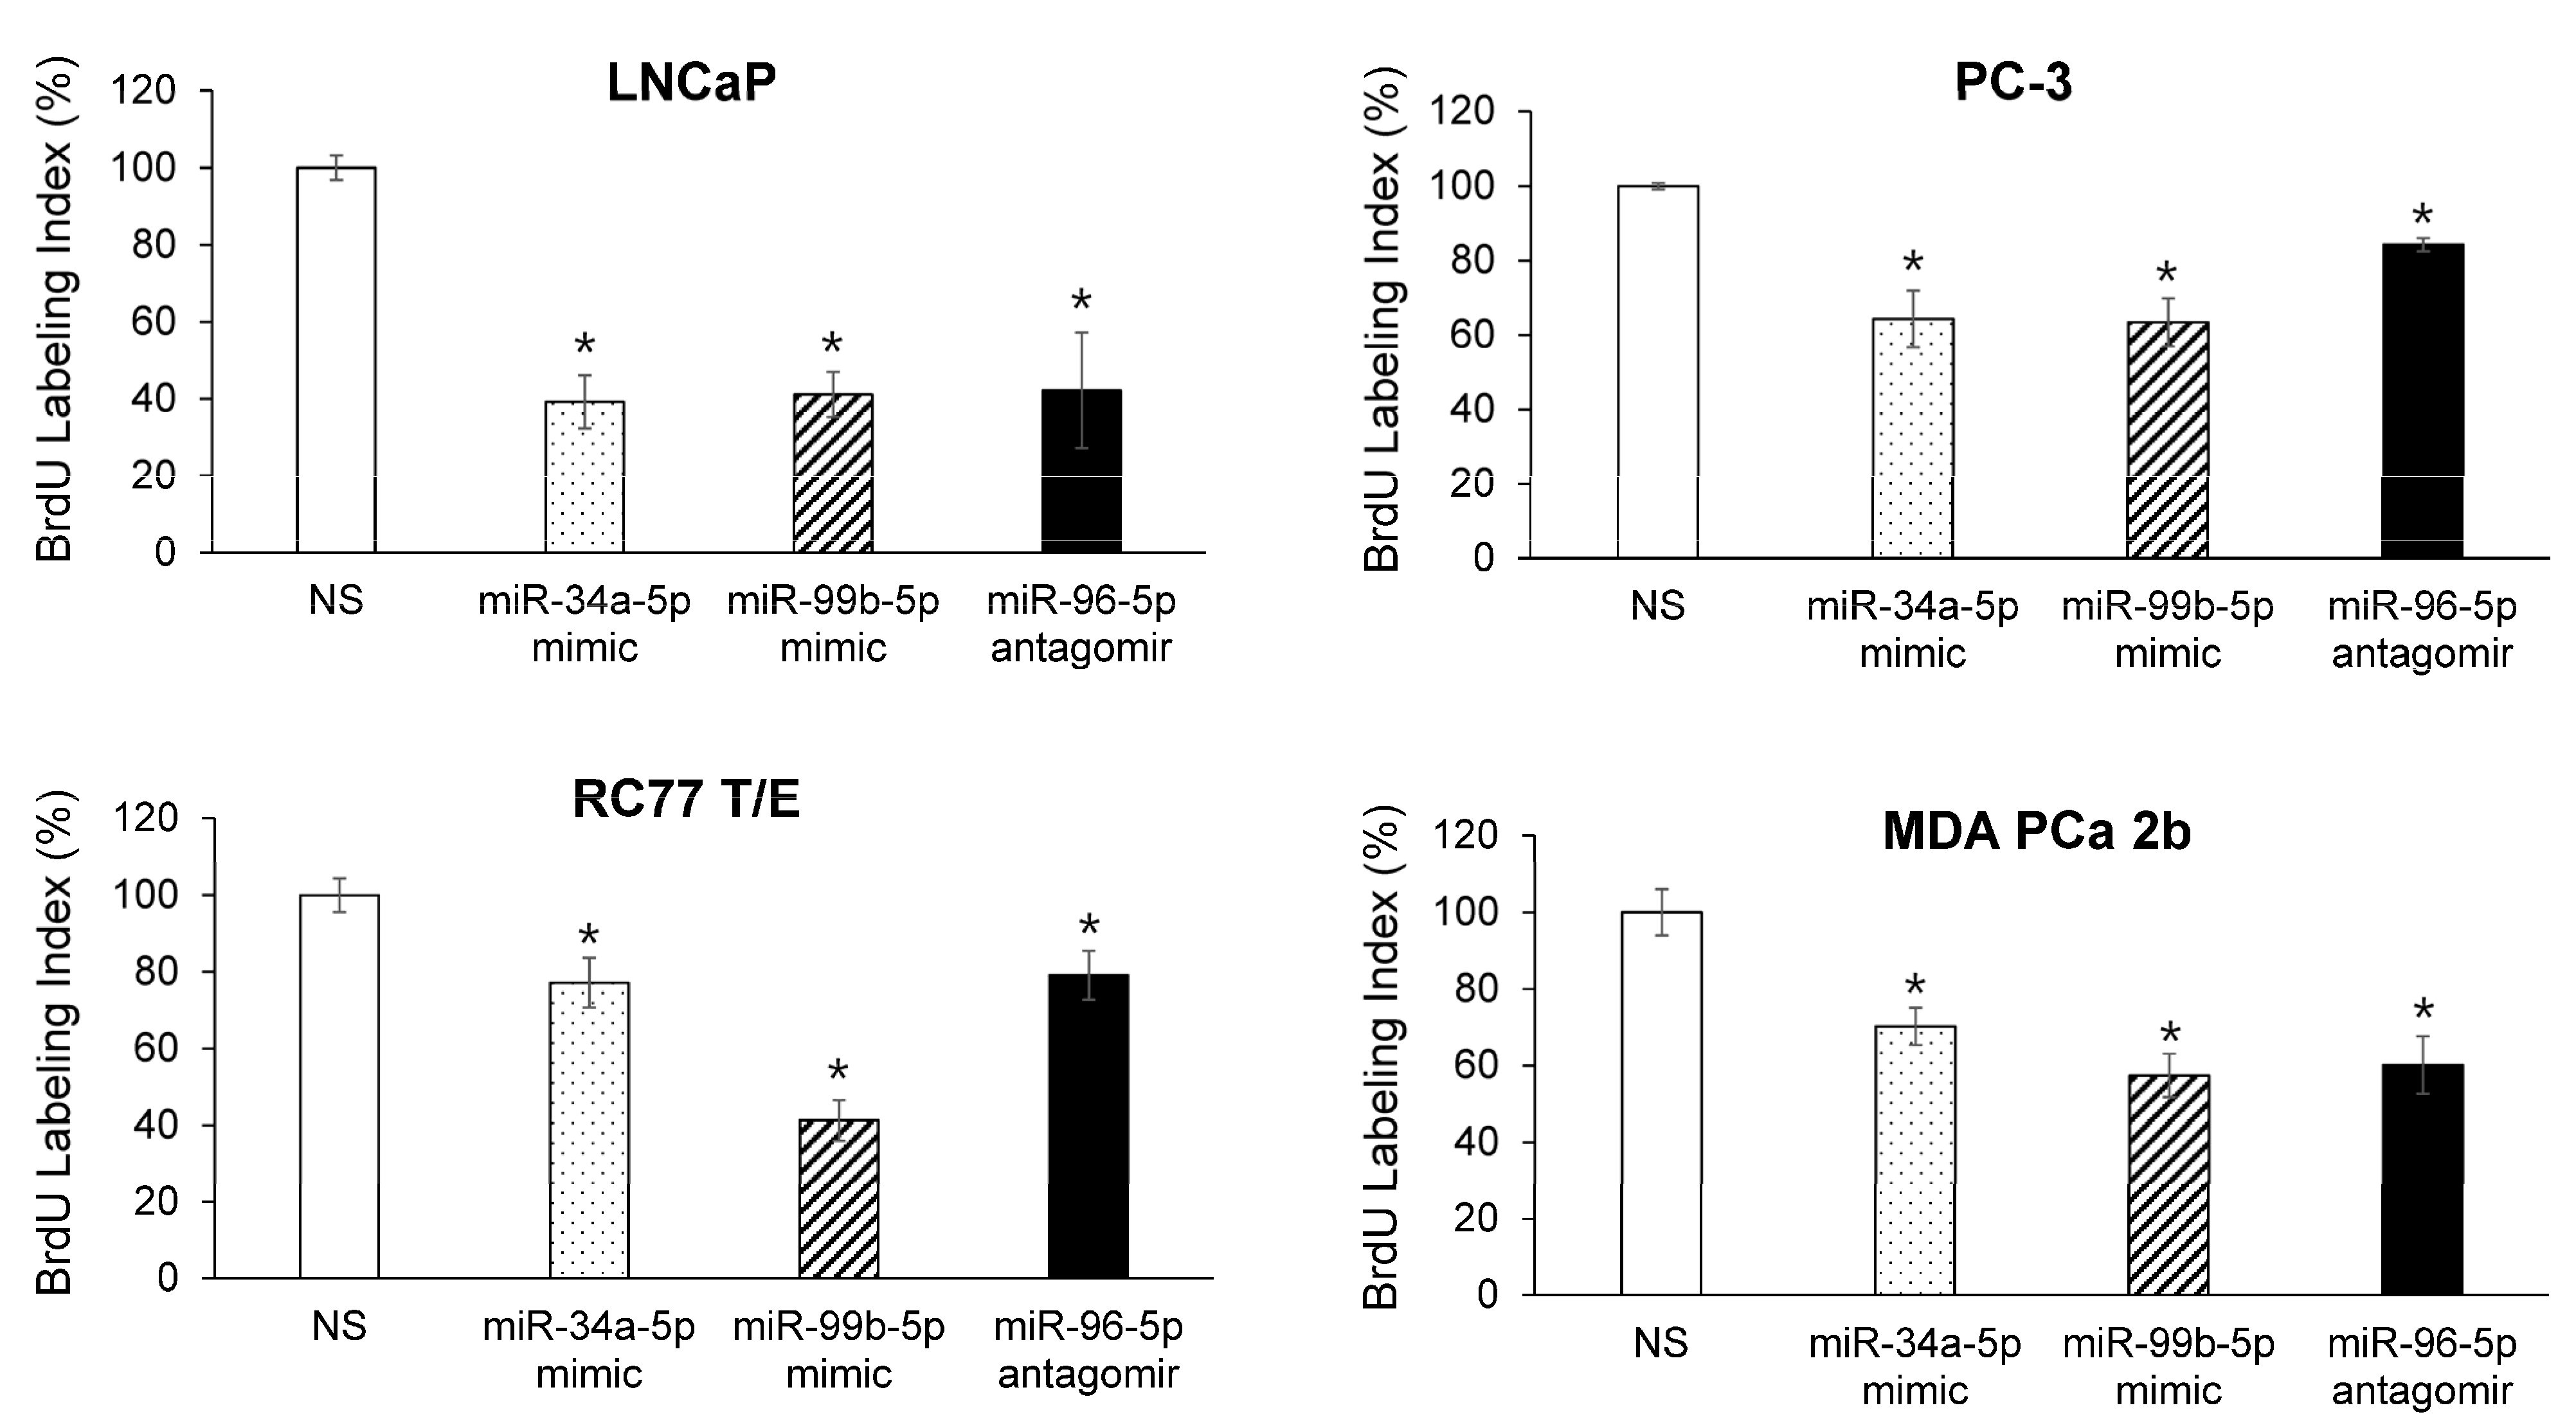
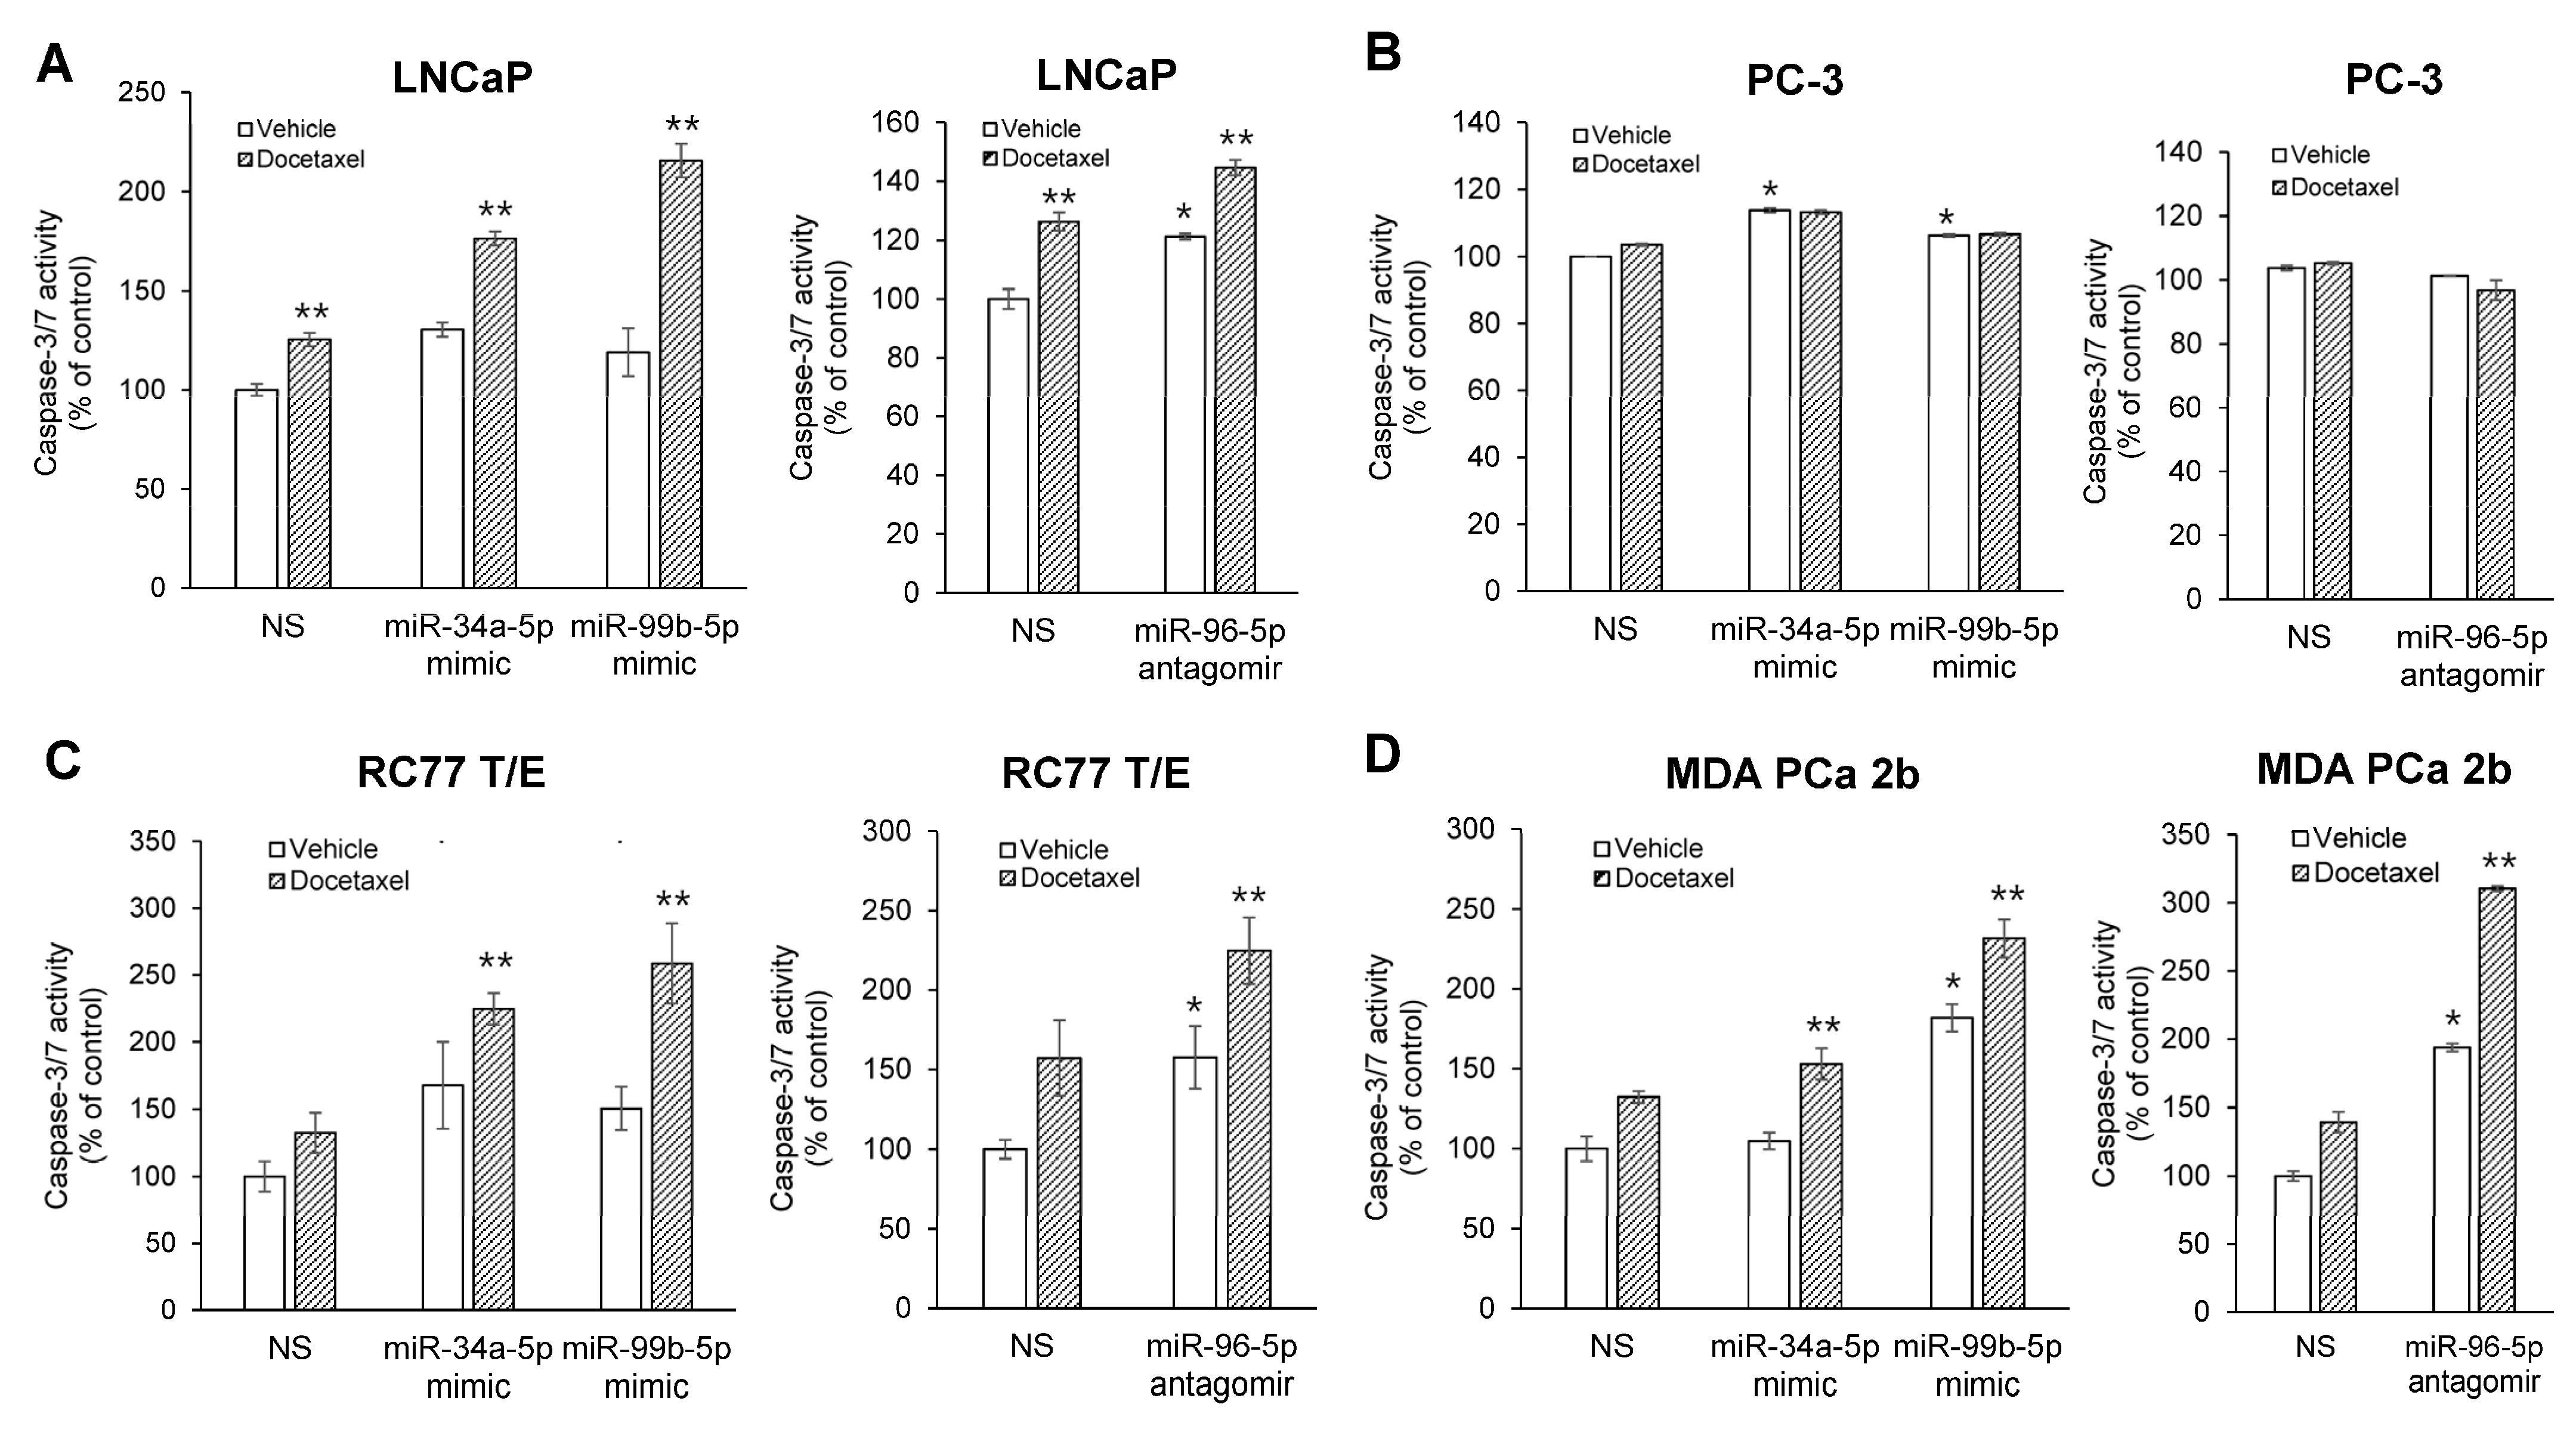
2.5. Modulating Expression Profile of Candidate Reciprocal miRNA-mRNA Pairings Inhibits Cell Proliferation and Sensitizes Docetaxel-Induced Cytotoxicity in PCa Cells

To further test the causal link among the reciprocal miRNA-mRNA pairings identified from mTOR and VEGF signaling in AA PCa (Figure 1 and Figure 2), miR-34a-5p mimic, miR-99b-5p and miR-96-5p were transfected into EA and AA PCa cells followed by in-vitro functional assays to examine their effects on cell proliferation and apoptosis initiation. Transfection of miR-34a-5p or miR-99b-5p resulted in the reduction of cell proliferation in EA PCa (LNCaP and PC-3) and AA PCa (RC77 T/E and MDA PCa 2b) cell lines (Figure 7). Conversely, transfection of miR-96-5p antagomir increased the MAPKAPK2 expression (Figure 6) and subsequently suppressed the cell proliferation in EA and AA PCa cells (Figure 7).
Next, we tested whether these miRNA mimics and antagomir functionally promote cell apoptosis in the absence and presence of docetaxel, a chemotherapeutic agent commonly used in PCa treatment [29]. Specifically, the EA PCa (LNCaP and PC-3) and AA PCa (RC77 T/E and MDA PCa 2b) cell lines were transfected with NS or miRNA mimic/antagomir in the presence of vehicle or docetaxel treatment, then followed by caspase 3/7 activity assays to measure the apoptosis capacity. In the absence of docetaxel (vehicle control), transfection of PCa cell lines with miR-34a-5p mimic, miR-99b-5p mimic, or miR-96-5p antagomir caused an overall generalized or significant increase (except the miR-96-5p antagomir transfected PC-3) in cell apoptosis compared with NS transfected cells (Figure 8). Docetaxel treatment alone (without miRNA mimic/antagomir transfection) significantly induced apoptosis in EA cell line LNCaP (Figure 8A), but not in androgen-independent PC-3 (Figure 8B) and AA PCa lines (RC77 T/E and MDA PCa 2b, Figure 8C,D). As anticipated, the combination of docetaxel with miR-34a-5p mimic, miR-99b-5p mimic, or miR-96-5p antagomir further enhanced the docetaxel-induced cytotoxicity in LNCaP cells (Figure 8A). Interestingly, in the absence of miRNA mimic or antagomir transfection, AA PCa cell lines demonstrated chemoresistance to docetaxel treatment (Figure 8C,D, docetaxel vs. vehicle in NS transfected cells). In contrast, transfection of miR-34a-5p mimic, miR-99b-5p mimic, or miR-96-5p antagomir in the presence of docetaxel significantly induced apoptosis in the AA cell lines RC77 T/E and MDA PCa 2b (Figure 8C,D). These results strongly suggest that modulating AA-depleted/enriched miRNAs (i.e., overexpressing miR-34a-5p, miR-99b-5p, or inhibiting miR-96-5p) effectively sensitizes the docetaxel-induced cytotoxicity, especially in AA PCa cells.

3. Discussion

In this study, we utilized an integrated genomic approach in combination with a miRNA-driven computational algorithm to identify the KEGG pathways significantly influenced by the AA-depleted/enriched miRNAs and mRNAs. ErbB-PI3K-AKT-mTOR-HIF1A-VEGF signaling was identified as a critical cascade highly mediated by miRNA-mRNA regulatory network in AA PCa. A novel panel of reciprocal miRNA-mRNA pairings (miR-34a-5p/HIF1A, miR-34a-5p/IGFBP2, miR-34a-5p/PIK3CB, miR-99b-5p/MTOR, and miR-96-5p/MAPKAPK2) were identified as core regulators contributing to the upregulation of mTOR and VEGF signaling in AA PCa. By applying molecular and biochemical approaches, we have confirmed that HIF1A, IGFBP2 and PIK3CB is negatively regulated by miR-34a-5p, while MTOR and MAPKAPK2 are negatively regulated by miR-99b-5p and miR-96-5p, respectively. Furthermore, functional assays have validated that modulating expression profile of miR-34a-5p/HIF1A, miR-34a-5p/IGFBP2, miR-34a-5p/PIK3CB, miR-99b-5p/MTOR, or miR-96-5p/MAPKAPK2 using miRNA mimics/antagomir subsequently inhibits cell proliferation and promotes docetaxel-induced cytotoxicity in PCa cells. Especially, AA PCa cells (more resistant to docetaxel treatment than EA PCa cells) demonstrated higher sensitivity to the treatment when combining miRNA mimics/antagomir (miR-34a-5p mimic, miR-99b-5p mimic, or miR-96-5p) with docetaxel. These results suggest that targeting these reciprocal miRNA-mRNA pairings may overcome chemoresistance and greatly sensitizes docetaxel-induced cytotoxicity, potentially serving as novel synergistic therapeutics for treating AA PCa.
Previous studies have demonstrated the critical functional roles of miR-34a-5p and miR-99b-5p as tumor suppressive miRNAs, and miR-96-5p as an oncogenic miRNA in various types of cancers. Downregulation of miR-34a-5p has been implicated in pancreatic cancer [30], hepatocellular carcinoma (HCC) [31], and PCa [32]. Furthermore, overexpression of miR-34a-5p resulted in significant decrease in cell proliferation and migration, and significant enhancement of cell apoptosis in HCC [31] and PCa cells [33]. Belonging to miR-125a-let-7e cluster family, miR-99b-5p has been reported to play a role in cell proliferation, migration, and differentiation in tumor cells [34]. A study by Shi et al. showed a significant reduction of miR-99b-5p expression in osteosarcoma (OS) tissue/cell lines compared to normal tissues/cells, suggesting it could potentially serve as a biomarker for OS patients [35]. MiR-96-5p belongs to the cluster miR-183-96-182 family and has been found upregulated in various cancers including breast cancer, thyroid cancer, bladder cancer, adrenocortical and adrenal medullary tumors, head, neck squamous cell carcinoma, and cervical cancer [36,37]. Furthermore, high-level expression of miR-96-5p is correlated with a poor overall survival rate of PCa patients, and has been implicated in promoting PCa growth, proliferation and tumor progression [38].
Hypoxia-inducible factors (HIFs) act as a driving force for cancer cells to adapt hypoxic condition, which contributes to cancer progression and treatment resistance [39]. Previous study further revealed androgen receptor (AR)-hypoxia-HIF1α axis as an independent pathway to promote PCa development [40]. It has been reported that HIF1A is a direct mRNA target of miR-34a-5p, and overexpression of miR-34a-5p downregulates HIF1α and other epithelial-to-mesenchymal transition (EMT) markers, consequently inhibiting VEGFR signaling in breast cancer [41]. Another study also indicated that miR-34a-5p directly targets HIF1A and inhibits its transcription, preventing PPP1R11/STAT3-induced EMT and metastasis in colorectal cancer (CRC) [42].To our knowledge, our study is the first report to confirm that transcription and translation of HIF1A is also negatively regulated by miR-34a-5p in PCa (Figure 5 and Figure 6). Taken together, p53-miR-34a-5p-HIF1α signaling axis may play a critical role in pathogenesis of PCa and other cancers. Therefore, targeting miR-34a-5p-HIF1A pairing (i.e., using miR-34a-5p mimic or HIF1α inhibitor) may serve as an effective molecular strategy to reduce PCa aggressiveness, especially in AA patients.
Insulin-like growth factor binding protein 2 (IGFBP2) is an oncogenic protein involved in the development and progression of various cancers, such as glioma, breast, lung and prostate cancers [43]. In addition, IGFBP2 has been shown to overexpress in PCa and prostatic intraepithelial neoplasia (PIN) tissues [44]. PCa cells produce significantly high amount of IGFBP2, and the serum level of IGFBP2 is positively correlated with the tumor grades and stages, suggesting the potential role of IGFBP2 as a biomarker in PCa risk, resistance and relapse [45]. Furthermore, IGFBP2 has been uncovered as a direct target of miR-34a-5p, and miR-34a-5p expression inhibits the expression of IGFBP2 at transcriptional and translational levels in myoblasts [46]. Our results also confirmed, as the first time, that IGFBP2 is negatively regulated by miR-34a-5p at transcriptional and translation levels in PCa cells (Figure 5 and Figure 6). These results suggest miR-34a-5p/IGFBP2 pairing as a potential precision biomarker and novel drug target in PCa.
Excessive activity in the PI3K/AKT/mTOR signaling pathway, one of the most common hallmarks in human cancers, is an important therapeutic target for cancer treatment. Aberration of p110β (PI3Kβ) and its overexpression has been implicated in carcinogenesis process in different cancers [47]. Previous study revealed that miR-34a-5p directly targets/inhibits PIK3CB and participates in the regulation of TCR-mediated NFκB signaling in CD4+ and CD8+ T cells [48]. Similarly, our data confirmed, as the first time, that PIK3CB is negatively regulated by miR-34a-5p at mRNA and protein levels in PCa (Figure 5 and Figure 6), indicating miR-34a-5p/PIK3CB reciprocal pairing as a potential biomarker as well as novel therapeutic target in AA PCa.
mTOR is a downstream target of PI3K/AKT survival pathways and functions as a regulator involved in cell growth, proliferation, and survival [49]. Deregulation of mTOR contributes to cancer progression and drug resistance [50]. MiR-99a/b has been implicated as a tumor suppressor frequently downregulated in human cancers, and plays an important role in regulating mTOR signaling pathway [51]. Several studies have shown that downregulation of miR-99b-5p is correlated with the elevated levels of mTOR in PCa and endometrial carcinoma [52]. Previous study has further revealed that miR-99b-5 expression suppresses mRNA and protein levels of mTOR, PI3K, AKT and p70S6, thereby inhibiting PI3K/AKT/mTOR signaling in human cervical cancer [53]. Upregulation of miR-99b-5p results in a longer survival, while silencing of miR-99b-5p causes upregulation of mTOR and promotes cell migration in CRC [54]. MiR-99b-5p has been revealed to directly or indirectly target MTOR, and inhibiting miR-99b-5p expression causes upregulation of mTOR in PCa and endometrial carcinoma [55]. In addition, overexpression of miR-99a/b in HCC cells results in significant inhibition of tumor growth by suppressing the expression of IGF1R and MTOR [56]. In this study, we confirmed that miR-99b-5p functions as a tumor suppressive miRNA (Figure 7 and Figure 8), and its expression contributes to the suppression of MTOR expression at transcriptional and translational levels in PCa (Figure 5 and Figure 6). Given all, deregulation of miR-99-MTOR signaling represents a crucial miRNA-mRNA interaction in PCa development/progression. Modulation of miR-99b-5p/MTOR expression profile through miR-99b-5p mimic reduces the PCa aggressiveness and sensitizes docetaxel-induced cytotoxicity, especially in AA PCa.
Activation of the pathway mitogen-activated protein kinase (MAPK) is found to play a diverse role in multiple cellular mechanisms, including cell growth, migration, proliferation, differentiation, and apoptosis [57]. Mitogen-activated protein kinase 2 (MAPKAPK2, also named as MK2) is a direct downstream substrate of p38 MAPK, and it plays a critical role in regulating particular cellular functions, including apoptosis, cell cycle, DNA repair, RNA metabolism, autophagy, inflammation, post-translational regulation of gene expression, and stress response to oxidative agents [58,59]. Previous studies have shown that p38 MAPK has a dual role as a tumor suppressor kinase or a tumor promoter [59], however, the diverse functional roles of MAPKAPK2 remain elusive. Previous study has implicated MAPKAPK2 as an oncogene involved in tumorigenesis in lung, colorectal, skin, bladder, and prostate cancers [60,61]. Several reports have also demonstrated that p38 MAPK signaling functions as an antitumor pathway. p38 MAPK exerts its tumor suppressive activities by inhibiting oncogenic transformation, such as regulating cell cycle, inhibiting cell proliferation, activating cell apoptosis, inducing senescence, modulating inflammatory-dependent transformation, and promoting cell differentiation [57,59]. MAPKAPK2, a key p38 downstream substrate involved in cell cycle control, DNA repair, immune response, senescence, and autophagy [58], may also function as a cofactor in the p38-mediated tumor suppressor pathways. In this study, DIANA-TarBase algorithm predicted MAPKAPK2 as a target of miR-96-5p, and our results have further confirmed that miR-96-5p negatively regulates MAPKAPK2 expression at transcriptional and translational levels. To our knowledge, this is the first study to confirm that MAPKAPK2 expression is mediated by miR-96-5p. Further luciferase reporter assay will validate whether MAPKAPK2 is a direct or indirect miR-96-5p target. In summary, although the tumor suppressive role of MAPKAPK2 remains elusive, our results have implicated miR-96-5p/MAPKAPK2 as a promising therapeutic target for reducing the chemoresistance in AA PCa.
In conclusion, our study has revealed that EGFR-PI3K-ATK-mTOR-HIF1α-VEGF axis is preferentially upregulated by AA-depleted/enriched miRNAs in PCa. The novel panel of reciprocal miRNA-mRNA pairings within mTOR signaling (miR-34a-5p/HIF1A, miR-34a-5p/IFGBP2, and miR-99b-5p/MTOR) and VEGF signaling (miR-34a-5p/PIK3CB, and miR-96-5p/MAPKAPK2) have been suggested as critical miRNA-mRNA regulatory components in AA PCa (or more aggressive type of PCa). Further exploring a computational algorithm using combined expression profiles of these miRNA/mRNA pairings may facilitate the development of precision diagnostic/prognostic biomarkers in PCa. Finally, targeting miRNA-mRNA reciprocal pairings (i.e., using miRNA mimics/antagomirs, siRNAs, antisense oligonucleotides, or Crispr knockdown) may lead to the development of novel molecular strategies to overcome chemoresistance observed in aggressive AA PCa.

4. Materials and Methods

4.1. Pathway Analysis and Identification of miRNA-mRNA Pairings

DIANA-mirPath V.3 [28] is a web-server based miRNA pathway analysis program that provides accurate statistics by integrating prediction of miRNA targets, based on DIANA-TarBase or TargetScan algorithm, into the identification of significant KEGG pathways. 10 differentially miRNAs in AA PCa vs. EA PCa (Supplemental Table S1) [26] were imported into DIANA-mirPath V.3 program to identify the significant signaling pathways influenced by these miRNAs. Adjusted p-value (FDR < 0.05) was applied to identify the most significant KEGG pathways influenced by the miRNAs imported to mirPath V.3 program. The selected signaling pathways, mTOR and VEGF signaling, were further mapped with AA-depleted and -enriched mRNAs (downregulated and upregulated mRNAs in AA PCa vs. EA PCa) [26] to further define the reciprocal miRNA-mRNA pairings in the selected signaling pathways.

4.2. Cell Culture and TRANSFECTION

Human PCa cell lines LNCaP and PC-3, derived from lymph node metastasis and bone metastasis of Caucasian patients, and MDA PCa 2b, derived from bone metastasis of African American patient, were purchased from American Type Culture Collection (ATCC, Manassas, VA). RC77 T/E, a primary PCa cell line derived from African American patient, was kindly provided by Dr. Johng Rhim at Center for Prostate Disease Research (CPDR) in Rockville, MD. LNCaP and PC-3 were served as EA PCa cell line models, and RC77 T/E and MDA PCa 2b were served as AA PCa cell models in the study. The cells were cultured in specific cell culture media, LNCaP was cultured in RPMI with 10% fetal bovine serum (FBS), PC-3 was cultured in DMEM with 10% FBS, MDA PCa 2b were cultured in BRFF-HPC1 with 20% FBS and RC77 T/E was cultured in Keratinocyte SFM with Human Recombinant Epidermal Growth Factor (EGF 1–53) and Bovine Pituitary Extract (BPE). Cells were maintained at 37 °C in a 5% CO2 incubator. LNCaP, PC-3 and MDA PCa 2b cells were seeded at density 3 × 10⁴ cells/well in 6-well plates. RC77 T/E cells were seeded at density 5 × 10⁴ cells/well in 6-well plates. The cells were allowed to grow for 24 h and then were either transfected with miR-34a-5p mimic, miR-99b-5p mimic, or miR-96-5p antagomir using DharmaFECT4 transfection reagent (Dharmacon, Lafayette, CO, USA), according to the manufacturer’s protocol. After 24 h, the cells were replaced with fresh media then incubated for 24 h. miR-34a-5p mimic, miR-99b-5p mimic, miR-96-5p antagomir, and nonsense miRNA mimic and antagomir controls were purchased from Ambion (Austin, TX, USA). nonsense/scrambled miRNA mimic and antagomir were used as negative controls.

4.3. RT-qPCR Validation of mRNA and miRNA Expression

For the measurement of gene expression level, total RNA was isolated using miRNeasy Mini Kit (50) (Qiagen, Germantown, MD, USA) from the PCa cells used in the study. Quantification of total RNA samples were done using NanoVue Plus spectrophotometer (GE Healthcare, Wauwatosa, WI, USA). For examining mRNA expression level, 1 µg of total RNA was used as template for reverse transcription. Reverse transcription was performed using iScript Reverse Transcription Supermix kit (Bio-Rad, Hercules, CA, USA) to generate cDNA then followed by performing quantitative PCR (qPCR) assays using SsoAdvanced Universal SYBR Green supermix kit (Bio-Rad, Hercules, CA, USA). For reverse transcription of miRNAs, the miRNA samples (1 µg per sample) were used in the reverse transcription reactions using Qiagen miScriptII RT kit. Specifically, the miRNAs were poly-A tailed, and reverse transcribed using poly-T primer coupled with 3′-nucleotide code designed by Qiagen (Germantown, MD, USA). The synthesized cDNAs were mixed with universal reverse primer (Qiagen, Germantown, MD, USA), specific miRNA primer, and PowerUp SYBR Green master mix (Applied Biosystems, Waltham, MA, USA) to perform the qPCR reactions.
The qPCR reaction condition for quantification of miRNA expression levels were as follows: pre-denaturation for 5 min at 95 °C, followed by 40 standard cycles of: denaturation at 95 °C for 15 s, annealing at 55 °C for 30 s, and extension at 70 °C for 30 s. While the qPCR reaction program for quantification of mRNA level is: pre-denaturation for 5 min at 95 °C, followed by 40 standard cycles of: denaturation at 95 °C for 15 s, then annealing and extension at 60 °C for 30 s. Specific primers designed for miR-34a-5p, miR-99b-5p and miR-96-5p and their target genes MTOR, PIK3CB, HIF1A, IGFBP2 and MAPKAPK2 were used for qPCR assays (primer sequences were listed in Supplemental Table S2). RT-qPCR determination of miRNA and mRNA expression levels were performed in triplicate and normalized to levels of endogenous miR-103a-3p and housekeeping genes EIF1AX, respectively [26]. Normalized gene expression levels were determined using the 2−ΔCT method.

4.4. Western Blot Analysis

For measurement of the gene expression at protein level, proteins were extracted using M-PER Mammalian Protein Extraction Reagent (Thermo Fisher Scientific, Waltham, MA, USA) with protease and phosphatase inhibitor cocktail (Thermo Fisher Scientific, Waltham, MA, USA). Protein concentrations were quantified using BCA assay kit (Thermo Fisher Scientific, Waltham, MA, USA). Equal amounts of proteins were separated by electrophoresis using Blot 4-12% Bis-Tris gels (Invitrogen, Waltham, MA, USA) and transferred onto PVDF membranes (Bio-Rad, Hercules, CA, USA). The PVDF membranes were then incubated with primary antibodies, washed three times with 1 × TBST, then incubated with secondary antibodies. Immunoblots were developed with SuperSignal ECL substrate (Thermo Fisher Scientific, Waltham, MA, USA) and visualized using ChemiDoc XRS imaging system (Bio-Rad, Hercules, CA, USA). The primary antibodies used in the study were rabbit monoclonal antibodies against mTOR, PI3Kβ, IGFBP2, HIF-1α, MAPKAPK2 and β-actin from Cell Signaling Technology (Danvers, MA, USA). The secondary antibody used in the study was an anti-rabbit IgG-HRP antibody purchased from Thermo Fisher Scientific (Waltham, MA, USA).

4.5. BrdU-Labeling Cell Proliferation Assay

LNCaP, PC-3, RC77 T/E and MDA PCa 2b cells were seeded at density 3 × 10⁴ cells/well in 6-well culture plates. RC77 T/E cells were seeded at density 5 × 10⁴ cells/well in 6-well culture plates. The cells were incubated for 24 h and then were either transfected with miRNA mimics or antagomir. As a control, cells were cultured with nonsense scrambled control (NS). The cells were incubated for another 24 h. After this period, cells were plated in 96-well plates, bromodeoxyuridine (BrdU) incorporation assay was performed to analyze cell proliferation and cell viability. The assay was conducted using BrdU Cell Proliferation Assay Kit (Sigma-Aldrich, St. Louis, MO, USA) as described by manufacturers. Cells were labelled with BrdU for an incubation period of 8 h in the tissue culture incubator. After incubation, the content of each well was removed and 200 µL of fixative solution was added for 30-min incubation at room temperature. This was followed by adding 100 µL of anti-BrdU antibody into each well, and the cells were further incubated for 1 h at room temperature. The plate was then washed 3 times with 1× wash buffer. 100 µL of goat anti-mouse IgG HRP conjugate was added into each well then incubated for 30 min. After washing three times with 1× wash buffer and additional washing with ddH2O, 100 µL of substrate solution was added and the cells were incubated in dark for 15 min or until a significant color change was observed. 100 µL of stop solution was used to stop further reaction and followed by checking absorbance at dual wavelengths of 450 nm and 540 nm using Multiskan FC microplate photometer (Thermo Scientific, Waltham, MA, USA).

4.6. Caspase 3/7 Activity-Based Apoptosis Assay

For the measurement of apoptosis initiation by transfection of miRNA mimic or antagomir in PCa cells, the transfected cells 5000 cells/well were seeded onto 96-well cell culture plates (Corning, Corning, NY, USA) and then incubated overnight. The miRNA mimic/antagomir transfected cells were then treated with vehicle or 11 mM of Docetaxel [26]. 24 h after the vehicle or drug treatment, the apoptosis assays were performed using Apo-ONE Caspase-3/7 Assay Kit (Promega Corporation, Madison, WI, USA) according to the protocol described by the manufacturer. 100 µL of homogeneous Caspase-3/7 reagent was added to the sample plate and incubated at room temperature for 1 h. Fluorescence was detected for measuring the apoptosis state (Caspase 3/7 activity) using Biotek Synergy HT Microplate Reader (BioTek, Winooski, VT, USA) at wavelengths of 499 nm and 521 nm for excitation and emission, respectively.

Supplementary Materials

The following supporting information can be downloaded at: https://www.mdpi.com/article/10.3390/ijms23062926/s1.

Author Contributions

Conceptualization and design: B.-D.W.; methodology: B.-D.W., H.G. and S.H.; conducting of experiments and acquisition of data: H.G., S.H., B.-D.W. and A.M.; data analysis and interpretation: S.H., H.G. and B.-D.W.; writing, reviewing and editing of the manuscript: B.-D.W., S.H. and H.G.; funding acquisition: B.-D.W. All authors have read and agreed to the published version of the manuscript.

Funding

This work was supported by NIH/NIGMS grant SC1GM127256 (to B.-D.W.).

Institutional Review Board Statement

The study was conducted in accordance with the Declaration of Helsinki, and approved by the Institutional Review Board of University of Maryland Eastern Shore (IRB Protocol #2018-055).

Informed Consent Statement

Informed consent was obtained from all subjects involved in the study.

Data Availability Statement

Not applicable.

Conflicts of Interest

These authors declare no conflict of interest.

References

  1. Friedman, R.C.; Farh, K.K.-H.; Burge, C.B.; Bartel, D.P. Most mammalian mRNAs are conserved targets of microRNAs. Genome Res. 2008, 19, 92–105. [Google Scholar] [CrossRef] [PubMed] [Green Version]
  2. Lewis, B.P.; Burge, C.B.; Bartel, D.P. Conserved Seed Pairing, Often Flanked by Adenosines, Indicates that Thousands of Human Genes are MicroRNA Targets. Cell 2005, 120, 15–20. [Google Scholar] [CrossRef] [PubMed] [Green Version]
  3. Chen, B.; Li, H.; Zeng, X.; Yang, P.; Liu, X.; Zhao, X.; Liang, S. Roles of microRNA on cancer cell metabolism. J. Transl. Med. 2012, 10, 228. [Google Scholar] [CrossRef] [Green Version]
  4. Pedroza-Torres, A.; Romero-Córdoba, S.L.; Justo-Garrido, M.; Salido-Guadarrama, I.; Rodríguez-Bautista, R.; Montaño, S.; Muñiz-Mendoza, R.; Arriaga-Canon, C.; Fragoso-Ontiveros, V.; Álvarez-Gómez, R.M.; et al. MicroRNAs in Tumor Cell Metabolism: Roles and Therapeutic Opportunities. Front. Oncol. 2019, 9, 1404. [Google Scholar] [CrossRef] [PubMed] [Green Version]
  5. Jackson, R.J.; Standart, N. How do microRNAs regulate gene expression? Sci. STKE 2007, 2007, re1. [Google Scholar] [CrossRef] [Green Version]
  6. Tomari, Y.; Zamore, P.D. MicroRNA Biogenesis: Drosha Can’t Cut It without a Partner. Curr. Biol. 2005, 15, R61–R64. [Google Scholar] [CrossRef] [Green Version]
  7. Michlewski, G.; Cáceres, J.F. Post-transcriptional control of miRNA biogenesis. RNA 2018, 25, 1–16. [Google Scholar] [CrossRef] [Green Version]
  8. Ha, M.; Kim, V.N. Regulation of microRNA biogenesis. Nat. Rev. Mol. Cell Biol. 2014, 15, 509–524. [Google Scholar] [CrossRef]
  9. Siegel, R.L.; Miller, K.D.; Fuchs, H.E.; Jemal, A. Cancer Statistics, 2021. CA Cancer J. Clin. 2021, 71, 7–33. [Google Scholar] [CrossRef]
  10. Powell, I.J. Epidemiology and Pathophysiology of Prostate Cancer in African-American Men. J. Urol. 2007, 177, 444–449. [Google Scholar] [CrossRef]
  11. Reddy, S.; Shapiro, M.; Morton, J.R.; Brawley, O.W. Prostate cancer in black and white Americans. Cancer Metastasis Rev. 2003, 22, 83–86. [Google Scholar] [CrossRef] [PubMed]
  12. Robbins, A.S.; Whittemore, A.S.; Thom, D.H. Differences in socioeconomic status and survival among white and black men with prostate cancer. Am. J. Epidemiol. 2000, 151, 409–416. [Google Scholar] [CrossRef] [PubMed]
  13. Evans, S.; Metcalfe, C.; Ibrahim, F.; Persad, R.; Ben-Shlomo, Y. Investigating Black-White differences in prostate cancer prognosis: A systematic review and meta-analysis. Int. J. Cancer 2008, 123, 430–435. [Google Scholar] [CrossRef]
  14. Freedland, S.J.; Isaacs, W.B. Explaining racial differences in prostate cancer in the United States: Sociology or biology? Prostate 2004, 62, 243–252. [Google Scholar] [CrossRef] [PubMed]
  15. Suzuki, H.; Maruyama, R.; Yamamoto, E.; Kai, M. Epigenetic alteration and microRNA dysregulation in cancer. Front. Genet. 2013, 4, 258. [Google Scholar] [CrossRef] [Green Version]
  16. Ramalho-Carvalho, J.; Fromm, B.; Henrique, R.; Jerónimo, C. Deciphering the function of non-coding RNAs in prostate cancer. Cancer Metastasis Rev. 2016, 35, 235–262. [Google Scholar] [CrossRef]
  17. Ozen, M.; Creighton, C.J.; Ozdemir, M.; Ittmann, M. Widespread deregulation of microRNA expression in human prostate cancer. Oncogene 2007, 27, 1788–1793. [Google Scholar] [CrossRef] [PubMed] [Green Version]
  18. Volinia, S.; Calin, G.A.; Liu, C.G.; Ambs, S.; Cimmino, A.; Petrocca, F.; Visone, R.; Iorio, M.; Roldo, C.; Ferracin, M.; et al. A microRNA expression signature of human solid tumors defines cancer gene targets. Proc. Natl. Acad. Sci. USA 2006, 103, 2257–2261. [Google Scholar] [CrossRef] [Green Version]
  19. Lu, J.; Getz, G.; Miska, E.A.; Alvarez-Saavedra, E.; Lamb, J.; Peck, D.; Sweet-Cordero, A.; Ebert, B.L.; Mak, R.H.; Ferrando, A.A.; et al. MicroRNA expression profiles classify human cancers. Nature 2005, 435, 834–838. [Google Scholar] [CrossRef]
  20. Abramovic, I.; Ulamec, M.; Bojanac, A.K.; Bulic-Jakus, F.; Jezek, D.; Sincic, N. miRNA in prostate cancer: Challenges toward translation. Epigenomics 2020, 12, 543–558. [Google Scholar] [CrossRef]
  21. Pełka, K.; Klicka, K.; Grzywa, T.M.; Gondek, A.; Marczewska, J.M.; Garbicz, F.; Szczepaniak, K.; Paskal, W.; Włodarski, P.K. miR-96-5p, miR-134-5p, miR-181b-5p and miR-200b-3p heterogenous expression in sites of prostate cancer versus benign prostate hyperplasia-archival samples study. Histochem. Cell Biol. 2021, 155, 423–433. [Google Scholar] [CrossRef] [PubMed]
  22. Hashimoto, Y.; Shiina, M.; Dasgupta, P.; Kulkarni, P.; Kato, T.; Wong, R.K.; Tanaka, Y.; Shahryari, V.; Maekawa, S.; Yamamura, S.; et al. Upregulation of miR-130b Contributes to Risk of Poor Prognosis and Racial Disparity in African-American Prostate Cancer. Cancer Prev. Res. 2019, 12, 585–598. [Google Scholar] [CrossRef] [PubMed]
  23. Shiina, M.; Hashimoto, Y.; Kulkarni, P.; Dasgupta, P.; Shahryari, V.; Yamamura, S.; Tanaka, Y.; Dahiya, R. Role of miR-182/PDCD4 axis in aggressive behavior of prostate cancer in the African Americans. BMC Cancer 2021, 21, 1028. [Google Scholar] [CrossRef] [PubMed]
  24. Stevenson, M.; Banerjee, N.N.; Banerjee, H.N.; Rawat, K.; Chen, L.; Worthington, M.; Hodge, S.; Walker, R.; Verma, M.; Sarkar, F.; et al. A health disparities study of MicroRNA-146a expression in prostate cancer samples derived from African American and European American patients. J. Solid Tumors 2020, 10. [Google Scholar] [CrossRef] [PubMed]
  25. Shiina, M.; Hashimoto, Y.; Kato, T.; Yamamura, S.; Tanaka, Y.; Majid, S.; Saini, S.; Varahram, S.; Kulkarni, P.; Dasgupta, P.; et al. Differential expression of miR-34b and androgen receptor pathway regulate prostate cancer aggressiveness between African-Americans and Caucasians. Oncotarget 2016, 8, 8356–8368. [Google Scholar] [CrossRef] [PubMed] [Green Version]
  26. Wang, B.-D.; Ceniccola, K.; Yang, Q.; Andrawis, R.; Patel, V.; Ji, Y.; Rhim, J.; Olender, J.; Popratiloff, A.; Latham, P.; et al. Identification and Functional Validation of Reciprocal microRNA-mRNA Pairings in African American Prostate Cancer Disparities. Clin. Cancer Res. 2015, 21, 4970–4984. [Google Scholar] [CrossRef] [PubMed] [Green Version]
  27. Wang, B.-D.; Yang, Q.; Ceniccola, K.; Bianco, F.; Andrawis, R.; Jarrett, T.; Frazier, H.; Patierno, S.R.; Lee, N.H. Androgen Receptor-Target Genes in African American Prostate Cancer Disparities. Prostate Cancer 2013, 2013, 763569. [Google Scholar] [CrossRef] [Green Version]
  28. Vlachos, I.S.; Zagganas, K.; Paraskevopoulou, M.D.; Georgakilas, G.; Karagkouni, D.; Vergoulis, T.; Dalamagas, T.; Hatzigeorgiou, A.G. DIANA-miRPath v3.0: Deciphering microRNA function with experimental support. Nucleic Acids Res. 2015, 43, W460–W466. [Google Scholar] [CrossRef]
  29. Beltran, H.; Morris, M.J. Docetaxel for Early Prostate Cancer: What Have We Learned? Eur. Urol. 2020, 77, 573–575. [Google Scholar] [CrossRef]
  30. Nalls, D.; Tang, S.-N.; Rodova, M.; Srivastava, R.K.; Shankar, S. Targeting Epigenetic Regulation of miR-34a for Treatment of Pancreatic Cancer by Inhibition of Pancreatic Cancer Stem Cells. PLOS ONE 2011, 6, e24099. [Google Scholar] [CrossRef]
  31. Zhang, Y.M.; Wu, Q.M.; Chang, L.Y.; Liu, J.C. miR-34a and miR-125a-5p inhibit proliferation and metastasis but induce apoptosis in hepatocellular carcinoma cells via repressing the MACC1-mediated PI3K/AKT/mTOR pathway. Neoplasma 2020, 67, 1042–1053. [Google Scholar] [CrossRef]
  32. Paccez, J.D.; Duncan, K.; Sekar, D.; Correa, R.G.; Wang, Y.; Gu, X.; Bashin, M.; Chibale, K.; Libermann, T.A.; Zerbini, L.F. Dihydroartemisinin inhibits prostate cancer via JARID2/miR-7/miR-34a-dependent downregulation of Axl. Oncogenesis 2019, 8, 14. [Google Scholar] [CrossRef] [PubMed] [Green Version]
  33. Dong, B.; Xu, G.-C.; Liu, S.-T.; Liu, T.; Geng, B. MiR-34a affects G2 arrest in prostate cancer PC3 cells via Wnt pathway and inhibits cell growth and migration. Eur. Rev. Med. Pharmacol. Sci. 2020, 24, 8349–8358. [Google Scholar] [PubMed]
  34. Wang, Z.; Zhao, Z.; Yang, Y.; Luo, M.; Zhang, M.; Wang, X.; Liu, L.; Hou, N.; Guo, Q.; Song, T.; et al. MiR-99b-5p and miR-203a-3p Function as Tumor Suppressors by Targeting IGF-1R in Gastric Cancer. Sci. Rep. 2018, 8, 10119. [Google Scholar] [CrossRef] [PubMed] [Green Version]
  35. Shi, X.; Guan, X. MicroRNA-99b predicts clinical outcome of osteosarcoma and suppresses tumor cell proliferation, migration and invasion. Diagn. Pathol. 2019, 14, 117. [Google Scholar] [CrossRef] [PubMed] [Green Version]
  36. Liu, B.; Zhang, J.; Yang, D. miR-96-5p promotes the proliferation and migration of ovarian cancer cells by suppressing Caveolae1. J. Ovarian Res. 2019, 12, 57. [Google Scholar] [CrossRef] [PubMed]
  37. Ma, X.; Shi, W.; Peng, L.; Qin, X.; Hui, Y. MiR-96 enhances cellular proliferation and tumorigenicity of human cervical carcinoma cells through PTPN9. Saudi J. Biol. Sci. 2018, 25, 863–867. [Google Scholar] [CrossRef] [PubMed]
  38. Haflidadóttir, B.S.; Larne, O.; Martin, M.; Persson, M.; Edsjö, A.; Bjartell, A.; Ceder, Y. Upregulation of miR-96 Enhances Cellular Proliferation of Prostate Cancer Cells through FOXO1. PLOS ONE 2013, 8, e72400. [Google Scholar] [CrossRef] [Green Version]
  39. Yu, T.; Tang, B.; Sun, X. Development of Inhibitors Targeting Hypoxia-Inducible Factor 1 and 2 for Cancer Therapy. Yonsei Med. J. 2017, 58, 489–496. [Google Scholar] [CrossRef]
  40. Tran, M.G.B.; Bibby, B.A.S.; Yang, L.; Lo, F.; Warren, A.Y.; Shukla, D.; Osborne, M.; Hadfield, J.; Carroll, T.; Stark, R.; et al. Independence of HIF1a and androgen signaling pathways in prostate cancer. BMC Cancer 2020, 20, 469. [Google Scholar] [CrossRef]
  41. Mansoori, B.; Silvestris, N.; Mohammadi, A.; Khaze, V.; Baghbani, E.; Mokhtarzadeh, A.; Shanehbandi, D.; Derakhshani, A.; Duijf, P.H.G.; Baradaran, B. miR-34a and miR-200c Have an Additive Tumor-Suppressive Effect on Breast Cancer Cells and Patient Prognosis. Genes 2021, 12, 267. [Google Scholar] [CrossRef] [PubMed]
  42. Li, H.; Rokavec, M.; Jiang, L.; Horst, D.; Hermeking, H. Antagonistic Effects of p53 and HIF1A on microRNA-34a Regulation of PPP1R11 and STAT3 and Hypoxia-induced Epithelial to Mesenchymal Transition in Colorectal Cancer Cells. Gastroenterology 2017, 153, 505–520. [Google Scholar] [CrossRef] [PubMed]
  43. Chua, C.Y.; Liu, Y.; Granberg, K.J.; Hu, L.; Haapasalo, H.; Annala, M.J.; Cogdell, D.E.; Verploegen, M.; Moore, L.M.; Fuller, G.; et al. IGFBP2 potentiates nuclear EGFR–STAT3 signaling. Oncogene 2015, 35, 738–747. [Google Scholar] [CrossRef] [PubMed] [Green Version]
  44. Richardsen, E.; Ukkonen, T.; Bjørnsen, T.; Mortensen, E.; Egevad, L.; Busch, C. Overexpression of IGBFB2 is a marker for malignant transformation in prostate epithelium. Virchows Arch. 2003, 442, 329–335. [Google Scholar] [CrossRef] [PubMed]
  45. Russo, V.; Azar, W.; Yau, S.; Sabin, M.; Werther, G. IGFBP-2: The dark horse in metabolism and cancer. Cytokine Growth Factor Rev. 2014, 26, 329–346. [Google Scholar] [CrossRef] [PubMed]
  46. Wang, Z.; Zhang, X.; Li, Z.; Abdalla, B.A.; Chen, Y.; Nie, Q. MiR-34b-5p Mediates the Proliferation and Differentiation of Myoblasts by Targeting IGFBP2. Cells 2019, 8, 360. [Google Scholar] [CrossRef] [Green Version]
  47. Dbouk, H.A.; Pang, H.; Fiser, A.; Backer, J.M. A biochemical mechanism for the oncogenic potential of the p110beta catalytic subunit of phosphoinositide 3-kinase. Proc. Natl. Acad. Sci. USA 2010, 107, 19897–19902. [Google Scholar] [CrossRef] [Green Version]
  48. Hart, M.; Walch-Rückheim, B.; Friedmann, K.S.; Rheinheimer, S.; Tänzer, T.; Glombitza, B.; Sester, M.; Lenhof, H.-P.; Hoth, M.; Schwarz, E.C.; et al. miR-34a: A new player in the regulation of T cell function by modulation of NF-kappaB signaling. Cell Death Dis. 2019, 10, 46. [Google Scholar] [CrossRef] [Green Version]
  49. Houede, N.; Pourquier, P. Targeting the genetic alterations of the PI3K-AKT-mTOR pathway: Its potential use in the treatment of bladder cancers. Pharmacol. Ther. 2015, 145, 1–18. [Google Scholar] [CrossRef] [Green Version]
  50. Jiang, B.-H.; Liu, L.-Z. Role of mTOR in anticancer drug resistance: Perspectives for improved drug treatment. Drug Resist. Updates 2008, 11, 63–76. [Google Scholar] [CrossRef] [Green Version]
  51. Tsai, T.-F.; Lin, J.-F.; Chou, K.-Y.; Lin, Y.-C.; Chen, H.-E.; Hwang, T.I.-S. miR-99a-5p acts as tumor suppressor via targeting to mTOR and enhances RAD001-induced apoptosis in human urinary bladder urothelial carcinoma cells. OncoTargets Ther. 2018, 11, 239–252. [Google Scholar] [CrossRef] [PubMed] [Green Version]
  52. Torres, A.; Torres, K.; Pesci, A.; Ceccaroni, M.; Paszkowski, T.; Cassandrini, P.; Zamboni, G.; Maciejewski, R. Deregulation of miR-100, miR-99a and miR-199b in tissues and plasma coexists with increased expression of mTOR kinase in endometrioid endometrial carcinoma. BMC Cancer 2012, 12, 369. [Google Scholar] [CrossRef] [PubMed] [Green Version]
  53. Li, Y.J.; Wang, Y.; Wang, Y.Y. MicroRNA-99b suppresses human cervical cancer cell activity by inhibiting the PI3K/AKT/mTOR signaling pathway. J. Cell Physiol. 2019, 234, 9577–9591. [Google Scholar] [CrossRef] [PubMed]
  54. Li, W.; Chang, J.; Wang, S.; Liu, X.; Peng, J.; Huang, D.; Sun, M.; Chen, Z.; Zhang, W.; Guo, W.; et al. miRNA-99b-5p suppresses liver metastasis of colorectal cancer by down-regulating mTOR. Oncotarget 2015, 6, 24448–24462. [Google Scholar] [CrossRef] [Green Version]
  55. Wei, F.; Liu, Y.; Guo, Y.; Xiang, A.; Wang, G.; Xue, X.; Lu, Z. miR-99b-targeted mTOR induction contributes to irradiation resistance in pancreatic cancer. Mol. Cancer 2013, 12, 81. [Google Scholar] [CrossRef] [Green Version]
  56. Cheng, H.; Xue, J.; Yang, S.; Chen, Y.; Wang, Y.; Zhu, Y.; Wang, X.; Kuang, D.; Ruan, Q.; Duan, Y.; et al. Co-targeting of IGF1R/mTOR pathway by miR-497 and miR-99a impairs hepatocellular carcinoma development. Oncotarget 2017, 8, 47984–47997. [Google Scholar] [CrossRef]
  57. Yue, J.; López, J.M. Understanding MAPK Signaling Pathways in Apoptosis. Int. J. Mol. Sci. 2020, 21, 2346. [Google Scholar] [CrossRef] [Green Version]
  58. Canovas, B.; Nebreda, A.R. Diversity and versatility of p38 kinase signalling in health and disease. Nat. Rev. Mol. Cell Biol. 2021, 22, 346–366. [Google Scholar] [CrossRef]
  59. Martínez-Limón, A.; Joaquin, M.; Caballero, M.; Posas, F.; De Nadal, E. The p38 Pathway: From Biology to Cancer Therapy. Int. J. Mol. Sci. 2020, 21, 1913. [Google Scholar] [CrossRef] [Green Version]
  60. Liu, B.; Yang, L.; Huang, B.; Cheng, M.; Wang, H.; Li, Y.; Huang, D.; Zheng, J.; Li, Q.; Zhang, X.; et al. A Functional Copy-Number Variation in MAPKAPK2 Predicts Risk and Prognosis of Lung Cancer. Am. J. Hum. Genet. 2012, 91, 384–390. [Google Scholar] [CrossRef] [Green Version]
  61. Soni, S.; Anand, P.; Padwad, Y.S. MAPKAPK2: The master regulator of RNA-binding proteins modulates transcript stability and tumor progression. J. Exp. Clin. Cancer Res. 2019, 38, 121. [Google Scholar] [CrossRef] [PubMed] [Green Version]
Figure 1. The mTOR signaling pathway is upregulated in AA prostate cancer (PCa) specimens. MirPath v.3 was used to evaluate the impact of the 10 differentially expressed miRNAs (in AA PCa vs. EA PCa) in regulating the biological signaling pathways in AA PCa compared to EA PCa. Downregulated (green) and upregulated (red) miRNAs and mRNAs, in AA PCa vs. EA PCa, were indicated in mTOR signaling pathway. Three robust reciprocal miRNA-mRNA pairings, IGFBP2/miR-34a-5p (up/down), MTOR/miR-99b-5p (up/down) and HIF1A/miR-34a-5p (up/down), were highlighted. Unpaired AA-depleted miRNAs (miR-125b-2-3p, miR-378a-5p and miR-34a-5p) and AA-enriched miRNAs (miR-130b-3p and miR-96-5p) were indicated adjacent to their predicted target genes. The genes highlighted with yellow are genes targeted by one AA-depleted/enriched miRNA. The genes highlighted with orange are genes targeted by at least two AA-depleted/enriched miRNAs. The genes highlighted with light green are genes not targeted by any AA-depleted/enriched miRNA.
Ijms 23 02926 g001
Figure 2. VEGF signaling pathway is upregulated in AA PCa specimens. Using mirPath v.3, VEGF signaling was identified as significant signaling pathway differentially regulated by AA depleted/enriched miRNAs (adjusted p-value = 0.0155). Downregulated (green) and upregulated (red) miRNAs and mRNAs, in AA PCa vs. EA PCa, were mapped in VEGF signaling pathway. Two reciprocal miRNA-mRNA pairings, PIK3CB/miR-34a-5p (up/down) and MAPKAPK2/miR-96-5p (down/up), were highlighted. Other unpaired downregulated and upregulated miRNAs (miR-125b-2-3p, miR-99b-5p and upregulated miR-130b-3p) were indicated next to their predicted target genes. The genes highlighted with yellow are genes targeted by one AA-depleted/enriched miRNA. The genes highlighted with orange are genes targeted by at least two AA-depleted/enriched miRNAs. The genes highlighted with light green are genes not targeted by any AA-depleted/enriched miRNA.
Ijms 23 02926 g002
Figure 3. RT-qPCR validation of differentially expressed miRNAs and mRNAs in AA and EA PCa cell line models. (A) RT-qPCR assays for examining expression level of miR-34a-5p, miR-99b-5p and miR-96-5p in cell lines derived from EA PCa (LNCaP and PC-3) and AA PCa (RC77 T/E and MDA PCa 2b). (B) RT-qPCR assays for examining expression level of PIK3CB, MTOR, HIF1A, IGFBP2 and MAPKAPK2 in AA and EA PCa cell line models. Data were presented as mean ± SEM of n = 4-6 independent experiments, with technical triplicates for each independent experiment. The significance (* p < 0.05 in AA PCa cell line vs. LNCaP, and ** p < 0.05 in AA PCa cell line vs. PC-3) was determined based on ANOVA with Tukey post hoc test.
Ijms 23 02926 g003
Figure 4. Western blot analysis of mTOR, PI3Kβ, HIF1α, IGFBP2 and MAPKAPK2 in AA and EA PCa cell line models. (A) Representative Western blot images of mTOR, PI3Kβ, HIF1α, IGFBP2, MAPKAPK2 and β-actin in EA PCa (LNCaP, PC-3) and AA PCa (RC77 T/E and MDA PCa 2b) cell lines. (B) Normalized protein levels of mTOR, PI3Kβ, HIF1α, IGFBP2 and MAPKAPK2 in EA PCa and AA PCa cell line models. The normalized protein level was measured by dividing intensity of the tested protein (mTOR, PI3Kβ, HIF1α, IGFBP2 or MAPKAPK2) with intensity of endogenous protein β-actin. Data were presented as mean ± SD of n = 3–4 independent immunoblot experiments, and the significance (* p < 0.05 in AA PCa cell line vs. LNCaP, and ** p < 0.05 in AA PCa vs. PC-3) was determined based on ANOVA with Tukey post hoc test. (C) Phosphorylation states of mTOR and VEGF in EA PCa (LNCaP and PC-3) and AA PCa (RC77 T/E and MDA PCa 2b) cell models. The pmTOR/mTOR and pVEGFR/VEGFR ratios were significantly higher in MDA PCa 2b (a metastatic AA PCa line) than in other three cell lines.
Ijms 23 02926 g004
Figure 5. Modulation of miRNA expression affects the transcriptional regulation of its target genes in EA and AA PCa cell lines. RT-qPCR analysis of MTOR, PIK3CB, HIF1A, IGFBP2 and MAPKAPK2 expression in EA and AA PCa cell line models. Relative expression levels of MTOR, PIK3CB, HIF1A, IGFBP2 and MAPKAPK2 were shown in EA PCa (LNCaP and PC-3) and AA PCa (RC77 T/E and MDA PCa 2b) cell lines transfected with nonsense scrambled miRNA (NS), miRNA mimic or antagomir (miR-34a-5p mimic, miR-99b-5p mimic, or miR-96-5p antagomir). Data were presented as mean ± SEM of n = 3–4 independent RT-qPCR experiments, with technical triplicates for each independent experiment. The significance (* p < 0.05 in miRNA mimic or antagomir vs. NS) was determined based on student’s t-test.
Ijms 23 02926 g005
Figure 6. Western blot analysis of mTOR, PI3Kβ, HIF1α, IGFBP2 and MAPKAPK2 in EA and AA PCa cell line models transfected with miRNA mimics or antagomir. Protein levels of mTOR, PI3Kβ, HIF1α, IGFBP2, MAPKAPK2 and β-actin were shown in EA PCa (LNCaP and PC-3) and AA PCa (RC77 T/E and MDA PCa 2b) cell lines transfected with nonsense scrambled miRNA (NS), miR-34a-5p mimic, miR-99b-5p mimic, or miR-96-5p antagomir. Representative Western blot images were selected from 3–4 independent immunoblot assays with consistent results.
Ijms 23 02926 g006
Figure 7. Overexpressing AA-depleted miRNAs or suppressing AA-enrich miRNA causes inhibition of cell proliferation in EA and AA PCa cell lines. BrdU-labeling assays were performed after PCa cell lines were transfected with NS, miR-34a-5p mimic, miR-99b-5p mimic or miR-96-5p antagomir for 48 h. Data were plotted as mean ± SEM of n = 3–4 independent assays, with 3–4 technical replicates for each independent assay. The significance (* p < 0.05 in miRNA mimic/antagomir vs. NS) was determined based on ANOVA with Dunnett post hoc test.
Ijms 23 02926 g007
Figure 8. Overexpression of miR-34a-5p mimic, miR-99b-5p mimic or miR-96-5p antagomir enhances docetaxel-induced cytotoxicity in EA PCa (A,B) and AA PCa (C,D) cell lines. Apoptosis activity was assessed by measuring caspase-3/7 activity using the Apo-ONE Kit, and the data were normalized to caspase-3/7 level of vehicle-treated NS control. Data were plotted as mean ± SEM for n of 3–4 independent experiments, with technical triplicates for each independent experiment. The significance (* p < 0.05 in miRNA mimic or antagomir transfection plus vehicle treatment vs. NS plus vehicle treatment, and ** p < 0.05 in miRNA mimic or antagomir transfection plus docetaxel treatment to miRNA mimic or antagomir transfection with vehicle treatment) was determined using ANOVA with Tukey post hoc test.
Ijms 23 02926 g008
Table 1. KEGG pathways differentially regulated by population-associated miRNAs between AA and EA PCa. MirPath V.3 program was used for identification of the significant signaling pathways regulated by AA-depleted and enriched miRNAs. The significance was measured based on adjusted p-value (FDR < 0.05) determined by statistics implemented in mirPath V.3.
KEGG Pathwayp-Value#Genes#miRNAs
MicroRNAs in cancer3.88 × 10−541008
Proteoglycans in cancer8.70 × 10−12998
Adherens junction4.02 × 10−10457
Viral carcinogenesis1.29 × 10−71058
Glioma3.22 × 10−7398
Transcriptional misregulation in cancer3.22 × 10−7888
Cell cycle4.05 × 10−7717
Prostate cancer6.70 × 10−7558
Pancreatic cancer1.27 × 10−6447
Bacterial invasion of epithelial cells2.81 × 10−6448
Colorectal cancer4.14 × 10−6407
Thyroid cancer9.18 × 10−6216
Fatty acid biosynthesis1.35 × 10−553
ErbB signaling pathway1.35 × 10−5488
Pathways in cancer1.89 × 10−51668
Chronic myeloid leukemia2.45 × 10−5436
Central carbon metabolism in cancer3.86 × 10−5397
Non-small cell lung cancer5.33 × 10−5346
Shigellosis8.00 × 10−5377
Regulation of actin cytoskeleton9.30 × 10−51007
Renal cell carcinoma1.14 × 10−4396
p53 signaling pathway1.14 × 10−4427
Glycosphingolipid biosynthesis—lacto and neolacto series1.16 × 10−4135
Endometrial cancer1.85 × 104316
Bladder cancer2.18 × 10−4268
Hepatitis B2.30 × 10−4687
Other types of O-glycan biosynthesis3.88 × 10−4155
Alcoholism4.33 × 10−4888
Endocytosis5.08 × 10−4937
Acute myeloid leukemia6.12 × 10−4336
Melanoma8.26 × 10−4388
Neurotrophin signaling pathway1.746 × 10−3588
Focal adhesion2.185 × 10−3968
mTOR signaling pathway2.477 × 10−3336
HIF-1 signaling pathway2.827 × 10−3538
Estrogen signaling pathway2.827 × 10−3448
Protein processing in endoplasmic reticulum2.962 × 10−3757
Oocyte meiosis2.974 × 10−3557
N-Glycan biosynthesis3.345 × 10−3267
Fc gamma R-mediated phagocytosis5.007 × 10−3466
Hippo signaling pathway5.356 × 10−3647
RNA transport5.788 × 10−3766
Thyroid hormone signaling pathway6.076 × 103587
Progesterone-mediated oocyte maturation1.0333 × 10−2446
Salmonella infection1.1305 × 10−2426
Axon guidance1.2697 × 10−2546
Ubiquitin mediated proteolysis1.2697 × 10−2627
Oxytocin signaling pathway1.2697 × 10−2728
Insulin signaling pathway1.5334 × 10−2658
VEGF signaling pathway1.5546 × 10−2325
Glycosaminoglycan biosynthesis—keratan sulfate1.9381 × 10−2325
Prolactin signaling pathway2.3342 × 10−2356
Small cell lung cancer2.7242 × 10−2417
FoxO signaling pathway3.0606 × 10−2628
NF-kappa B signaling pathway3.4130 × 10−2387
TNF signaling pathway3.6058 × 10−2476
HTLV-I infection4.0449 × 10−21078
Choline metabolism in cancer4.1519 × 10−2467
Publisher’s Note: MDPI stays neutral with regard to jurisdictional claims in published maps and institutional affiliations.

