
Spectroscopic and Molecular Docking Investigation on the Interaction of Cumin Components with Plasma Protein: Assessment of the Comparative Interactions of Aldehyde and Alcohol with Human Serum Albumin


Abstract
:1. Introduction
2. Results and Discussions
2.1. UV-Visible Absorption Measurements
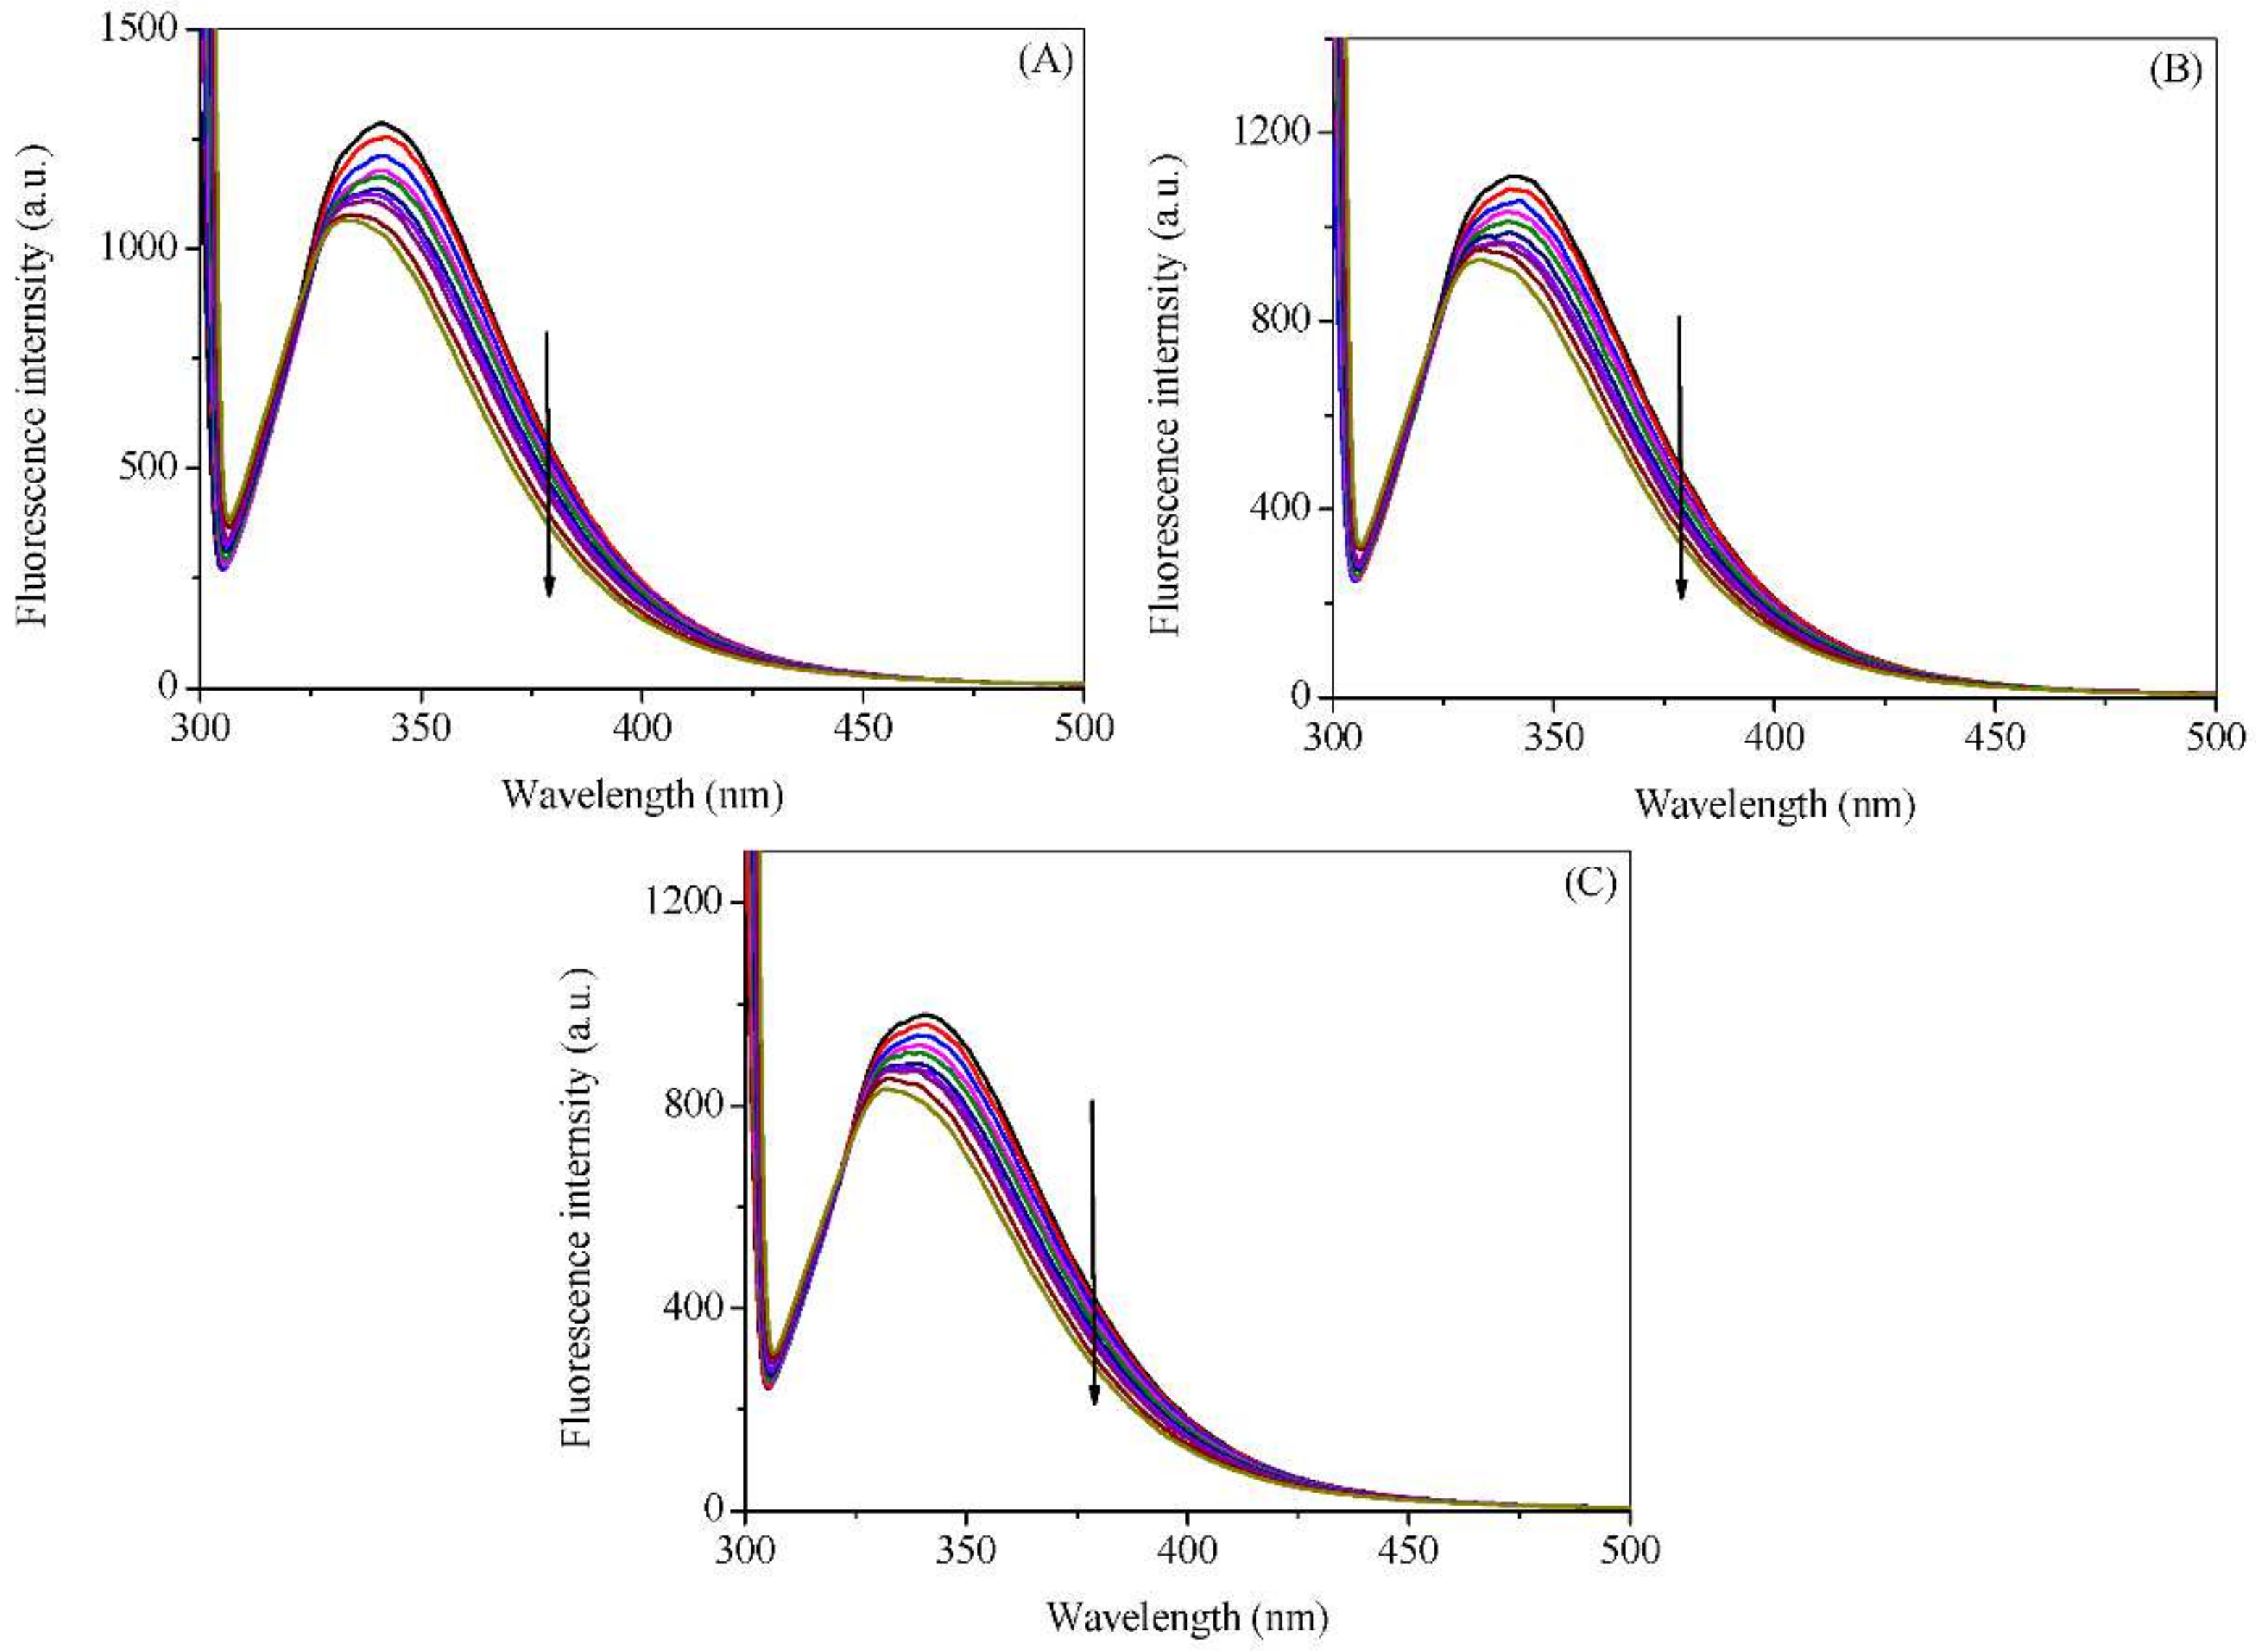
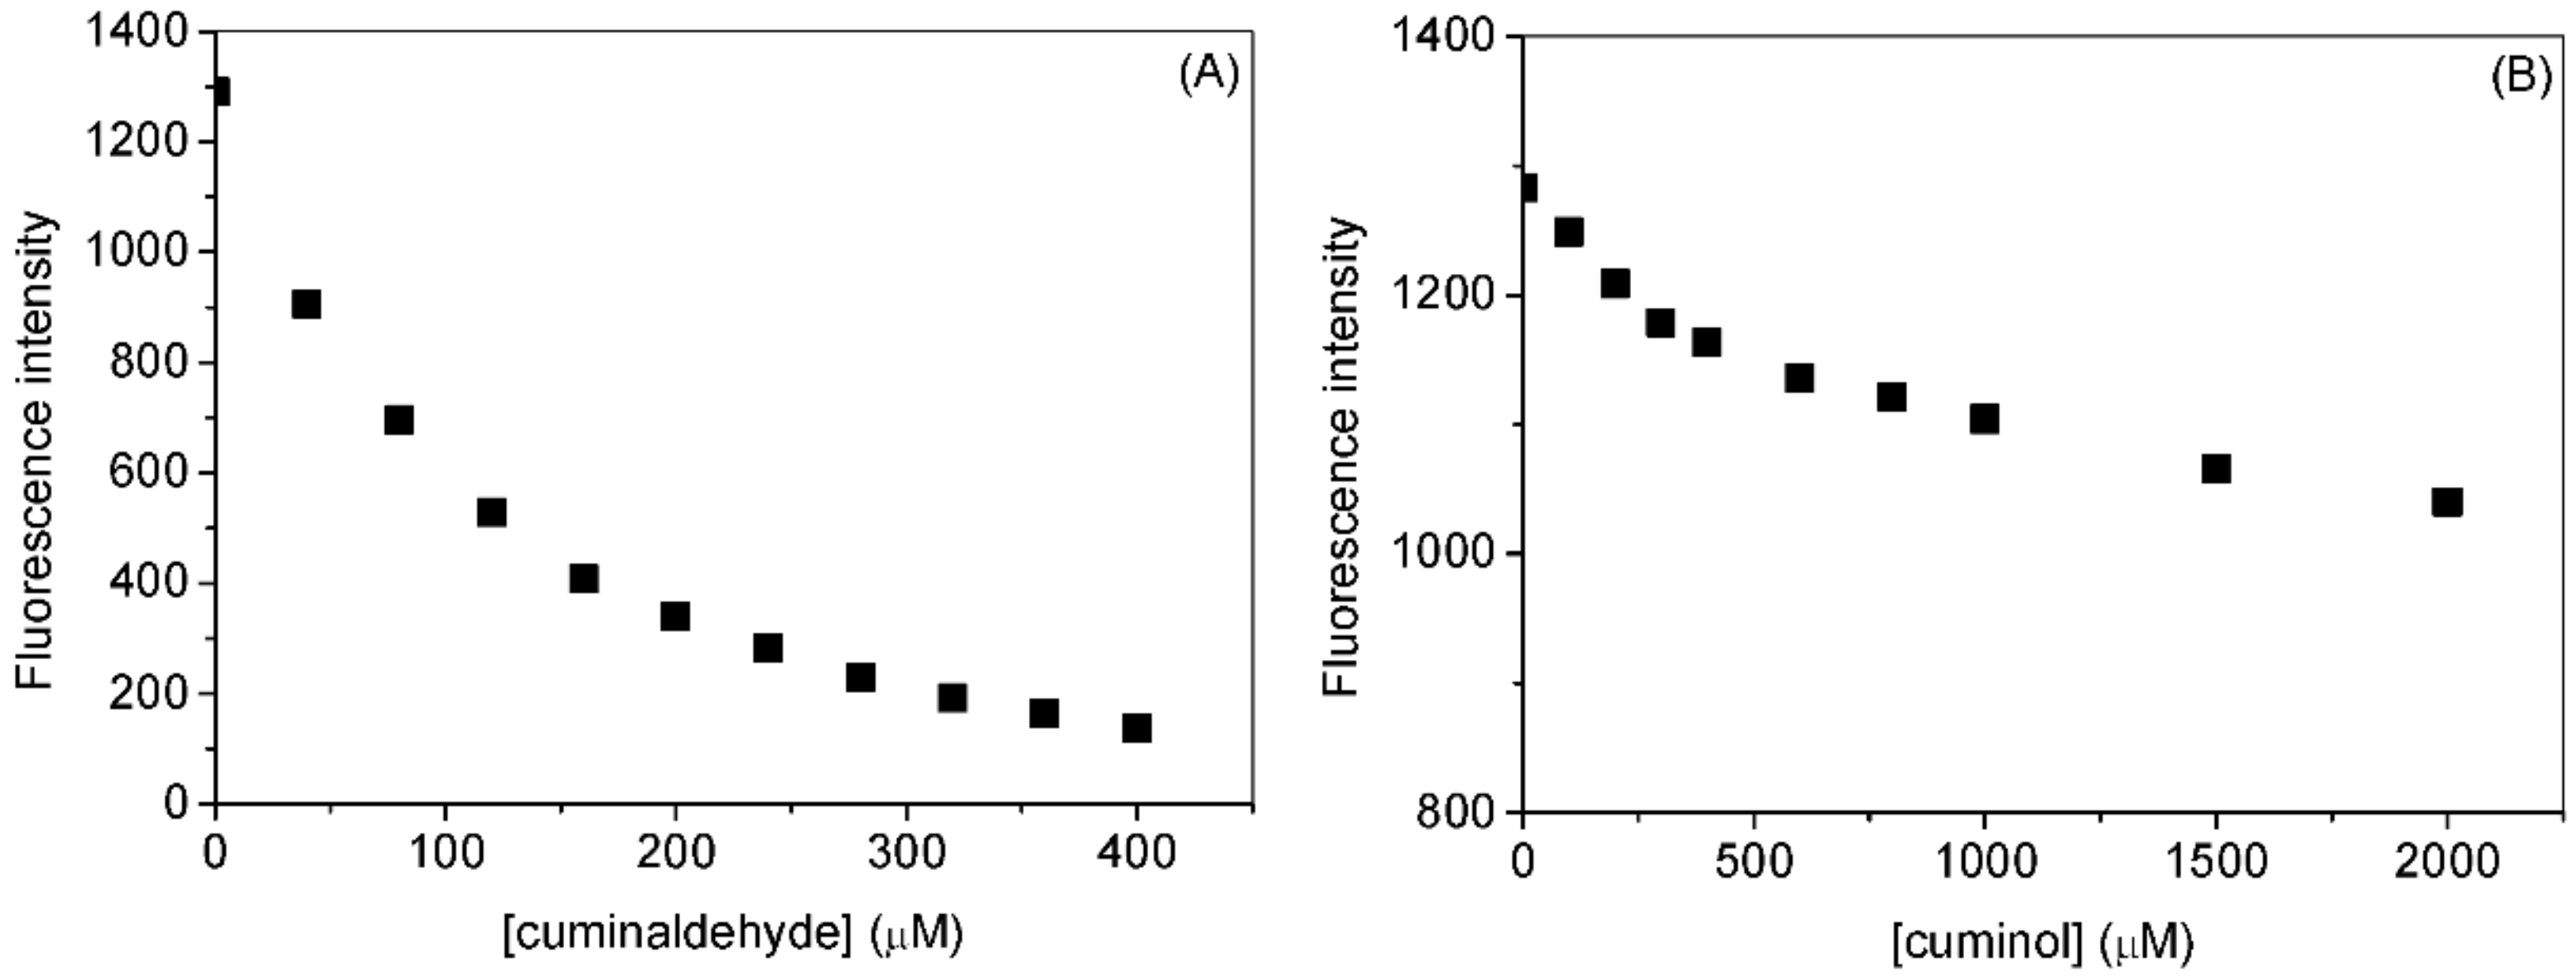
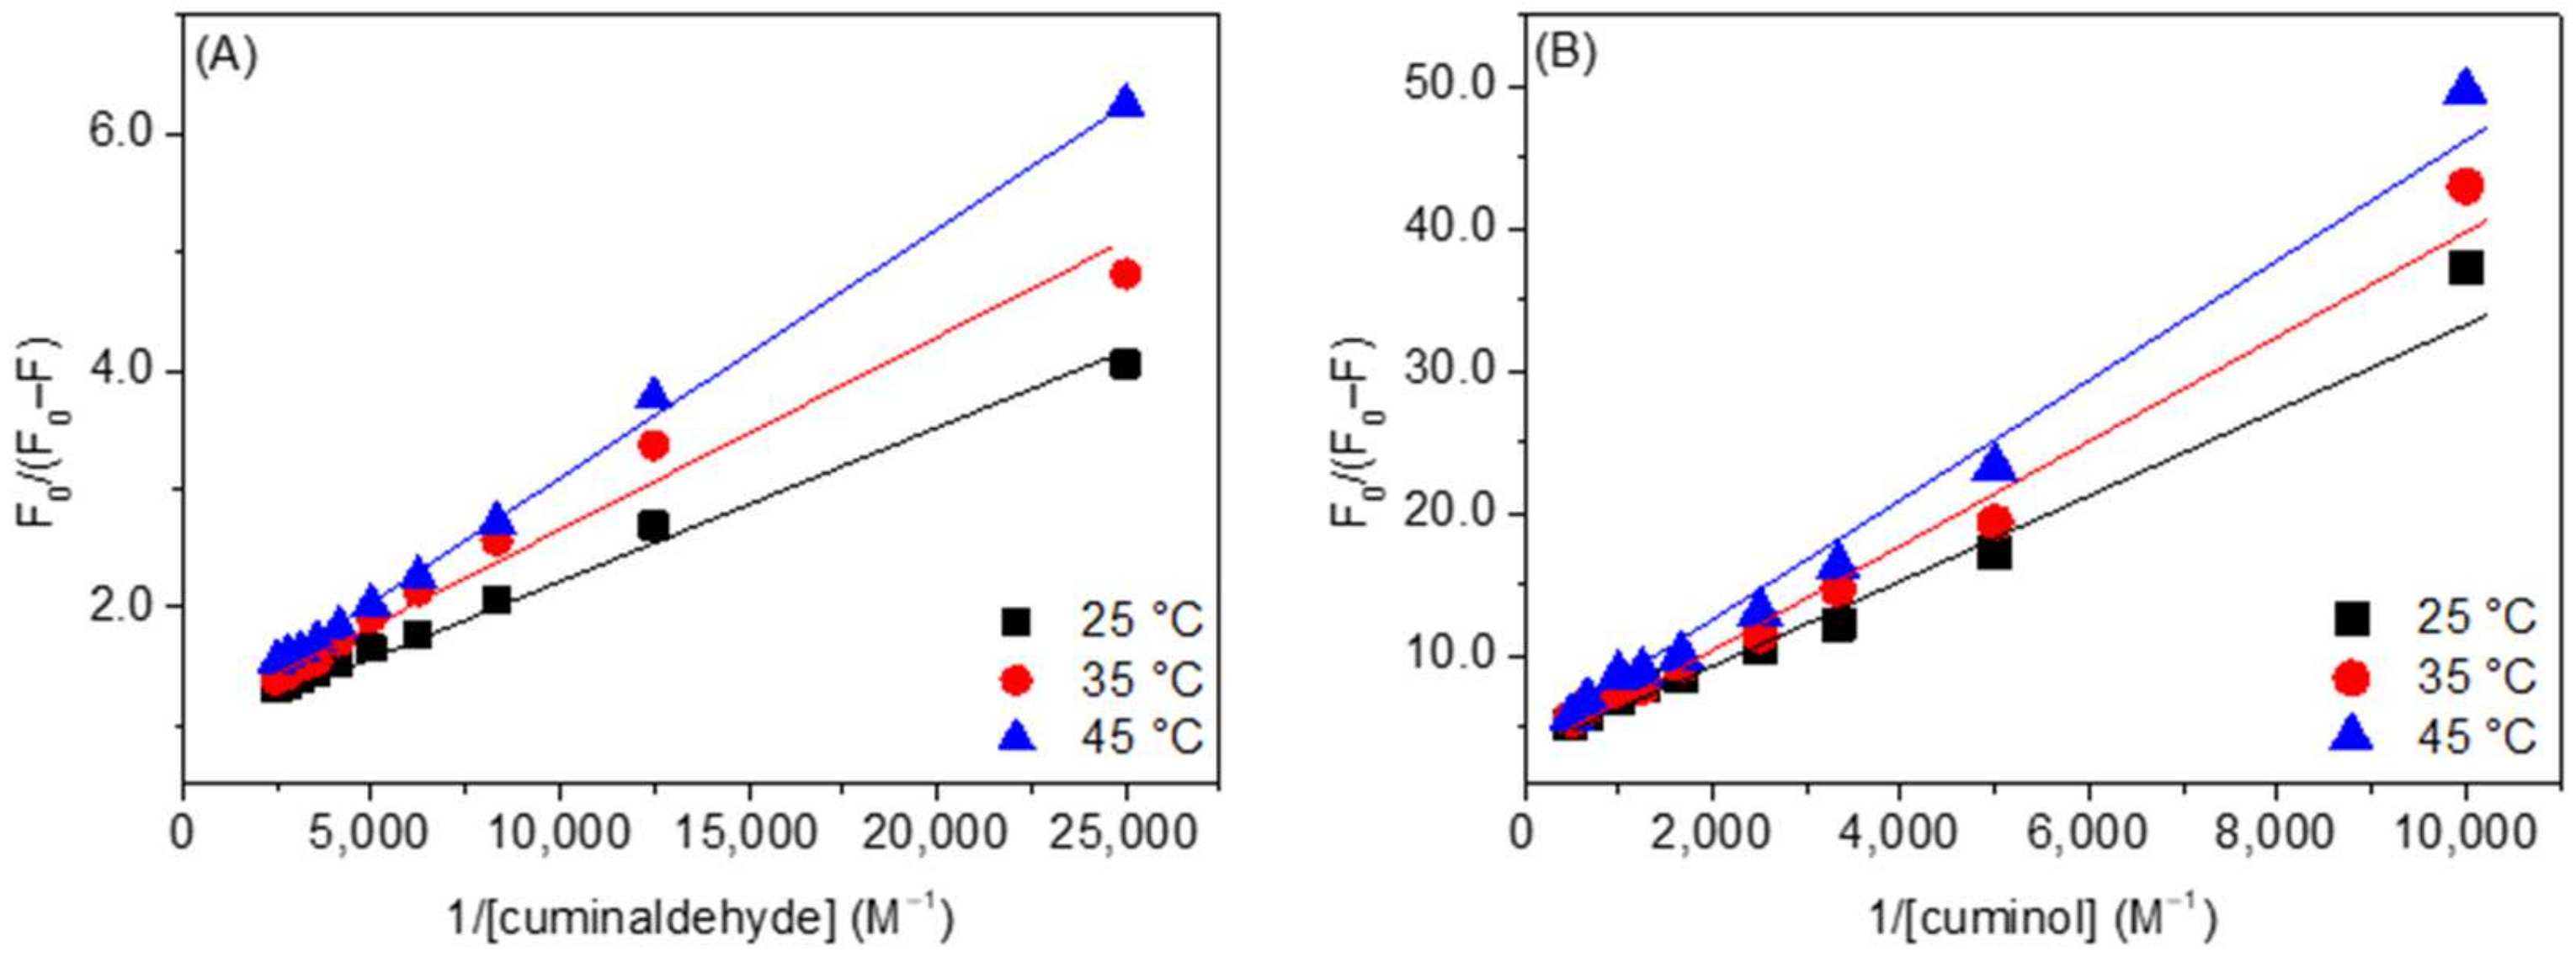
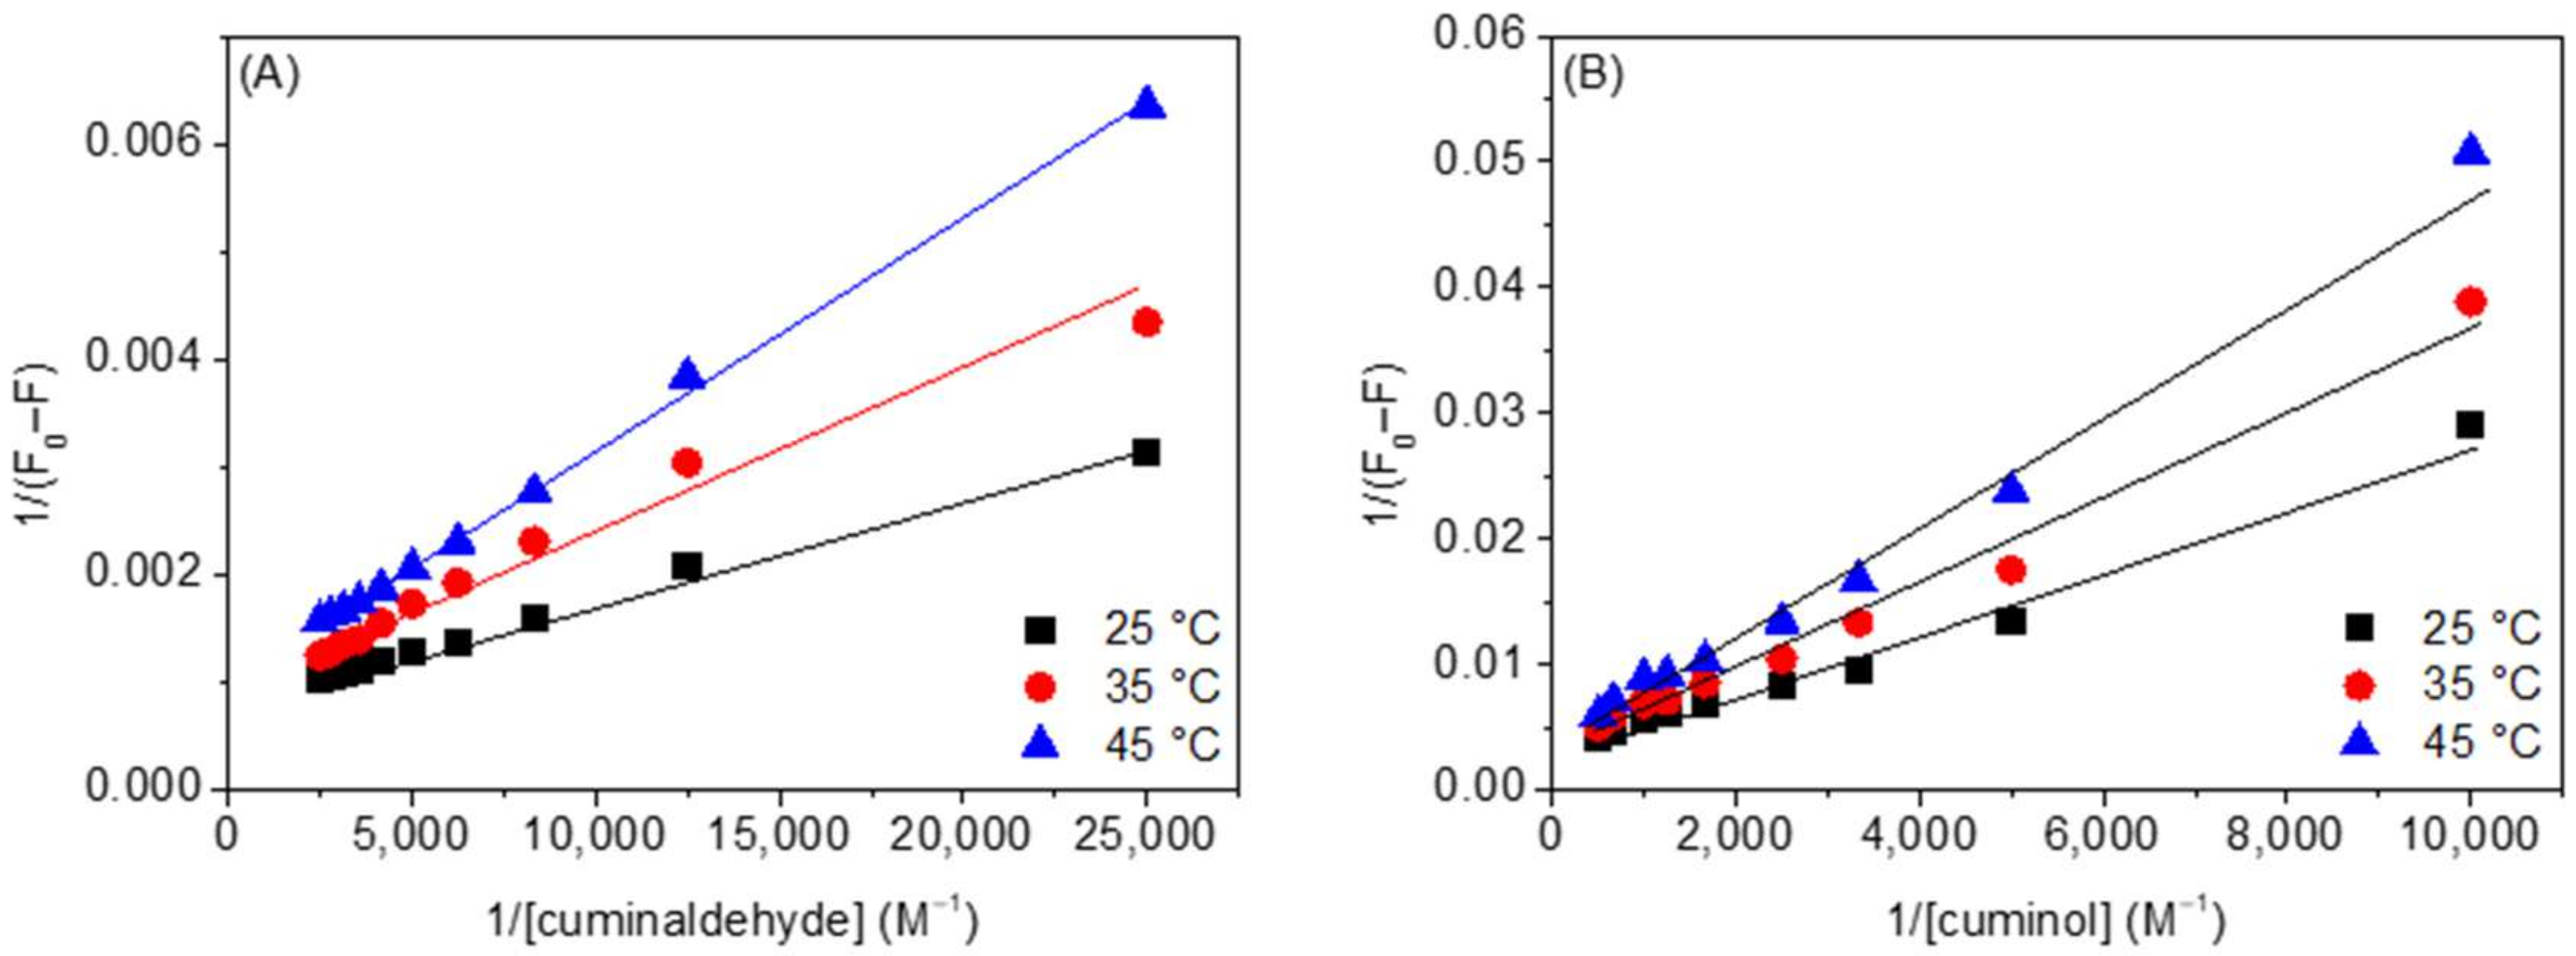
2.2. Intrinsic Fluorescence Measurements
2.3. Competitive Binding Site Experiments
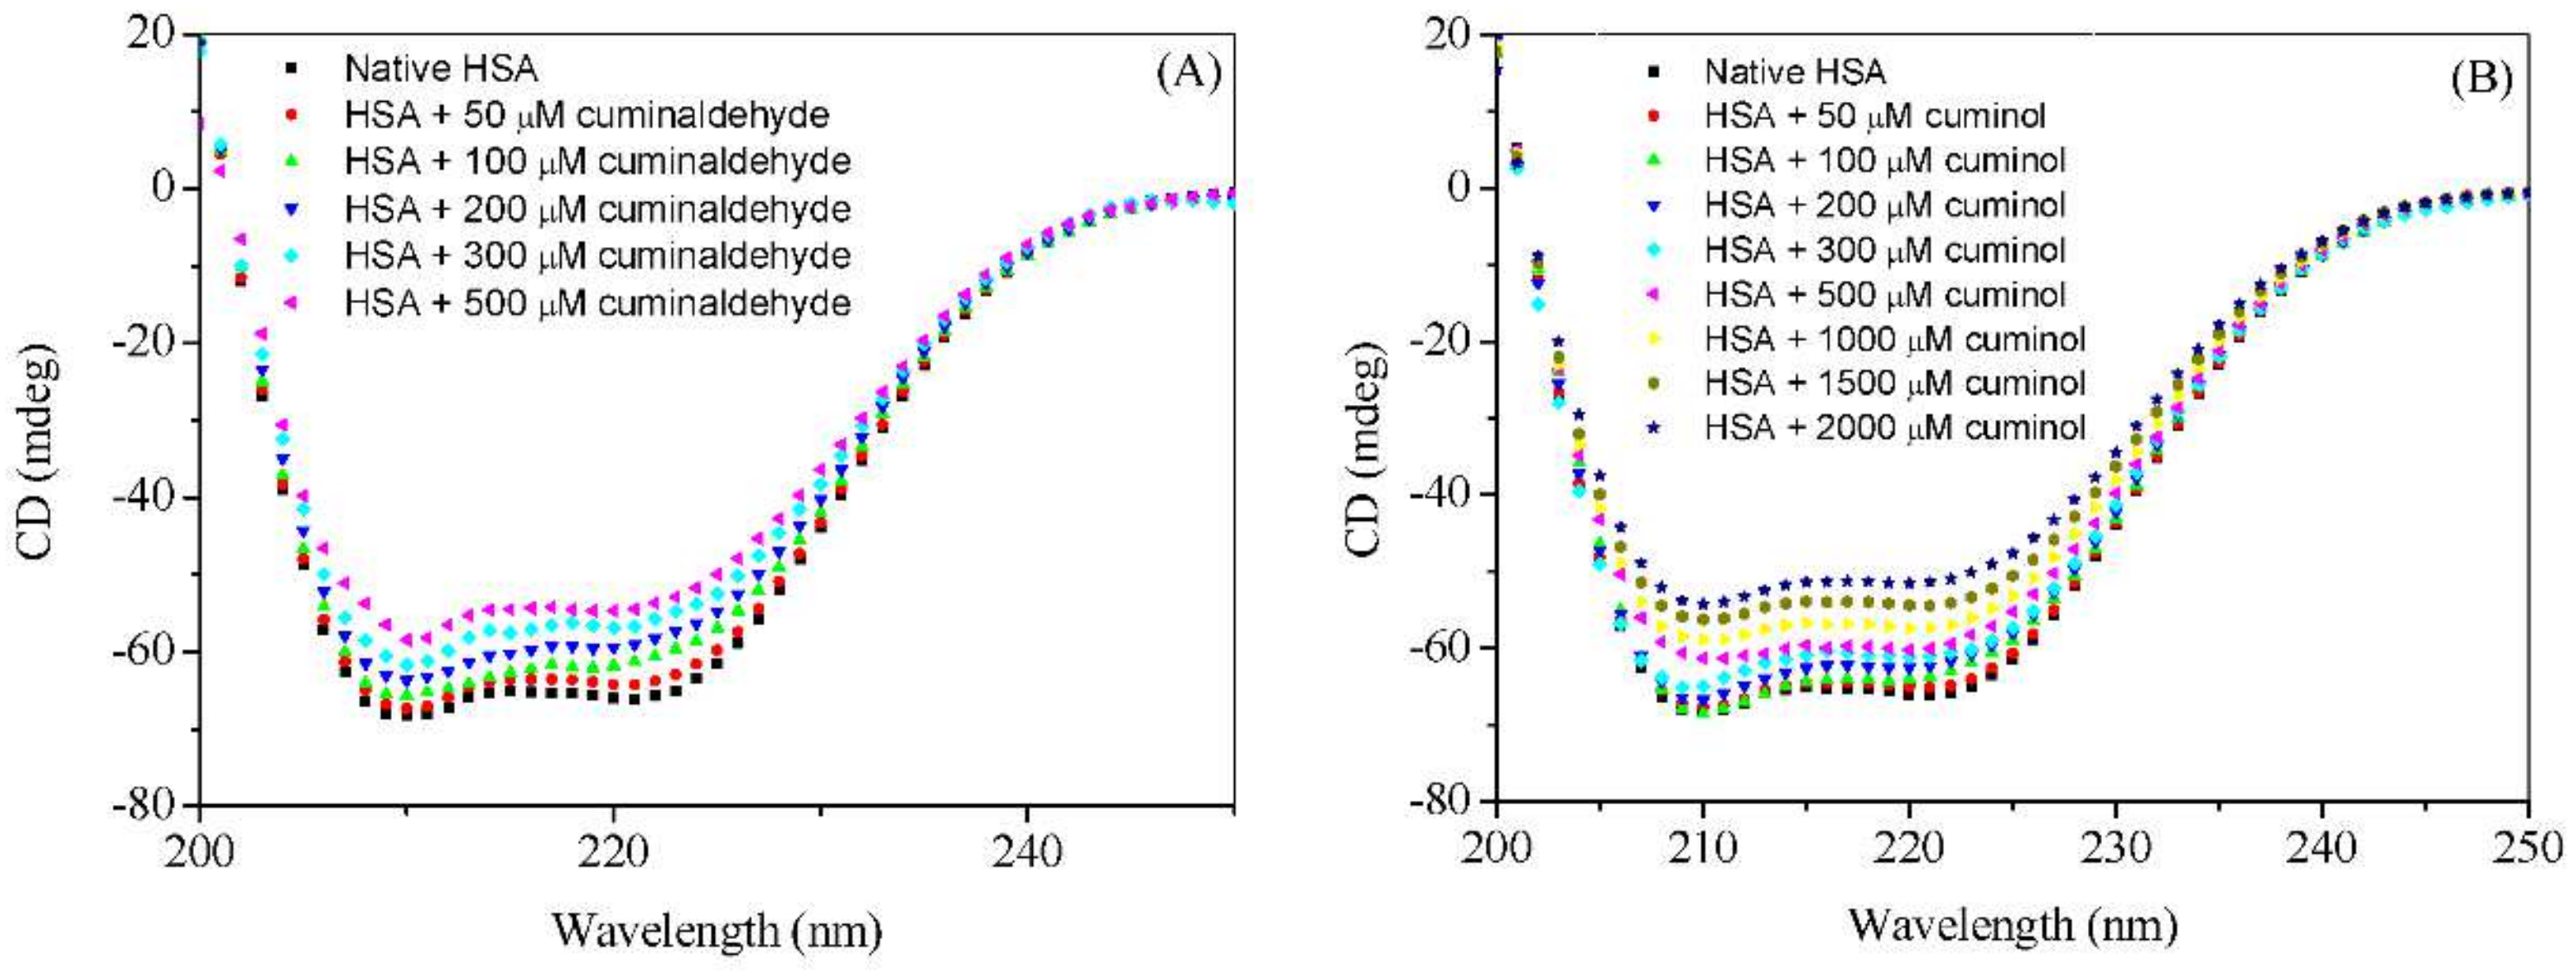
2.4. Circular Dichroism Measurements
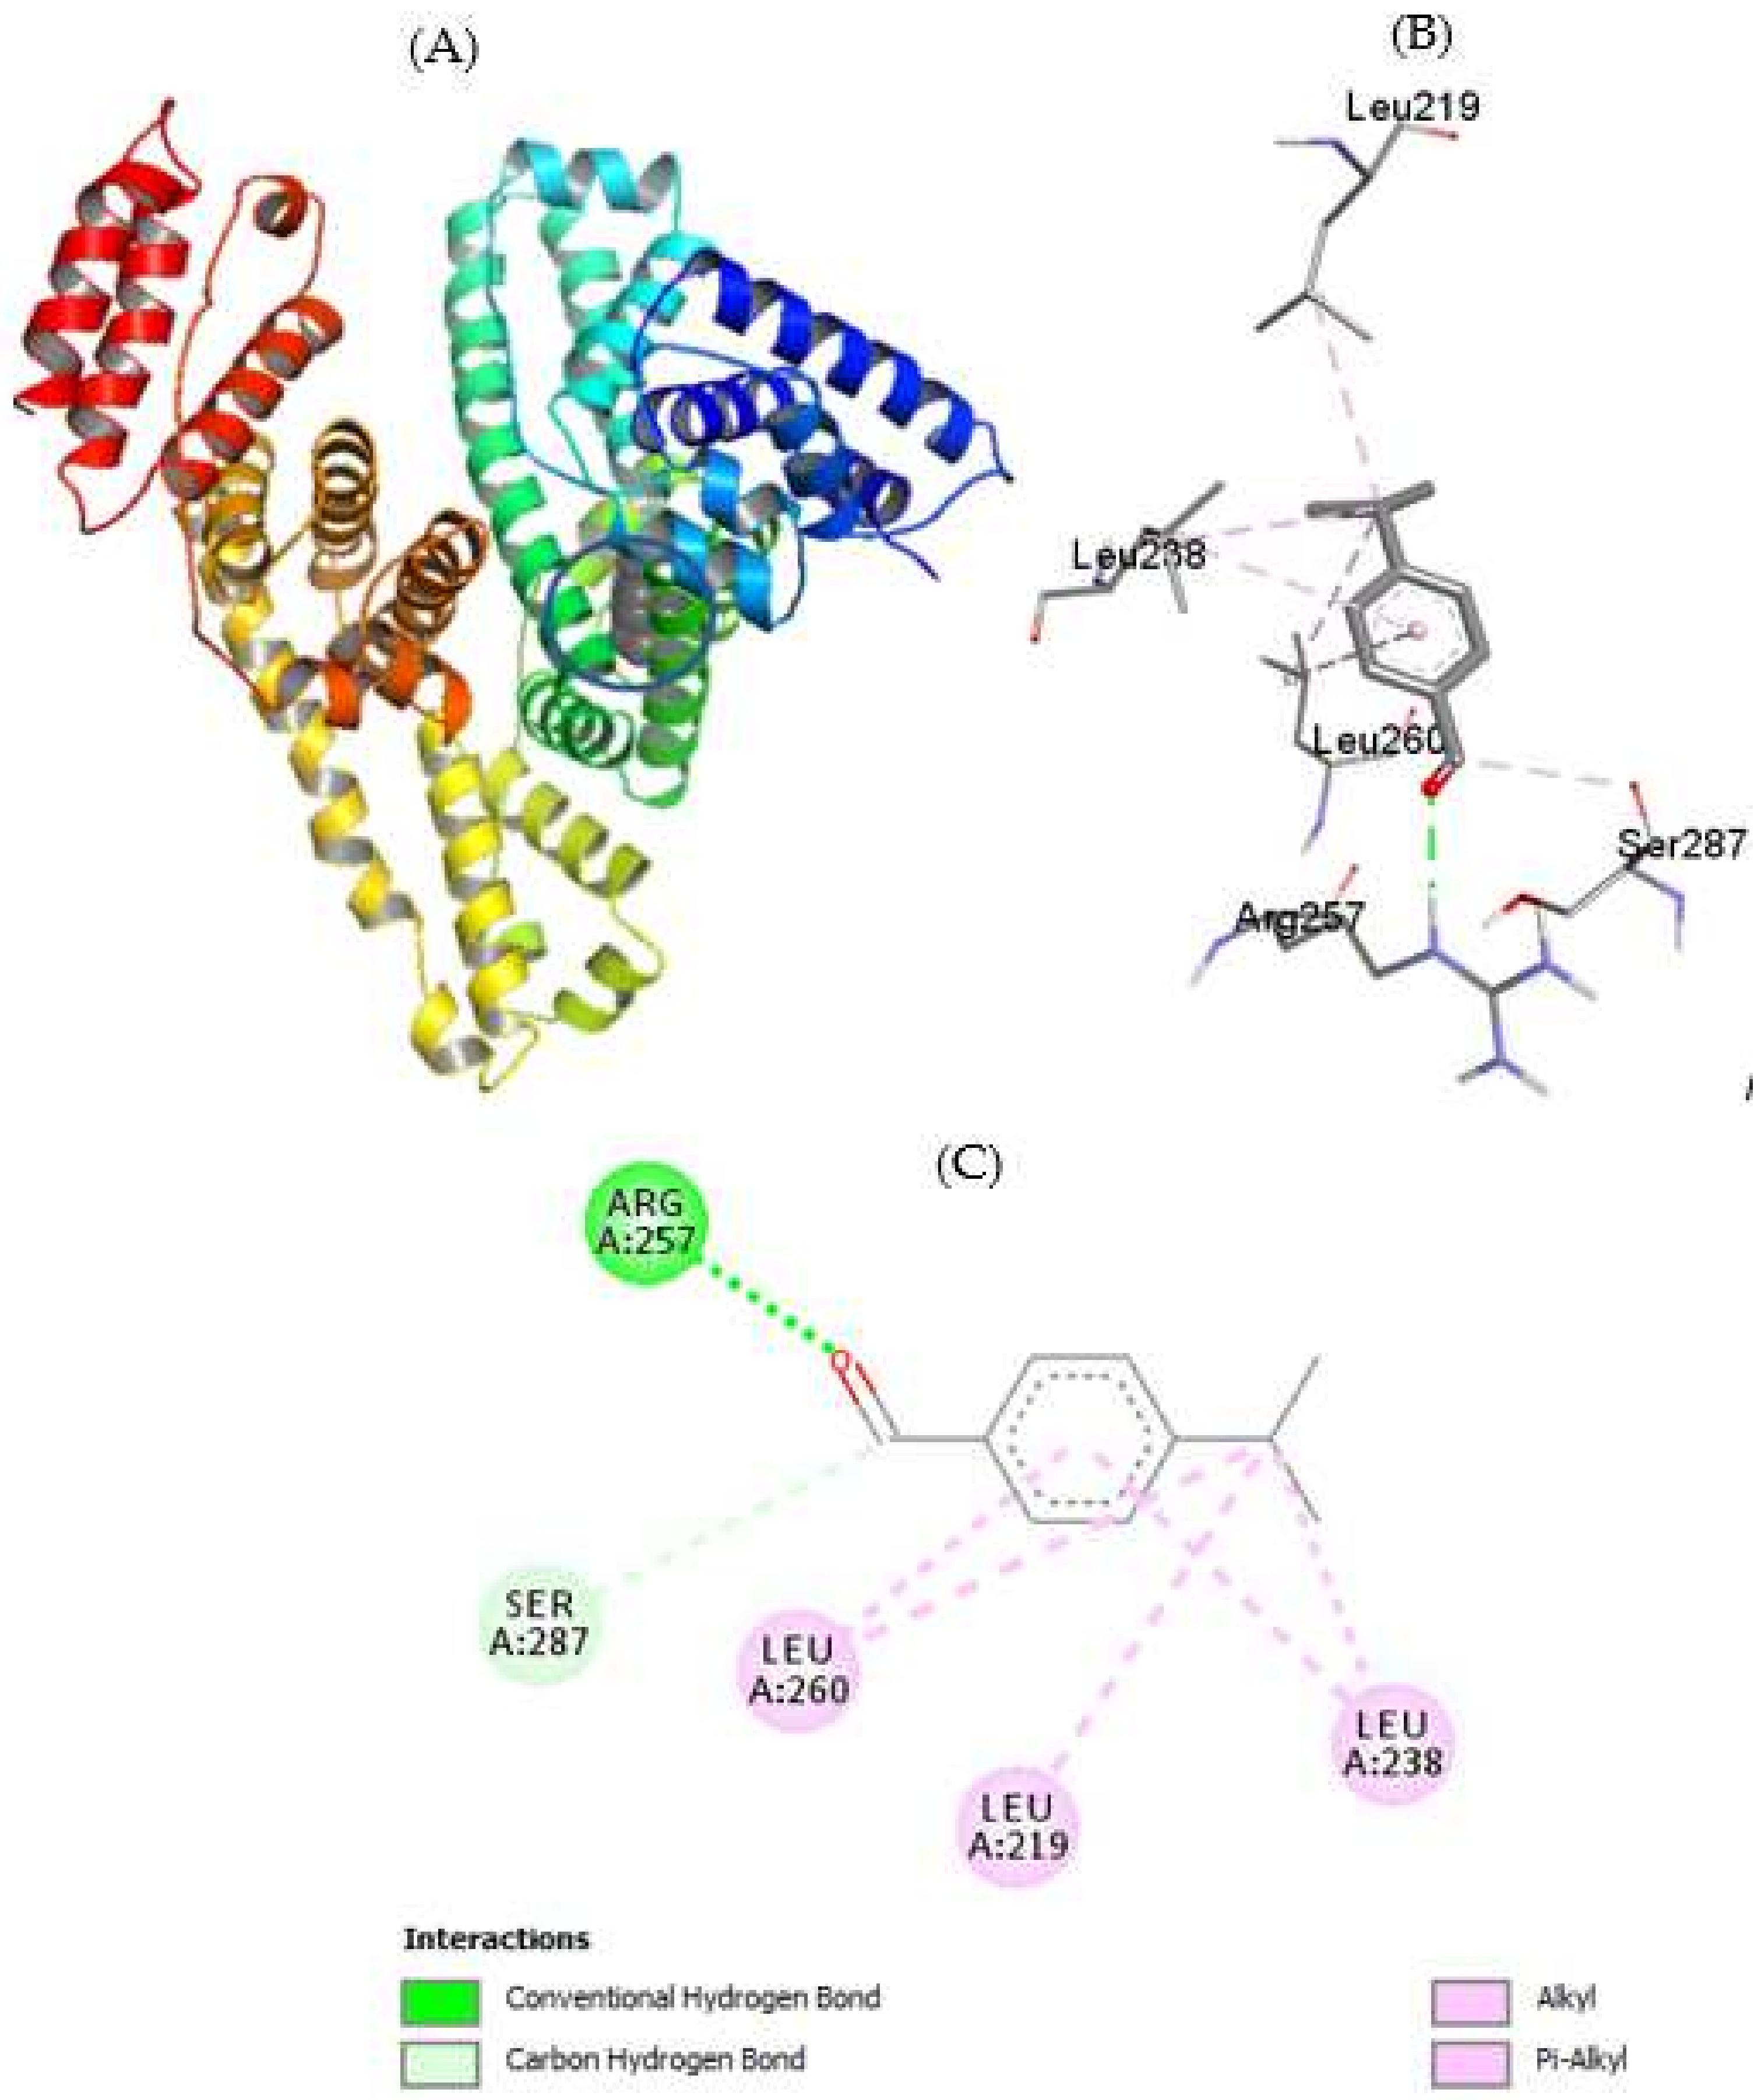
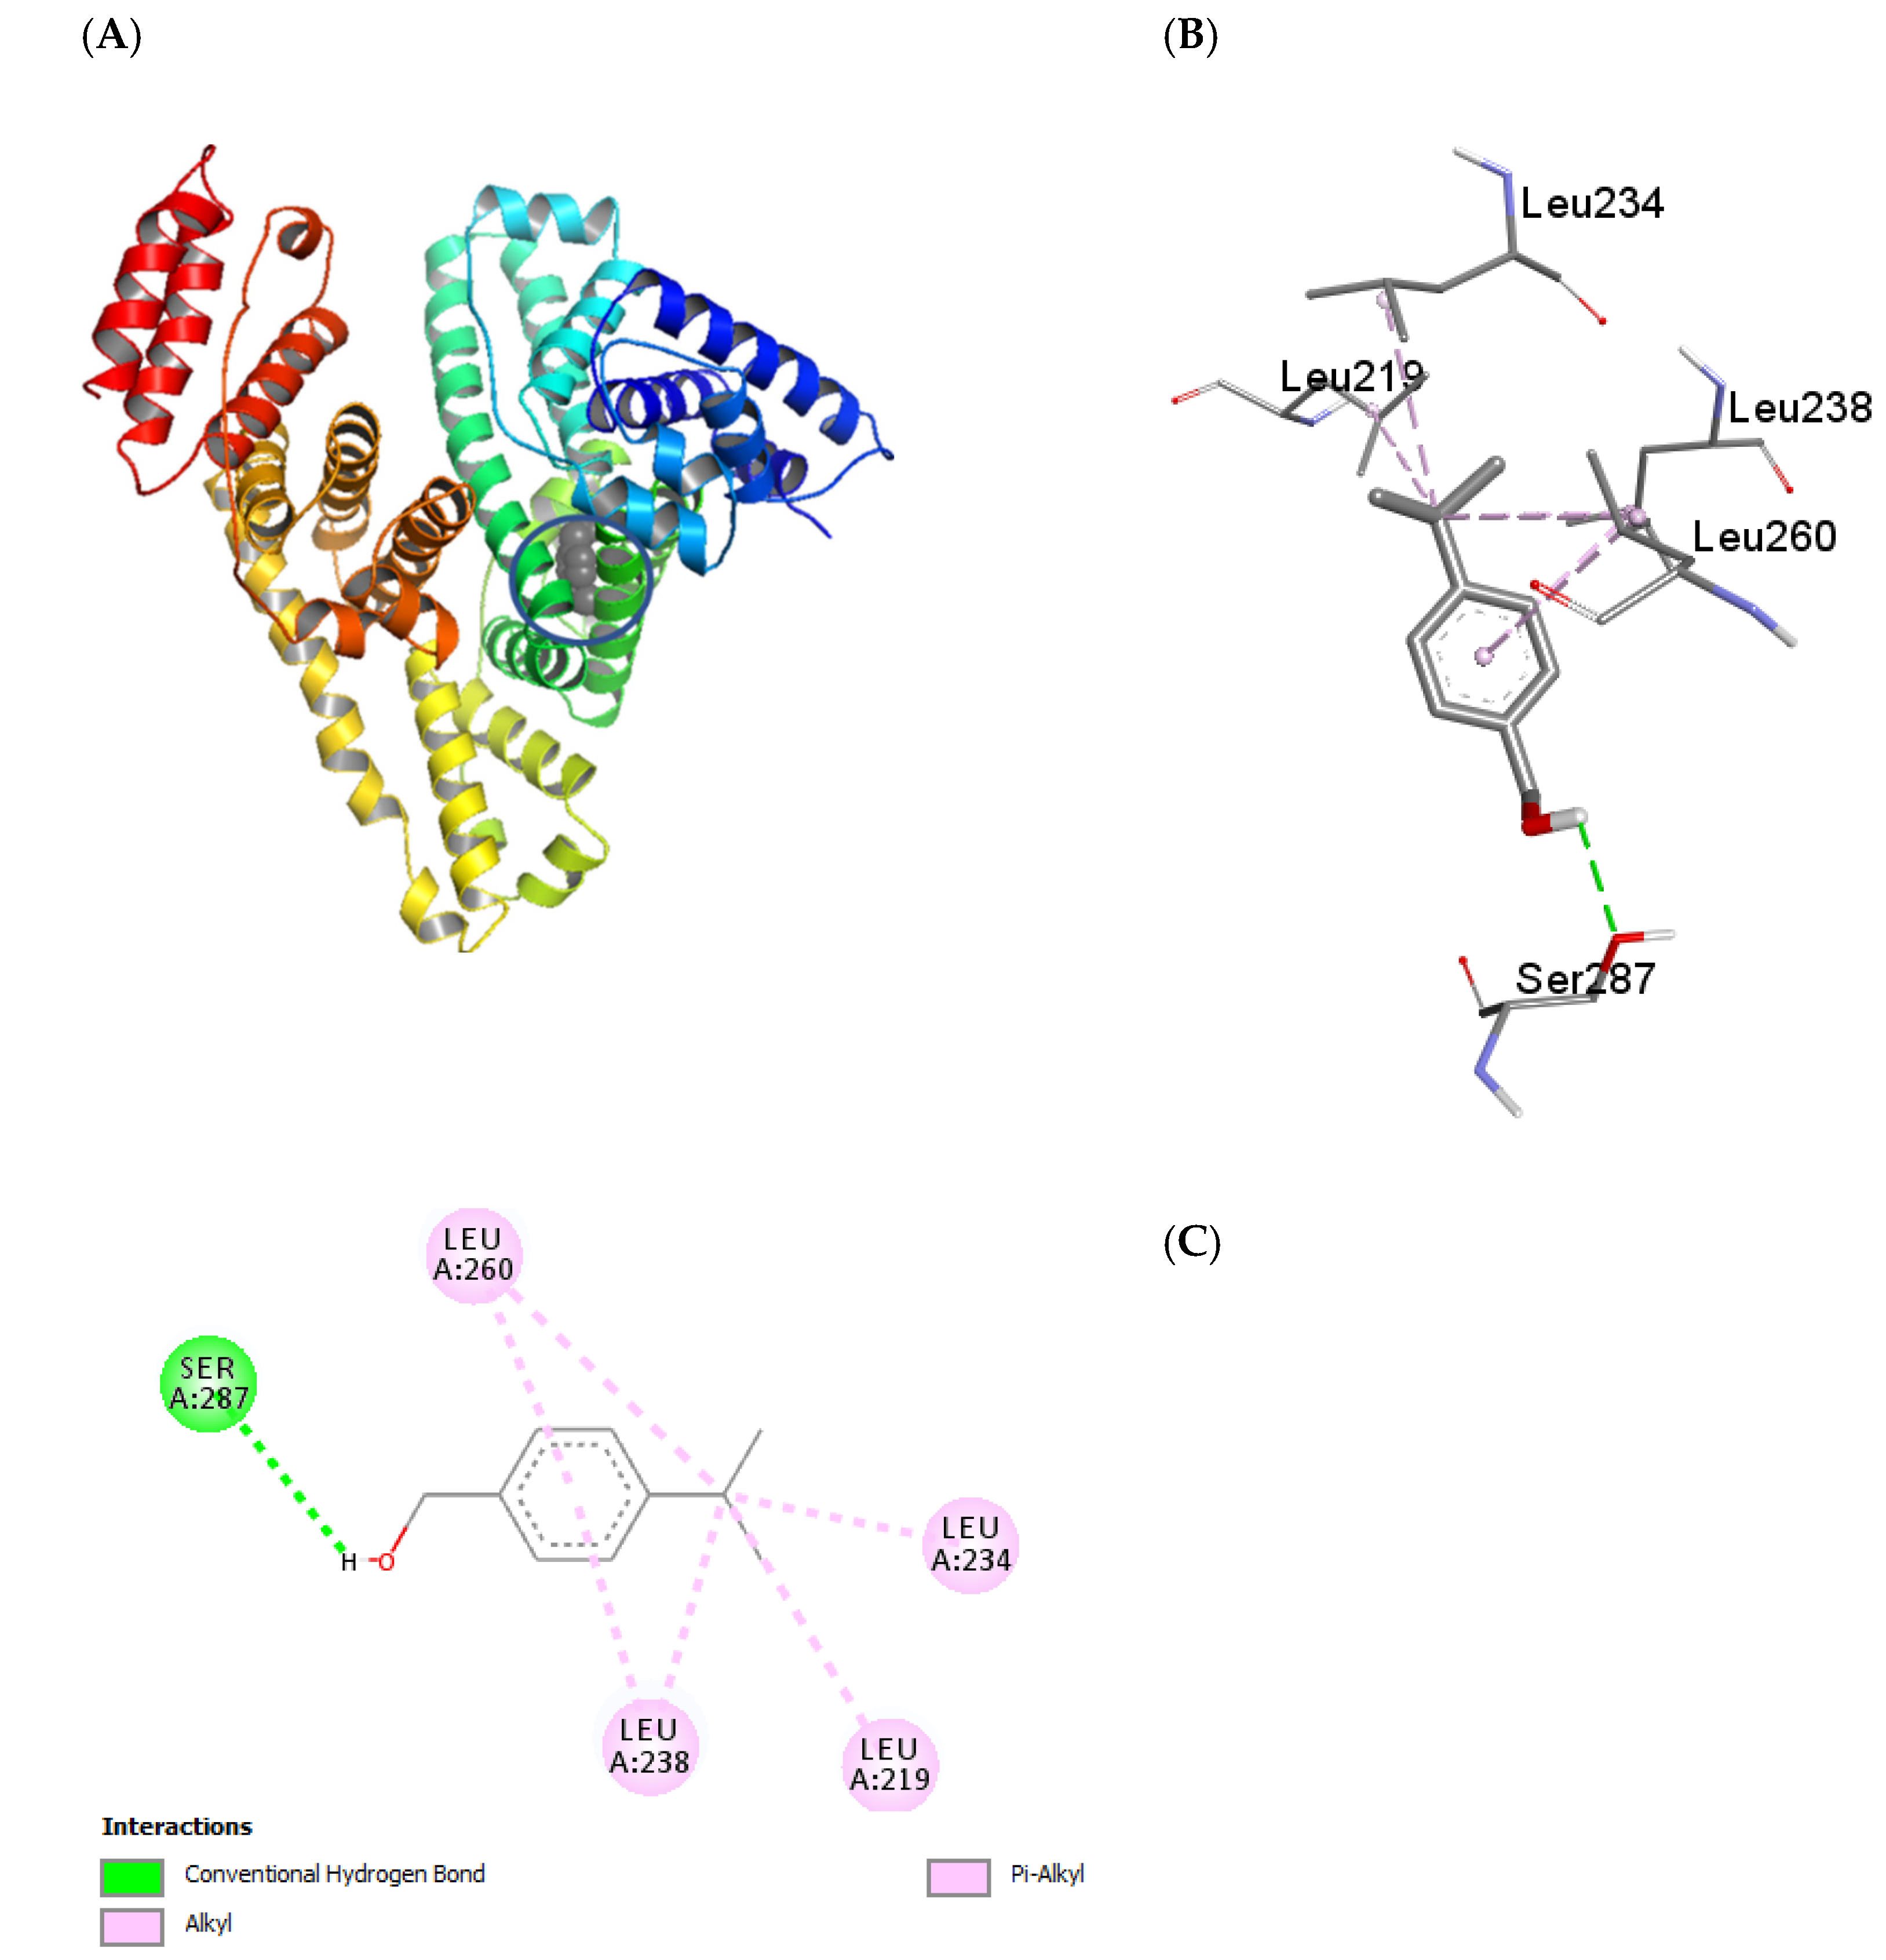
2.5. Molecular Docking
3. Materials and Methods
3.1. Materials
3.2. UV-Visible Spectroscopy
3.3. Fluorescence Spectroscopy
3.4. CD Spectroscopy
3.5. Molecular Docking
4. Conclusions
Supplementary Materials
Author Contributions
Funding
Institutional Review Board Statement
Informed Consent Statement
Data Availability Statement
Acknowledgments
Conflicts of Interest
References
- Newman, D.J.; Cragg, G.M. Natural Products as Sources of New Drugs from 1981 to 2014. J. Nat. Prod. 2016, 79, 629–661. [Google Scholar] [CrossRef] [PubMed] [Green Version]
- Bernardini, S.; Tiezzi, A.; Laghezza Masci, V.; Ovidi, E. Natural products for human health: An historical overview of the drug discovery approaches. Nat. Prod. Res. 2018, 32, 1926–1950. [Google Scholar] [CrossRef] [PubMed]
- Dias, D.A.; Urban, S.; Roessner, U. A historical overview of natural products in drug discovery. Metabolites 2012, 2, 303. [Google Scholar] [CrossRef] [PubMed] [Green Version]
- Choudhary, M.I.; Yousuf, S. Science of Spices and Culinary Herbs—Latest Laboratory, Pre-Clinical, and Clinical Studies; Bentham Science Publishers: Sharjah, United Arab Emirates, 2019. [Google Scholar]
- Azeez, S. 11 Cumin. In Chemistry of Spices; CAB eBooks: Napa, CA, USA, 2008; p. 211. [Google Scholar]
- Dar, E.A. Cumin: The Flavour of Indian Cuisines-History, Cultivation and Uses. Chem. Sci. Rev. Lett. 2019, 8, 129–135. [Google Scholar]
- Wanner, J.; Bail, S.; Jirovetz, L.; Buchbauer, G.; Schmidt, E.; Gochev, V.; Girova, T.; Atanasova, T.; Stoyanova, A. Chemical Composition and Antimicrobial Activity of Cumin Oil (Cuminum cyminum, Apiaceae). Nat. Prod. Commun. 2010, 5, 1355–1358. [Google Scholar] [CrossRef] [Green Version]
- Ebada, M.E. Cuminaldehyde: A potential drug candidate. J. Pharmacol. Clin. Res. 2017, 2, 1–4. [Google Scholar] [CrossRef]
- Teissedre, P.L.; Waterhouse, A.L. Inhibition of oxidation of human low-density lipoproteins by phenolic substances in different essential oils varieties. J. Agric. Food Chem. 2000, 48, 3801–3805. [Google Scholar] [CrossRef]
- Patil, S.B.; Takalikar, S.S.; Joglekar, M.M.; Haldavnekar, V.S.; Arvindekar, A.U. Insulinotropic and beta-cell protective action of cuminaldehyde, cuminol and an inhibitor isolated from Cuminum cyminum in streptozotocin-induced diabetic rats. Brit. J. Nutr. 2013, 110, 1434–1443. [Google Scholar] [CrossRef] [Green Version]
- Liu, M.; Amini, A.; Ahmad, Z. Safranal and its analogs inhibit Escherichia coli ATP synthase and cell growth. Int. J. Biol. Macromol. 2017, 95, 145–152. [Google Scholar] [CrossRef] [Green Version]
- Watanabe, K.; Shono, Y.; Kakimizu, A.; Okada, A.; Matsuo, N.; Satoh, A.; Nishimura, H. New Mosquito Repellent from Eucalyptus-Camaldulensis. J. Agric. Food Chem. 1993, 41, 2164–2166. [Google Scholar] [CrossRef]
- Firdaus, M.; Marliyana, S.D.; Razak, M.F. Initial Study on The Synthesis of 1-(4’-Isopropilbenzil)-1,10-Phenanthrolinium Bromide from Cuminyl Alcohol, a Potent Antimalarial. Aip. Conf. Proc. 2020, 2237, 020036. [Google Scholar] [CrossRef]
- Smith, G.S.; Walter, G.L.; Walker, R.M. Chapter 18—Clinical Pathology in Non-Clinical Toxicology Testing. In Haschek and Rousseaux’s Handbook of Toxicologic Pathology, 3rd ed.; Haschek, W.M., Rousseaux, C.G., Wallig, M.A., Eds.; Academic Press: Boston, MS, USA, 2013; pp. 565–594. [Google Scholar] [CrossRef]
- Croom, E. Chapter Three—Metabolism of Xenobiotics of Human Environments. In Progress in Molecular Biology and Translational Science; Hodgson, E., Ed.; Academic Press: Cambridge, MA, USA, 2012; Volume 112, pp. 31–88. [Google Scholar]
- Baynes, R.E.; Dix, K.J.; Riviere, J.E. Chapter 6—Distribution and Pharmacokinetics Models. In Pesticide Biotransformation and Disposition; Hodgson, E., Ed.; Academic Press: Boston, MS, USA, 2012; pp. 117–147. [Google Scholar] [CrossRef]
- Kratz, F. Albumin as a drug carrier: Design of prodrugs, drug conjugates and nanoparticles. J. Control Release 2008, 132, 171–183. [Google Scholar] [CrossRef] [PubMed]
- Elsadek, B.; Kratz, F. Impact of albumin on drug delivery—New applications on the horizon. J. Control Release 2012, 157, 4–28. [Google Scholar] [CrossRef] [PubMed]
- Ali, M.S.; Al-Lohedan, H.A. Sulfadiazine binds and unfolds bovine serum albumin: An in vitro study. Mol. Biol. Rep. 2013, 40, 6081–6090. [Google Scholar] [CrossRef] [PubMed]
- Ali, M.S.; Al-Lohedan, H.A. Interaction of human serum albumin with sulfadiazine. J. Mol. Liq. 2014, 197, 124–130. [Google Scholar] [CrossRef]
- Ali, M.S.; Al-Lohedan, H.A. Biophysical characterization of the interaction between human serum albumin and n-dodecyl beta-D-maltoside: A multi-technique approach. Colloids. Surf. B Biointerfaces 2015, 134, 392–400. [Google Scholar] [CrossRef]
- Ali, M.S.; Al-Lohedan, H.A. Multi-technique approach on the interaction between sugar-based surfactant n-dodecyl beta-D-maltoside and bovine serum albumin. J. Lumin. 2016, 169, 35–42. [Google Scholar] [CrossRef]
- Ali, M.S.; Al-Lohedan, H.A. Deciphering the interaction of procaine with bovine serum albumin and elucidation of binding site: A multi spectroscopic and molecular docking study. J. Mol. Liq. 2017, 236, 232–240. [Google Scholar] [CrossRef]
- Ali, M.S.; Muthukumaran, J.; Al-Lohedan, H.A. Molecular interactions of ceftazidime with bovine serum albumin: Spectroscopic, molecular docking, and DFT analyses. J. Mol. Liq. 2020, 313, 113490. [Google Scholar] [CrossRef]
- Ali, M.S.; Rehman, M.T.; Al-Lohedan, H.A.; AlAjmi, M.F. Exploration of the binding between cuminol and bovine serum albumin through spectroscopic, molecular docking and molecular dynamics methods. J. Biomol. Struct. Dyn. 2021. [Google Scholar] [CrossRef]
- Ali, M.S.; Waseem, M.; Subbarao, N.; Al-Lohedan, H.A. Dynamic interaction between lysozyme and ceftazidime: Experimental and molecular simulation approaches. J. Mol. Liq. 2021, 328, 115412. [Google Scholar] [CrossRef]
- Benesi, H.A.; Hildebrand, J.H. A Spectrophotometric Investigation of the Interaction of Iodine with Aromatic Hydrocarbons. J. Am. Chem. Soc. 1949, 71, 2703–2707. [Google Scholar] [CrossRef]
- Kathiravan, A.; Paramaguru, G.; Renganathan, R. Study on the binding of colloidal zinc oxide nanoparticles with bovine serum albumin. J. Mol. Struct. 2009, 934, 129–137. [Google Scholar] [CrossRef]
- Lakowicz, J.R. Principles of Fluorescence Spectroscopy, 3rd ed.; Springer US: Berlin/Heidelberg, Germany, 2006; p. 954. [Google Scholar]
- Silva, D.; Cortez, C.M.; Silva, C.M.C.; Missailidis, S. A fluorescent spectroscopy and modelling analysis of anti-heparanase aptamers–serum protein interactions. J. Photochem. Photobiol. B: Biol. 2013, 127, 68–77. [Google Scholar] [CrossRef] [PubMed]
- Matei, I.; Hillebrand, M. Interaction of kaempferol with human serum albumin: A fluorescence and circular dichroism study. J. Pharm. Biomed. Anal. 2010, 51, 768–773. [Google Scholar] [CrossRef]
- Maciazek-Jurczyk, M.; Rownicka-Zubik, J.; Dyja, R.; Sulkowska, A. Comparative Analysis of KP-HSA Complex by Spectroscopic Methods. Acta Phys. Pol. A 2013, 123, 673–680. [Google Scholar] [CrossRef]
- Lehrer, S. Solute perturbation of protein fluorescence. Quenching of the tryptophyl fluorescence of model compounds and of lysozyme by iodide ion. Biochemistry 1971, 10, 3254–3263. [Google Scholar] [CrossRef]
- Yan, C.N.; Zhang, H.X.; Mei, P.; Liu, Y. Study on binding reaction between flucytosine and bovine serum albumin. Chin. J Chem 2005, 23, 1151–1156. [Google Scholar] [CrossRef]
- Zhang, H.X.; Huang, X.; Mei, P.; Li, K.H.; Yan, C.N. Studies on the interaction of tricyclazole with beta-cyclodextrin and human serum albumin by spectroscopy. J. Fluoresc. 2006, 16, 287–294. [Google Scholar] [CrossRef]
- Zhang, H.X.; Huang, X.; Zhang, M. Spectral diagnostics of the interaction between pyridoxine hydrochloride and bovine serum albumin in vitro. Mol. Biol. Rep. 2008, 35, 699–705. [Google Scholar] [CrossRef]
- Ali, M.S.; Amina, M.; Al-Lohedan, H.A.; Al Musayeib, N.M. Human serum albumin binding to the biologically active labdane diterpene “leoheterin”: Spectroscopic and in silico analysis. J. Photochem. Photobiol. B Biol. 2018, 182, 9–17. [Google Scholar] [CrossRef] [PubMed]
- Ross, P.D.; Subramanian, S. Thermodynamics of protein association reactions: Forces contributing to stability. Biochemistry 1981, 20, 3096–3102. [Google Scholar] [CrossRef] [PubMed]
- Tan, Y.; Siebert, K.J. Modeling bovine serum albumin binding of flavor compounds (alcohols, aldehydes, esters, and ketones) as a function of molecular properties. J. Food Sci. 2008, 73, S56–S63. [Google Scholar] [CrossRef] [PubMed]
- Patel, S. Topological Modeling Of Log Kow (Octanol–Water Partition Coefficient) Vis-À-Vis Toxicity Of Aromatic Aldehydes.
- Api, A.M.; Belsito, D.; Biserta, S.; Botelho, D.; Bruze, M.; Burton, G.A.; Buschmann, J.; Cancellieri, M.A.; Dagli, M.L.; Date, M.; et al. RIFM fragrance ingredient safety assessment, p-isopropylbenzyl alcohol, CAS Registry Number 536-60-7. Food Chem. Toxicol. 2020, 141, 111338. [Google Scholar] [CrossRef]
- Sudlow, G.; Birkett, D.J.; Wade, D.N. The characterization of two specific drug binding sites on human serum albumin. Mol. Pharm. 1975, 11, 824–832. [Google Scholar]
- Sudlow, G.; Birkett, D.J.; Wade, D.N. Further Characterization of Specific Drug Binding-Sites on Human-Serum Albumin. Mol. Pharm. 1976, 12, 1052–1061. [Google Scholar]
- Ghuman, J.; Zunszain, P.A.; Petitpas, I.; Bhattacharya, A.A.; Otagiri, M.; Curry, S. Structural basis of the drug-binding specificity of human serum albumin. J. Mol. Biol. 2005, 353, 38–52. [Google Scholar] [CrossRef]
- Theodore Peters, J. All About Albumin: Biochemistry, Genetics, and Medical Applications; Academic Press: Cambridge, MA, USA, 1995. [Google Scholar]
- Chen, Y.-H.; Yang, J.T.; Martinez, H.M. Determination of the secondary structures of proteins by circular dichroism and optical rotatory dispersion. Biochemistry 1972, 11, 4120–4131. [Google Scholar] [CrossRef]


| Temperature (°C) | Modified Stern-Volmer Quenching Constants | Lineweaver-Burk Constants | ||
|---|---|---|---|---|
| KQ (M−1) | R2 | KLB (M−1) | R2 | |
| 25 | 8.3 ± 0.04 × 10³ | 0.9969 | 8.3 ± 0.04 × 10³ | 0.9969 |
| 35 | 6.9 ± 0.02 × 10³ | 0.9804 | 7.0 ± 0.02 × 10³ | 0.9804 |
| 45 | 5.6 ± 0.02 × 10³ | 0.9985 | 5.5 ± 0.02 × 10³ | 0.9985 |
| Temperature (°C) | Modified Stern-Volmer Quenching Constants | Lineweaver-Burk Constants | ||
|---|---|---|---|---|
| KQ (M−1) | R2 | KLB (M−1) | R2 | |
| 25 | 9.4 ± 0.42 × 10² | 0.9848 | 9.4 ± 0.42 × 10² | 0.9848 |
| 35 | 7.5 ± 0.38 × 10² | 0.9868 | 7.6 ± 0.38 × 10² | 0.9868 |
| 45 | 6.3 ± 0.29 × 10² | 0.9905 | 6.3 ± 0.29 × 10² | 0.9905 |
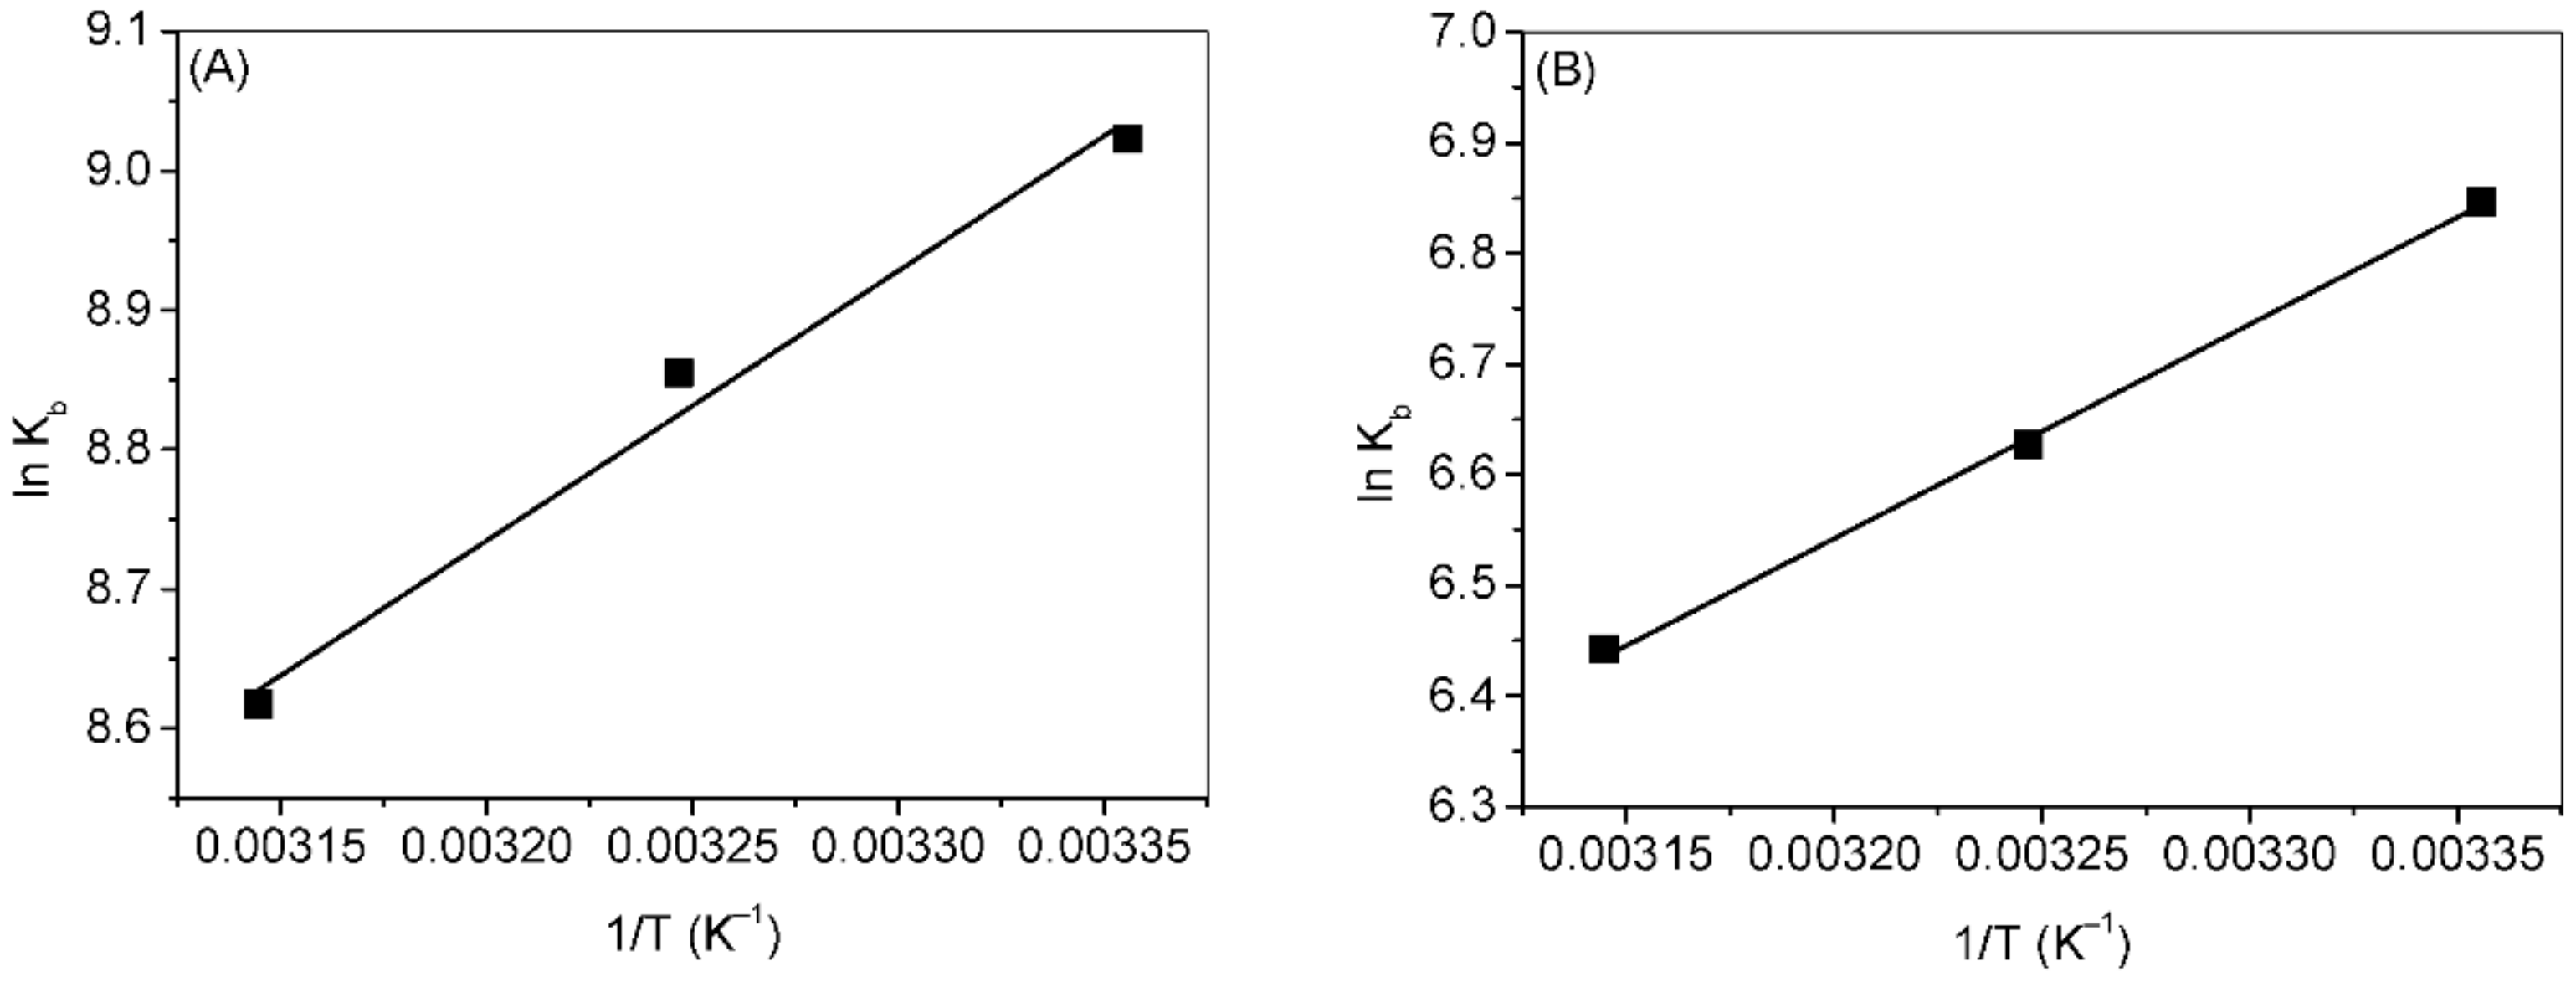
| T (K) | ∆G (KJM−1) | ∆H (KJM−1) | ∆S (JM−1K−1) |
|---|---|---|---|
| 298 | −22.4 ± 0.03 | −16.0 ± 0.10 | 21.6 ± 0.11 |
| 308 | −22.6 ± 0.05 | ||
| 318 | −22.8 ± 0.01 |
| T (K) | ∆G (KJM−1) | ∆H (KJM−1) | ∆S (JM−1K−1) |
|---|---|---|---|
| 298 | −16.9 ± 0.02 | −15.9 ± 0.04 | 3.3 ± 0.03 |
| 308 | −16.9 ± 0.01 | ||
| 318 | −17.0 ± 0.01 |
| Site-Marker | Lineweaver-Burk Constants (M−1) | |
|---|---|---|
| Cuminaldehyde | Cuminol | |
| Warfarin | 4.1 ± 0.08 × 10³ | 2.3 ± 0.06 × 10² |
| Ibuprofen | 7.8 ± 0.04 × 10³ | 6.0 ± 0.07 × 10² |
| Concentration of Ligands (µM) | % α-Helical Contents | |
|---|---|---|
| Cuminaldehyde | Cuminol | |
| 0 | 67.5 ± 0.11 | 67.5 ± 0.11 |
| 50 | 65.7 ± 0.19 | 66.6 ± 0.09 |
| 100 | 62.6 ± 0.17 | 64.9 ± 0.12 |
| 200 | 60.5 ± 0.21 | 63.7 ± 0.13 |
| 300 | 58.1 ± 0.10 | 62.7 ± 0.08 |
| 500 | 56.2 ± 0.12 | 61.6 ± 0.09 |
| 1000 | - | 59.5 ± 0.07 |
| 1500 | - | 56.9 ± 0.08 |
| 2000 | - | 54.0 ± 0.10 |
Publisher’s Note: MDPI stays neutral with regard to jurisdictional claims in published maps and institutional affiliations. |
© 2022 by the authors. Licensee MDPI, Basel, Switzerland. This article is an open access article distributed under the terms and conditions of the Creative Commons Attribution (CC BY) license (https://creativecommons.org/licenses/by/4.0/).
Share and Cite
Ali, M.S.; Rehman, M.T.; Al-Lohedan, H.; AlAjmi, M.F. Spectroscopic and Molecular Docking Investigation on the Interaction of Cumin Components with Plasma Protein: Assessment of the Comparative Interactions of Aldehyde and Alcohol with Human Serum Albumin. Int. J. Mol. Sci. 2022, 23, 4078. https://doi.org/10.3390/ijms23084078
Ali MS, Rehman MT, Al-Lohedan H, AlAjmi MF. Spectroscopic and Molecular Docking Investigation on the Interaction of Cumin Components with Plasma Protein: Assessment of the Comparative Interactions of Aldehyde and Alcohol with Human Serum Albumin. International Journal of Molecular Sciences. 2022; 23(8):4078. https://doi.org/10.3390/ijms23084078
Chicago/Turabian StyleAli, Mohd Sajid, Md Tabish Rehman, Hamad Al-Lohedan, and Mohamed Fahad AlAjmi. 2022. "Spectroscopic and Molecular Docking Investigation on the Interaction of Cumin Components with Plasma Protein: Assessment of the Comparative Interactions of Aldehyde and Alcohol with Human Serum Albumin" International Journal of Molecular Sciences 23, no. 8: 4078. https://doi.org/10.3390/ijms23084078