
Examination of the Impact of CYP3A4/5 on Drug–Drug Interaction between Schizandrol A/Schizandrol B and Tacrolimus (FK-506): A Physiologically Based Pharmacokinetic Modeling Approach

 ,
,  , ,
, ,  and
and
Abstract
:1. Introduction
2. Results
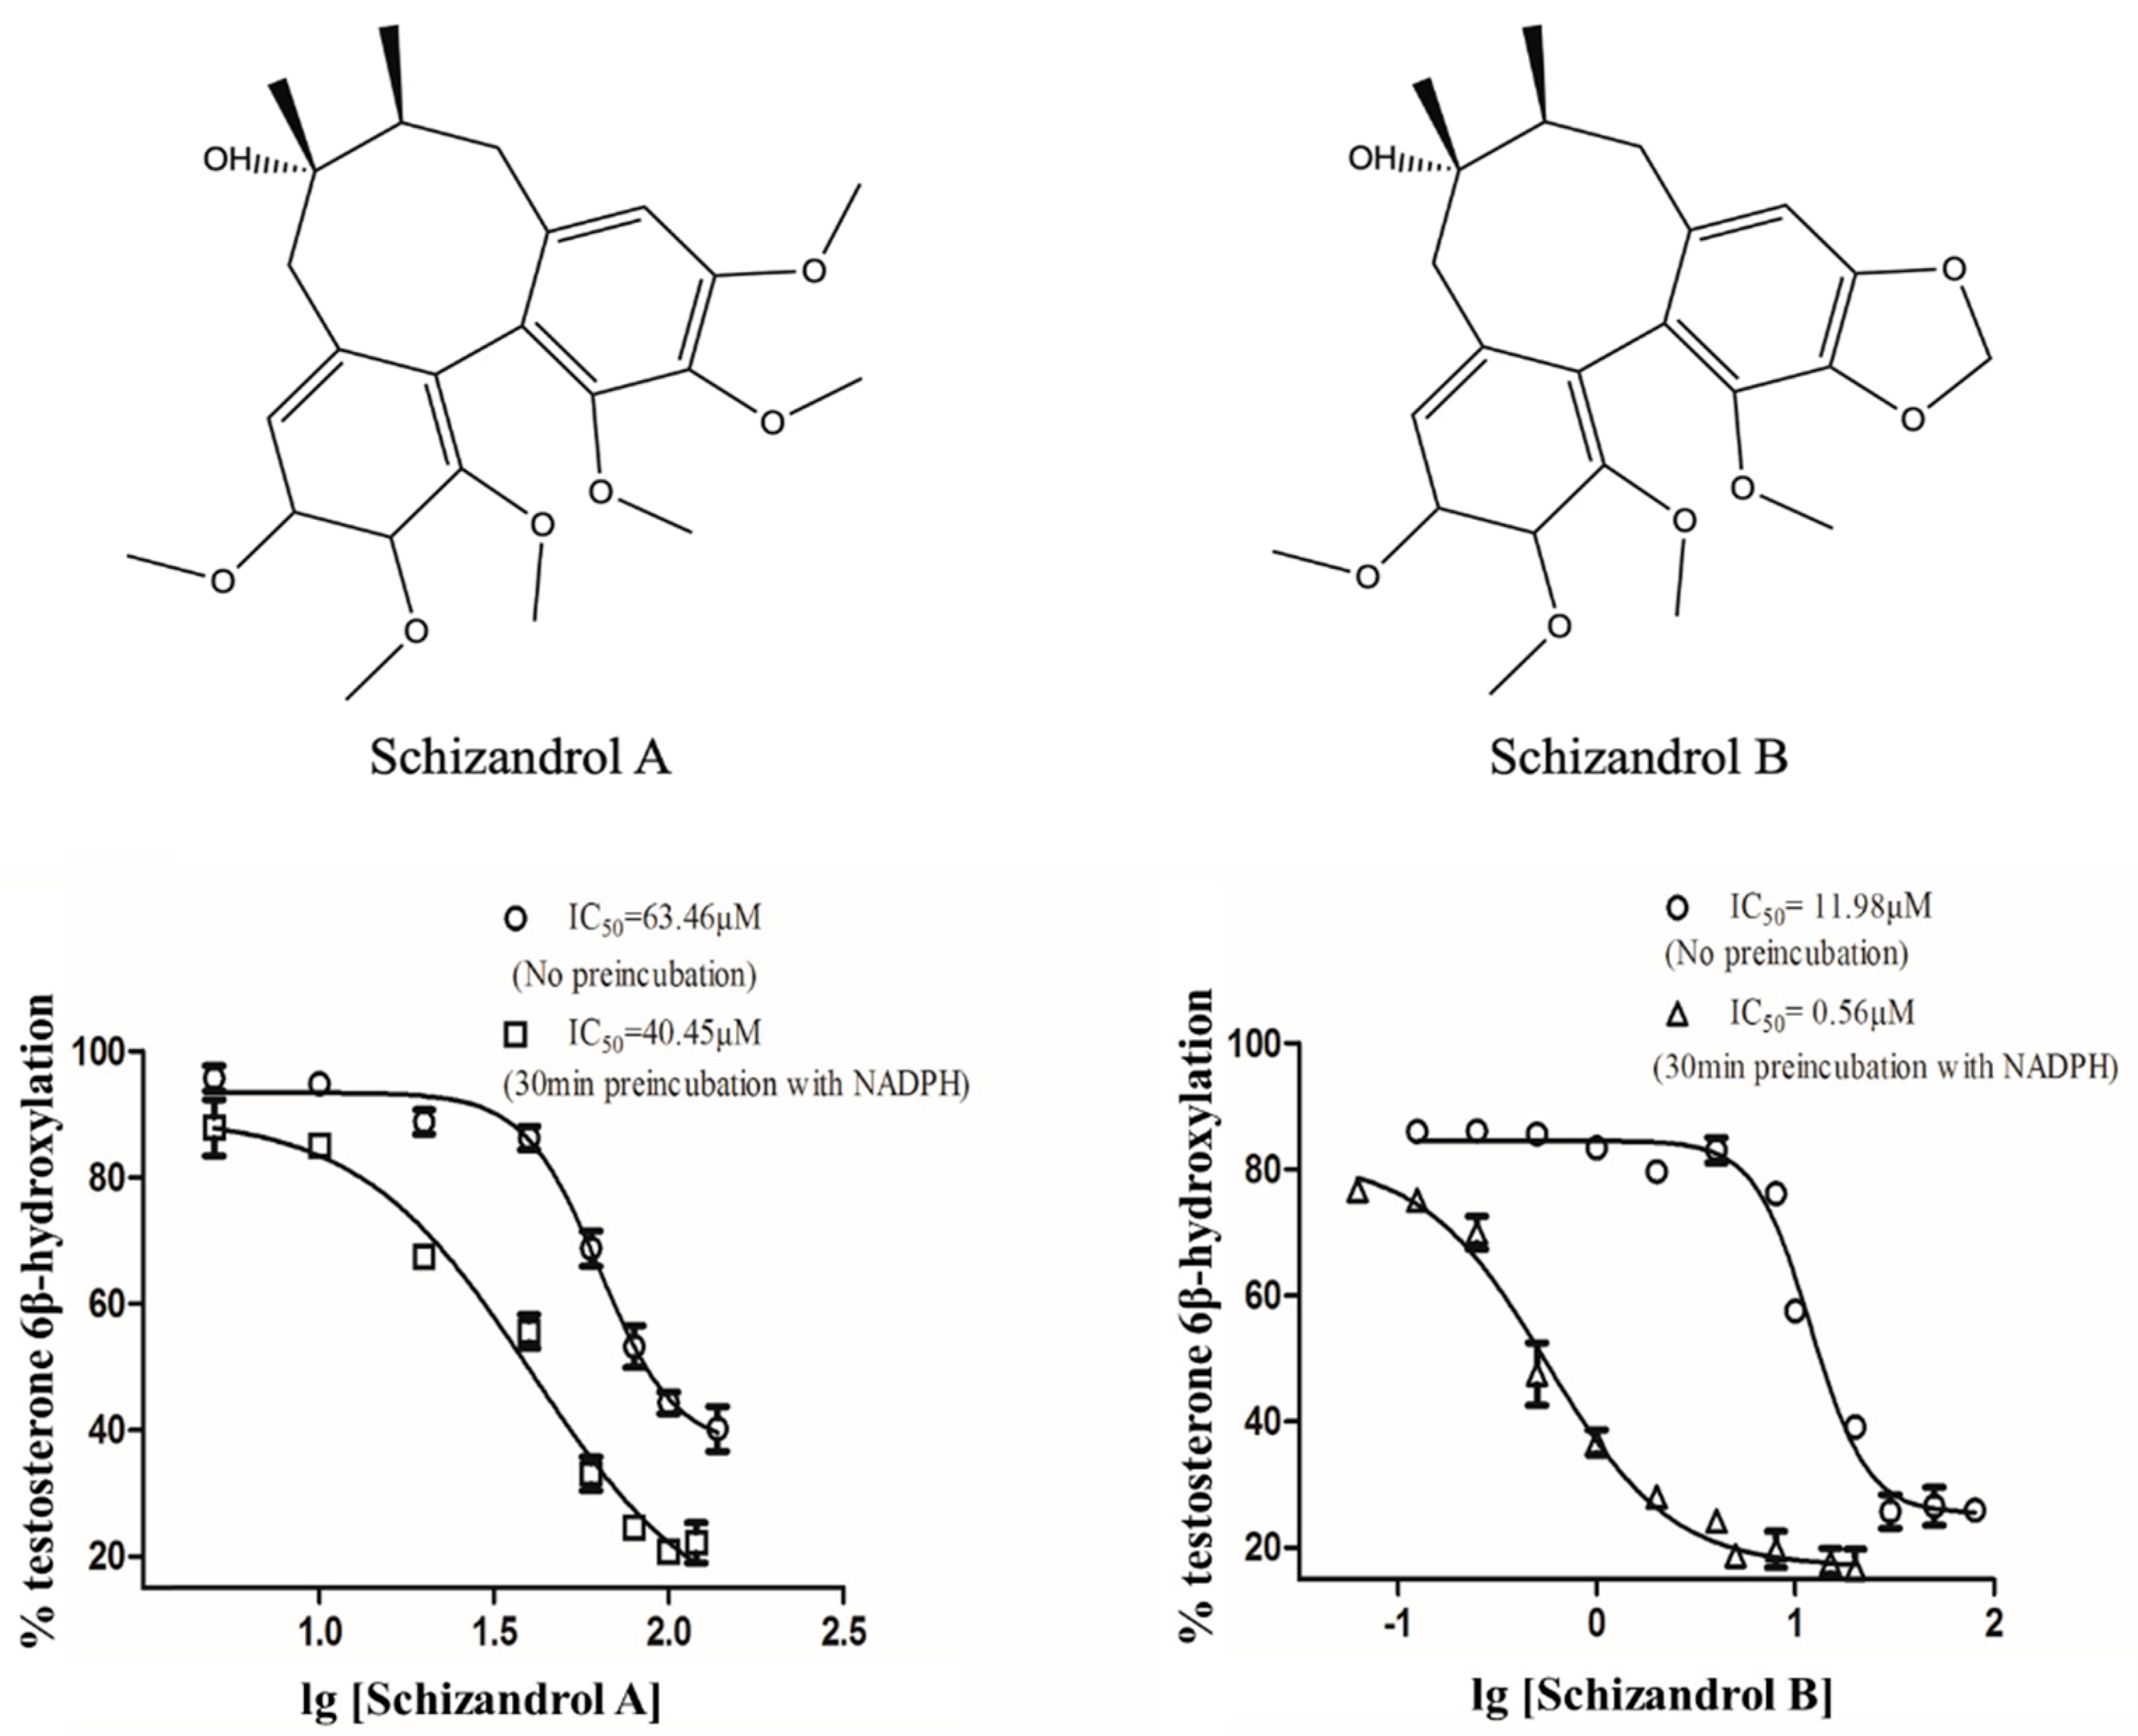
2.1. IC50 Shift
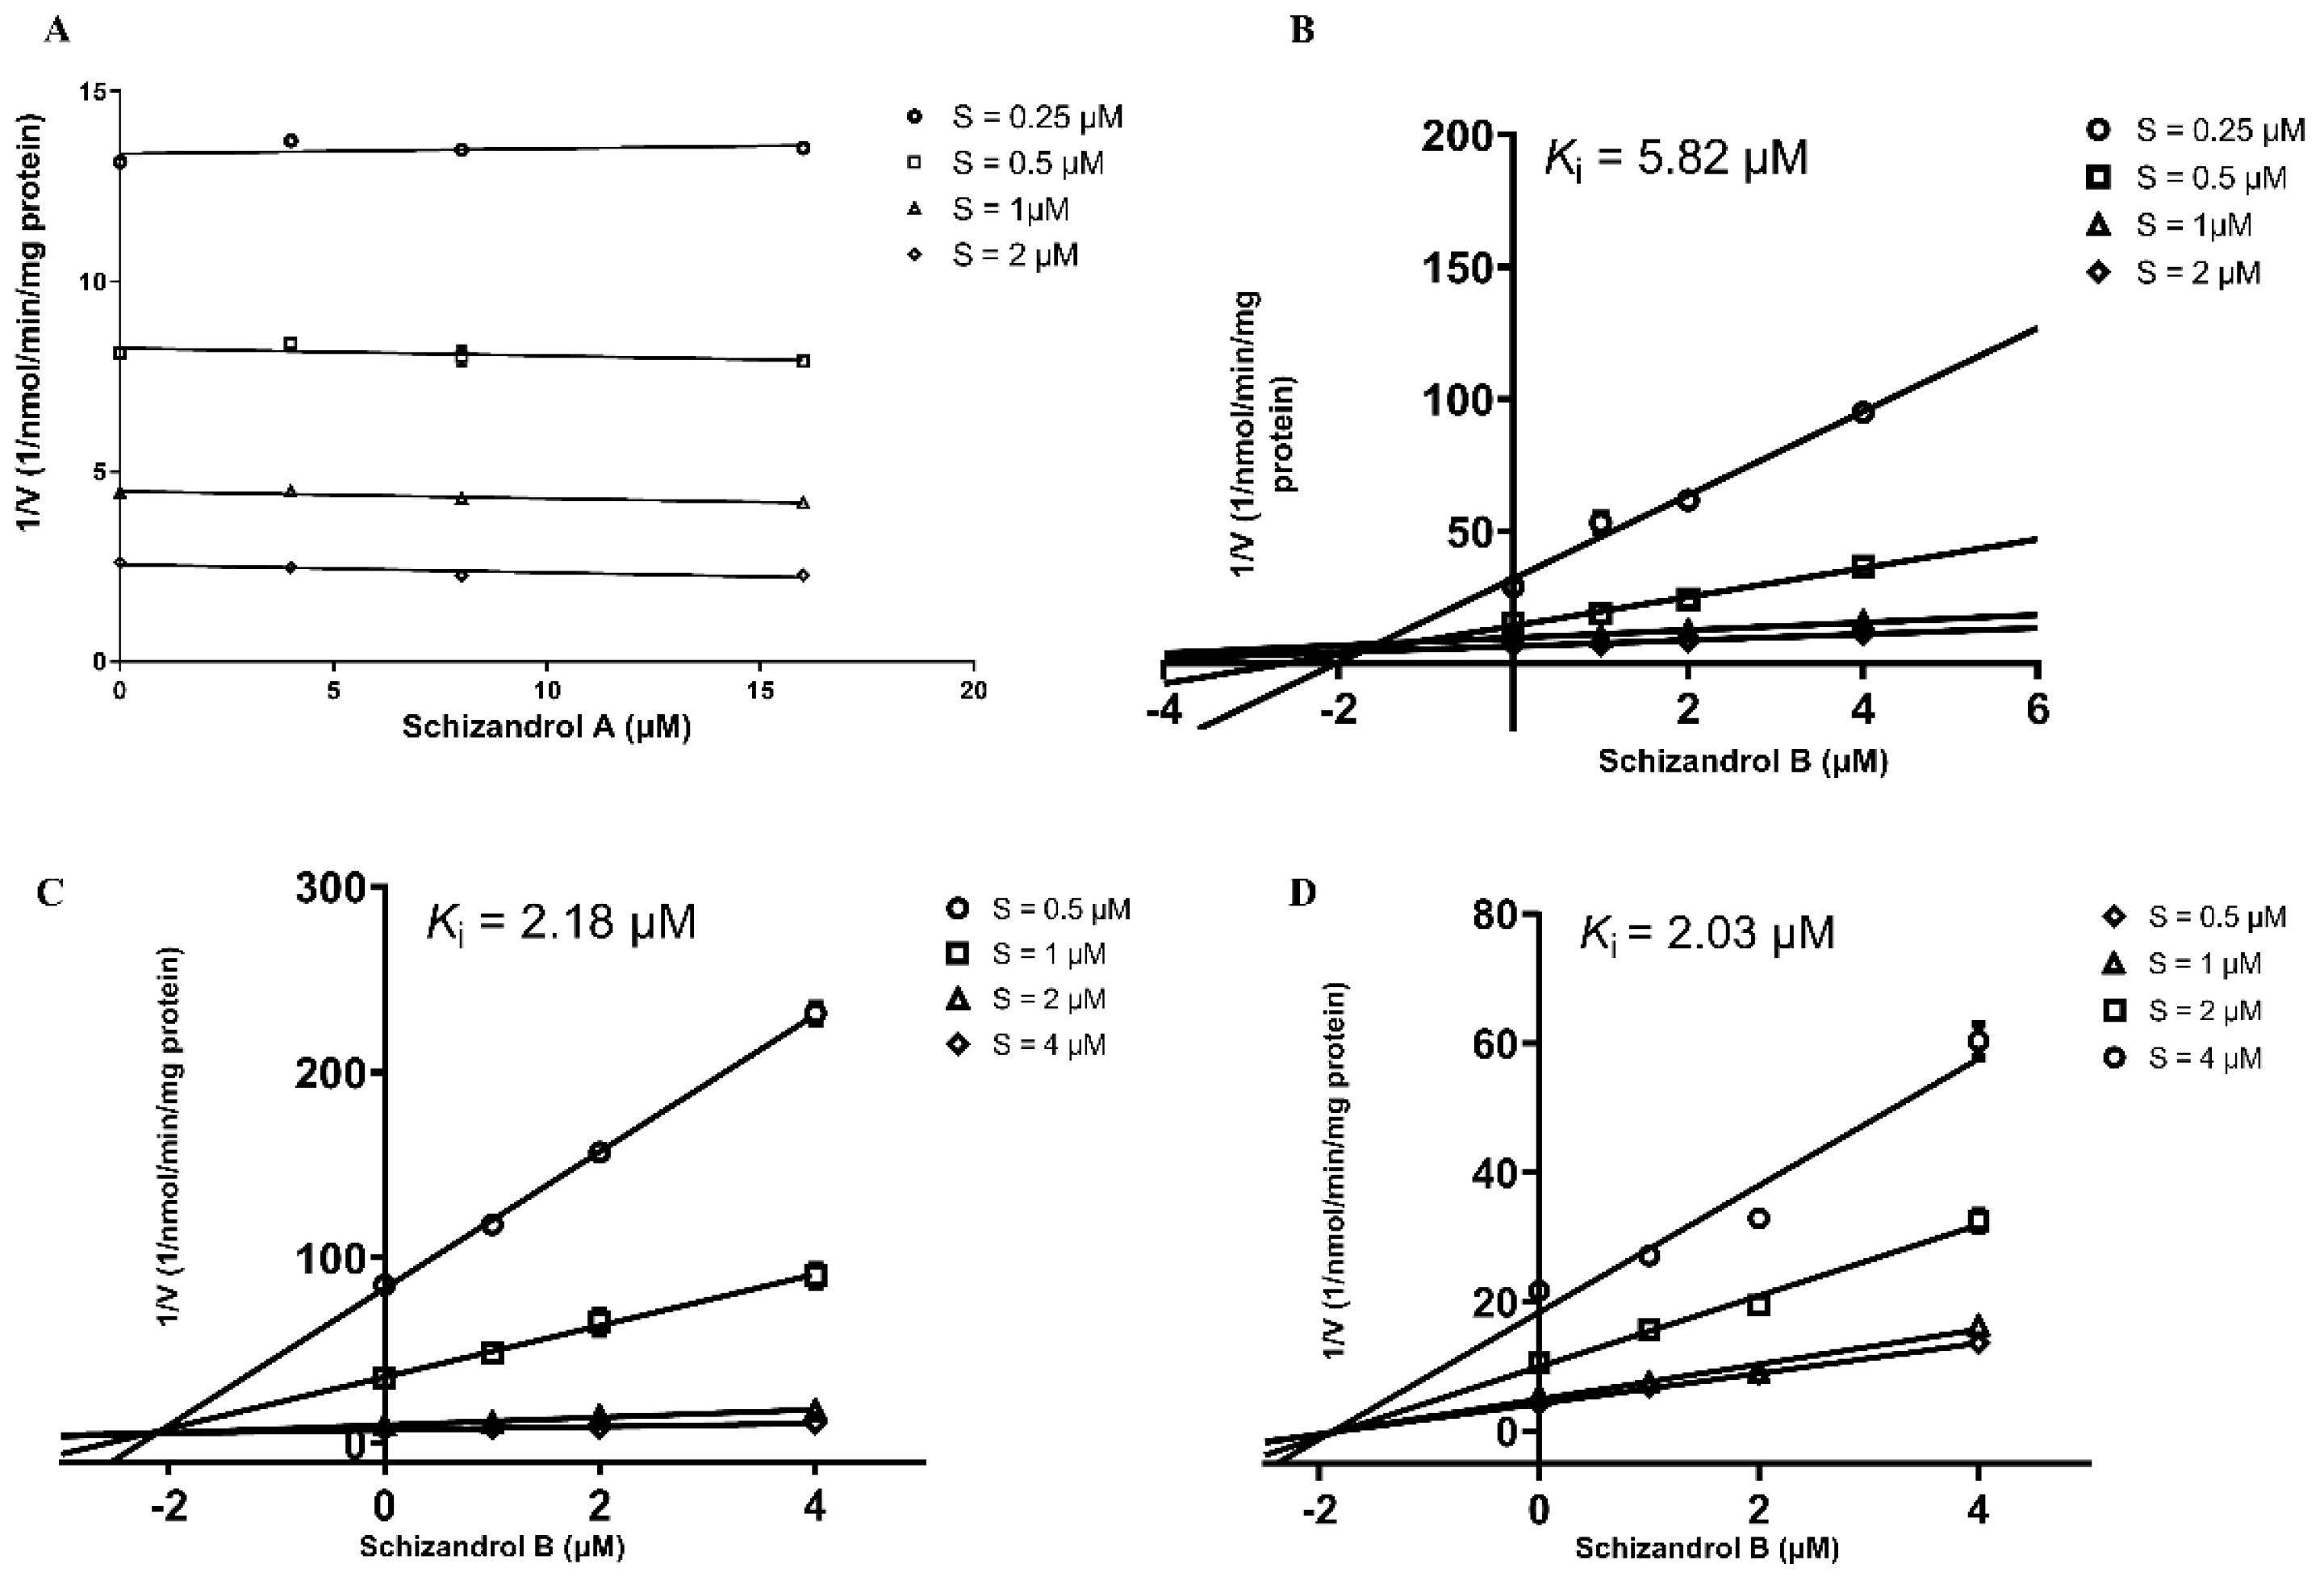
2.2. RI Assay
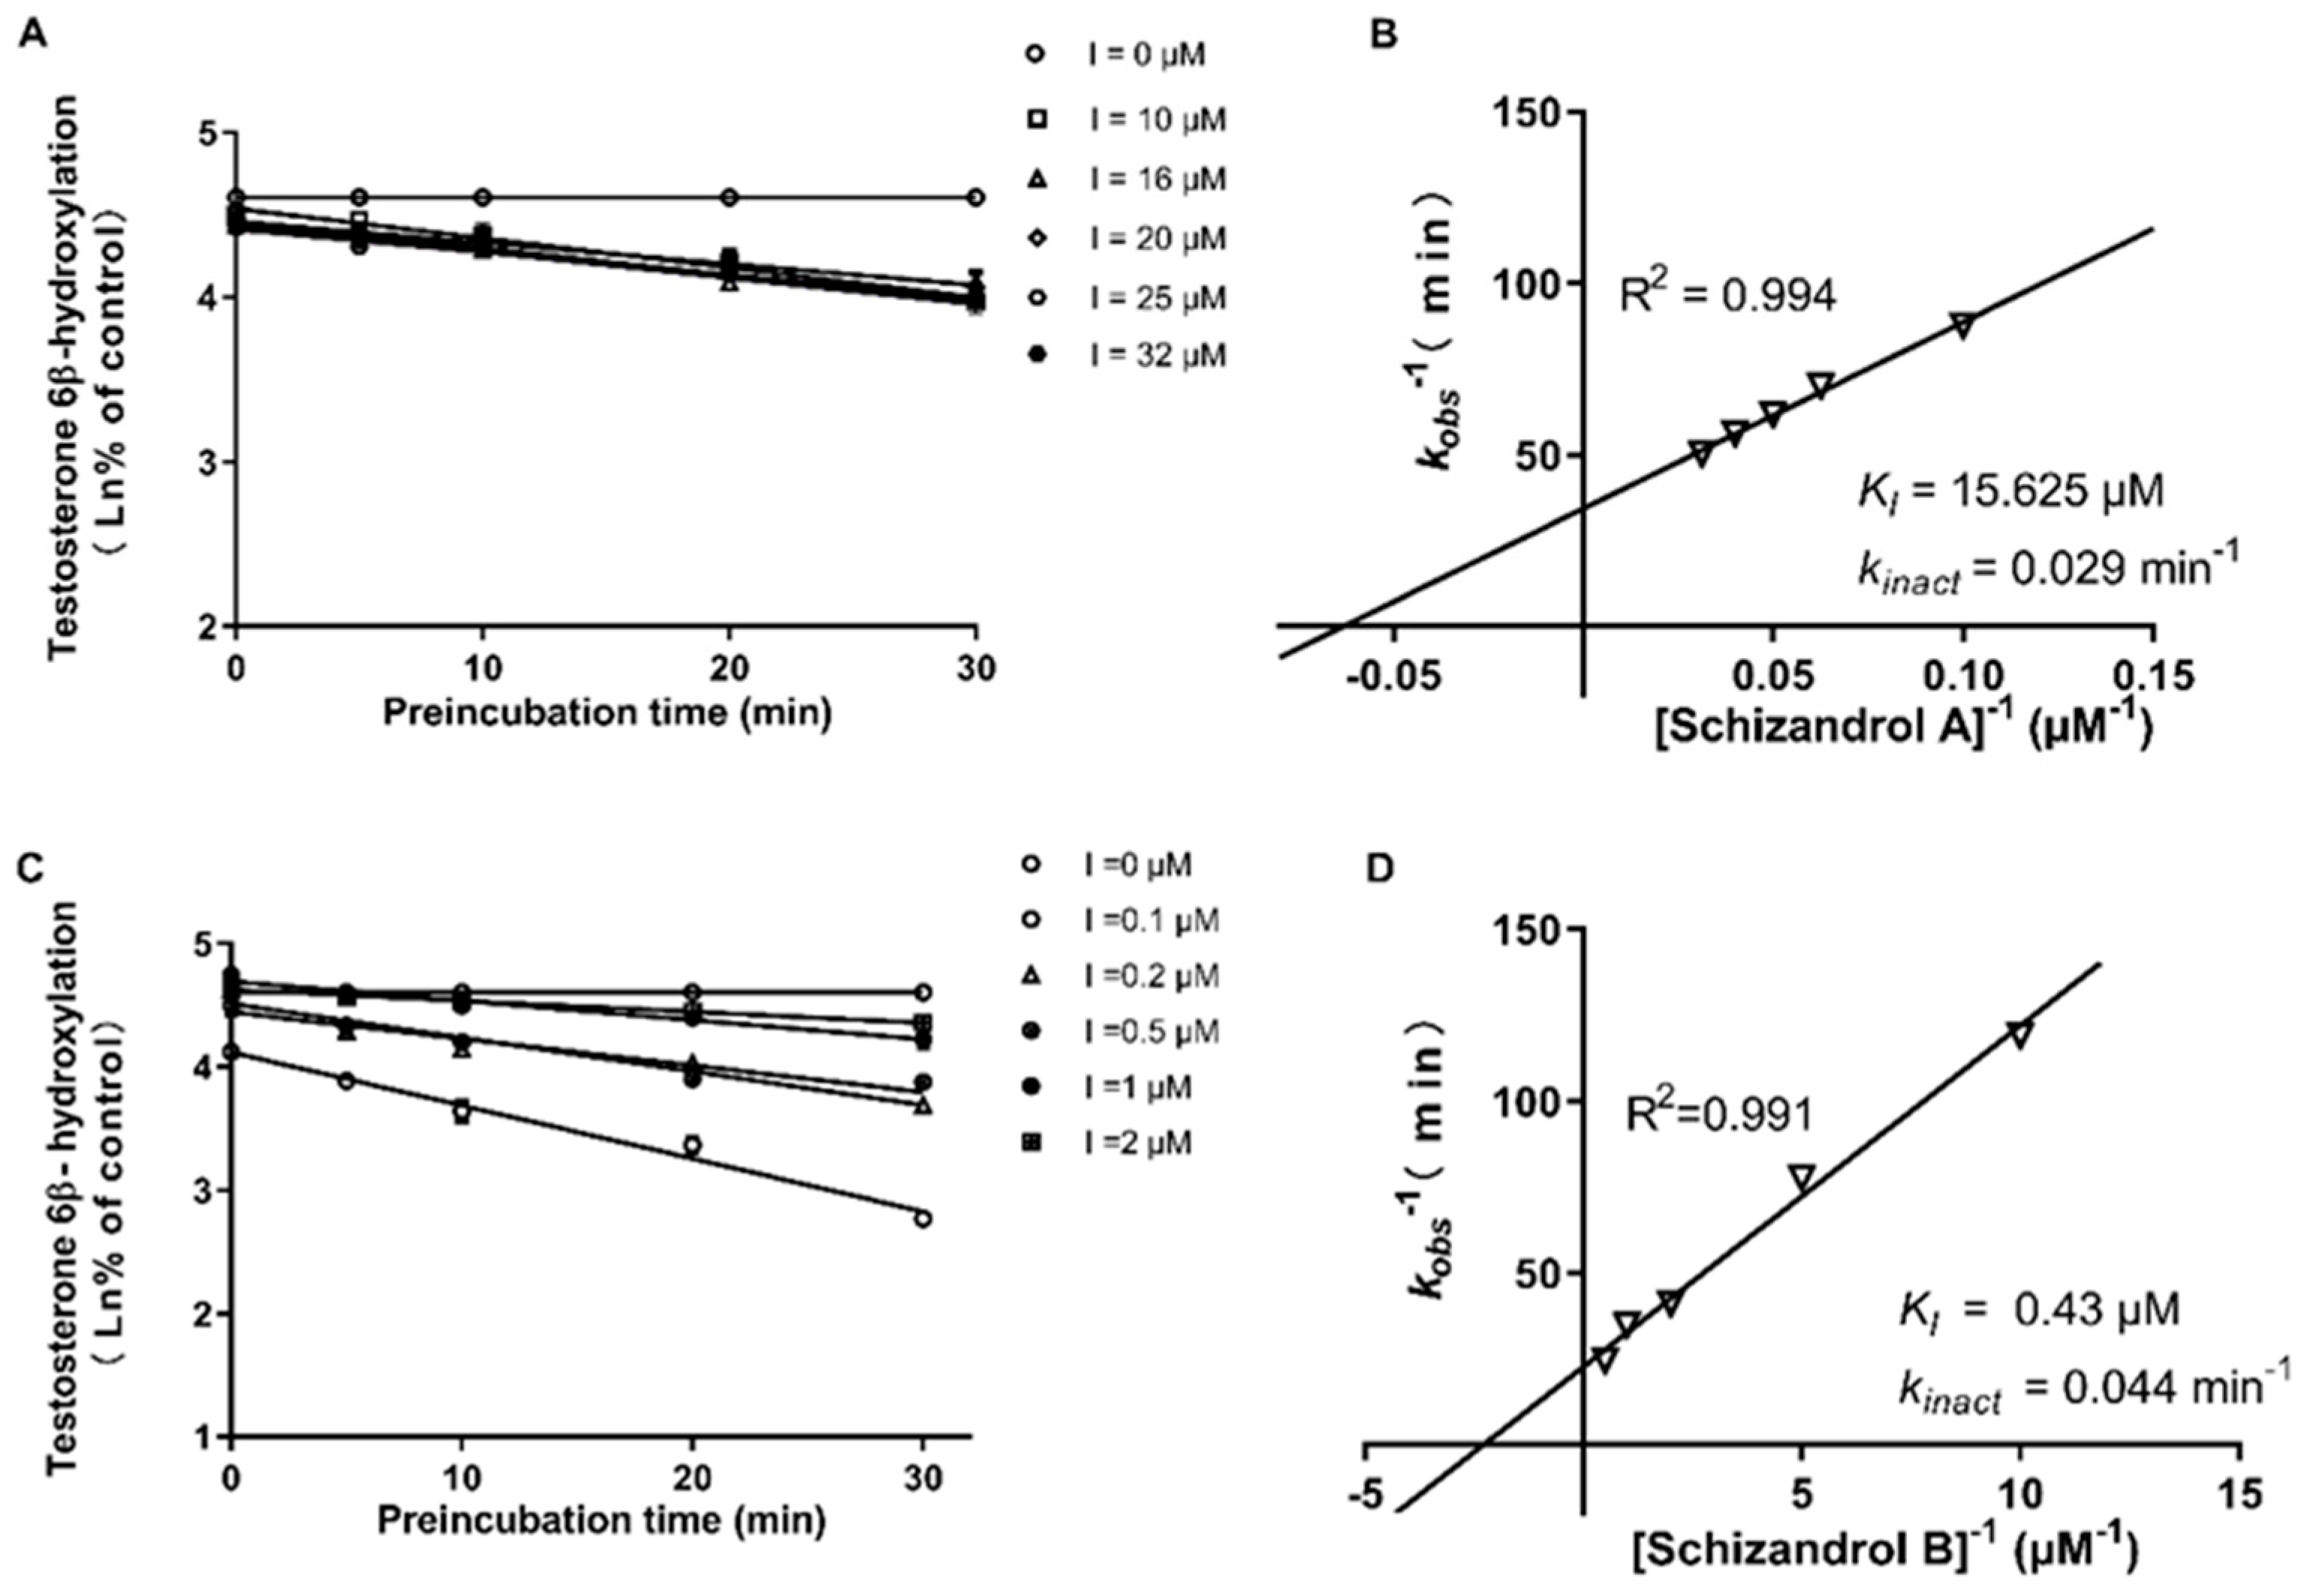
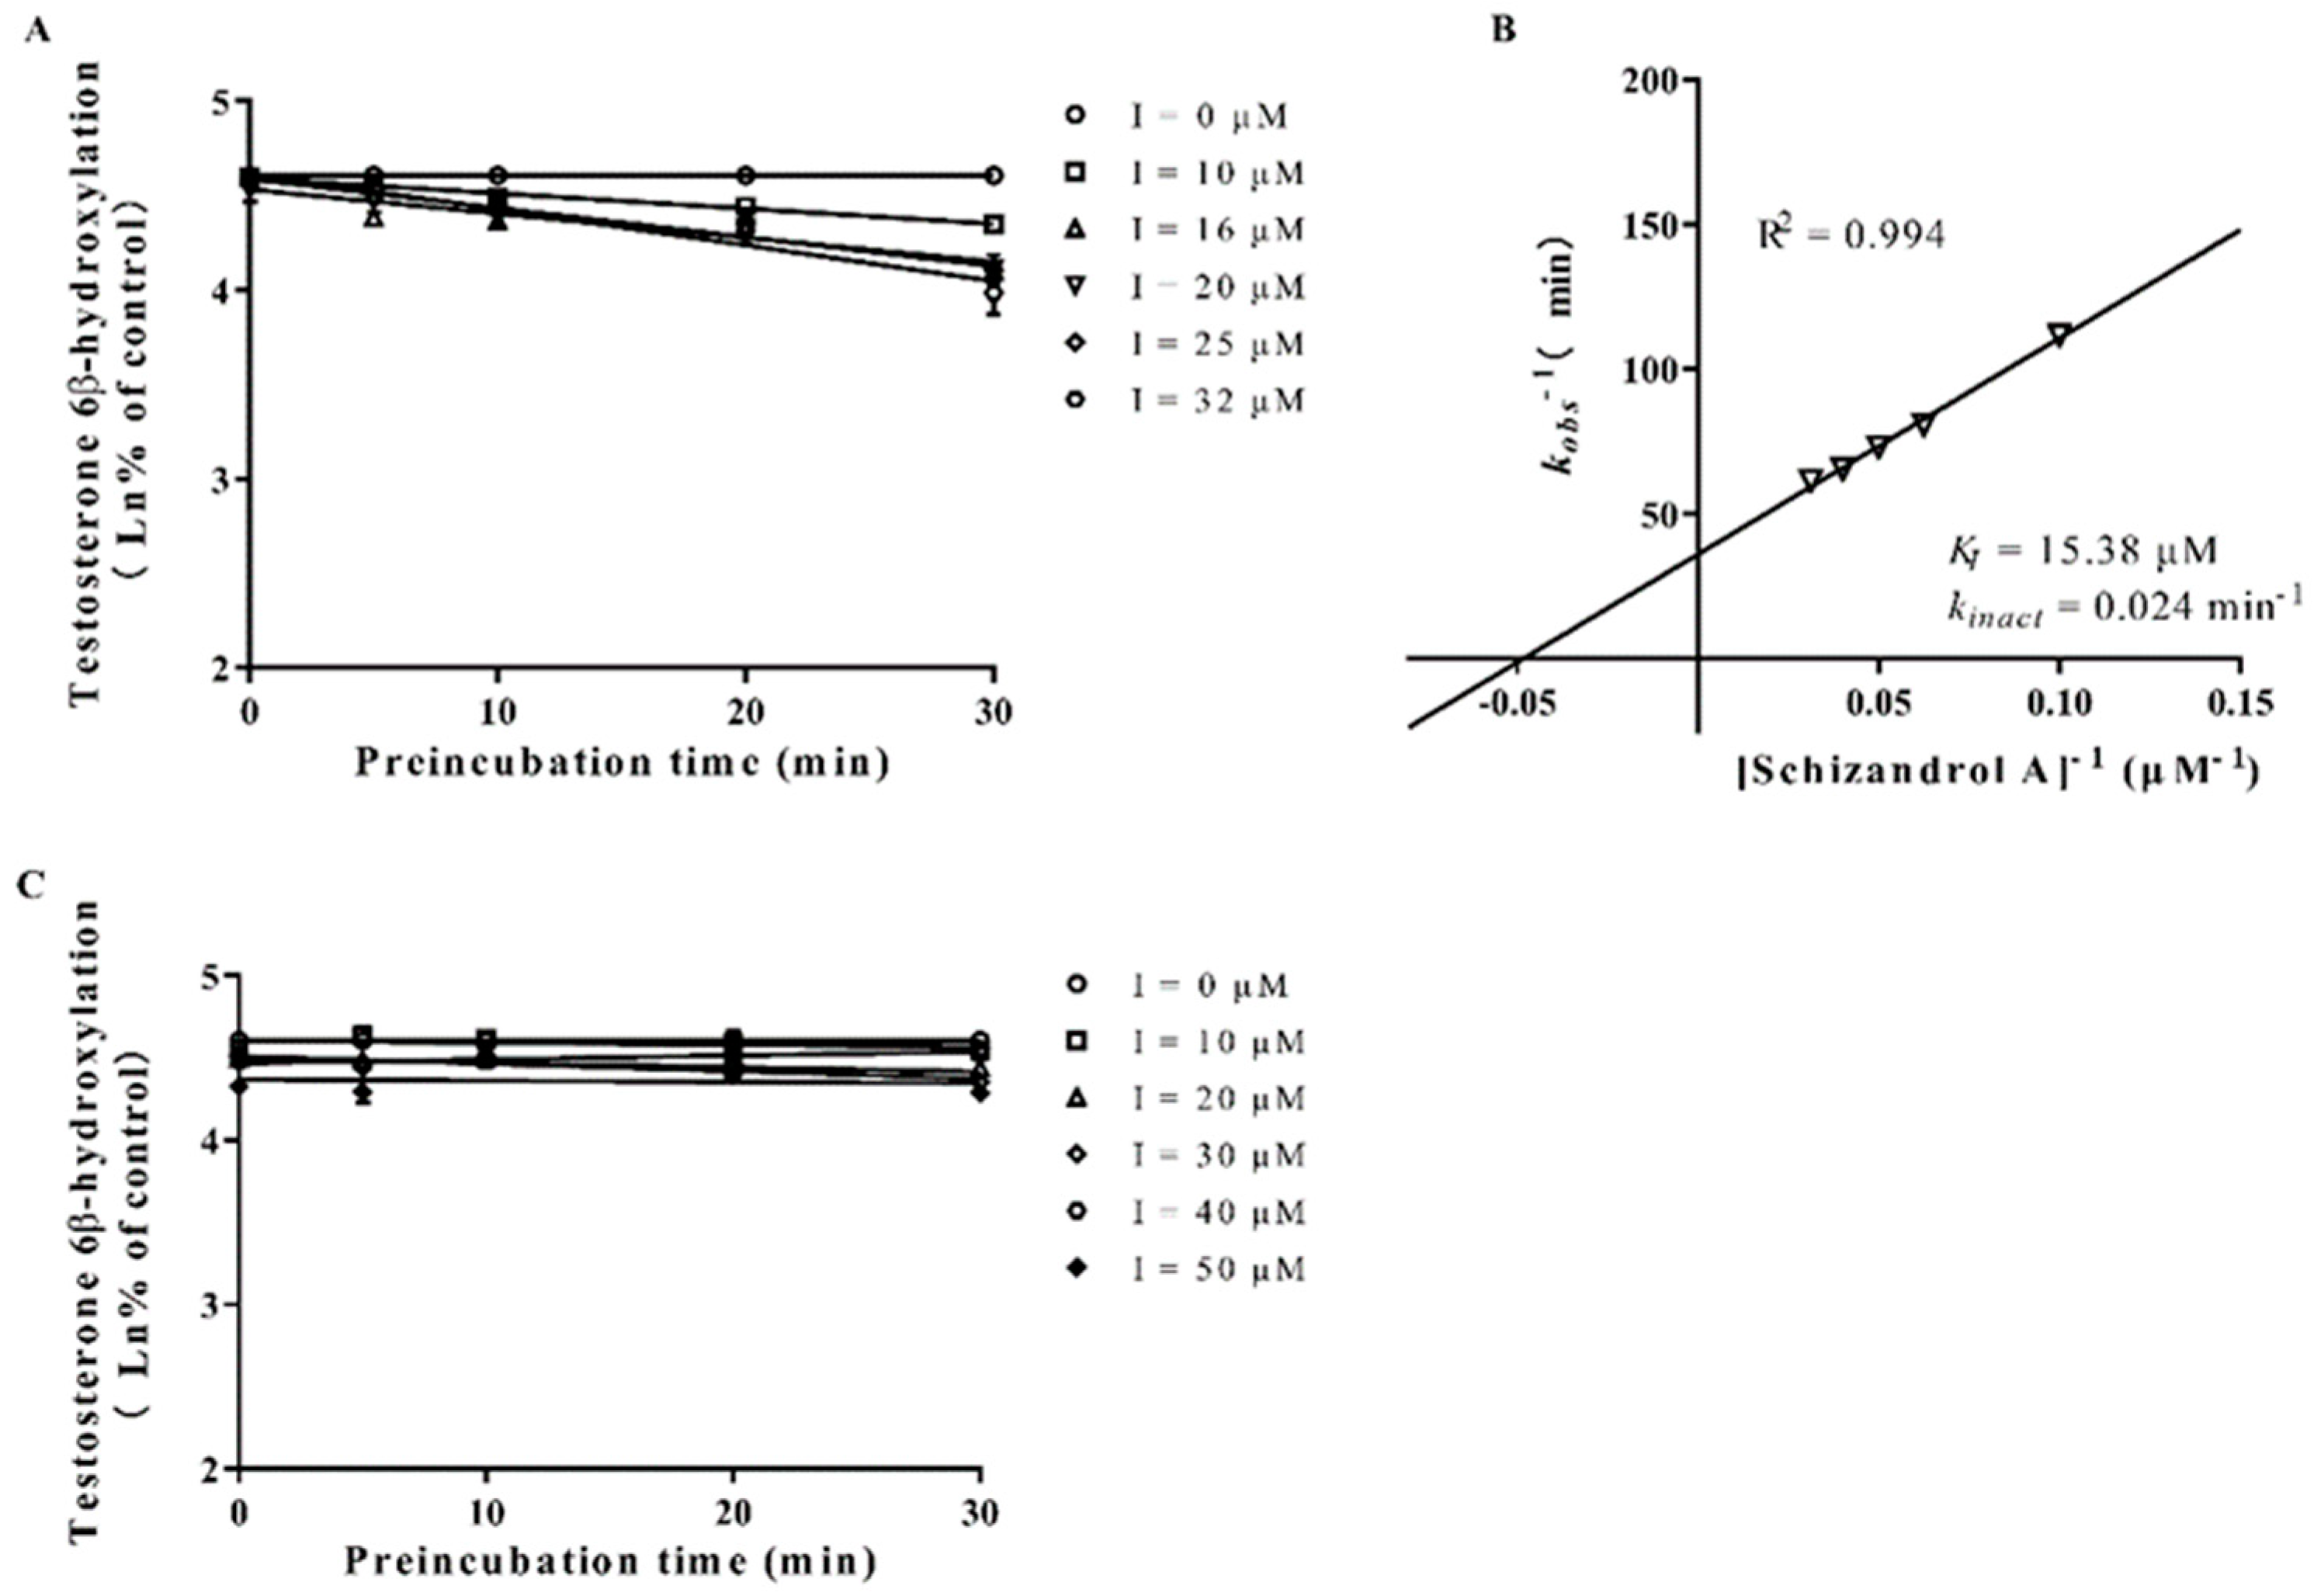
2.3. TDI Assay
2.4. Model Establishment and Validation
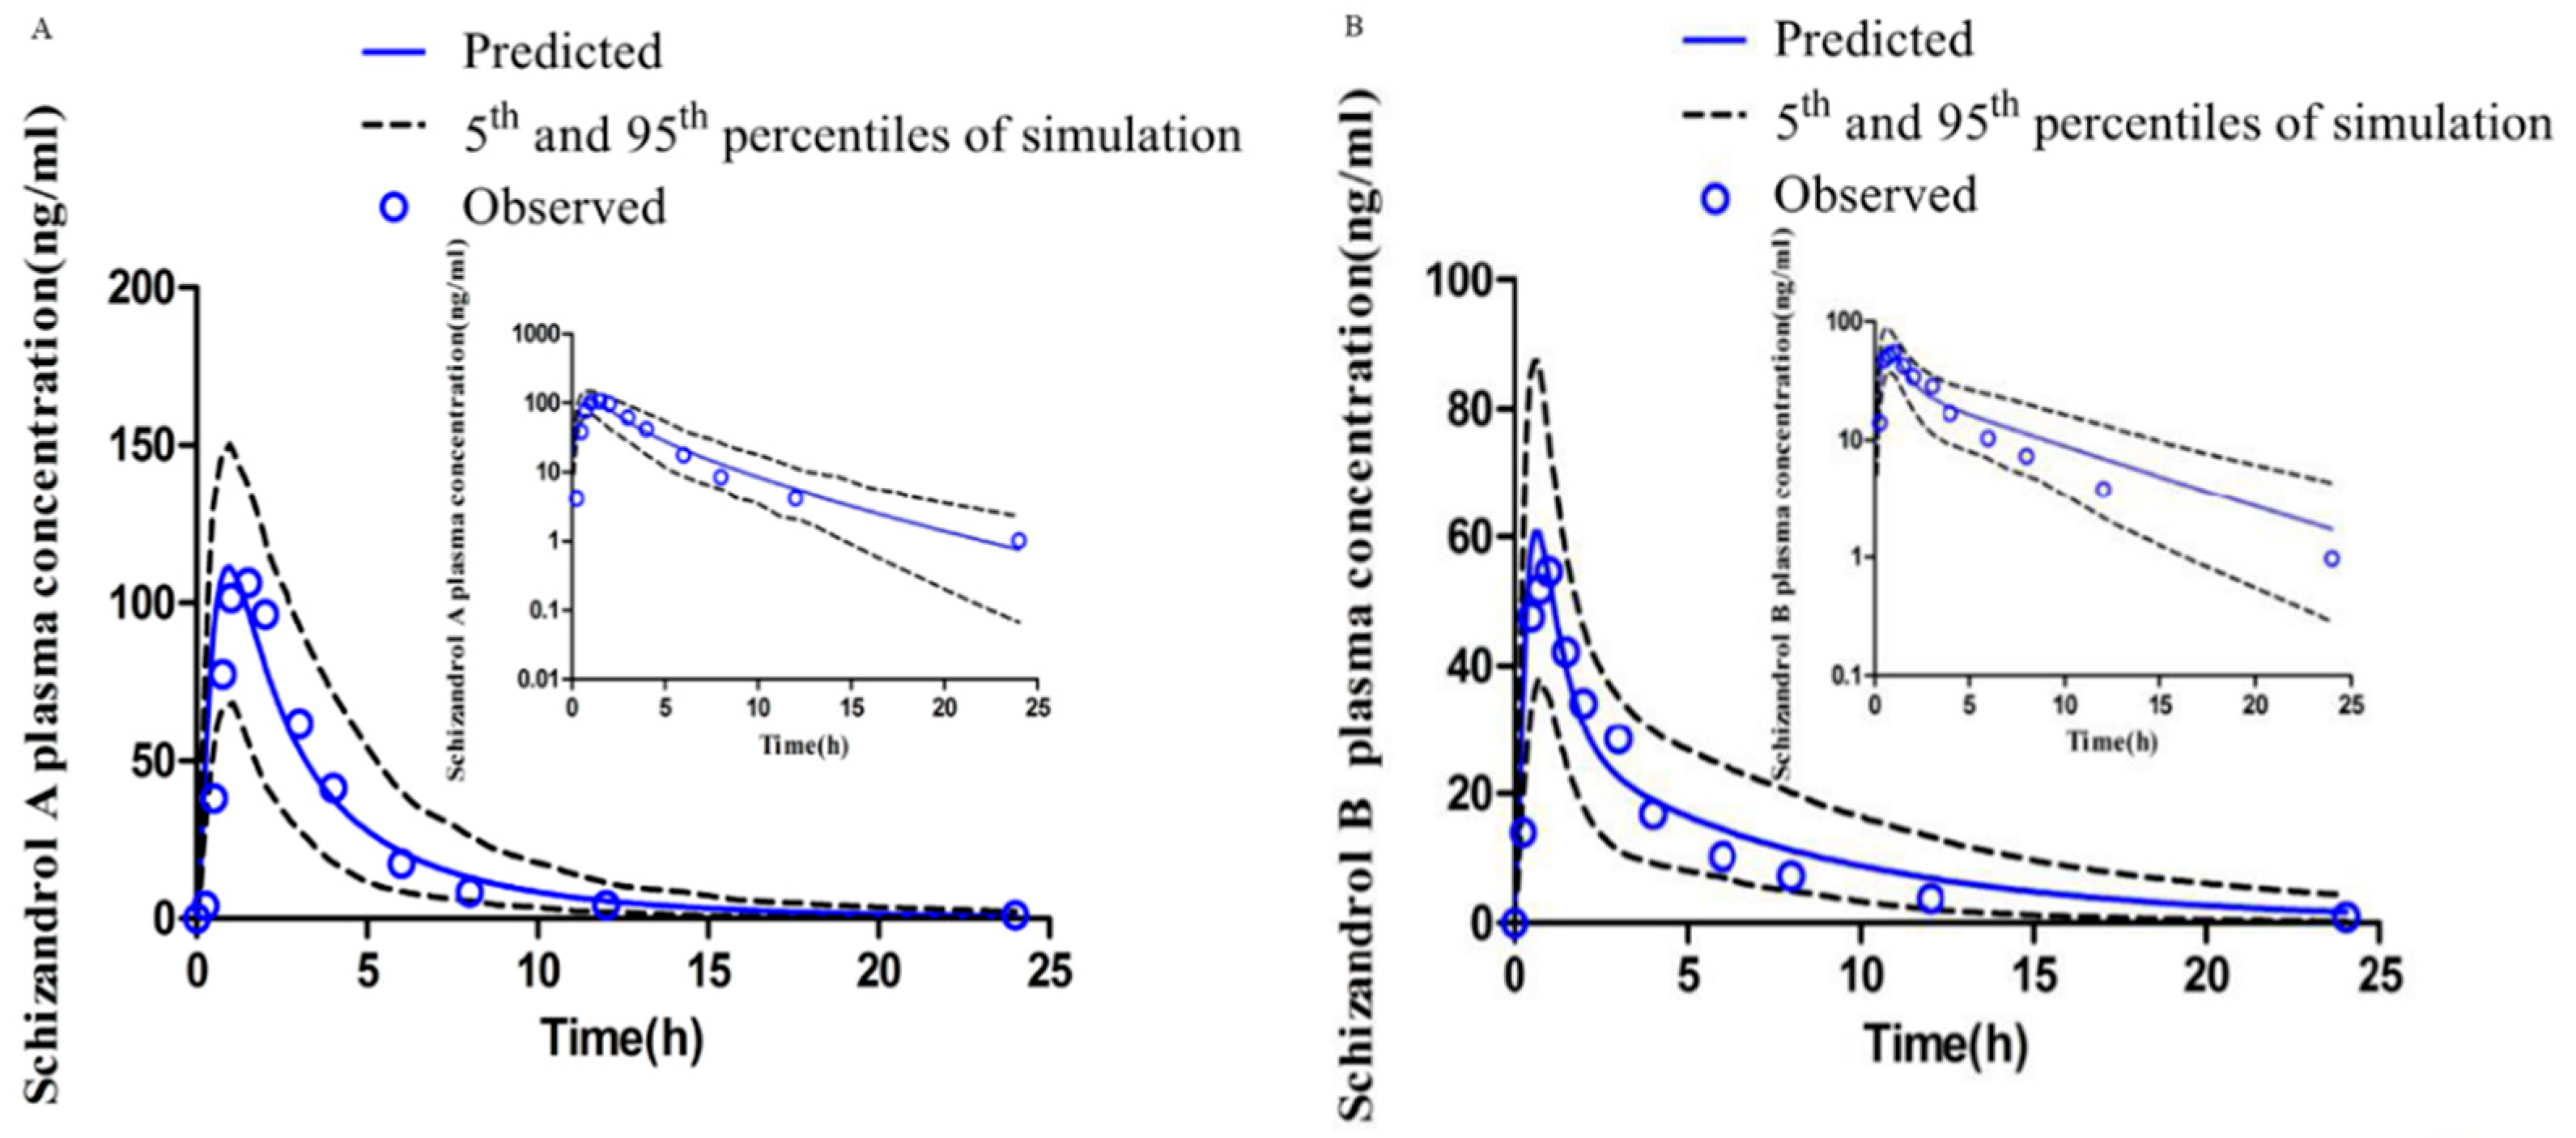
2.4.1. PBPK Models for SZA and SZB
2.4.2. DDI Simulation Modeling
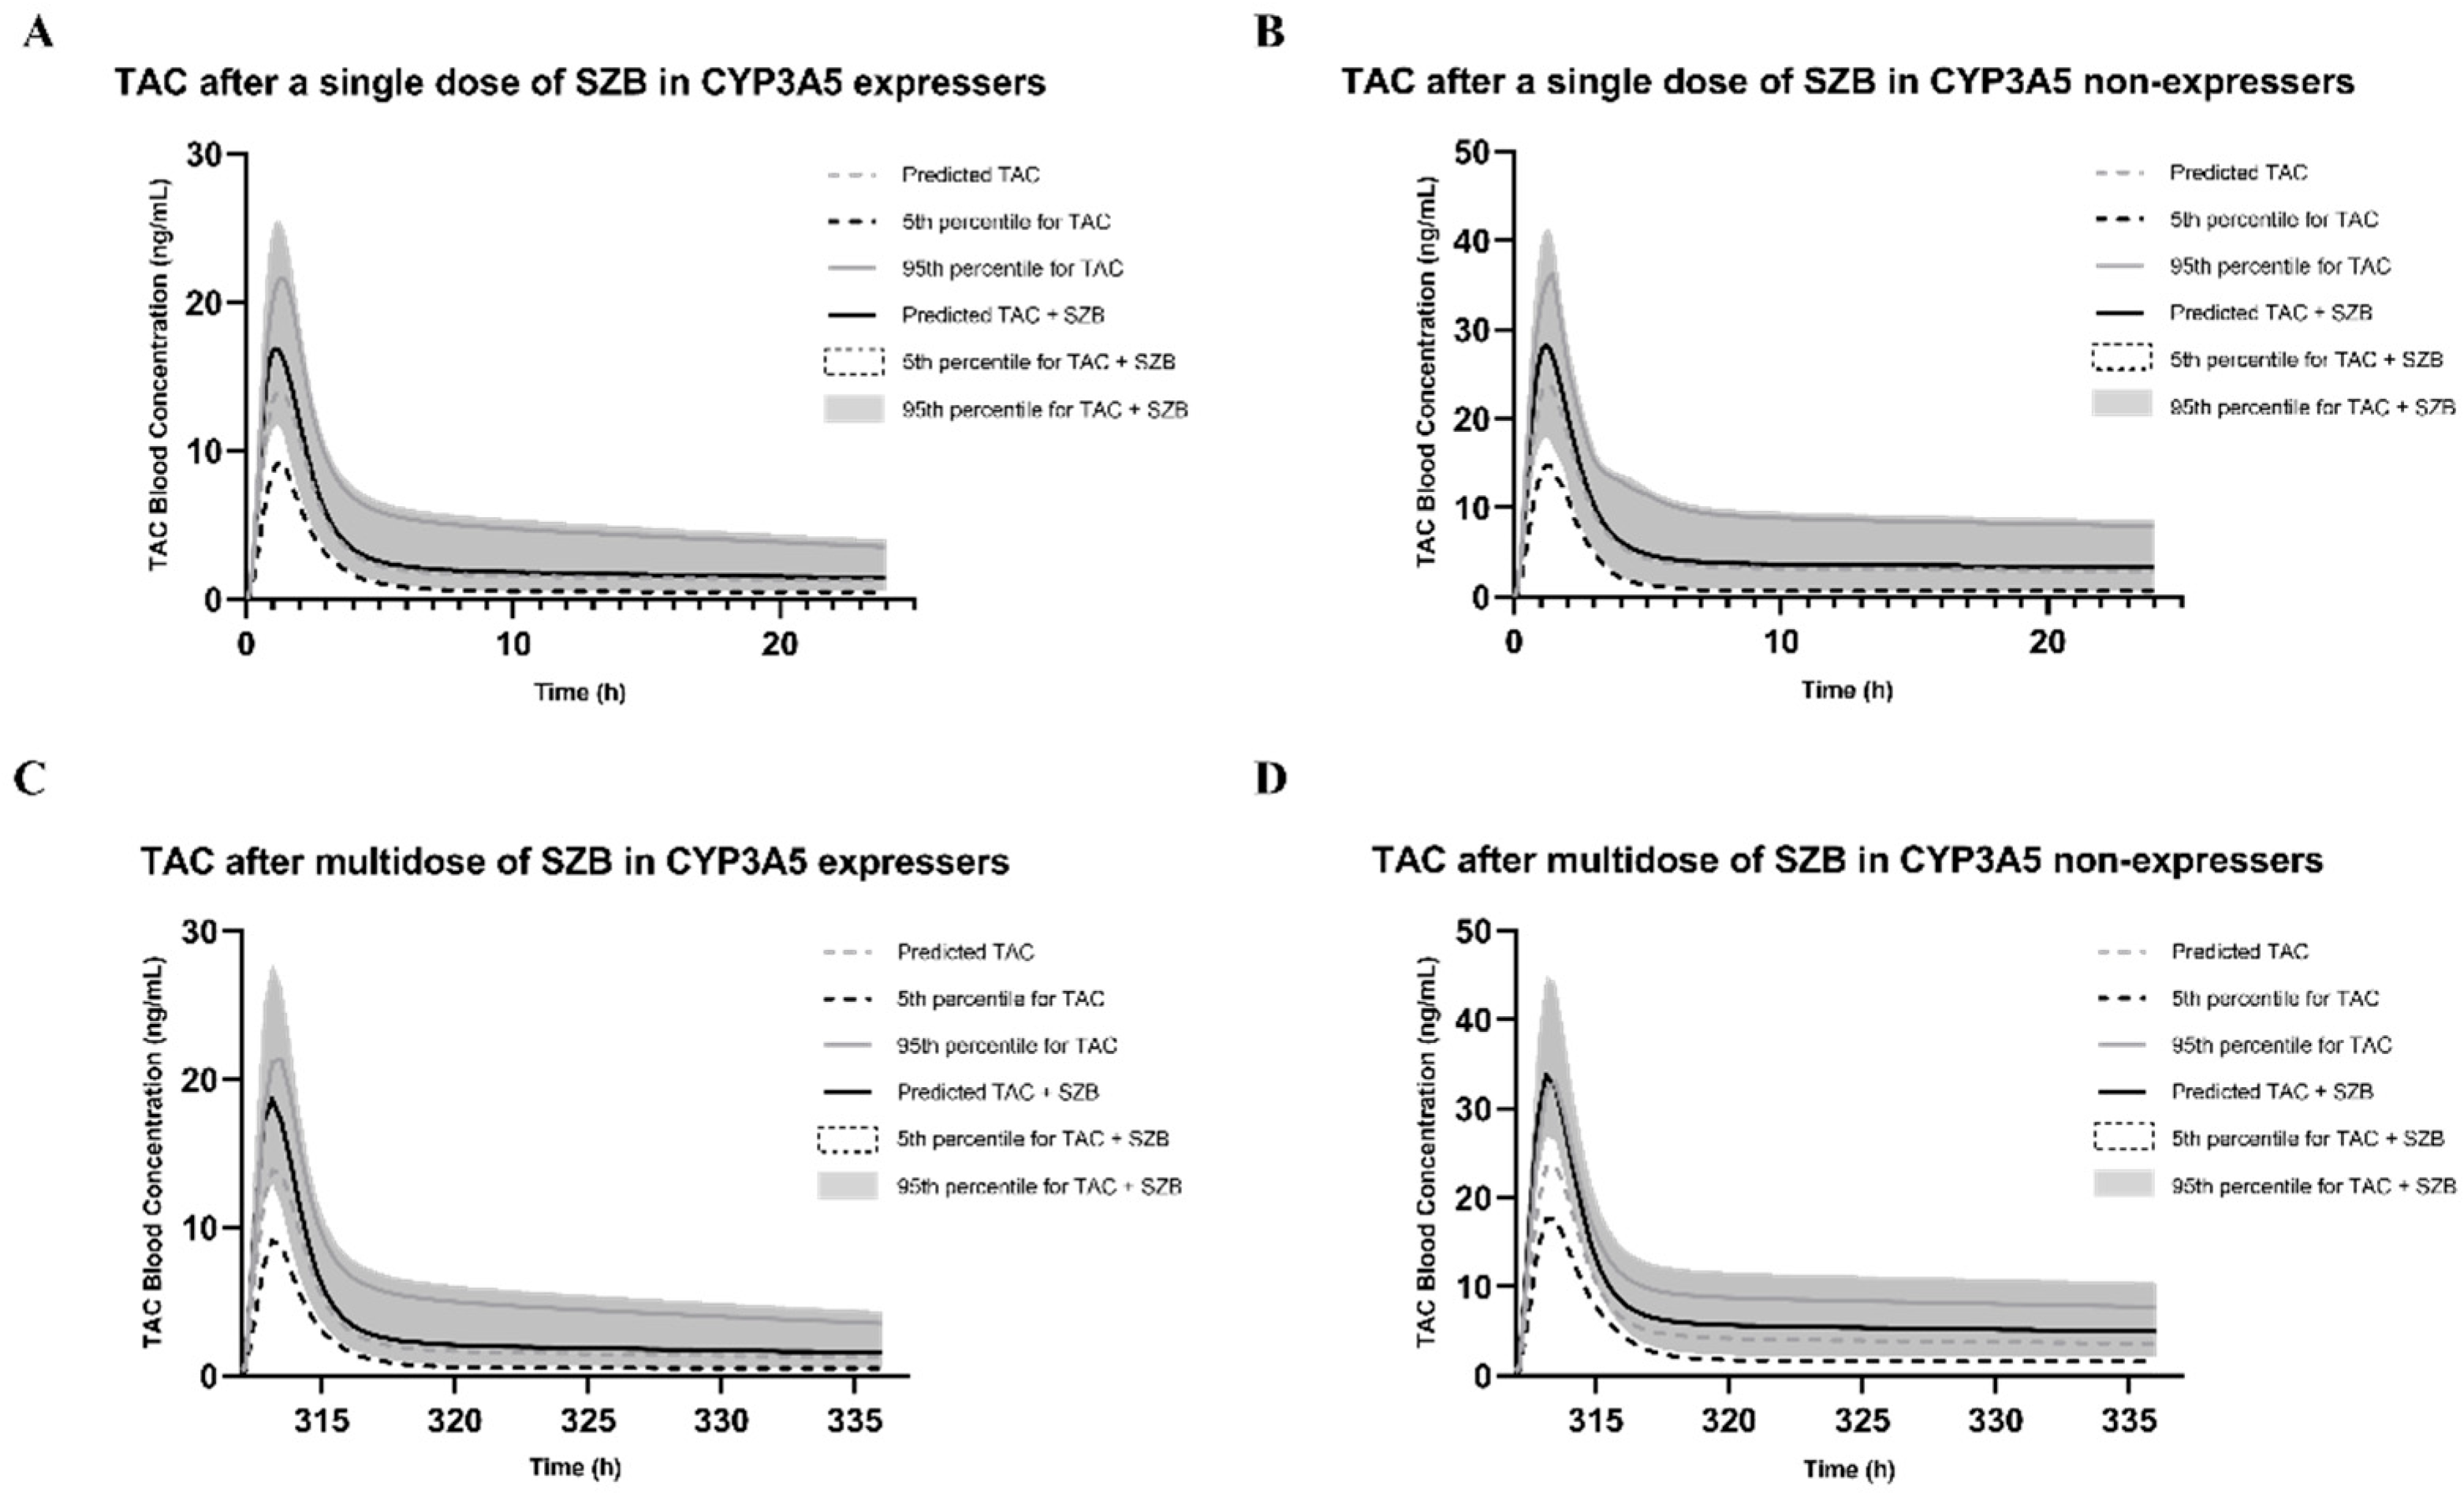
2.4.3. DDI Prediction in CYP3A5 Expressers
2.4.4. DDI Prediction in CYP3A5 Non-Expressers
3. Discussion
4. Materials and Methods
4.1. Chemicals and Reagents
4.2. Analytical Instruments
4.3. CYP450 Enzyme-Inhibition Assay Protocols
4.3.1. IC50 Shift Assay
4.3.2. Reversible Inhibition (RI) Assay
4.3.3. Time-Dependent Inhibition (TDI) Assay
4.4. Data Analysis
4.4.1. IC50 Values and Shift
4.4.2. Ki Value
4.4.3. KI, kinact and kobs Values
4.5. Model Development
5. Conclusions
Supplementary Materials
Author Contributions
Funding
Institutional Review Board Statement
Informed Consent Statement
Data Availability Statement
Acknowledgments
Conflicts of Interest
Abbreviations
| Absorption, distribution, metabolism and excretion | ADME |
| Area under the curve AUC ratio | AUC AUCR |
| Clinical Pharmacogenetics Implementation Consortium | CPIC |
| Cytochrome P450 | CYP450 |
| Drug–drug interaction | DDI |
| Fold error | FE |
| High-performance liquid chromatography | HPLC |
| Human-liver microsome 50% inhibitory concentration | HLM IC50 |
| Reversible inhibition constant | Ki |
| Observed inactivation rate of the affected enzyme | kobs |
| Maximum inactivation rate constant | kinact |
| Inhibitor concentration causing half-maximal inactivation | KI |
| Mass spectrometry | MS |
| Nicotinamide adenine dinucleotide phosphate | NADPH |
| Physiologically based pharmacokinetic | PBPK |
| Area under the curve ratio | AUCR |
| Reversible inhibition | RI |
| Schisandrin A | SIA |
| Schisantherin A | STA |
| Schizandrol A | SZA |
| Schizandrol B | SZB |
| Tacrolimus | FK-506 |
| Time-dependent inhibition | TDI |
| Traditional Chinese medicine | TCM |
| Wuzhi capsule | WZC |
References
- Prescott, L.F. Pharmacokinetic Drug Interactions. Lancet 1969, 294, 1239–1243. [Google Scholar] [CrossRef]
- Gonschior, A.; Christians, U.; Braun, F.; Winkler, M.; Linck, A.; Baumann, J.; Sewing, K. Measurement of blood concentrations of FK506 (tacrolimus) and its metabolites in seven liver graft patients after the first dose by h.p.l.c.-MS and microparticle enzyme immunoassay (MEIA). Br. J. Clin. Pharmacol. 1994, 38, 567–571. [Google Scholar] [CrossRef] [PubMed] [Green Version]
- Riley, R.J.; Wilson, C.E. Cytochrome P450 time-dependent inhibition and induction: Advances in assays, risk analysis and modelling. Expert Opin. Drug Metab. Toxicol. 2015, 11, 557–572. [Google Scholar] [CrossRef] [PubMed]
- Roslyn Thelingwani, C.M. Evaluation of Herbal Medicines: Value Addition to Traditional Medicines Through Metabolism, Pharmacokinetic and Safety Studies. Curr. Drug Metab. 2014, 15, 942–952. [Google Scholar] [CrossRef] [PubMed]
- Ren, J.-L.; Zhang, A.-H.; Wang, X.-J. Traditional Chinese medicine for COVID-19 treatment. Pharmacol. Res. 2020, 155, 104743. [Google Scholar] [CrossRef]
- Ashour, M.; Youssef, F.; Gad, H.; Wink, M. Inhibition of cytochrome P450 (CYP3A4) activity by extracts from 57 plants used in traditional chinese medicine (TCM). Pharmacogn. Mag. 2017, 13, 300–308. [Google Scholar]
- Ai, Y.; Li, W.; Xin, H. Research Progress in Schisandra Chinensis Used in the Treatment of Drug-induced Liver Injury. China Pharm. 2018, 21, 477–480. (In Chinese) [Google Scholar]
- Lohse, A.W.; Chazouilleres, O.; Dalekos, G.; Drenth, J.; Heneghan, M.; Hofer, H.; Lammert, F.; Lenzi, M. EASL Clinical Practice Guidelines: Autoimmune hepatitis. J. Hepatol. 2015, 63, 971–1004. [Google Scholar]
- European Association for the Study of the Liver. Electronic address, e. e. e. EASL Clinical Practice Guidelines: Liver transplantation. J. Hepatol. 2016, 64, 433–485. [Google Scholar] [CrossRef]
- Newsome, P.N.; Allison, M.E.; Andrews, P.A.; Auzinger, G.; Day, C.P.; Ferguson, J.W.; Henriksen, P.A.; Hubscher, S.G.; Manley, H.; Mckiernan, P.J.; et al. Guidelines for liver transplantation for patients with non-alcoholic steatohepatitis. Gut 2012, 61, 484–500. [Google Scholar] [CrossRef] [Green Version]
- Lampen, A.; Christians, U.W.E.; Guengerich, F.P.; Watkins, P.B.; Kolars, J.C.; Bader, A.; Gonschior, A.K.; Dralle, H.; Hackbarth, I.; Sewing, K.F. Metabolism of The Immunosuppressant Tacrolimus in the Small Intestine: Cytochrome P450, Drug Interactions and Interindividual Variability. Drug Metab. Dispos. 1995, 23, 1315–1324. [Google Scholar] [PubMed]
- Chen, T.Q.; Lin, M.W.; Lu, J.W. Hyperkalemia induced by tacrolimus combined with Wuzhi-capsule following renal transplantation: One case report. J. Clin. Rehabil. Tissue Eng. Res. 2012, 15, 8341–8343. (In Chinese) [Google Scholar]
- Xin, H.W.; Wu, X.; He, Y.; Yu, A.; Xiong, L.; Xiong, Y. Evaluation the effects and cost on the application of tacrolimus combination with Wuzhi—capsule in renal transplanted recipients. Chin. J. Clin. Pharmacol. 2011, 27, 295–298. (In Chinese) [Google Scholar]
- Zhang, H.; Bu, F.; Li, L.; Jiao, Z.; Ma, G.; Cai, W.; Zhuang, X.; Lin, H.-S.; Shin, J.-G.; Xiang, X. Prediction of Drug-Drug Interaction between Tacrolimus and Principal Ingredients of Wuzhi Capsule in Chinese Healthy Volunteers Using Physiologically-Based Pharmacokinetic Modelling. Basic Clin. Pharmacol. Toxicol. 2018, 122, 331–340. [Google Scholar] [CrossRef] [Green Version]
- Qin, X.L.; Bi, H.C.; Wang, X.D.; Li, J.L.; Wang, Y.; Xue, X.P.; Chen, X.; Wang, C.X.; Xu, L.J.; Wang, Y.T.; et al. Mechanistic understanding of the different effects of Wuzhi Tablet (Schisandra sphenanthera extract) on the absorption and first-pass intestinal and hepatic metabolism of Tacrolimus (FK506). Int. J. Pharm. 2010, 389, 114–121. [Google Scholar] [CrossRef]
- Qin, X.L.; Chen, X.; Wang, Y.; Xue, X.P.; Wang, Y.; Li, J.L.; Wang, X.D.; Zhong, G.P.; Wang, C.X.; Yang, H.; et al. In Vivo to In Vitro Effects of Six Bioactive Lignans of Wuzhi Tablet (Schisandra Sphenanthera Extract) on the CYP3A/P-glycoprotein–Mediated Absorption and Metabolism of Tacrolimus. Drug Metab. Dispos. 2014, 42, 193–199. [Google Scholar] [CrossRef] [Green Version]
- He, Q.; Bu, F.; Zhang, H.; Wang, Q.; Tang, Z.; Yuan, J.; Lin, H.-S.; Xiang, X. Investigation of the Impact of CYP3A5 Polymorphism on Drug–Drug Interaction between Tacrolimus and Schisantherin A/Schisandrin A Based on Physiologically-Based Pharmacokinetic Modeling. Pharmaceuticals 2021, 14, 198. [Google Scholar] [CrossRef] [PubMed]
- Birdwell, K.A.; Decker, B.; Barbarino, J.M.; Peterson, J.F.; Stein, C.M.; Sadee, W.; Wang, D.; Vinks, A.A.; He, Y.; Swen, J.J.; et al. Clinical Pharmacogenetics Implementation Consortium (CPIC) Guidelines for CYP3A5 Genotype and Tacrolimus Dosing. Clin. Pharmacol. Ther. 2015, 98, 19–24. [Google Scholar] [CrossRef] [Green Version]
- Dai, Y.; Hebert, M.F.; Isoherranen, N.; Davis, C.L.; Marsh, C.; Shen, D.D.; Thummel, K.E. Effect of CYP3A5 polymorphism on tacrolimus metabolic clearance in vitro. Drug Metab. Dispos. 2006, 34, 836–847. [Google Scholar] [CrossRef] [Green Version]
- Rojas, L.; Neumann, I.; Herrero, M.J.; Bosó, V.; Reig, J.; Poveda, J.L.; Megías, J.; Bea, S.; Aliño, S.F. Effect of CYP3A5*3 on kidney transplant recipients treated with tacrolimus: A systematic review and meta-analysis of observational studies. Pharm. J. 2015, 15, 38–48. [Google Scholar] [CrossRef]
- Hendijani, F.; Azarpira, N.; Kaviani, M. Effect of CYP3A5*1 expression on tacrolimus required dose after liver transplantation: A systematic review and meta-analysis. Clin. Transplant. 2018, 32, e13306. [Google Scholar] [CrossRef] [PubMed]
- Gufford, B.; Barr, J.; González-Pérez, V.; Layton, M.; White, J.; Oberlies, N.; Paine, M. Quantitative prediction and clinical evaluation of an unexplored herb–drug interaction mechanism in healthy volunteers. CPT Pharmacomet. Syst. Pharmacol. 2015, 4, 701–710. [Google Scholar] [CrossRef] [PubMed]
- Perdaems, N.; Blasco, H.; Vinson, C.; Chenel, M.; Whalley, S.; Cazade, F.; Bouzom, F. Predictions of Metabolic Drug-Drug Interactions Using Physiologically Based Modelling. Clin. Pharmacokinet. 2010, 49, 239–258. [Google Scholar] [CrossRef] [PubMed]
- Liu, H.; Yu, Y.; Guo, N.; Wang, X.; Han, B.; Xiang, X. Application of Physiologically Based Pharmacokinetic Modeling to Evaluate the Drug-Drug and Drug-Disease Interactions of Apatinib. Front. Pharm. 2021, 12, 780937. [Google Scholar] [CrossRef] [PubMed]
- Zhang, Z.; Fu, S.; Wang, F.; Yang, C.; Wang, L.; Yang, M.; Zhang, W.; Zhong, W.; Zhuang, X. A PBPK Model of Ternary Cyclodextrin Complex of ST-246 Was Built to Achieve a Reasonable IV Infusion Regimen for the Treatment of Human Severe Smallpox. Front. Pharmacol. 2022, 13, 836356. [Google Scholar] [CrossRef]
- Li, S.; Yu, Y.; Bian, X.; Yao, L.; Li, M.; Lou, Y.R.; Yuan, J.; Lin, H.S.; Liu, L.; Han, B.; et al. Prediction of oral hepatotoxic dose of natural products derived from traditional Chinese medicines based on SVM classifier and PBPK modeling. Arch. Toxicol. 2021, 95, 1683–1701. [Google Scholar] [CrossRef]
- Wei, H.; Miao, H.; Yun, Y.; Li, J.; Qian, X.; Wu, R.; Chen, W. Validation of an LC–MS/MS Method for Quantitative Analysis of the 5 Bioactive Components of Wuzhi Capsule in Human Plasma Samples. Ther. Drug Monit. 2014, 36, 781–788. [Google Scholar] [CrossRef]
- Fu, S.; Wang, L.; Zhu, Y.; Zhou, M.; Zhang, L. Effect of Wuzhi capsule on blood concentration of tacrolimus in renal graft recipients. Pharm. Care Res. 2009, 9, 275–278. (In Chinese) [Google Scholar]
- Adiwidjaja, J.; Boddy, A.V.; Mclachlan, A.J. Potential for pharmacokinetic interactions between Schisandra sphenanthera and bosutinib, but not imatinib: In vitro metabolism study combined with a physiologically-based pharmacokinetic modelling approach. Br. J. Clin. Pharmacol. 2020, 86, 2080–2094. [Google Scholar] [CrossRef]
- Jin, J.; Bi, H.; Hu, J.; Zhong, G.; Zhao, L.; Huang, Z.; Huang, M. Enhancement of oral bioavailability of paclitaxel after oral administration of Schisandrol B in rats. Biopharm. Drug Dispos. 2010, 31, 264–268. [Google Scholar] [CrossRef]
- Wan, C.K.; Tse, A.K.; Yu, Z.L.; Zhu, G.Y.; Wang, H.; Fong, D.W. Inhibition of cytochrome P450 3A4 activity by schisandrol A and gomisin A isolated from Fructus Schisandrae chinensis. Phytomedicine 2010, 17, 702–705. [Google Scholar] [CrossRef] [PubMed]
- Yuan, F.; Liang, X.; Chen, X.; Qin, X.; Tan, C.; Wang, L. CYP2C19 is involved in the effect of Wuzhi tablet (Schisandra sphenanthera extract) and its constituents on the pharmacokinetics of intravenous voriconazole. Pharmazie 2020, 75, 559–564. [Google Scholar] [PubMed]
- Berry, L.M.; Zhao, Z.; Lin, M.-H.J. Dynamic Modeling of Cytochrome P450 Inhibition In Vitro: Impact of Inhibitor Depletion on IC50 Shift. Drug Metab. Dispos. 2013, 41, 1433–1441. [Google Scholar] [CrossRef] [PubMed] [Green Version]
- Zhai, J.; Zhang, F.; Gao, S.; Chen, L.; Feng, G.; Yin, J.; Chen, W. Time- and NADPH-Dependent Inhibition on CYP3A by Gomisin A and the Pharmacokinetic Interactions between Gomisin A and Cyclophosphamide in Rats. Molecules 2017, 22, 1298. [Google Scholar] [CrossRef] [PubMed] [Green Version]
- Wei, H.; Tao, X.; Di, P.; Yang, Y.; Li, J.; Qian, X.; Feng, J.; Chen, W. Effects of Traditional Chinese Medicine Wuzhi Capsule on Pharmacokinetics of Tacrolimus in Rats. Drug Metab. Dispos. 2013, 41, 1398–1403. [Google Scholar] [CrossRef]
- Wu, H.; Zhu, Z.; Zhang, G.; Zhao, L.; Zhang, H.; Zhu, D.; Chai, Y. Comparative pharmacokinetic study of paeoniflorin after oral administration of pure paeoniflorin, extract of Cortex Moutan and Shuang-Dan prescription to rats. J. Ethnopharmacol. 2009, 125, 444–449. [Google Scholar] [CrossRef]
- Walsky, R.L.; Obach, R.S.; Hyland, R.; Kang, P.; Zhou, S.; West, M.; Geoghegan, K.F.; Helal, C.J.; Walker, G.S.; Goosen, T.C.; et al. Selective Mechanism-Based Inactivation of CYP3A4 by CYP3cide (PF-04981517) and Its Utility as an In Vitro Tool for Delineating the Relative Roles of CYP3A4 versus CYP3A5 in the Metabolism of Drugs. Drug Metab. Dispos. 2012, 40, 1686–1697. [Google Scholar] [CrossRef] [Green Version]
- Poulin, P.; Theil, F.P. Prediction of pharmacokinetics prior to in vivo studies. 1. Mechanism-based prediction of volume of distribution. J. Pharm. Sci. 2002, 91, 129–156. [Google Scholar] [CrossRef]
- Berezhkovskiy, L.M. Volume of distribution at steady state for a linear pharmacokinetic system with peripheral elimination. J. Pharm. Sci. 2004, 93, 1628–1640. [Google Scholar] [CrossRef]


| PK Parameters | SZA | SZB | ||||
|---|---|---|---|---|---|---|
| Pre 1 | Obs 2 | FE 3 | Pre | Obs | FE | |
| Cmax4 (ng/mL) | 126.88 | 111.37 | 1.14 | 66.70 | 65.18 | 1.02 |
| Tmax5 (h) | 0.96 | 1.81 | 1.90 | 0.73 | 1.13 | 1.54 |
| AUC(ng/mL·h) | 437.80 | 467.14 | 1.10 | 271.74 | 242.97 | 1.12 |
| Population | Inhibitors | Dose Regimen | RI Case#1 | TDI Case#2 | RI and TDI Case#3 |
|---|---|---|---|---|---|
| CYP3A5 Non-expresser | SZA | Single dose | — | 118.07 1/118.17 2 1.00 3 | — |
| Multiple doses | — | 118.07/136.76 1.16 | — | ||
| SZB | Single dose | 118.07/128.33 1.09 | 118.07/124.60 1.06 | 118.07/135.01 1.14 | |
| Multiple doses | 118.07/148.65 1.26 | 118.07/173.14 1.47 | 118.07/185.61 1.57 | ||
| CYP3A5 Expresser | SZA | Single dose | — | 62.50/62.54 1.00 | — |
| Multiple doses | — | 62.50/62.66 1.00 | — | ||
| SZB | Single dose | 62.50/69.83 1.12 | 62.50/64.72 1.04 | 62.50/72.12 1.15 | |
| Multiple doses | 62.50/70.68 1.13 | 62.50/70.60 1.13 | 62.50/76.68 1.23 |
| Parameters | SZA | SZB | |
|---|---|---|---|
| Value | Value | Reference | |
| Molecular weight (g/mol) | 432.52 | 416.47 | - |
| Ionization pattern | Neutral | Neutral | - |
| Log Po:w 1 | 3.390 | 3.380 | Predicted by ADMET Predictor 11 |
| fu, plasma 2 | 0.083 | 0.084 | Predicted by Simcyp® |
| B/P 3 | 1.254 | 0.785 | Predicted by Simcyp® |
| Absorption phase | |||
| Model | ADAM - | ||
| fa 4 | 0.500 | 0.734 | Optimized using Simcyp® |
| ka (1/h) 5 | 0.218 | 0.437 | Optimized using Simcyp® |
| Peff, human (×10−4 cm/s) 6 | 0.500 | 1.000 | Optimized using Simcyp® |
| Distribution phase | |||
| Model | Full PBPK | ||
| Vss (L/kg) 8 | 2.516 | 2.225 | Method 1 12 |
| Kp scalar 9 | 0.5 | 1 | Optimized using Simcyp® |
| Elimination phase | |||
| Model | Whole-Organ Metabolic Clearance | ||
| CLint,HLM (μL/min/mg) 10 protein) 7 | 50 | 4.5 | In-house data |
Publisher’s Note: MDPI stays neutral with regard to jurisdictional claims in published maps and institutional affiliations. |
© 2022 by the authors. Licensee MDPI, Basel, Switzerland. This article is an open access article distributed under the terms and conditions of the Creative Commons Attribution (CC BY) license (https://creativecommons.org/licenses/by/4.0/).
Share and Cite
He, Q.; Bu, F.; Wang, Q.; Li, M.; Lin, J.; Tang, Z.; Mak, W.Y.; Zhuang, X.; Zhu, X.; Lin, H.-S.; et al. Examination of the Impact of CYP3A4/5 on Drug–Drug Interaction between Schizandrol A/Schizandrol B and Tacrolimus (FK-506): A Physiologically Based Pharmacokinetic Modeling Approach. Int. J. Mol. Sci. 2022, 23, 4485. https://doi.org/10.3390/ijms23094485
He Q, Bu F, Wang Q, Li M, Lin J, Tang Z, Mak WY, Zhuang X, Zhu X, Lin H-S, et al. Examination of the Impact of CYP3A4/5 on Drug–Drug Interaction between Schizandrol A/Schizandrol B and Tacrolimus (FK-506): A Physiologically Based Pharmacokinetic Modeling Approach. International Journal of Molecular Sciences. 2022; 23(9):4485. https://doi.org/10.3390/ijms23094485
Chicago/Turabian StyleHe, Qingfeng, Fengjiao Bu, Qizhen Wang, Min Li, Jiaying Lin, Zhijia Tang, Wen Yao Mak, Xiaomei Zhuang, Xiao Zhu, Hai-Shu Lin, and et al. 2022. "Examination of the Impact of CYP3A4/5 on Drug–Drug Interaction between Schizandrol A/Schizandrol B and Tacrolimus (FK-506): A Physiologically Based Pharmacokinetic Modeling Approach" International Journal of Molecular Sciences 23, no. 9: 4485. https://doi.org/10.3390/ijms23094485
APA StyleHe, Q., Bu, F., Wang, Q., Li, M., Lin, J., Tang, Z., Mak, W. Y., Zhuang, X., Zhu, X., Lin, H.-S., & Xiang, X. (2022). Examination of the Impact of CYP3A4/5 on Drug–Drug Interaction between Schizandrol A/Schizandrol B and Tacrolimus (FK-506): A Physiologically Based Pharmacokinetic Modeling Approach. International Journal of Molecular Sciences, 23(9), 4485. https://doi.org/10.3390/ijms23094485