
Chronic Experimental Model of TNBS-Induced Colitis to Study Inflammatory Bowel Disease


Abstract
:1. Introduction
2. Results
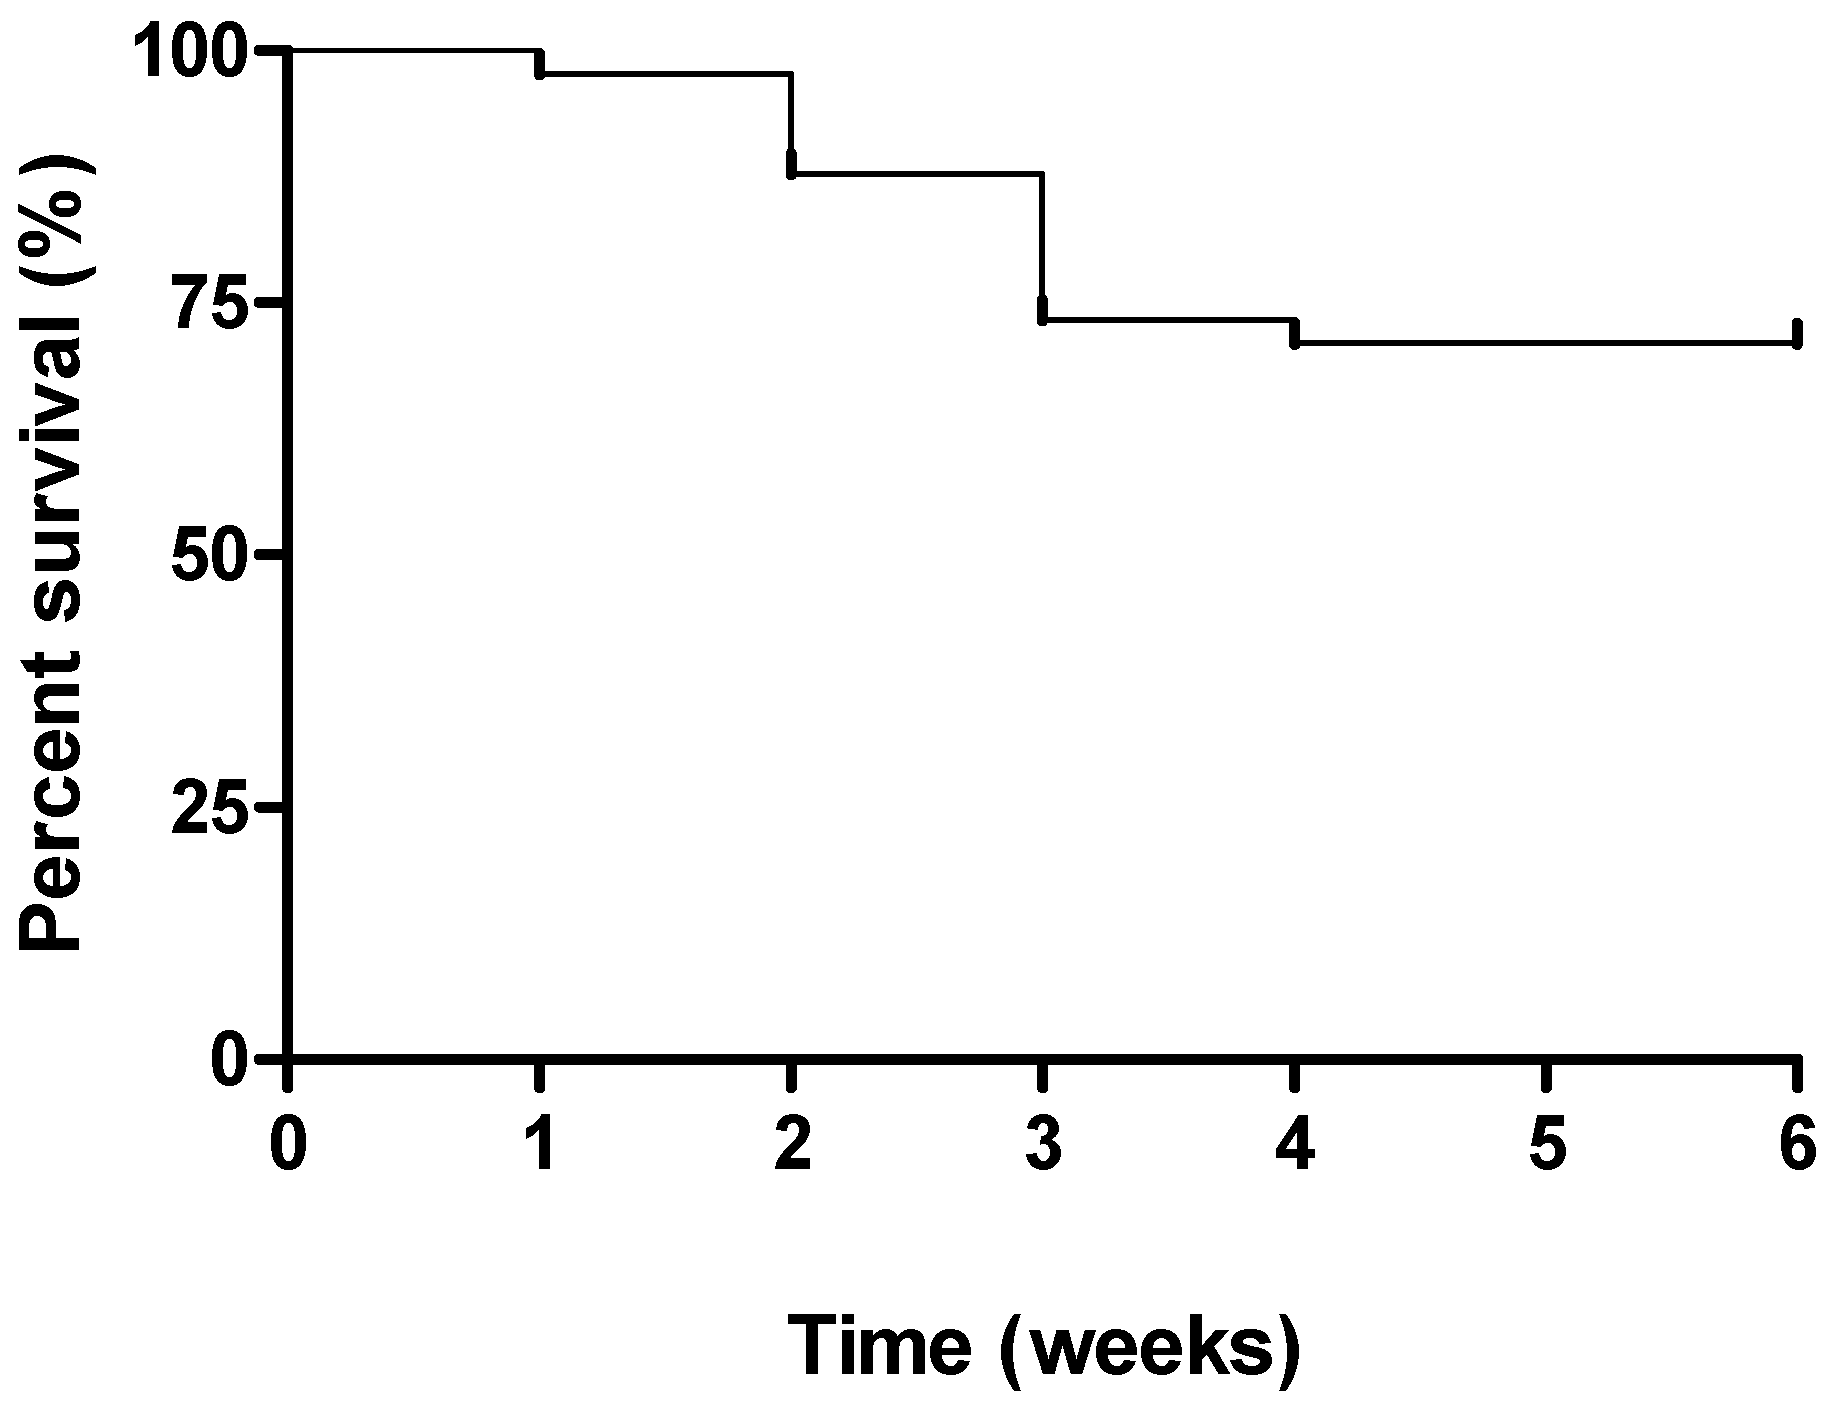
2.1. Clinical Signs
2.2. Macroscopic Assessment of Colitis
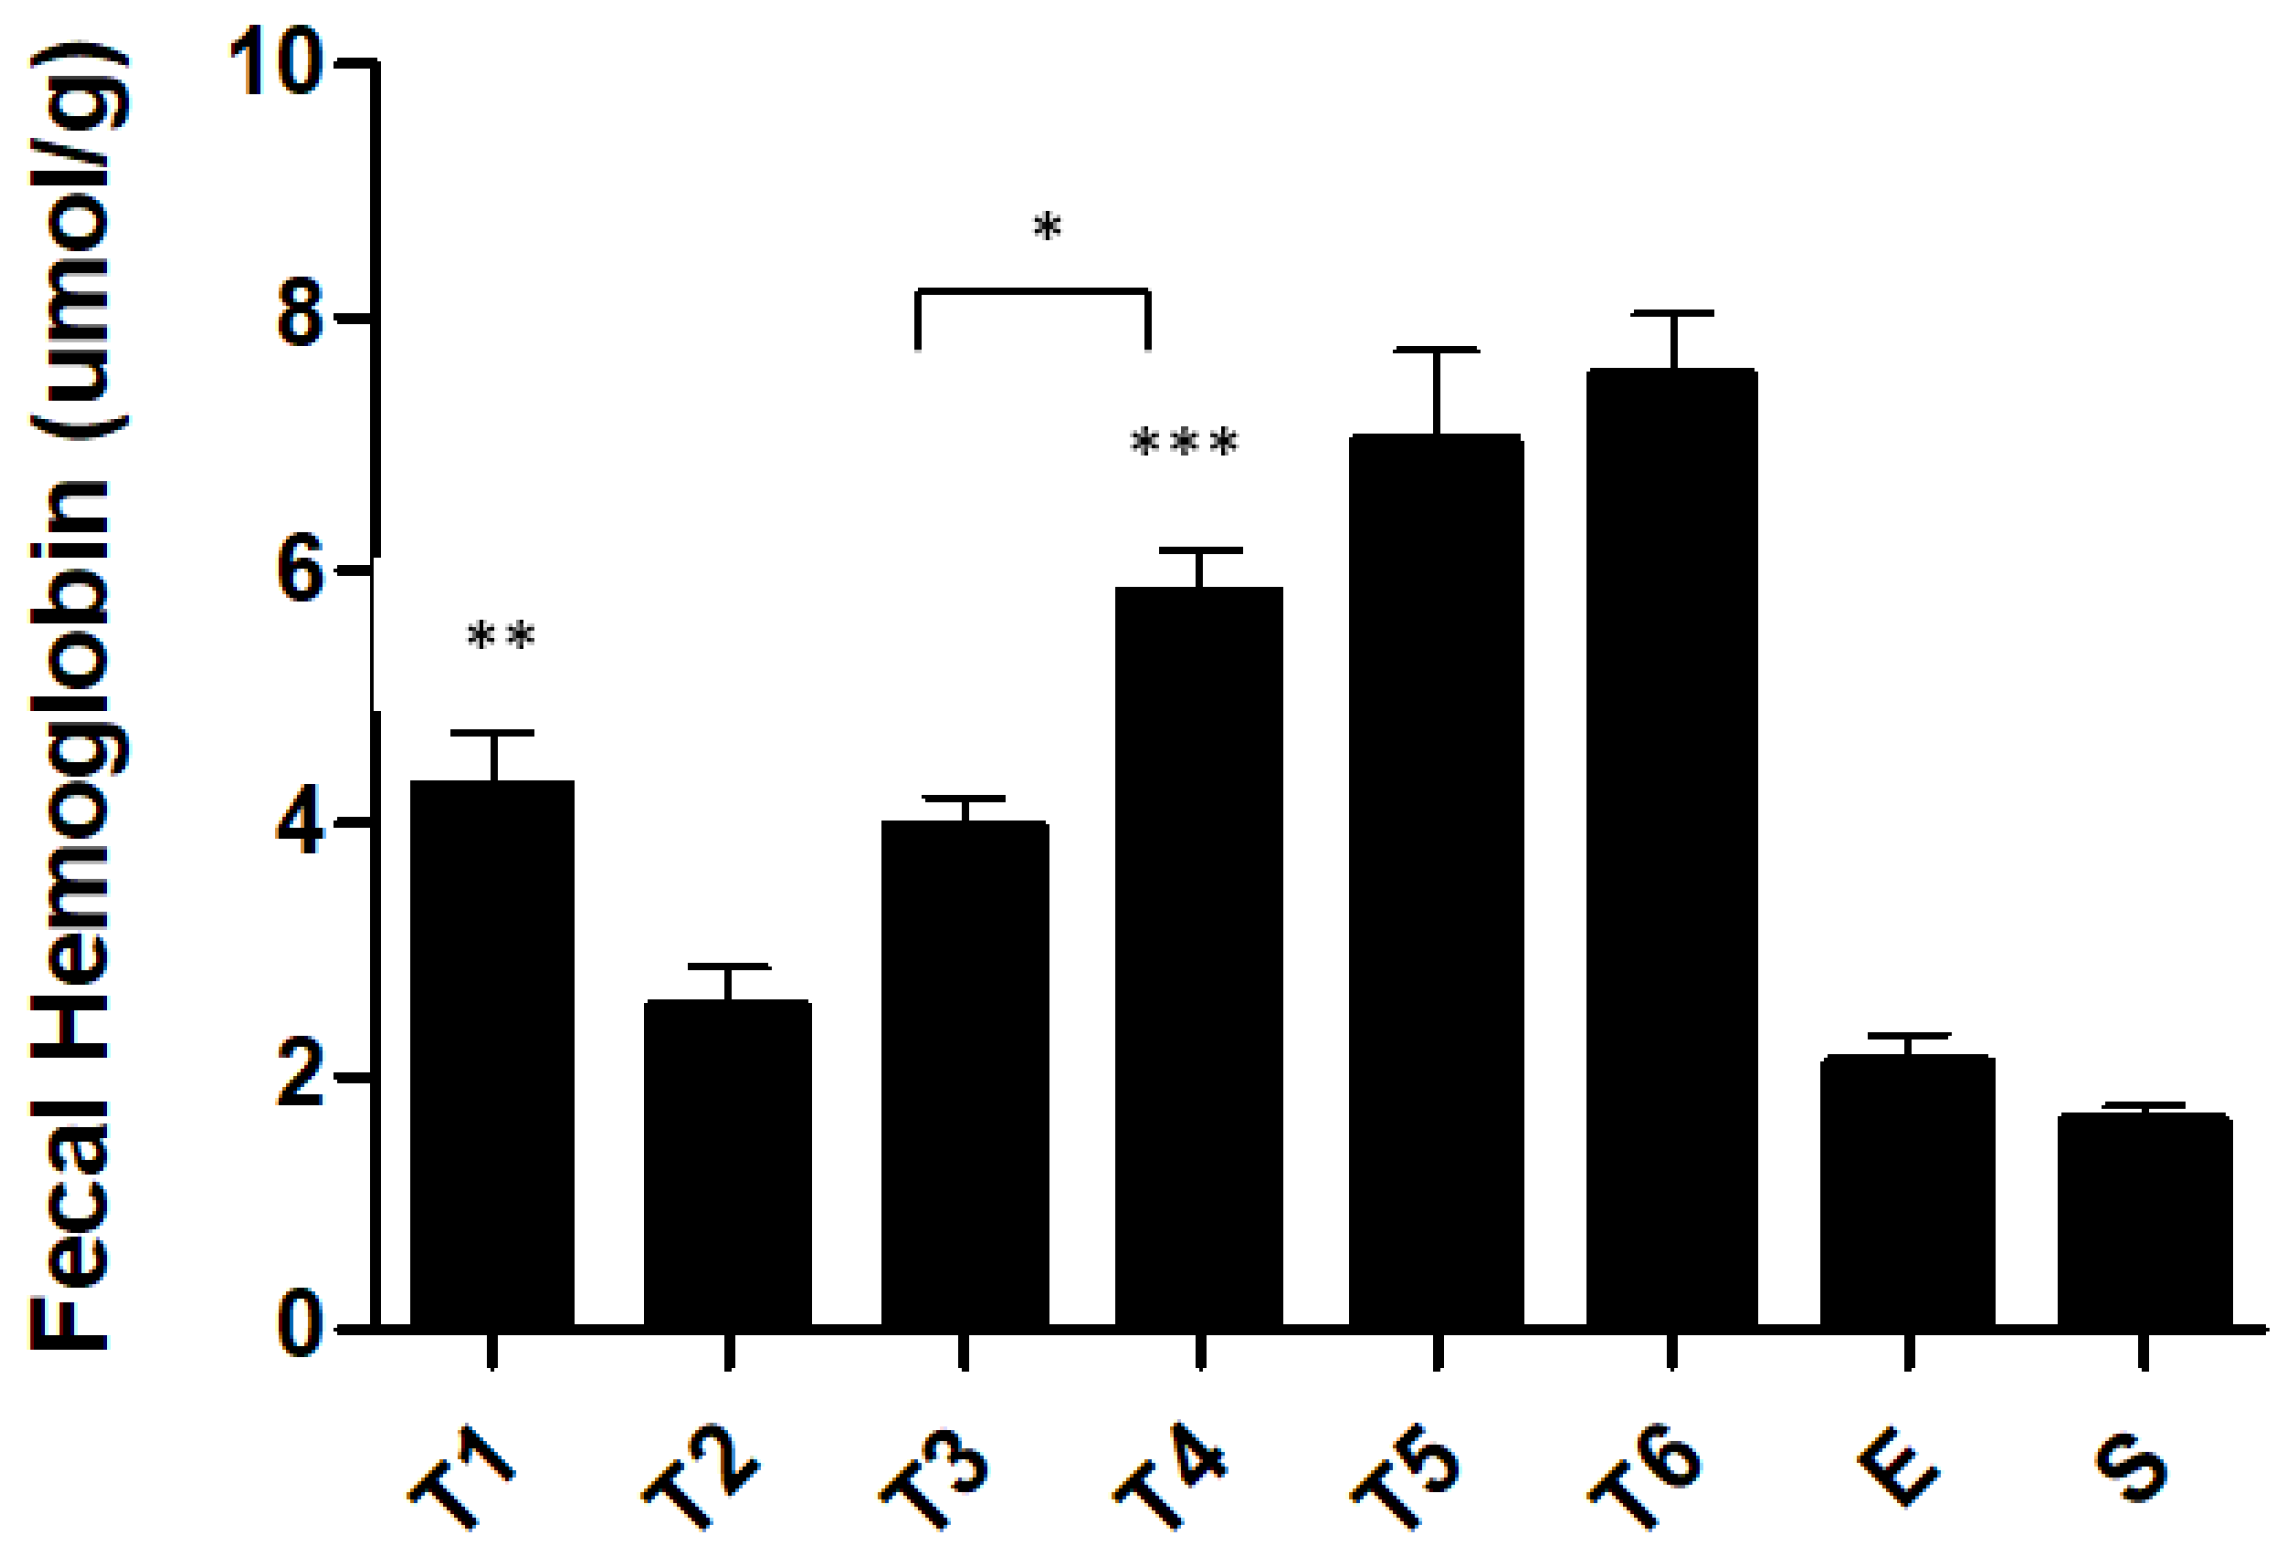
2.3. Biochemical Markers
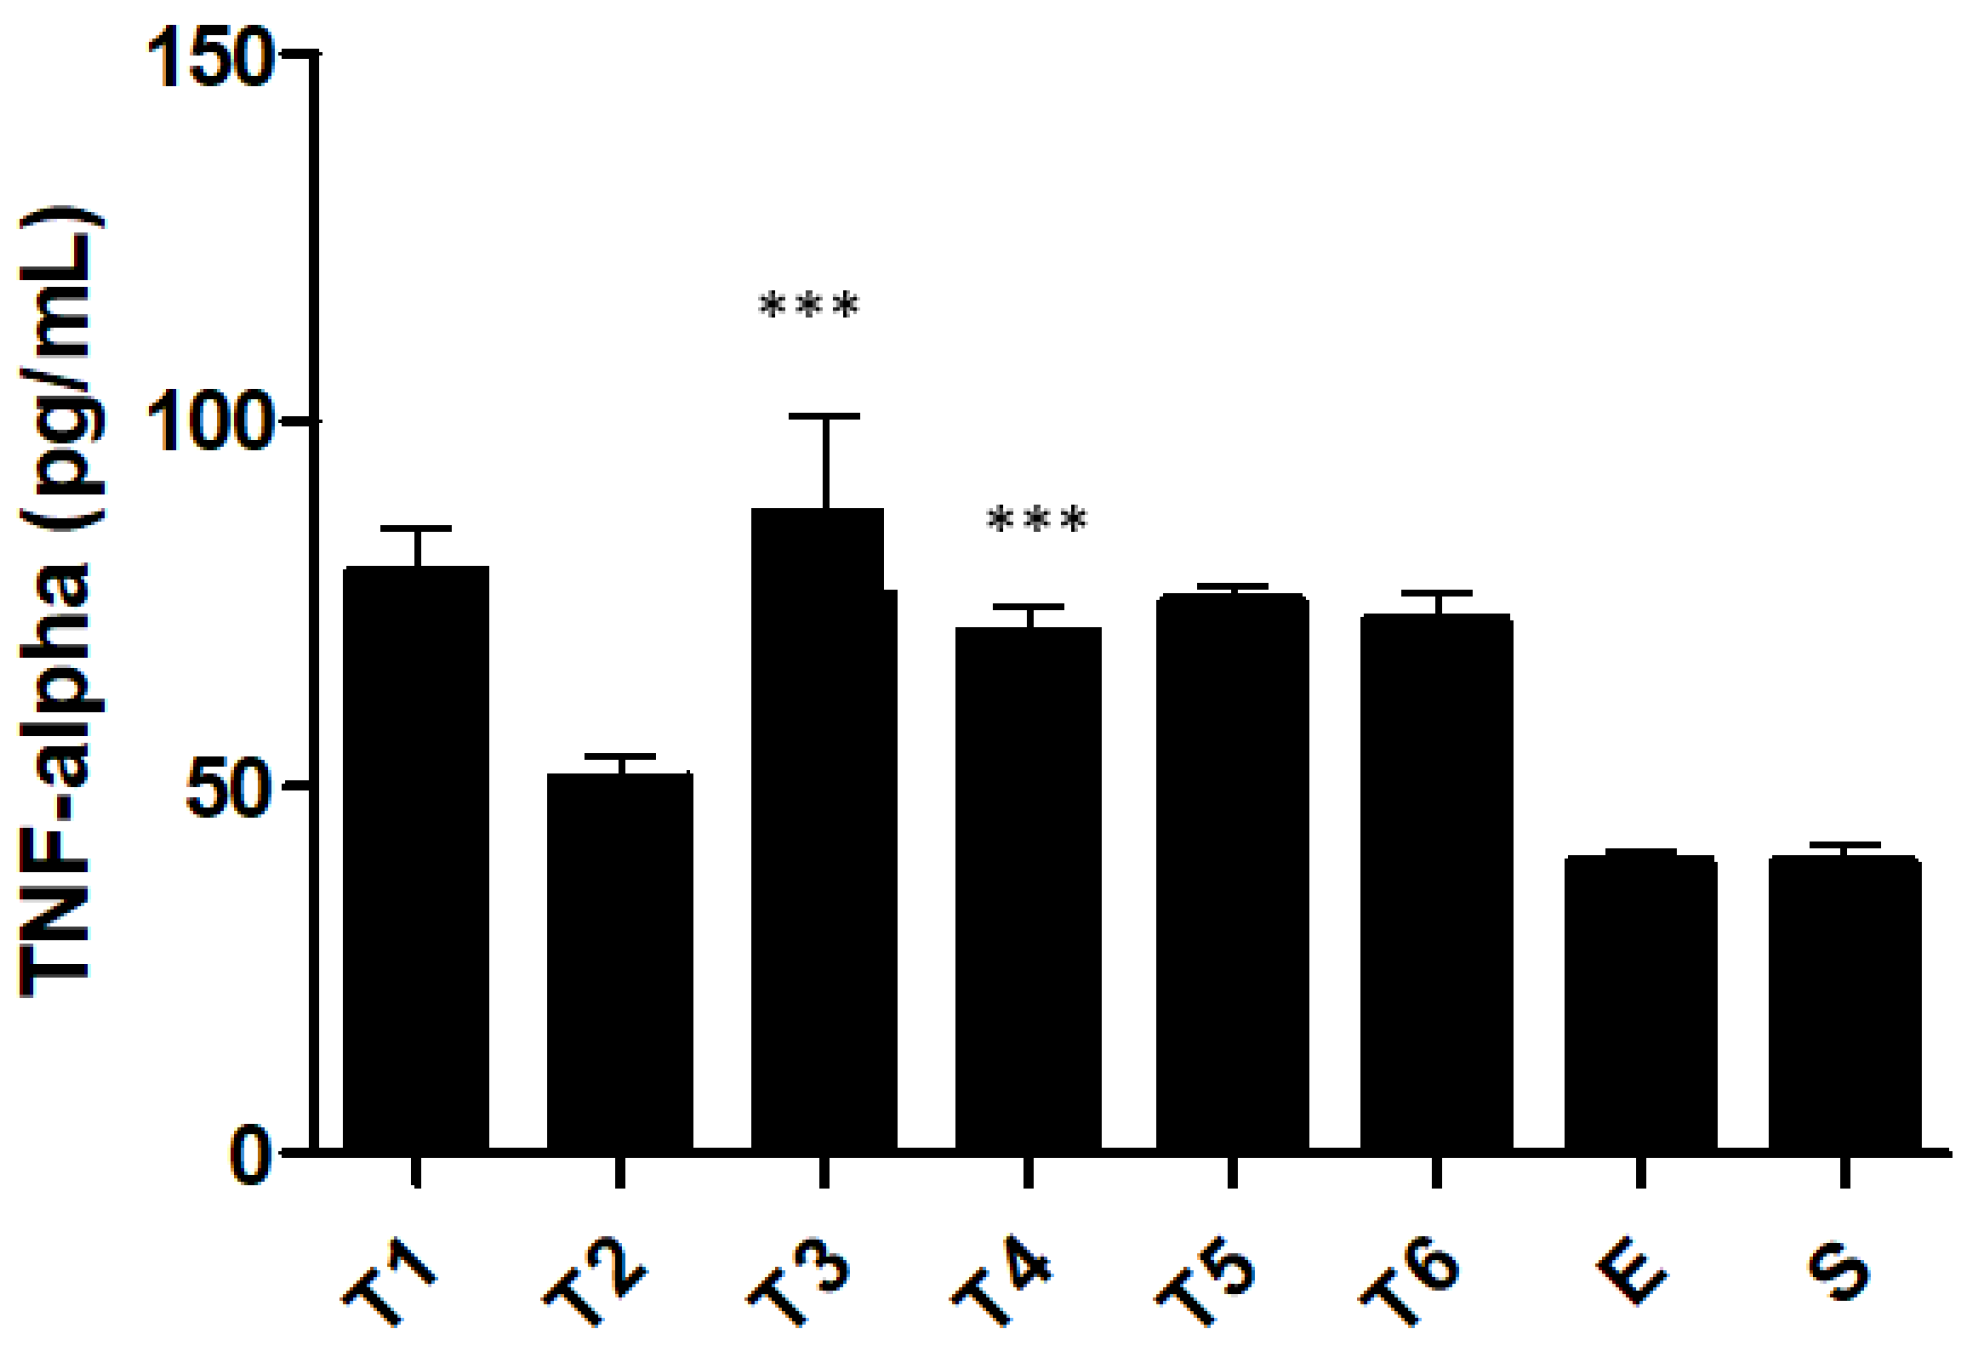
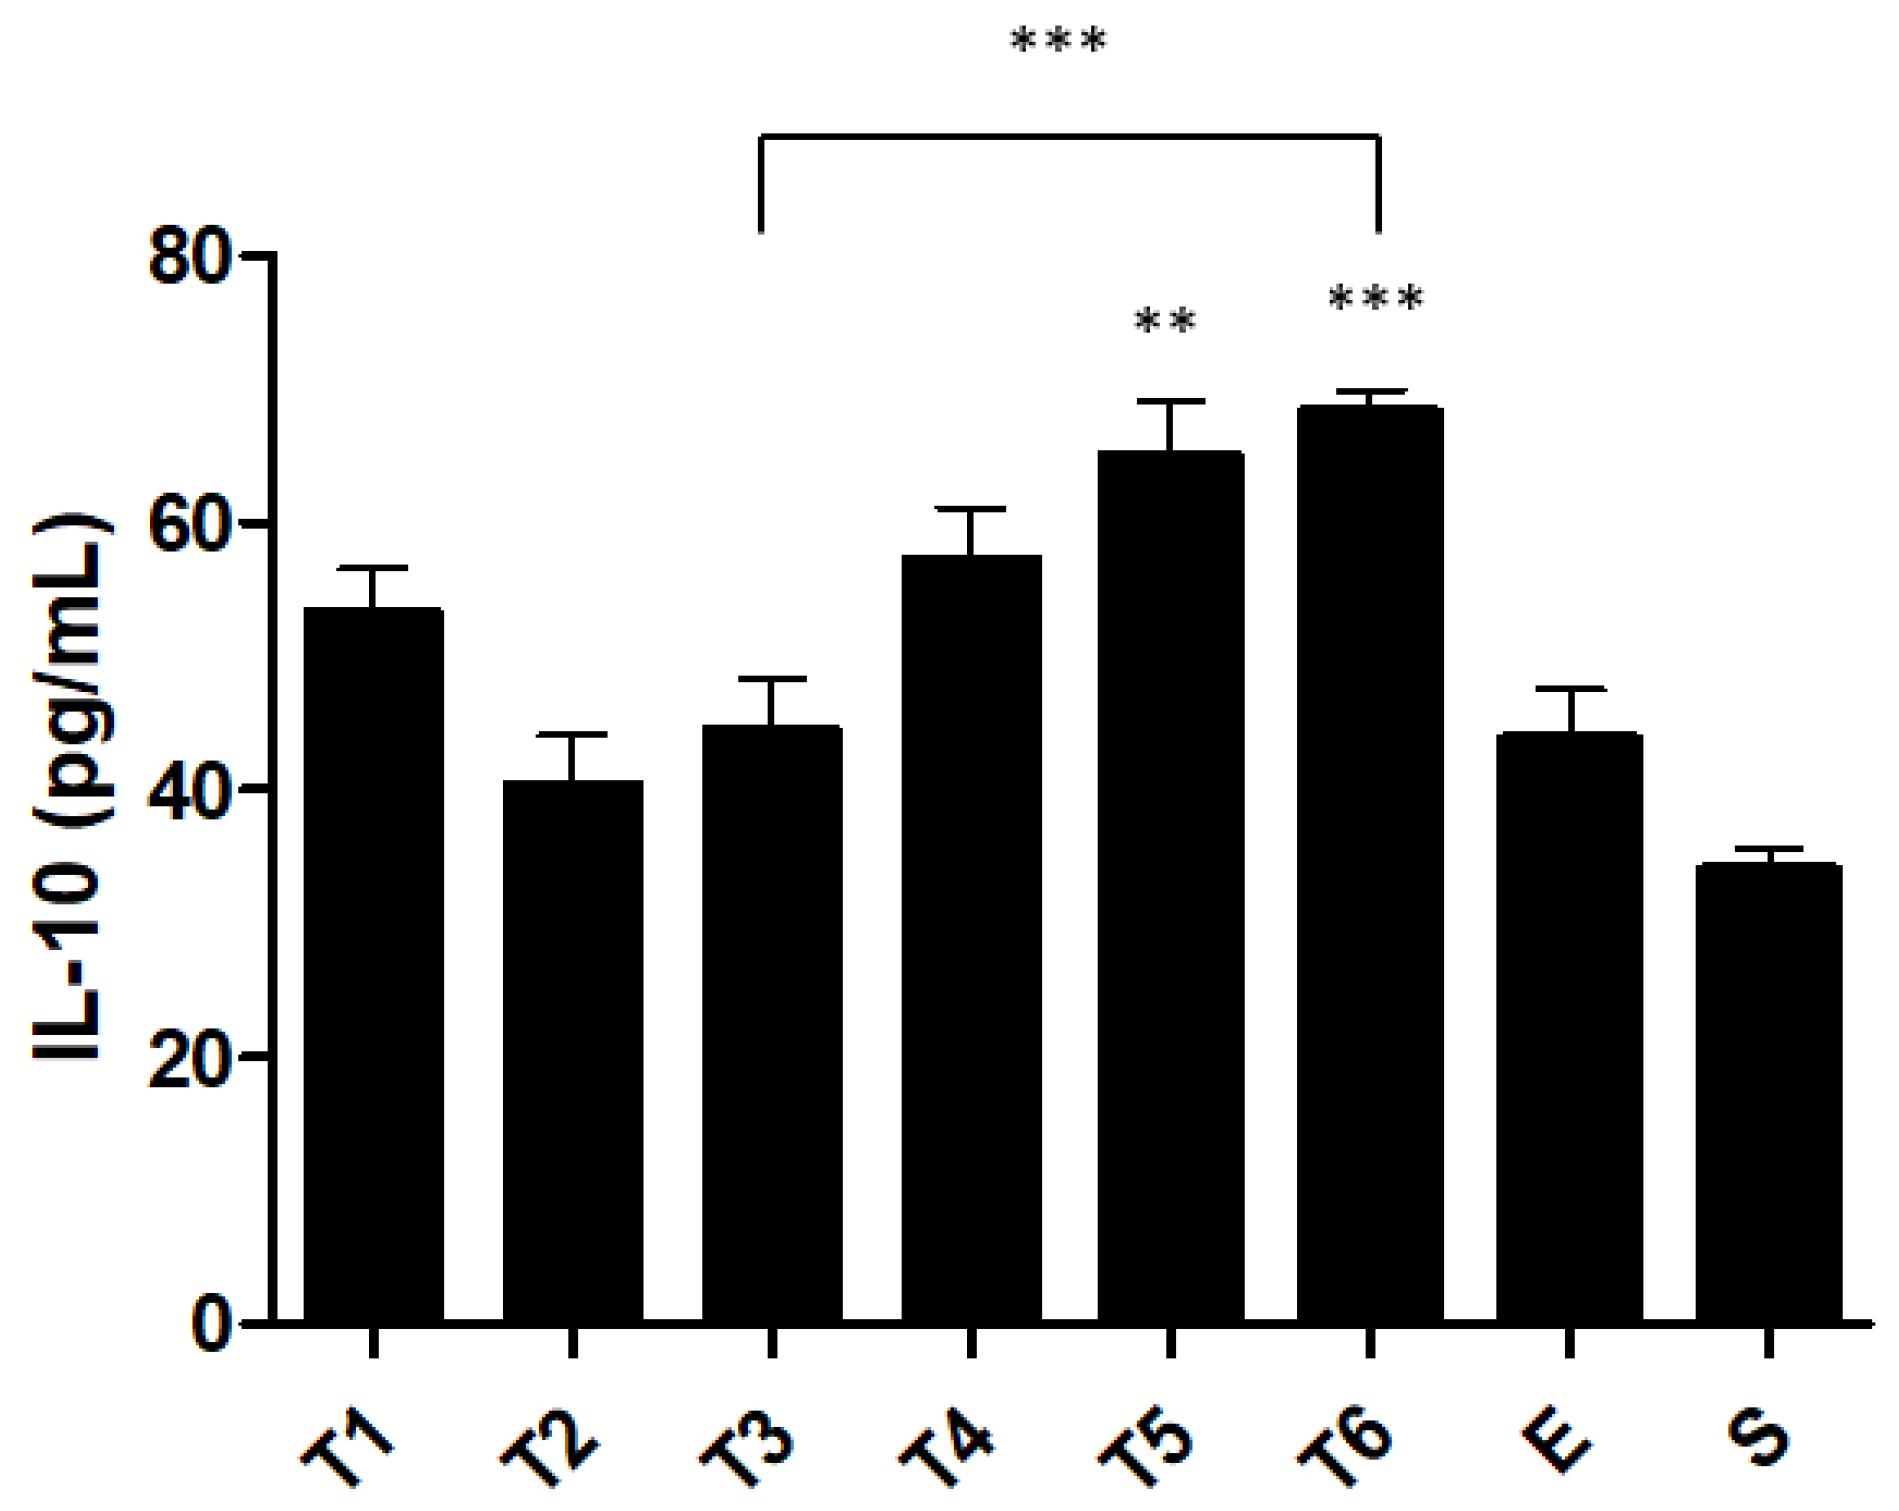
2.4. Pro and Anti-Inflammatory Cytokine Levels
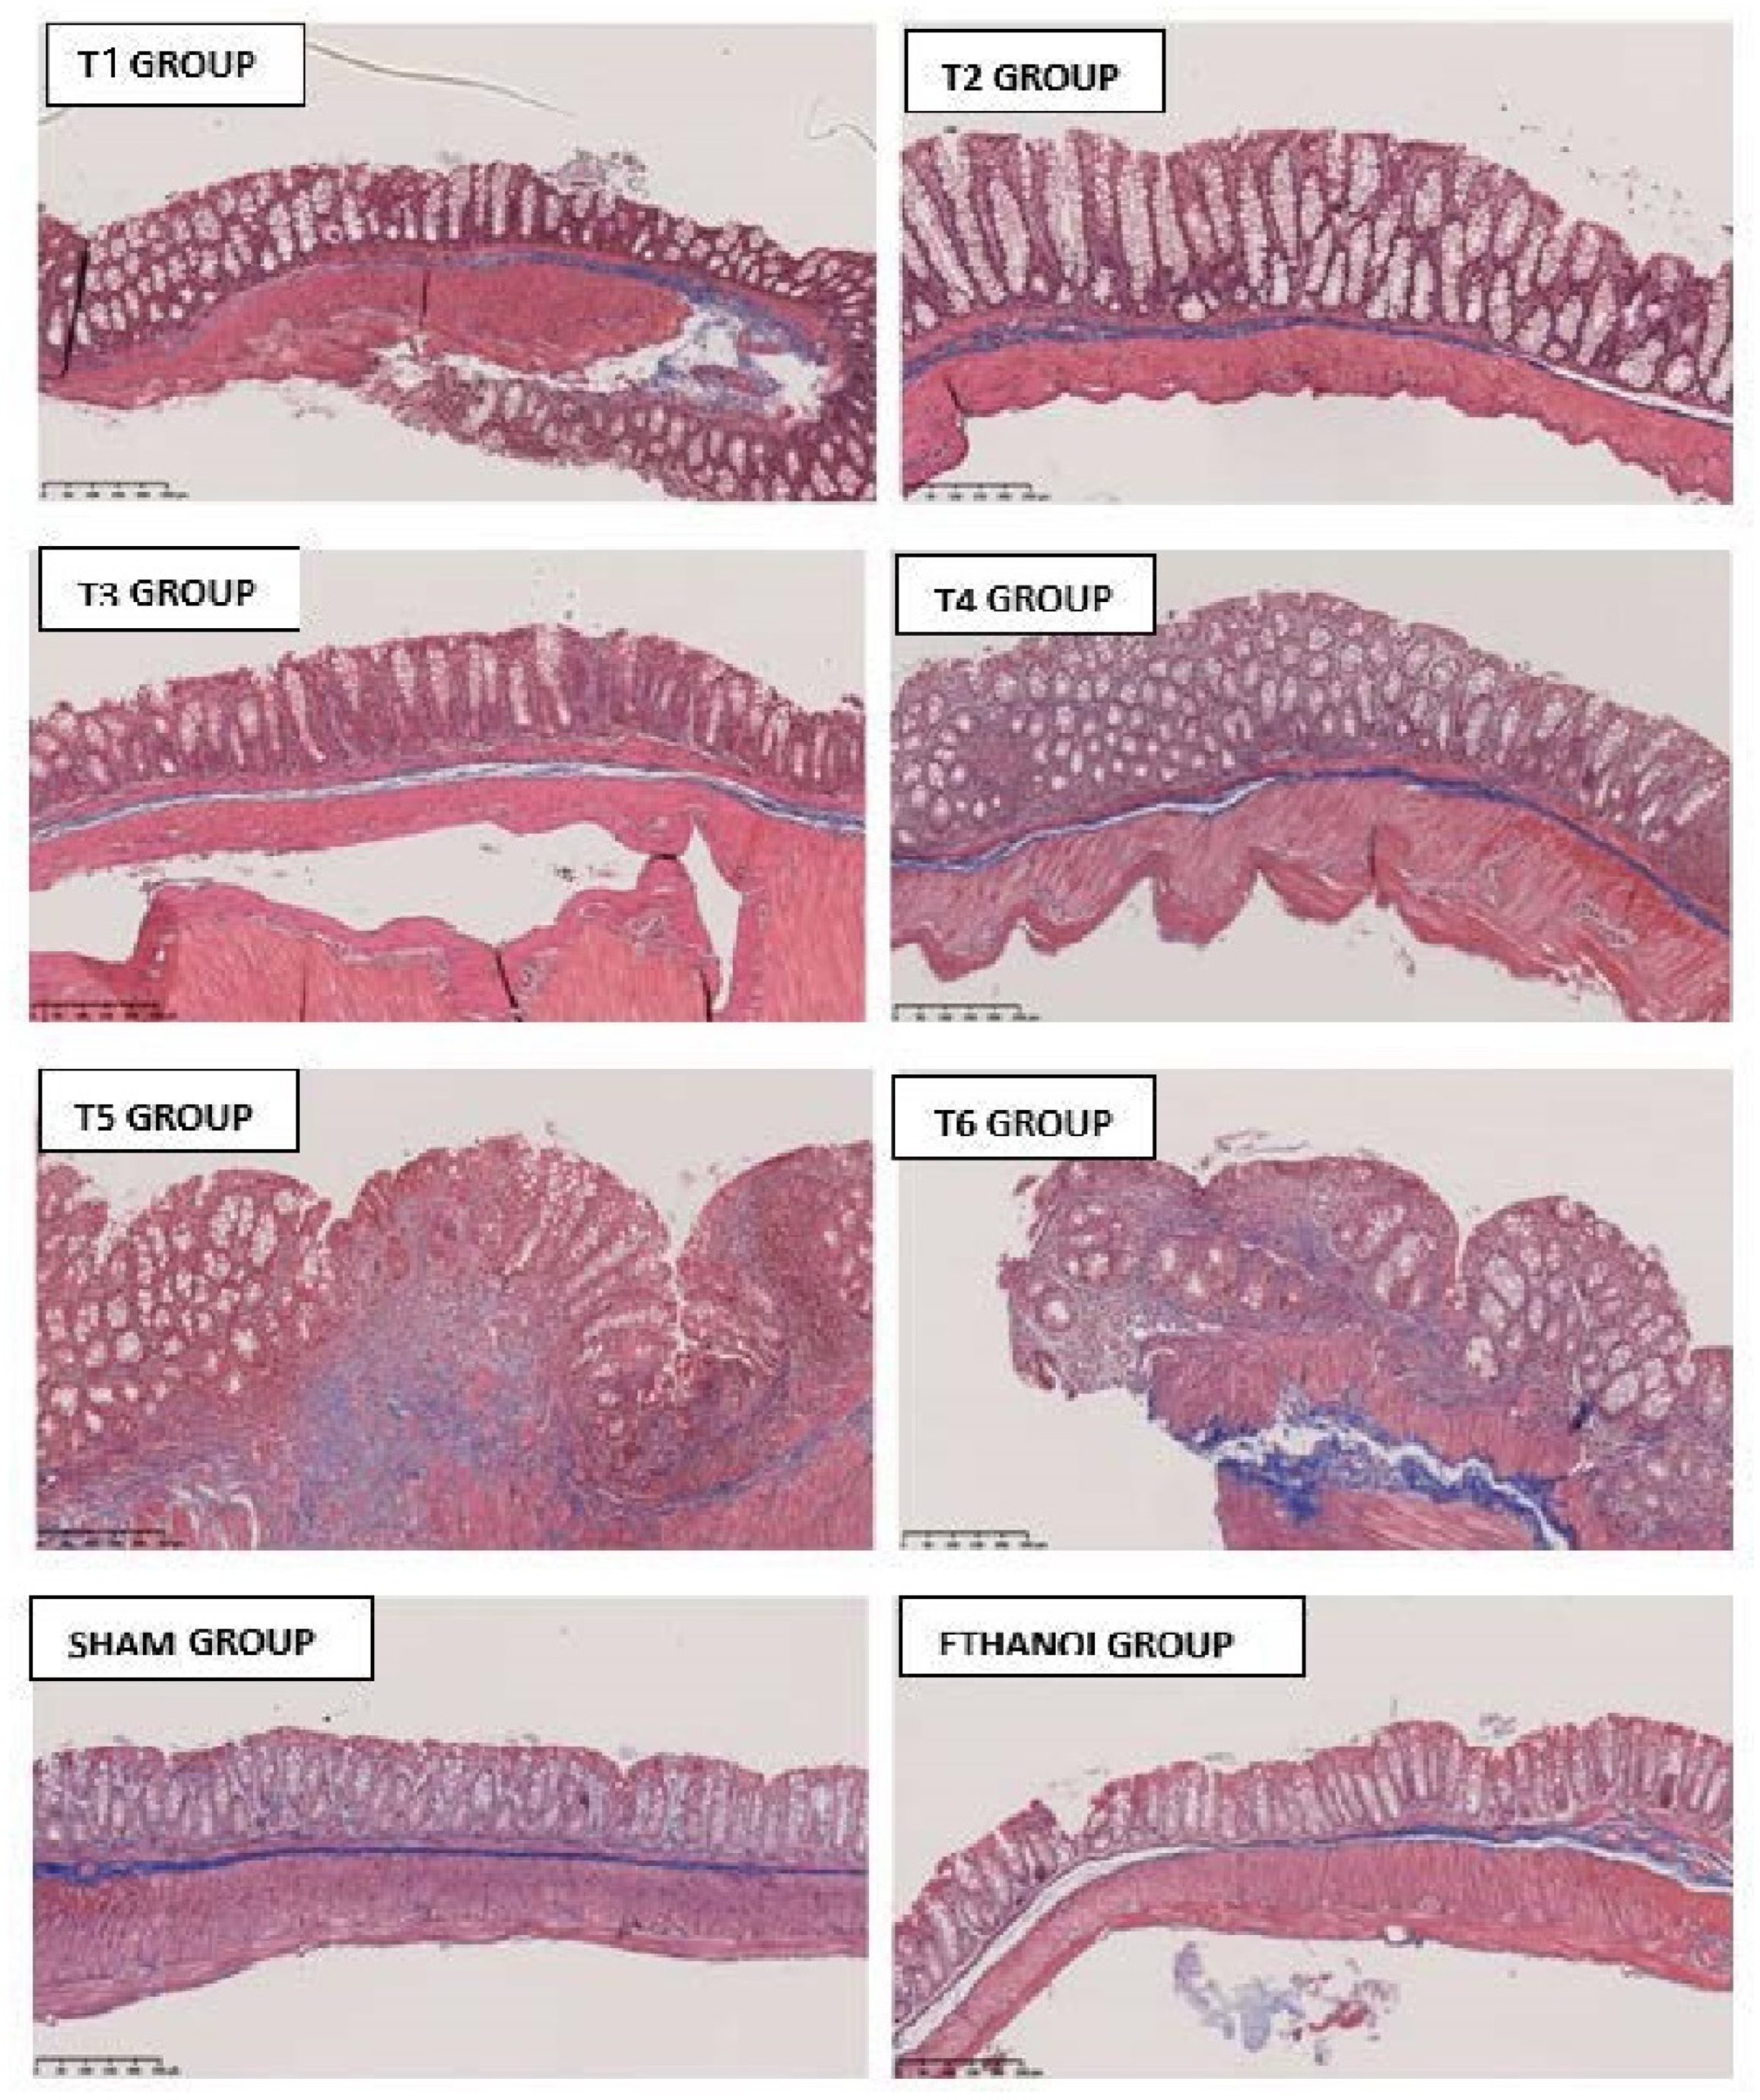
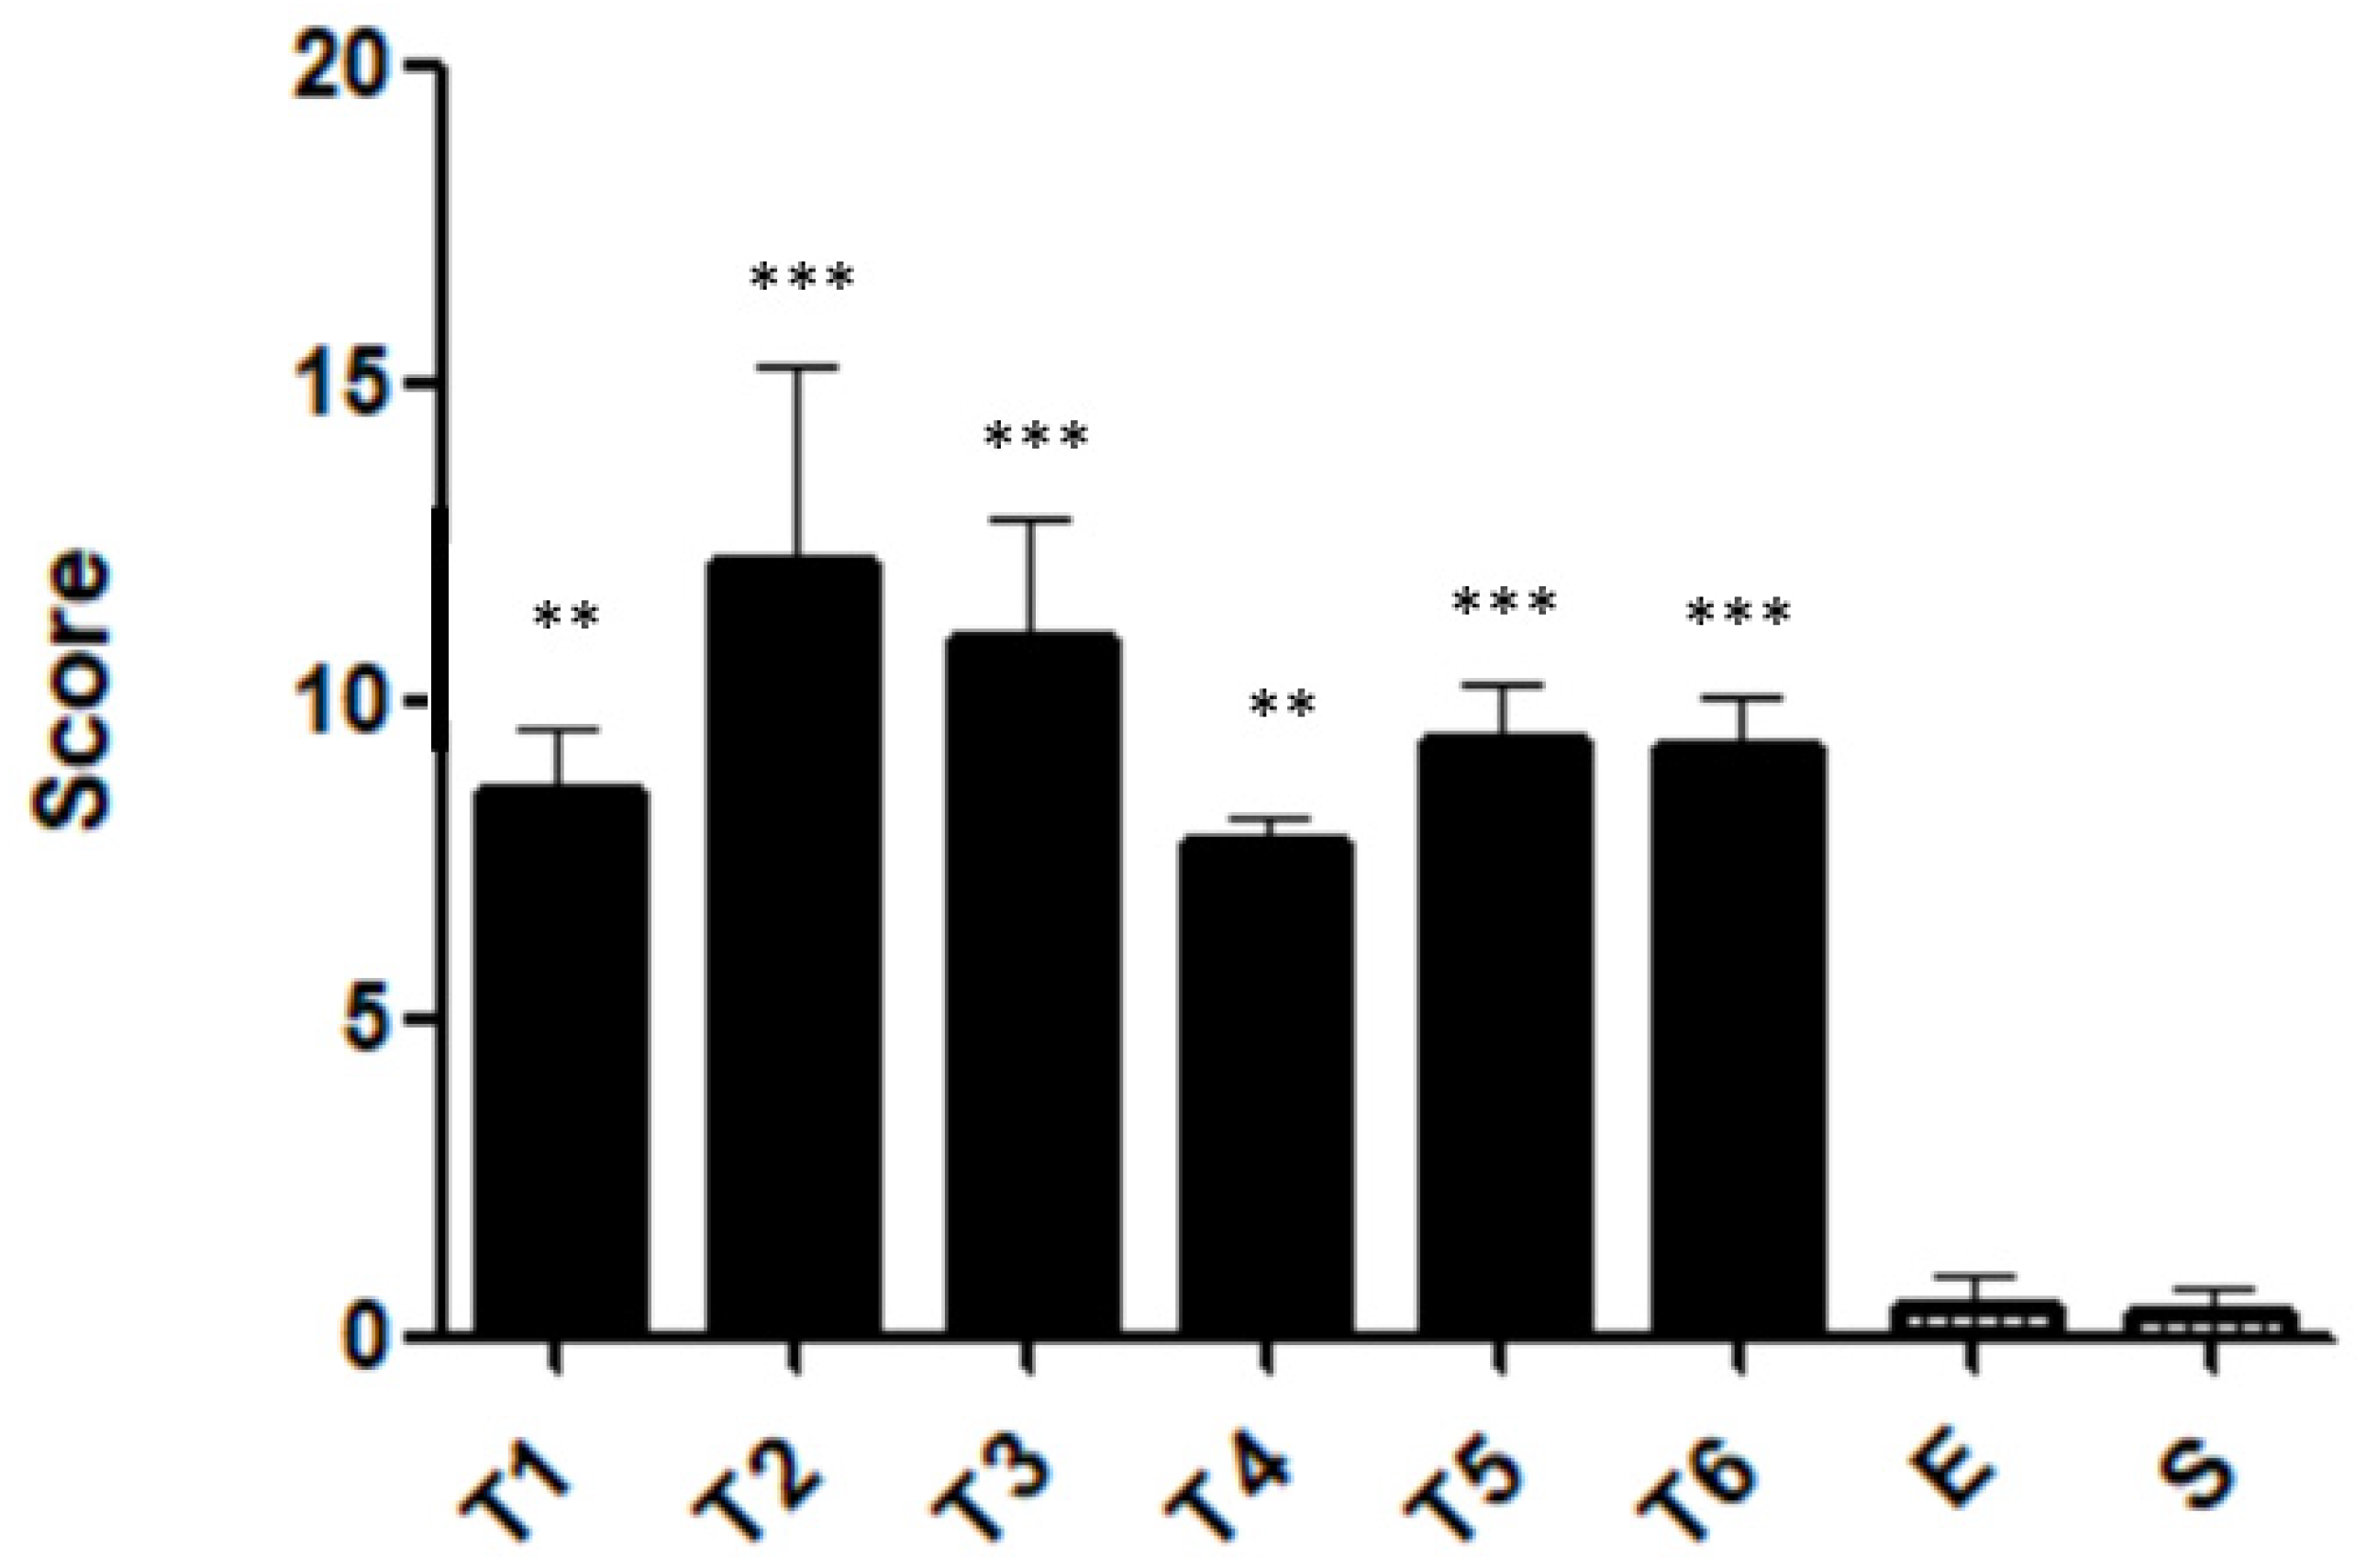
2.5. Histopathological Features
3. Discussion
4. Materials and Methods
4.1. Material
4.2. Animals
4.3. Trinitrobenzene Sulfonic Acid-Induced Colitis
4.4. Experimental Groups
4.5. Monitoring of Clinical Signs
4.6. Macroscopic Assessment of Colitis
4.7. Biochemical Markers
4.8. Measurement of Cytokines
4.9. Histopathological Analysis
4.10. Statistical Analysis
5. Conclusions
Author Contributions
Funding
Institutional Review Board Statement
Acknowledgments
Conflicts of Interest
References
- Gajendran, M.; Loganathan, P.; Catinella, A.P.; Hashash, J.G. A comprehensive review and update on Crohn’s disease. Disease-a-Month 2018, 64, 20–57. [Google Scholar] [CrossRef] [PubMed]
- Mak, W.Y.; Zhao, M.; Ng, S.C.; Burisch, J. The epidemiology of inflammatory bowel disease: East meets west. J. Gastroenterol. Hepatol. 2019, 35, 380–389. [Google Scholar] [CrossRef]
- Alatab, S.; Sepanlou, S.G.; Ikuta, K.; Vahedi, H.; Bisignano, C.; Safiri, S.; Sadeghi, A.; Nixon, M.R.; Abdoli, A.; Abolhassani, H.; et al. The global, regional, and national burden of inflammatory bowel disease in 195 countries and territories, 1990–2017: A systematic analysis for the Global Burden of Disease Study 2017. Lancet Gastroenterol. Hepatol. 2020, 5, 17–30. [Google Scholar] [CrossRef] [Green Version]
- de Lange, K.M.; Barrett, J.C. Understanding inflammatory bowel disease via immunogenetics. J. Autoimmun. 2015, 64, 91–100. [Google Scholar] [CrossRef] [PubMed] [Green Version]
- Biancone, L.; Annese, V.; Ardizzone, S.; Armuzzi, A.; Calabrese, E.; Caprioli, F.; Castiglione, F.; Comberlato, M.; Cottone, M.; Danese, S.; et al. Safety of treatments for inflammatory bowel disease: Clinical practice guidelines of the Italian Group for the Study of Inflammatory Bowel Disease (IG-IBD). Dig. Liver Dis. 2017, 49, 338–358. [Google Scholar] [CrossRef]
- Pithadia, A.B.; Jain, S. Treatment of inflammatory bowel disease (IBD). Pharmacol. Rep. 2011, 63, 629–642. [Google Scholar] [CrossRef]
- Catana, C.; Magdas, C.; Tabaran, F.; Crăciun, E.; Deak, G.; Magdaş, V.; Cozma, V.; Gherman, C.; Berindan-Neagoe, I.; Dumitraşcu, D. Comparison of two models of inflammatory bowel disease in rats. Adv. Clin. Exp. Med. 2018, 27, 599–607. [Google Scholar] [CrossRef] [PubMed]
- Randhawa, P.K.; Singh, K.; Singh, N.; Jaggi, A.S. A Review on Chemical-Induced Inflammatory Bowel Disease Models in Rodents. Korean J. Physiol. Pharmacol. 2014, 18, 279–288. [Google Scholar] [CrossRef] [PubMed] [Green Version]
- Hibi, T.; Ogata, H.; Sakuraba, A. Animal models of inflammatory bowel disease. J. Gastroenterol. 2002, 37, 409–417. [Google Scholar] [CrossRef] [PubMed]
- Linden, D.R.; Chen, J.-X.; Gershon, M.D.; Sharkey, K.; Mawe, G.M. Serotonin availability is increased in mucosa of guinea pigs with TNBS-induced colitis. Am. J. Physiol. Liver Physiol. 2003, 285, G207–G216. [Google Scholar] [CrossRef] [PubMed] [Green Version]
- Dohi, T.; Fujihashi, K. Type 1 and 2 T helper cell-mediated colitis. Curr. Opin. Gastroenterol. 2006, 22, 651–657. [Google Scholar] [CrossRef] [PubMed]
- Zheng, L. A chronic ulcerative colitis model in rats. World J. Gastroenterol. 2000, 6, 150–152. [Google Scholar] [CrossRef] [PubMed]
- Cominelli, F.; Arseneau, K.O.; Rodriguez-Palacios, A.; Pizarro, T.T. Uncovering Pathogenic Mechanisms of Inflammatory Bowel Disease Using Mouse Models of Crohn’s Disease–Like Ileitis: What is the Right Model? Cell. Mol. Gastroenterol. Hepatol. 2017, 4, 19–32. [Google Scholar] [CrossRef] [Green Version]
- Kiesler, P.; Fuss, I.J.; Strober, W. Experimental Models of Inflammatory Bowel Diseases. Cell. Mol. Gastroenterol. Hepatol. 2015, 1, 154–170. [Google Scholar] [CrossRef] [PubMed] [Green Version]
- Westbrook, A.M.; Szakmary, A.; Schiestl, R.H. Retracted article: Mouse models of intestinal inflammation and cancer. Arch. Toxicol. 2016, 90, 2109–2130. [Google Scholar] [CrossRef]
- Elson, C.O.; Sartor, R.; Tennyson, G.S.; Riddell, R.H. Experimental models of inflammatory bowel disease. Gastroenterology 1995, 109, 1344–1367. [Google Scholar] [CrossRef]
- Antoniou, E.; Margonis, G.A.; Angelou, A.; Pikouli, A.; Argiri, P.; Karavokyros, I.; Papalois, A.; Pikoulis, E. The TNBS-induced colitis animal model: An overview. Ann. Med. Surg. 2016, 11, 9–15. [Google Scholar] [CrossRef]
- Silva, I.; Pinto, R.; Mateus, V. Preclinical Study in Vivo for New Pharmacological Approaches in Inflammatory Bowel Dis-ease: A Systematic Review of Chronic Model of TNBS-Induced Colitis. J. Clin. Med. 2019, 8, 1574. [Google Scholar] [CrossRef] [PubMed] [Green Version]
- Wirtz, S.; Popp, V.; Kindermann, M.; Gerlach, K.; Weigmann, B.; Fichtner-Feigl, S.; Neurath, M.F. Chemically induced mouse models of acute and chronic intestinal inflammation. Nat. Protoc. 2017, 12, 1295–1309. [Google Scholar] [CrossRef] [PubMed]
- Mateus, V.; Rocha, J.; Alves, P.; Mota-Filipe, H.; Sepodes, B.; Pinto, R.M.A. Anti-Inflammatory Effect of Erythropoietin in the TNBS-induced Colitis. Basic Clin. Pharmacol. Toxicol. 2016, 120, 138–145. [Google Scholar] [CrossRef] [PubMed]
- Mateus, V.; Rocha, J.; Alves, P.; Mota-Filipe, H.; Sepodes, B.; Pinto, R. Thiadiazolidinone-8 Ameliorates Inflammation Associated with Experimental Colitis in Mice. Pharmacology 2018, 101, 35–42. [Google Scholar] [CrossRef]
- Mateus, V.; Rocha, J.; Mota-Filipe, H.; Sepodes, B.; Pinto, R. Hemin reduces inflammation associated with TNBS-induced colitis. Clin. Exp. Gastroenterol. 2018, 11, 325–334. [Google Scholar] [CrossRef] [PubMed] [Green Version]
- Bilsborough, J.M.; Fiorino, M.F.; Henkle, B.W. Select animal models of colitis and their value in predicting clinical efficacy of biological therapies in ulcerative colitis. Expert Opin. Drug Discov. 2021, 16, 567–577. [Google Scholar] [CrossRef] [PubMed]
- Morris, G.P.; Beck, P.L.; Herridge, M.; Depew, W.T.; Szewczuk, M.R.; Wallace, J.L. Hapten-Induced Model of Chronic Inflammation and Ulceration in the Rat Colon. Gastroenterology 1989, 96, 795–803. [Google Scholar] [CrossRef]
- Bang, B.; Lichtenberger, L.M. Methods of Inducing Inflammatory Bowel Disease in Mice. Curr. Protoc. Pharmacol. 2016, 72, 5–58. [Google Scholar] [CrossRef] [PubMed]
- Scheiffele, F.; Fuss, I.J. Induction of TNBS Colitis in Mice. Curr. Protoc. Immunol. 2002, 49, 15–19. [Google Scholar] [CrossRef] [PubMed]
- Neurath, M.F.; Fuss, I.; Kelsall, B.L.; Stüber, E.; Strober, W. Antibodies to interleukin 12 abrogate established experimental colitis in mice. J. Exp. Med. 1995, 182, 1281–1290. [Google Scholar] [CrossRef] [PubMed] [Green Version]
- Elson, C.O.; Beagley, K.W.; Sharmanov, A.T.; Fujihashi, K.; Kiyono, H.; Tennyson, G.S.; Cong, Y.; Black, C.A.; Ridwan, B.W.; McGhee, J.R. Hapten-induced model of murine inflammatory bowel disease: Mucosa immune responses and protection by tolerance. J. Immunol. 1996, 157, 2174–2185. [Google Scholar] [PubMed]
- Cuzzocrea, S.; Mazzon, E.; di Paola, R.; Patel, N.; Genovese, T.; Muià, C.; De Sarro, A.; Thiemermann, C. Erythropoietin Reduces the Development of Experimental Inflammatory Bowel Disease. J. Pharmacol. Exp. Ther. 2004, 311, 1272–1280. [Google Scholar] [CrossRef] [PubMed]
- Motavallian-Naeini, A.; Andalib, S.; Rabbani, M.; Mahzouni, P.; Afsharipour, M.; Minaiyan, M. Validation and optimization of experimental colitis induction in rats using 2, 4, 6-trinitrobenzene sulfonic acid. Res. Pharm. Sci. 2012, 7, 159–169. [Google Scholar] [PubMed]
- Majewska-Szczepanik, M.; Góralska, M.; Marcińska, K.; Zemelka-Wiącek, M.; Strzępa, A.; Dorożyńska, I.; Szczepanik, M. Epicutaneous immunization with protein antigen TNP-Ig alleviates TNBS-induced colitis in mice. Pharmacol. Rep. 2012, 64, 1497–1504. [Google Scholar] [CrossRef] [Green Version]
- Keates, A.C.; Castagliuolo, I.; Cruickshank, W.W.; Qiu, B.; Arseneau, K.O.; Brazer, W.; Kelly, C.P. Interleukin 16 is up-regulated in Crohn’s disease and participates in TNBS colitis in mice. Gastroenterology 2000, 119, 972–982. [Google Scholar] [CrossRef] [PubMed]
- Engel, M.A.; Neurath, M.F. New pathophysiological insights and modern treatment of IBD. J. Gastroenterol. 2010, 45, 571–583. [Google Scholar] [CrossRef] [PubMed]
- Neurath, M.F. Animal Models of Inflammatory Bowel Diseases: Illuminating the Pathogenesis of Colitis, Ileitis and Cancer. Dig. Dis. 2012, 30, 91–94. [Google Scholar] [CrossRef] [PubMed] [Green Version]
- Popp, V.; Gerlach, K.; Mott, S.; Turowska, A.; Garn, H.; Atreya, R.; Lehr, H.-A.; Ho, I.-C.; Renz, H.; Weigmann, B.; et al. Rectal Delivery of a DNAzyme That Specifically Blocks the Transcription Factor GATA3 and Reduces Colitis in Mice. Gastroenterology 2017, 152, 176–192.e5. [Google Scholar] [CrossRef] [PubMed]
- Seibel, J.; Molzberger, A.F.; Hertrampf, T.; Laudenbach-Leschowski, U.; Diel, P. Oral treatment with genistein reduces the expression of molecular and biochemical markers of inflammation in a rat model of chronic TNBS-induced colitis. Eur. J. Nutr. 2009, 48, 213–220. [Google Scholar] [CrossRef] [PubMed]
- Gionchetti, P.; Rizzello, F.; Annese, V.; Armuzzi, A.; Biancone, L.; Castiglione, F.; Comberlato, M.; Cottone, M.; Danese, S.; Daperno, M.; et al. Use of corticosteroids and immunosuppressive drugs in inflammatory bowel disease: Clinical practice guidelines of the Italian Group for the Study of Inflammatory Bowel Disease. Dig. Liver Dis. 2017, 49, 604–617. [Google Scholar] [CrossRef] [PubMed] [Green Version]
- Carty, E.; De Brabander, M.; Feakins, R.M.; Rampton, D.S. Measurement of in vivo rectal mucosal cytokine and eicosanoid production in ulcerative colitis using filter paper. Gut 2000, 46, 487–492. [Google Scholar] [CrossRef] [PubMed] [Green Version]
- Nairz, M.; Schroll, A.; Moschen, A.; Sonnweber, T.; Theurl, M.; Theurl, I.; Taub, N.; Jamnig, C.; Neurauter, D.; Huber, L.A.; et al. Erythropoietin contrastingly affects bacterial infection and experimental colitis by inhibiting nuclear factor-kB-inducible immune pathways. Immunity 2011, 34, 61–74. [Google Scholar] [CrossRef] [PubMed] [Green Version]
- Paunovic, B.; Deng, X.; Khomenko, T.; Ahluwalia, A.; Tolstanova, G.; Tarnawski, A.; Szabo, S.; Sandor, Z. Molecular Mechanisms of Basic Fibroblast Growth Factor Effect on Healing of Ulcerative Colitis in Rats. J. Pharmacol. Exp. Ther. 2011, 339, 430–437. [Google Scholar] [CrossRef] [PubMed] [Green Version]
- Műzes, G.; Molnár, B.; Tulassay, Z.; Sipos, F. Changes of the cytokine profile in inflammatory bowel diseases. World J. Gastroenterol. 2012, 18, 5848–5861. [Google Scholar] [CrossRef] [PubMed] [Green Version]
- Xiong, J.; Lin, Y.-H.; Bi, L.-H.; Wang, J.-D.; Bai, Y.; Liu, S.-D. Effects of Interleukin-4 or Interleukin-10 gene therapy on trinitrobenzenesulfonic acid-induced murine colitis. BMC Gastroenterol. 2013, 13, 165. [Google Scholar] [CrossRef] [PubMed] [Green Version]
- Leach, M.W.; Davidson, N.J.; Fort, M.M.; Powrie, F.; Rennick, D.M. The Role of IL-10 in Inflammatory Bowel Disease: “Of Mice and Men”. Toxicol. Pathol. 1999, 27, 123–133. [Google Scholar] [CrossRef] [PubMed]
- Marlow, G.; Ellett, S.; Ferguson, I.R.; Zhu, S.; Karunasinghe, N.; Jesuthasan, A.C.; Han, D.Y.; Fraser, A.G.; Ferguson, L.R. Transcriptomics to study the effect of a Mediterranean-inspired diet on inflammation in Crohn’s disease patients. Hum. Genom. 2013, 7, 24. [Google Scholar] [CrossRef] [PubMed] [Green Version]
- Gonzalez-Rey, E.; Fernandez-Martin, A.; Chorny, A.; Delgado, M. Therapeutic effect of urocortin and adrenomedullin in a murine model of Crohn’s disease. Gut 2006, 55, 824–832. [Google Scholar] [CrossRef] [PubMed]
- Zhao, H.-M.; Xu, R.; Huang, X.-Y.; Cheng, S.-M.; Huang, M.-F.; Yue, H.-Y.; Wang, X.; Zou, Y.; Lu, A.-P.; Liu, D.-Y. Curcumin improves regulatory T cells in gut-associated lymphoid tissue of colitis mice. World J. Gastroenterol. 2016, 22, 5374–5383. [Google Scholar] [CrossRef] [PubMed]
- Seamons, A.; Treuting, P.M.; Brabb, T.; Maggio-Price, L. Characterization of Dextran Sodium Sulfate-Induced Inflammation and Colonic Tumorigenesis in Smad3−/− Mice with Dysregulated TGFβ. PLoS ONE 2013, 8, e79182. [Google Scholar] [CrossRef] [PubMed]


Publisher’s Note: MDPI stays neutral with regard to jurisdictional claims in published maps and institutional affiliations. |
© 2022 by the authors. Licensee MDPI, Basel, Switzerland. This article is an open access article distributed under the terms and conditions of the Creative Commons Attribution (CC BY) license (https://creativecommons.org/licenses/by/4.0/).
Share and Cite
Silva, I.; Solas, J.; Pinto, R.; Mateus, V. Chronic Experimental Model of TNBS-Induced Colitis to Study Inflammatory Bowel Disease. Int. J. Mol. Sci. 2022, 23, 4739. https://doi.org/10.3390/ijms23094739
Silva I, Solas J, Pinto R, Mateus V. Chronic Experimental Model of TNBS-Induced Colitis to Study Inflammatory Bowel Disease. International Journal of Molecular Sciences. 2022; 23(9):4739. https://doi.org/10.3390/ijms23094739
Chicago/Turabian StyleSilva, Inês, João Solas, Rui Pinto, and Vanessa Mateus. 2022. "Chronic Experimental Model of TNBS-Induced Colitis to Study Inflammatory Bowel Disease" International Journal of Molecular Sciences 23, no. 9: 4739. https://doi.org/10.3390/ijms23094739
APA StyleSilva, I., Solas, J., Pinto, R., & Mateus, V. (2022). Chronic Experimental Model of TNBS-Induced Colitis to Study Inflammatory Bowel Disease. International Journal of Molecular Sciences, 23(9), 4739. https://doi.org/10.3390/ijms23094739