Article

Overexpression of Soybean GmWRI1a Stably Increases the Seed Oil Content in Soybean

Key Laboratory of Soybean Biology of Ministry of Education China, Key Laboratory of Soybean Biology and Breeding (Genetics) of Ministry of Agriculture and Rural Affairs, Northeast Agricultural University, Harbin 150030, China
*
Authors to whom correspondence should be addressed.
These authors contributed equally to this work.
Int. J. Mol. Sci. 2022, 23(9), 5084; https://doi.org/10.3390/ijms23095084
Submission received: 2 April 2022 / Revised: 27 April 2022 / Accepted: 29 April 2022 / Published: 3 May 2022
(This article belongs to the Section Molecular Plant Sciences)

Abstract

:
WRINKLED1 (WRI1), an APETALA2/ethylene-responsive-element-binding protein (AP2/EREBP) subfamily transcription factor, plays a crucial role in the transcriptional regulation of plant fatty acid biosynthesis. In this study, GmWRI1a was overexpressed in the soybean cultivar ‘Dongnong 50’ using Agrobacterium-mediated transformation to generate three transgenic lines with high seed oil contents. PCR and Southern blotting analysis showed that the T-DNA was inserted into the genome at precise insertion sites and was stably inherited by the progeny. Expression analysis using qRT-PCR and Western blotting indicated that GmWRI1a and bar driven by the CaMV 35S promoter were significantly upregulated in the transgenic plants at different developmental stages. Transcriptome sequencing results showed there were obvious differences in gene expression between transgenic line and transgenic receptor during seed developmental stages. KEGG analysis found that the differentially expressed genes mainly annotated to metabolic pathways, such as carbohydrated metabolism and lipid metabolism. A 2-year single-location field trial revealed that three transgenic lines overexpressing GmWRI1a (GmWRI1a-OE) showed a stable increase in seed oil content of 4.97–10.35%. Importantly, no significant effect on protein content and yield was observed. Overexpression of GmWRI1a changed the fatty acid composition by increasing the linoleic acid (C18:2) content and decreasing the palmitic acid (C16:0) content in the seed. The three GmWRI1a-OE lines showed no significant changes in agronomic traits. The results demonstrated that the three GmWRI1a overexpression lines exhibited consistent increases in seed oil content compared with that of the wild type and did not significantly affect the seed yield and agronomic traits. The genetic engineering of GmWRI1a will be an effective strategy for the improvement of seed oil content and value in soybean.

1. Introduction

The demand for vegetable oils is increasing, owing to rising consumption for food uses and biodiesel production [1]. By 2050, the global demand for vegetable oils is expected to be more than double the current production [2]. Therefore, enhancing the oil content of oilseed crops without expansion of the cultivation area is an appropriate strategy to enhance oil yield. Soybean (Glycine max (L.) Merr.) is the world’s second-largest source of vegetable oil and accounts for 27% of global vegetable oil production [3]. The highest reported seed oil content is 27.9% within the U.S. Department of Agriculture soybean germplasm collection, which is relatively low compared with that of sesame (60%), although the lipid biosynthetic pathway is similar [4,5]. Thus, there is scope for using genetic engineering to elevate the seed oil content in soybean.
Improvement of oil traits by conventional plant breeding methods, such as pure-line selection and mutation breeding, is limited by the genetic variation currently available in soybean germplasm. Furthermore, oil yield is a quantitative trait controlled by multiple genes and is strongly influenced by the environment, and hence is difficult to manipulate [6,7]. The identification of genes associated with lipid biosynthesis and its regulation has enabled the application of genetic engineering strategies to enhance the seed oil content of soybean. Overexpression of a single gene that encodes an enzyme of the fatty acid and triacylglycerol (TAG) biosynthetic pathways may not achieve significant enhancement in seed oil yield [8,9,10]. In contrast, transcription factors, which simultaneously regulate the activities of numerous enzymes in the fatty acid biosynthesis pathway, have triggered considerable research interest [11,12,13,14,15].
WRINKLED 1 (WRI1) is an APETALA2/ethylene-responsive-element-binding protein (AP2/EREBP) subfamily transcription factor that directly or indirectly targets several enzymes involved in the late glycolysis and plastidial fatty acid biosynthetic network [16,17,18]. In wri1 mutant lines of Arabidopsis, the lack of transcriptional activation of the fatty acid biosynthetic pathway in early maturing embryos results in an 80% reduction in seed oil content and wrinkled seeds [19]. However, overexpression of AtWRI1 or other WRI1 orthologs leads to an increase in seed oil content in transgenic plants, such as Arabidopsis, Brassica napus, Camelina sativa, Zea mays, Brachypodium distachyon, and Glycine max [17,20,21,22,23,24,25,26,27]. This effect suggests that the role of WRI1 in oil accumulation is highly conserved in monocotyledonous and dicotyledonous plants. Thus, these studies offer a strategy to enhance oil synthesis by means of WRI1 engineering.
To date, the effectiveness of increasing the seed oil content of soybean by overexpression of GmWRI1 has been variable [26,27,28]. However, these studies only reported data from 1 year for seed oil content in transgenic soybean. To produce a new, genetically stable germplasm with high oil content to incorporate into soybean breeding programs and to demonstrate consistent elevation in oil content, stable transgenic soybean plants overexpressing GmWRI1a (GmWRI1a-OE) were generated in this study. The molecular genetic stability of the plants and the stability of the enhanced oil traits were analyzed, the transcriptomes of the transgenic line was sequenced and compared with wild-type seeds, and the phenotype of GmWRI1a-OE soybean lines derived from three transgenic events were observed in a single-location field trial over 2 years. Three stable transgenic lines were selected from five transgenic events, and homozygous T4 populations were raised. Bioassays confirmed that each of these stable transgenic lines continued to display significant elevation in seed oil content. The data presented support the viability of breeding for increased seed oil content by enhancing GmWRI1a expression in soybean.

2. Results

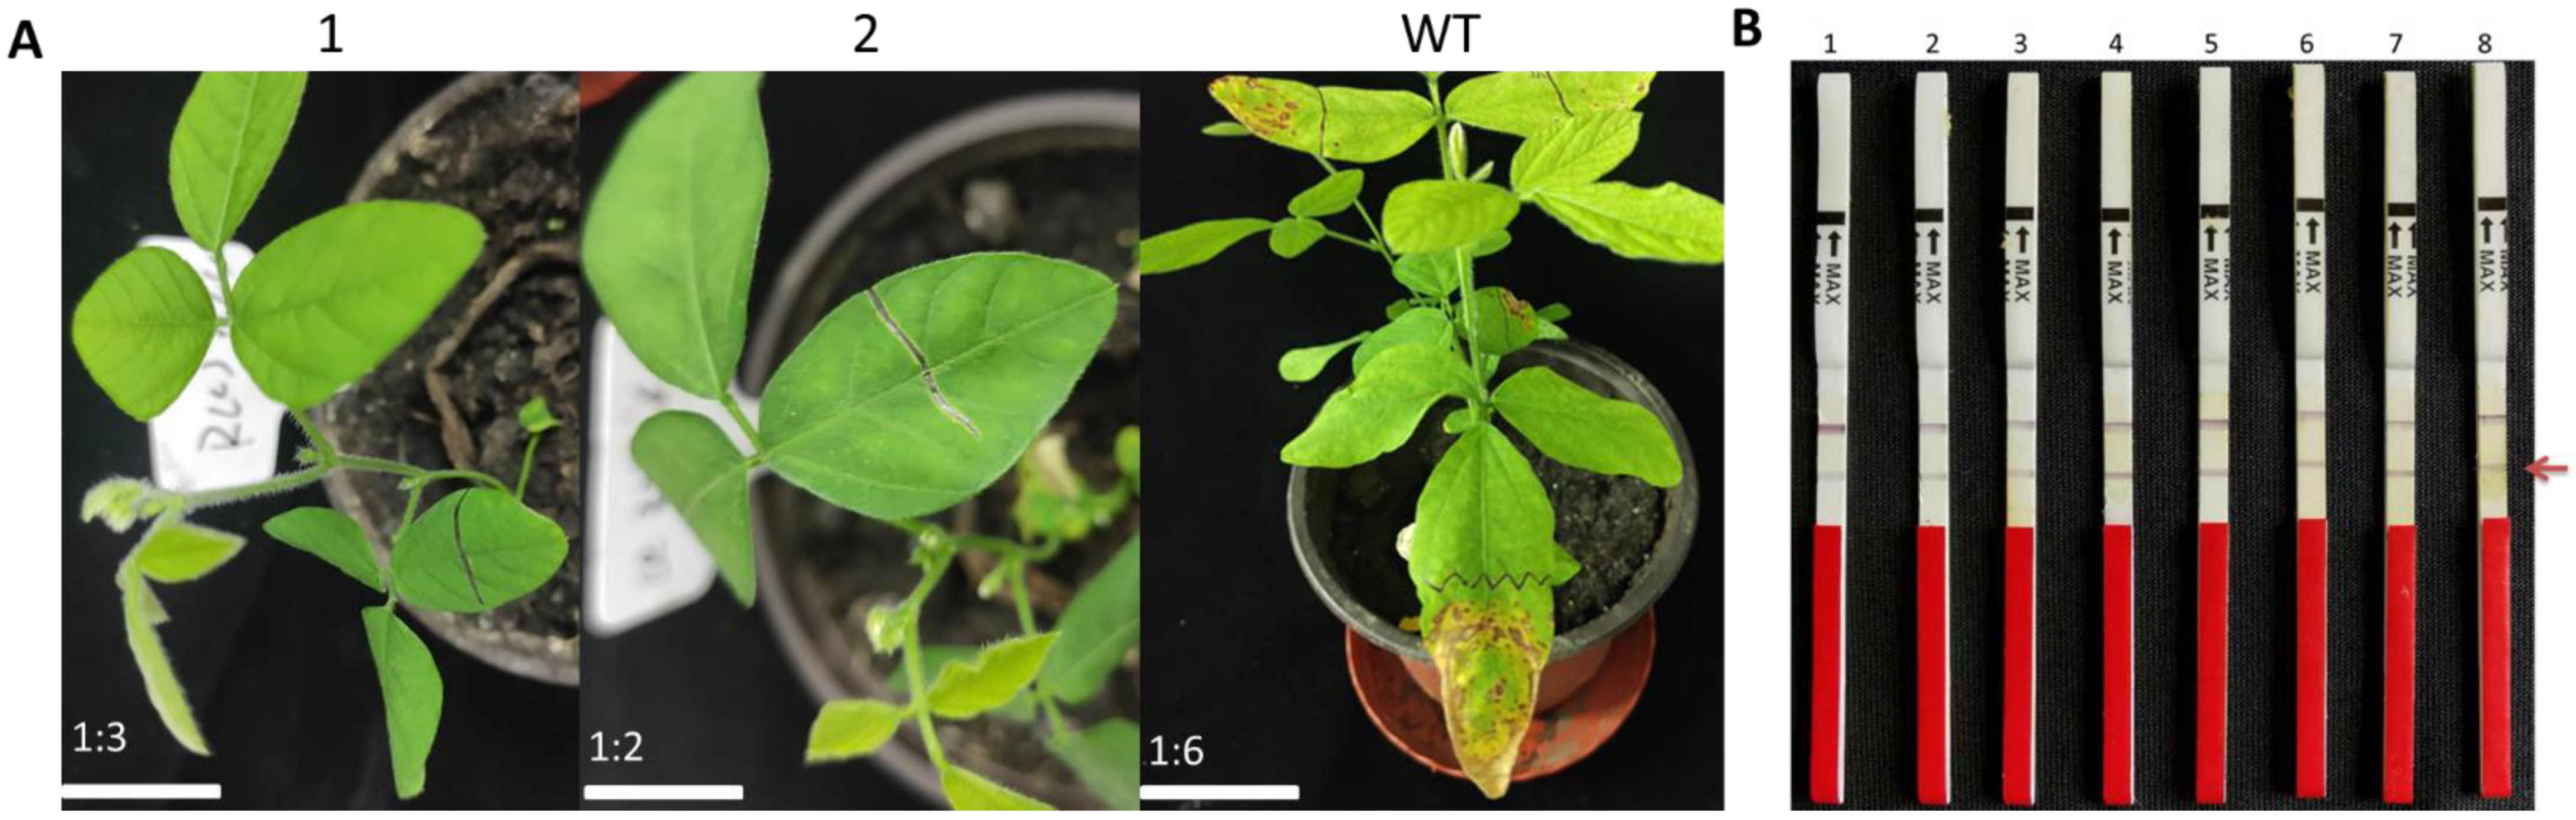
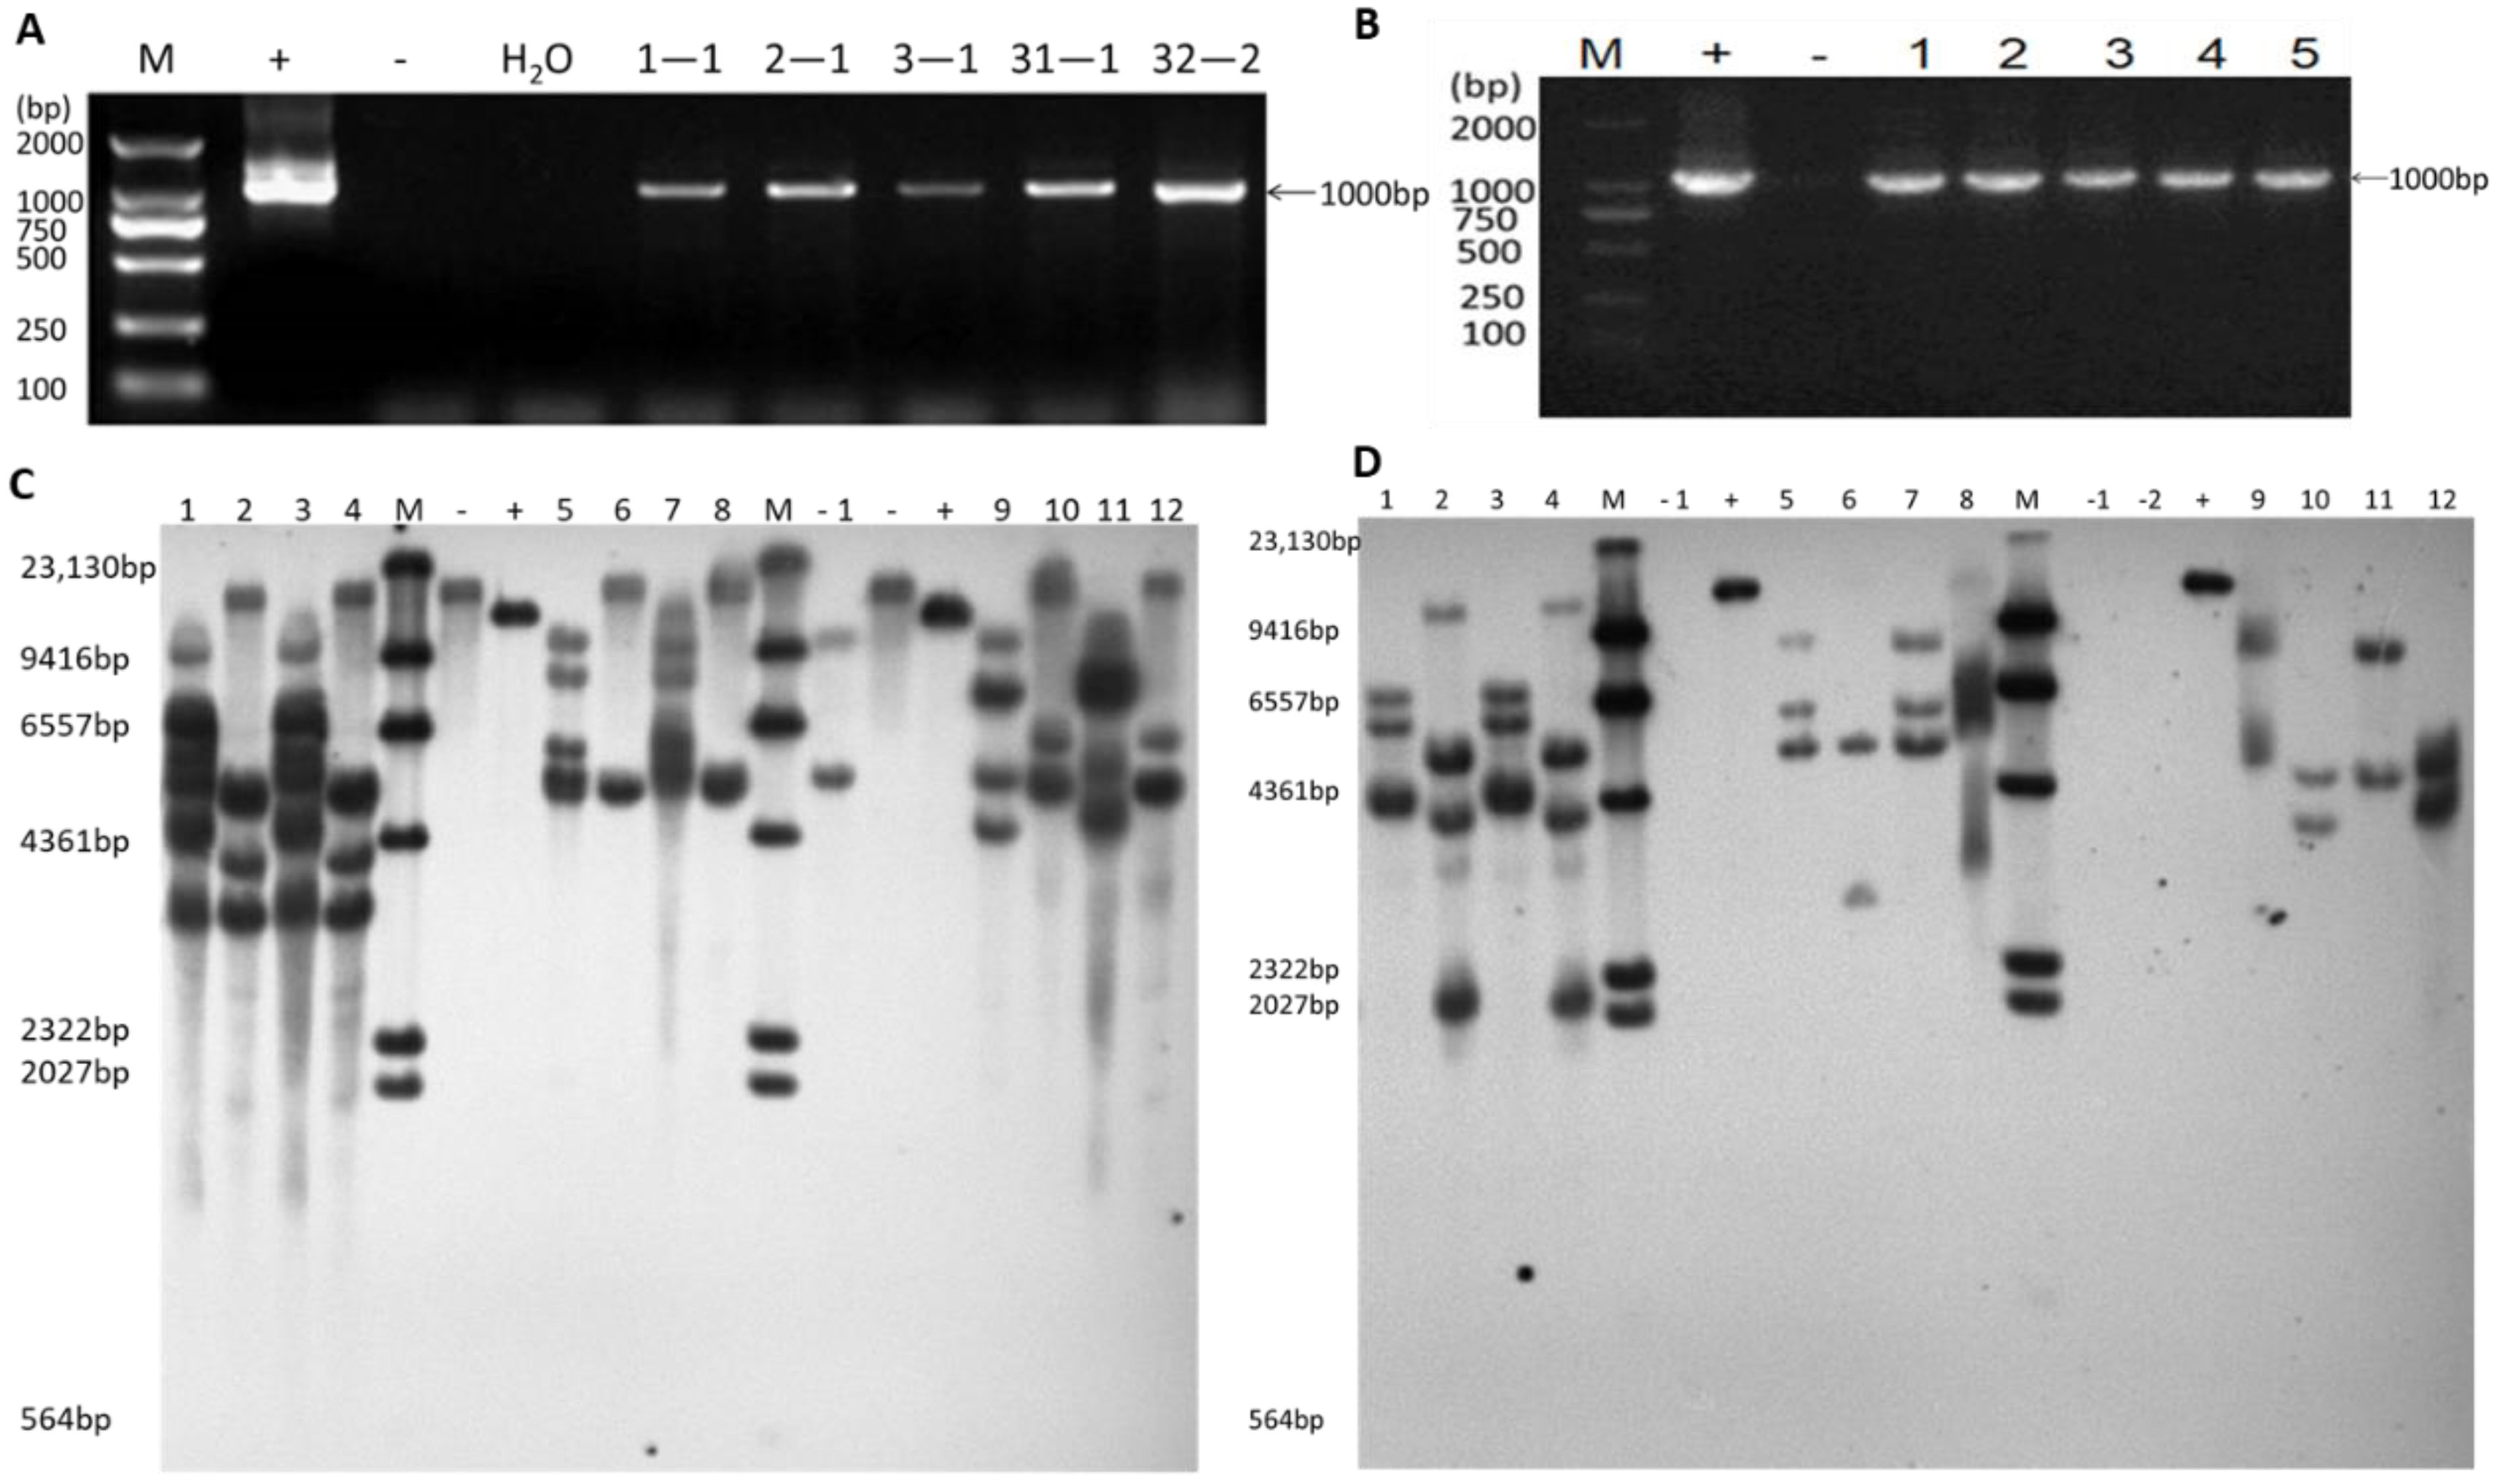
2.1. Identification of Transgene-Positive Plants and Quantification of Inserted Copy Number

Cotyledons from the conventional soybean cultivar Dongnong50 (DN50) were transformed via an Agrobacterium-mediated soybean cotyledonary node transformation system, with the 35S:GmWRI1a construct (Figure 1). Eight transgene-positive T0 plants were identified by painting fully expanded leaves with a 1:1000 diluted solution of the herbicide Basta (135 g L−1) (Figure A1A) and the LibertyLink strip (Figure A1B). The specific PCR products of the bar gene and CaMV 35S promoter region (about 1000 bp) were amplified from the T1 and T2 transgenic plants (Table A1). However, under the same conditions, no PCR products were amplified for DN50. These results indicated that bar was transformed into soybean and was stably inherited by the progeny (Figure 2A,B). Three GmWRI1a-OE lines (3-1, 32-2, and 31-1) were selected to evaluate the effect of GmWRI1a insertion in the soybean genome. Stable integration of GmWRI1a and bar in the genome was further confirmed by Southern blotting analysis of T3 and T4 GmWRI1a-OE lines. Probing with GmWRI1a, there was three copies of 3-1 line after subtracting the copy number produced by DN50 when the genomic DNA was digested with Hind III and EcoR I, respectively; two copies and one copy of 31-1 line, respectively; and two copies of 32-2 line (Figure 2C). Furthermore, probing with bar, there was three copies and four copies of 3-1 line when the genomic DNA was digested with Hind III and EcoR I, respectively; three copies and two copies of 31-1 line, respectively; and two copies of 32-2 line (Figure 2D). The results showed that GmWRI1a and bar were integrated into the genome with low copy numbers and were stably transmitted to the next generation.

2.2. Identification of Integration Sites in GmWRI1a-OE Lines 3-1 and 31-1

To identify the putative insertion sites and the flanking sequences of the transgene as well as of partial vector fragments, whole genome sequencing and genetic analysis of the 3-1 and 31-1 transgenic lines were performed. The BLAST search results showed that the T-DNA fragment was likely inserted at 35,103,524 bp to 35,103,548 bp on chromosome 05 in transgenic line 3-1, which was a genomic spacer region between Glyma.05G158800.1 and Glyma.05G1589000.1. Moreover, the T-DNA fragment was likely inserted at 2,505,198 bp to 2,505,205 bp on chromosome 12 in transgenic line 31-1, which was near the upstream region of the promoter of Glyma.12G033200. Both insertion sites did not affect coding regions of functional genes.
To confirm the integration sites, PCR primers to amplify short fragments containing the genomic sequences flanking and the bar gene from 3-1 and 31-1 genomic DNA were designed, and then PCR analyses were conducted (Figure 3A,B, Table A1). The specific PCR products were amplified from 3-1 and 31-1 genomic DNA, as expected. However, no specific product was amplified from the WT DNA template (Figure 3C,D). The sequences of the amplified fragments from 3-1 and 31-1 were identical to those expected from the vector sequences (Figure A2A,B). In combination with the Southern blotting results, we determined that four copies of the T-DNA fragment were integrated at one site in chromosome 05 in the transgenic line 3-1, and three copies of the T-DNA fragment were integrated at one site in chromosome 12 of the transgenic line 31-1.

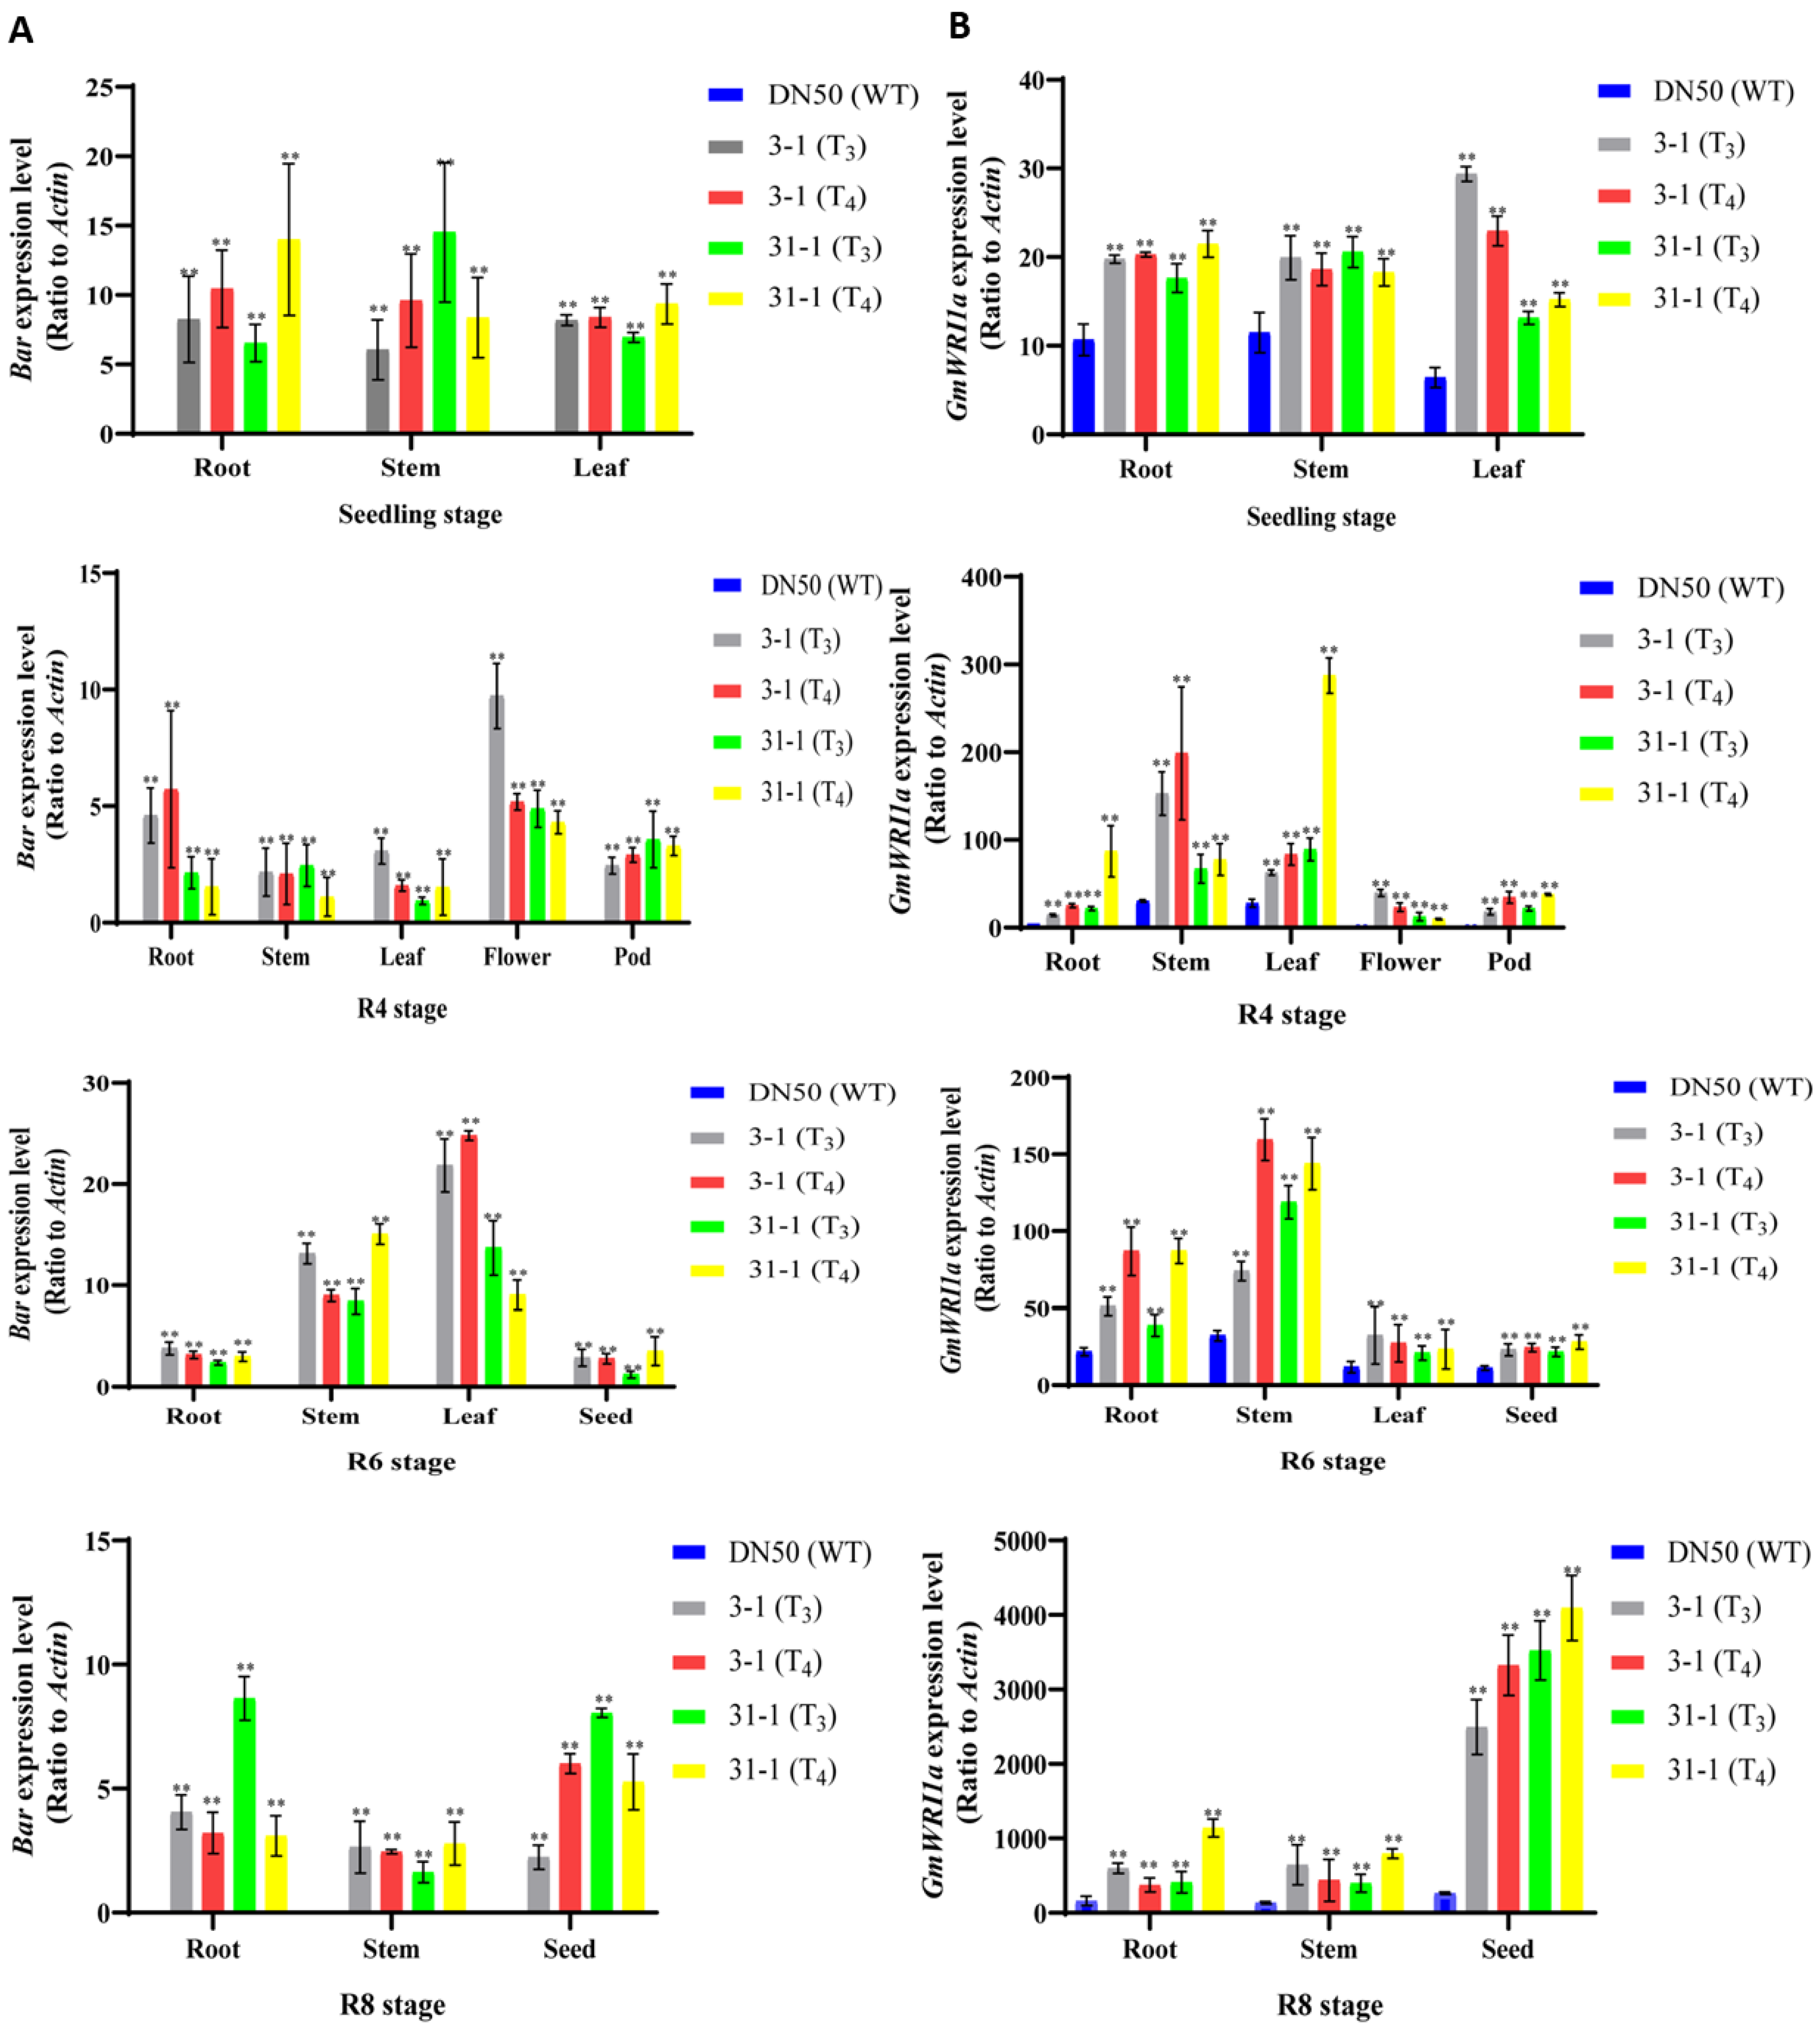
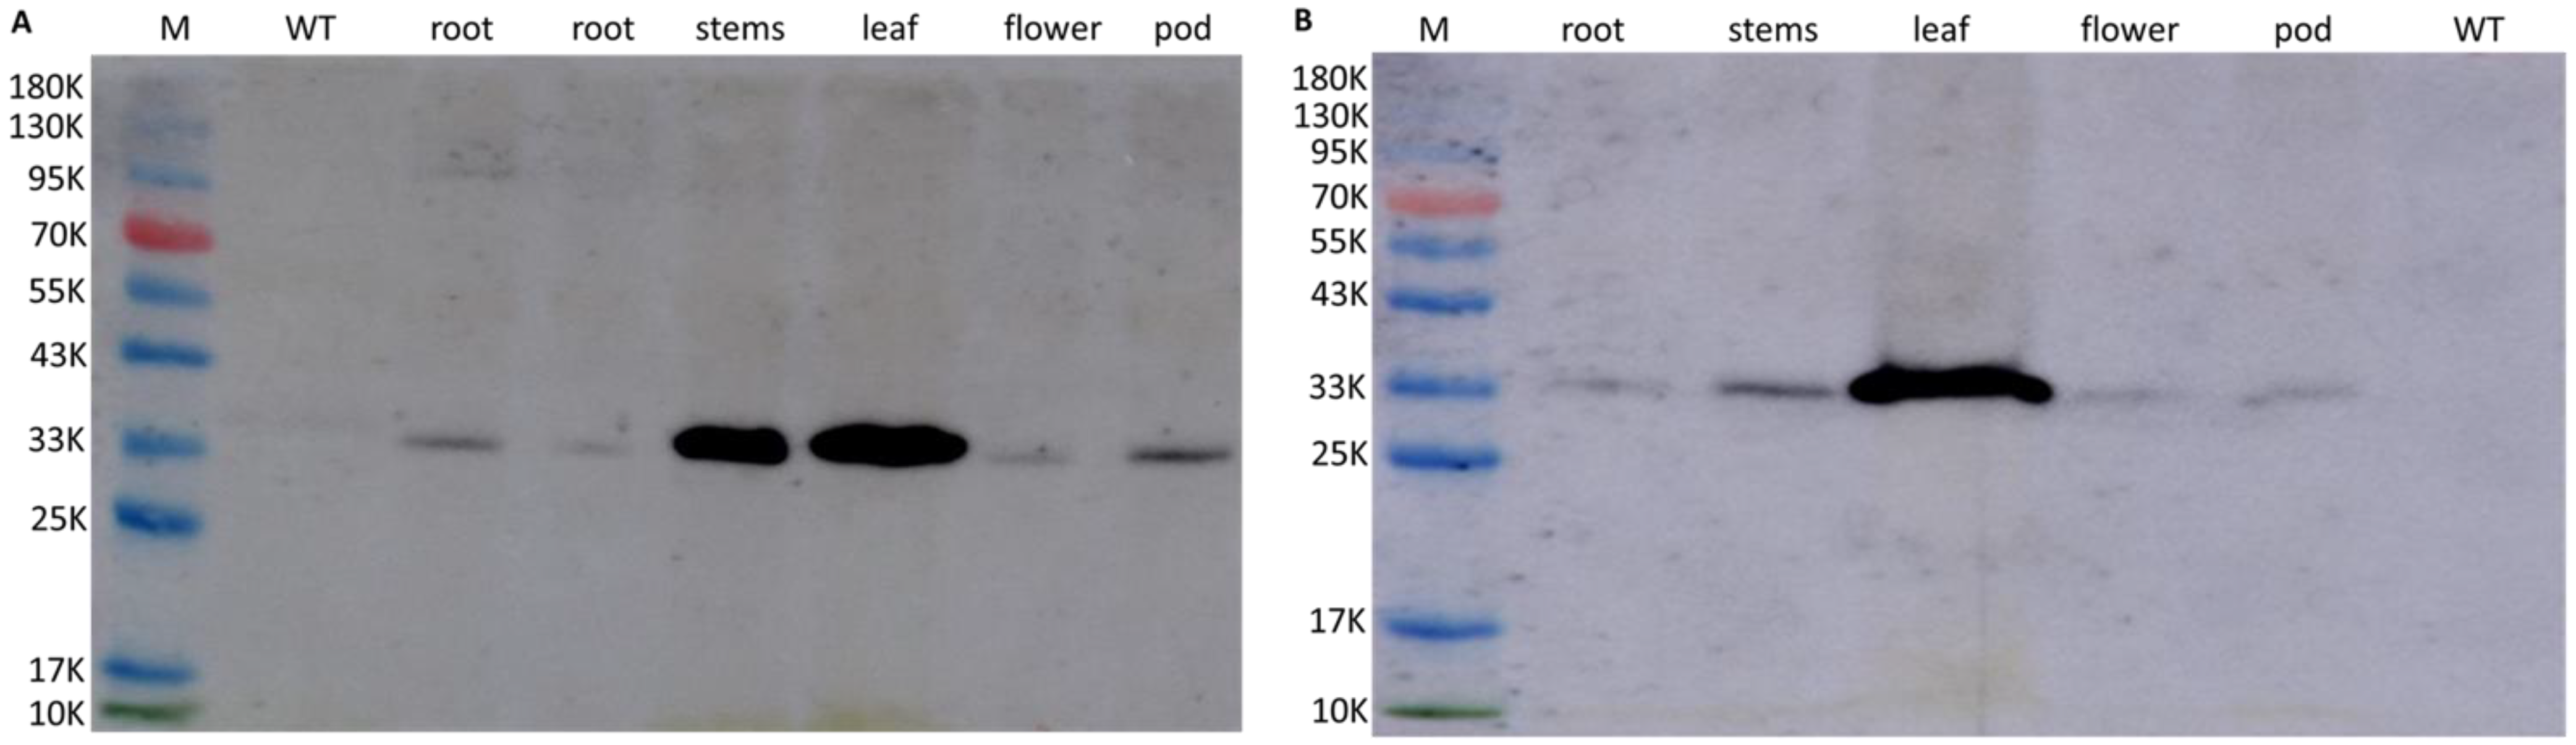
2.3. Expression Level of GmWRI1a and Bar in Transgenic Soybean Plants

Different organs at different developmental stages from T3 and T4 GmWRI1a-OE plants (lines 3-1 and 31-1) and the WT were collected for GmWRI1a and bar expression analysis (Figure 4A,B). GmWRI1a and bar were expressed in the root, node, leaf, flower, and pod at all developmental stages of T3 and T4 transgenic plants. The expression level of GmWRI1a was lowest at the seedling stage and thereafter increased in the 3-1 and 31-1 lines. At the R8 developmental stage, the expression level of GmWRI1a peaked in the seed of the 3-1 and 31-1 lines (Figure 4B). The increased expression of GmWRI1a in the seed at stage 8 in the transgenic lines 3-1 and 31-1 accorded with the function of WRI1, which regulates fatty acid biosynthesis and shows the highest expression level at advanced stages of seed development. The bar expression level in all organs at all developmental stages in the 3-1 and 31-1 lines was lower than that of GmWRI1a. The bar expression level was lowest at stage R4 among all developmental stages in the 31-1 line (Figure 4A). In contrast, the bar expression level was lowest at stage R8 in the 3-1 line. The increased expression of GmWRI1a and bar in the 3-1 and 31-1 transgenic lines might have been caused by the CaMV 35S promoter, which activated the genes constitutively.
To further confirm that the target genes were transformed into the genome and were expressed stably, accumulation of the BAR polypeptide in different organs of the 3-1 and 31-1 transgenic lines was verified by visualization of the band in an immunoblot analysis with antibodies to BAR, whereas the immunoreactive band was not detected among proteins isolated from the leaves of the WT (Figure 5A,B). These results indicated that GmWRI1a and bar were transformed into soybean and were expressed stably.

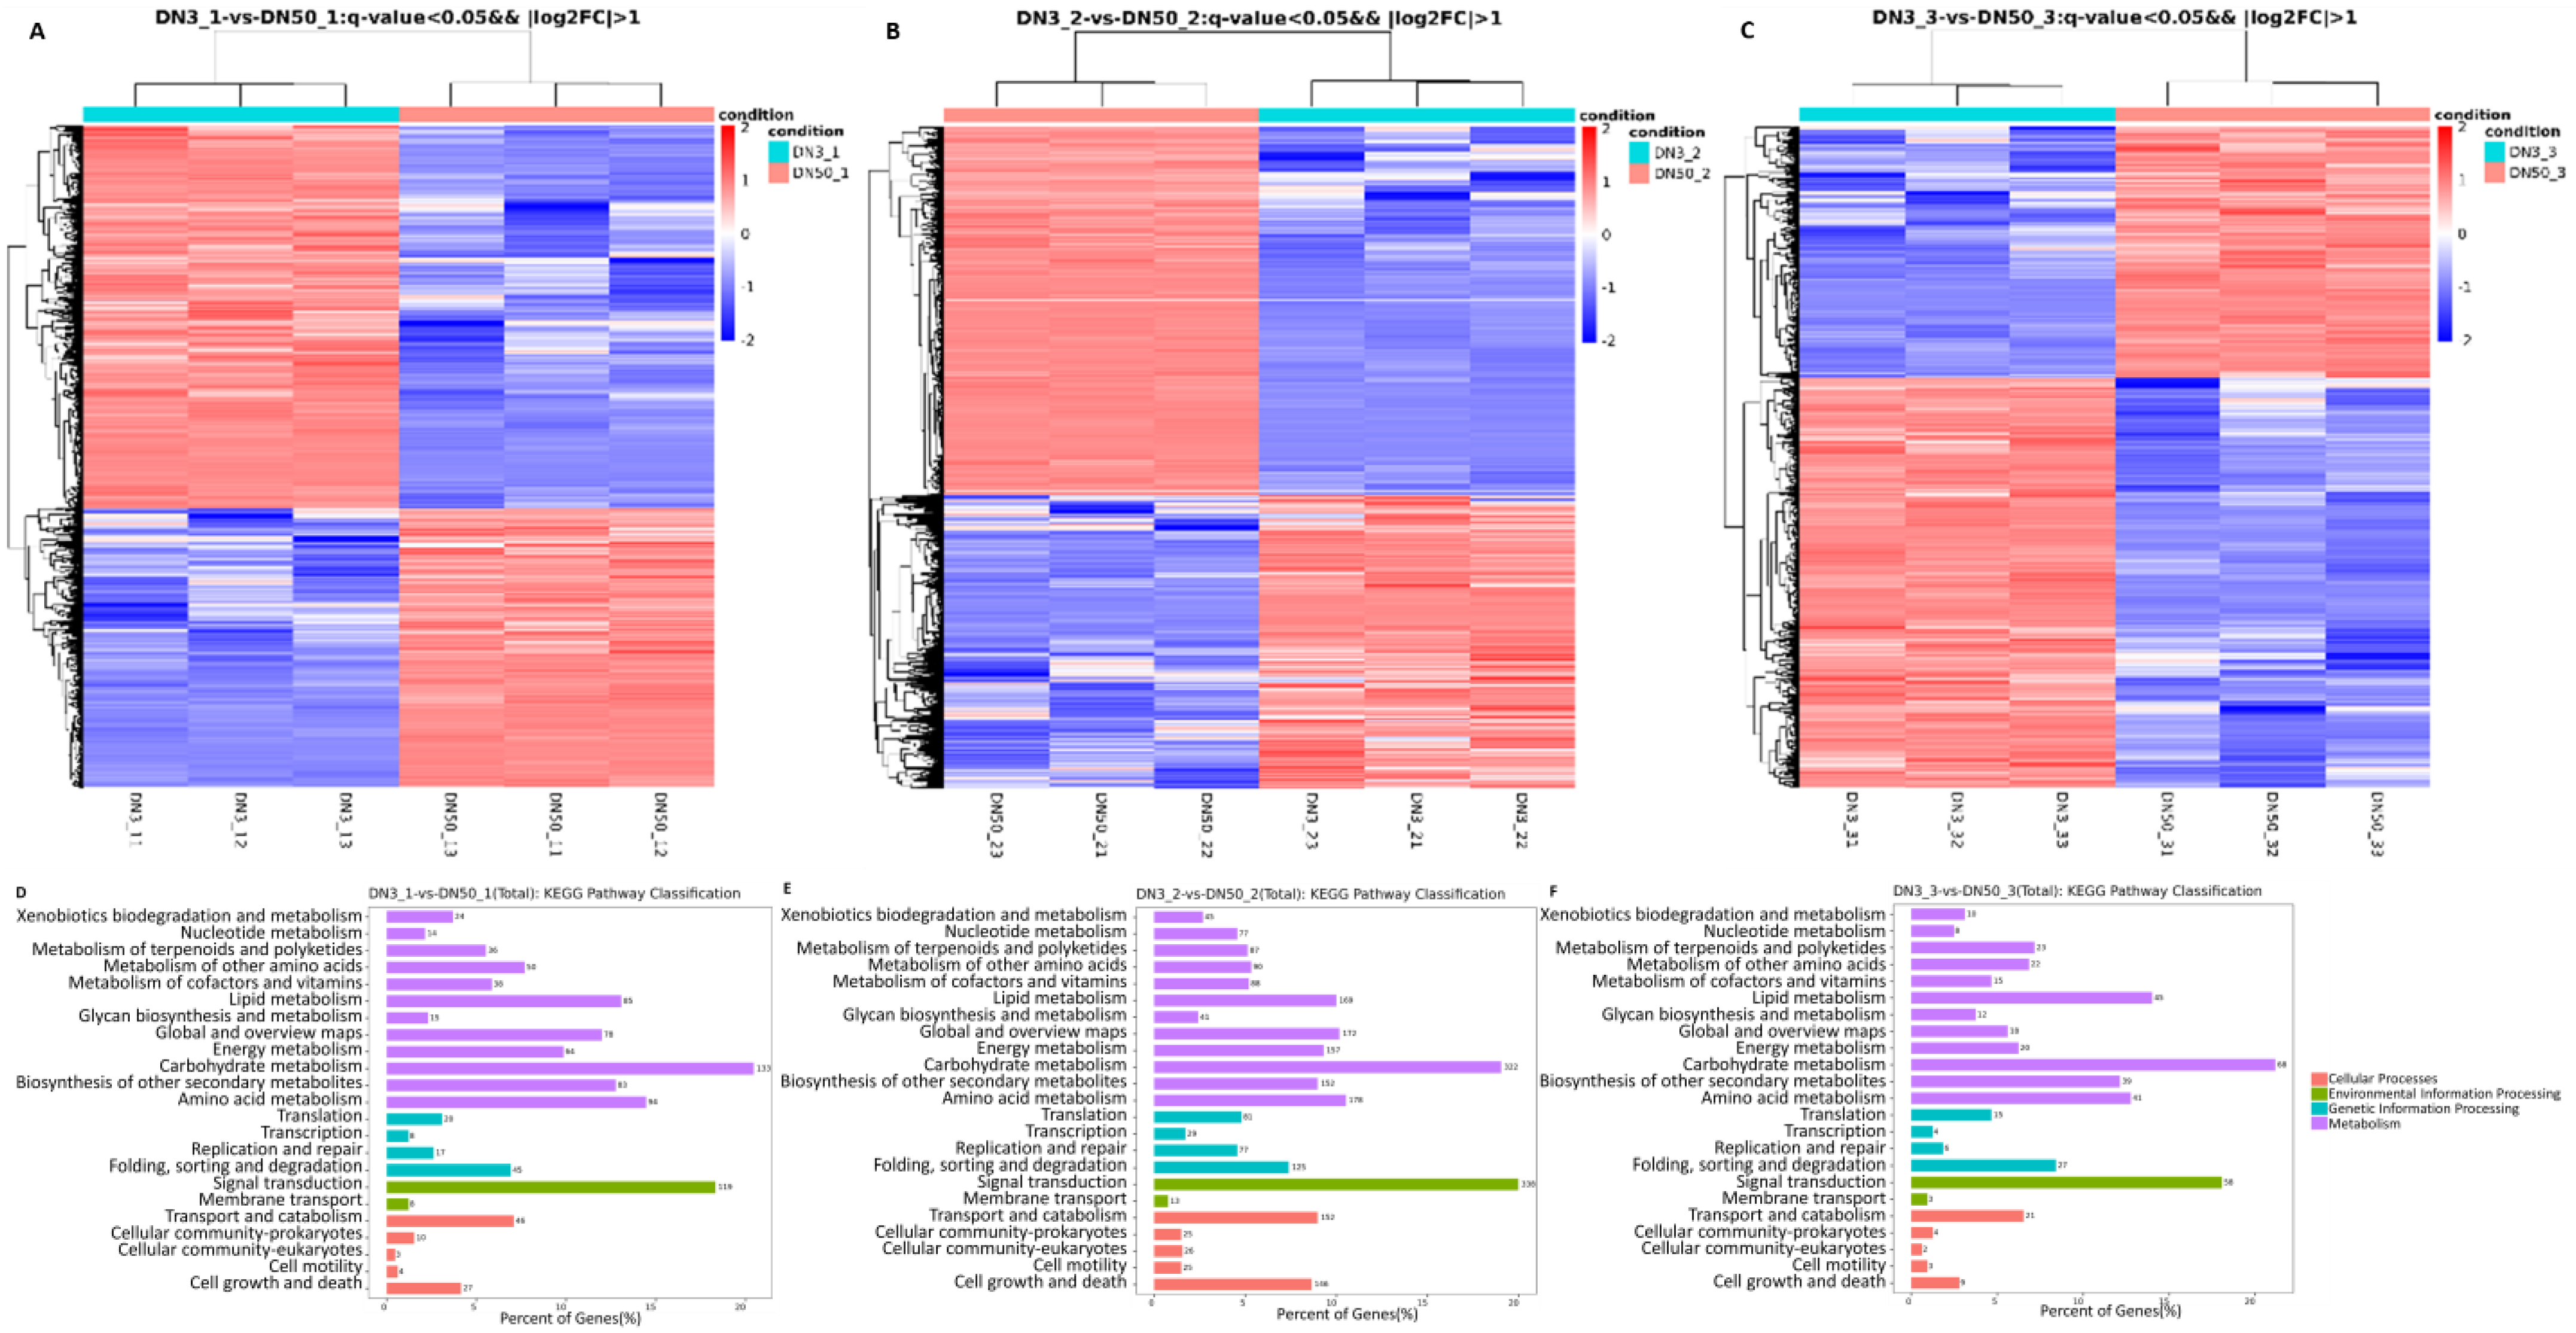
2.4. Transcriptome Sequencing Analysis

To investigate whether gene expression within transgenic soybean seed tissue is altered, RNA-Seq was used to survey gene expressoin in 3-1 and DN50 at three seed developmental stages. After raw read quality filtering, 127.31 Gb of clean sequence data (6.78–7.42 Gb clean reads for each sample) were obtained for nine samples. Using the soybean DN50 transcriptome as a reference genome, 94.58–96.82% of the clean reads were mapped to the reference genome. There were 3901, 9401, and 1743 differentially expressed genes at the 21 DAF, 28 DAF, and 42 DAF seed developmental stages, respectively, for transgenic soybean and the transgenic receptor DN50. To illustrate differences between the lines, heat maps were constructed showing expression values for 3901, 9401, and 1743 of the most differentially expressed genes at 21 DAF, 28 DAF, and 42 DAF deveolpmental stages in the transgenic soybean versus nontransgenic comparion (Figure 6A–C). Expression levels of the top differentially expressed genes in the transgenic line were different from that of the wild type at three seed developmental stages.
KEGG (Kyoto Encyclopedia of Genes and Genomes) pathway analysis showed that the differentially expressed genes were mainly involved in the cellular processes, environmental information processing, genetic information processing, and metabolism. Most of the differentially expressed genes belonged to metabolism pathways at three seed developmental stages. At 21 DAF, there were 133 differentially expressed genes involved in carbohydrated metabolism and 85 genes involved in lipid metabolism (Figure 6D). At 28 DAF, there were 322 differentially expressed genes involved in carbohydrated metabolism and 169 genes involved in lipid metabolism (Figure 6E). At 42 DAF, there were 68 diffrentially expressed genes involved in carbohydrated metabolism and 43 genes involved in lipid metabolism (Figure 6F). Moreover, the differentially expressed genes were also involved in signal transduction, amino acid metabolism, and biosynthesis of other secondary metabolisms.

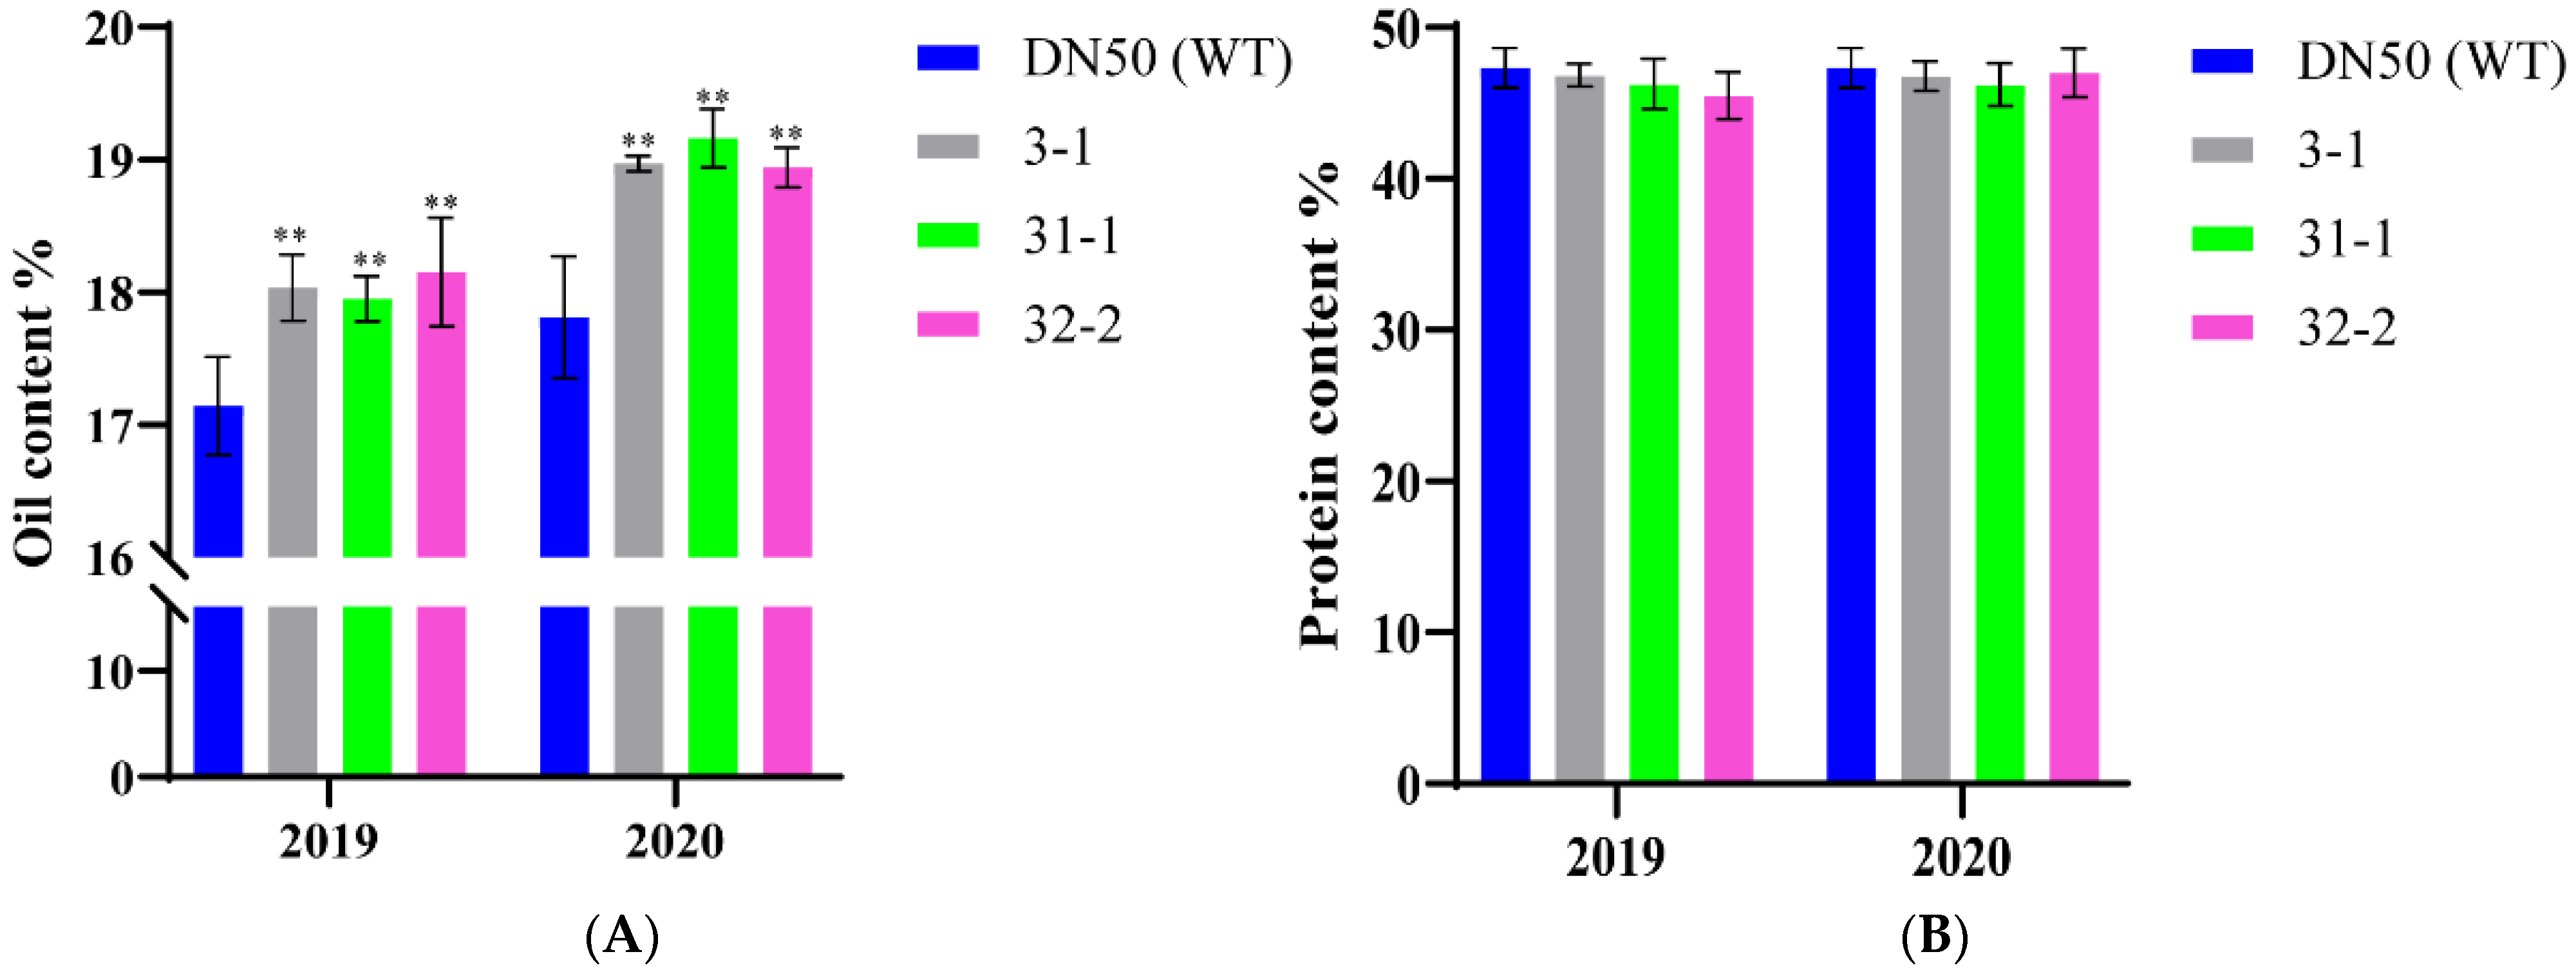
2.5. Seed Oil Content of Transgenic Plants Overexpressing GmWRI1a

The oil and protein contents of T3 and T4 homozygous GmWRI1a-OE plants grown under field conditions were measured and compared with those of WT plants at the Northeast Agricultural University Transgenic Biosafety Station in 2019 and 2020. Considering both generations, the seed oil content was increased by 4.97–10.35% in the three GmWRI1a-OE lines, which indicated generational stability of the seed oil phenotype (Figure 7A). An encouraging finding was that no major effect on protein content was observed in seeds of the transgenic lines (Figure 7B), which indicated that the transgene-associated increase in oil content did not cause a corresponding (1:1) decrease in protein content, in contrast to previous results obtained from traditional breeding.
To verify whether overexpression of GmWRI1a affects the fatty acid composition, the major fatty acid composition in seeds between the GmWRI1a-OE lines and WT plants were compared. A significant increase in linoleic acid (C18:2) content (p < 0.01) and a significant decrease in palmitic acid (C16:0) content (p < 0.01) were observed in seeds of the three GmWRI1a-OE lines (Table 1). These results suggested that overexpression of GmWRI1a increased the total oil content and changed the fatty acid composition in seeds of the three GmWRI1a-OE lines.

2.6. Agronomic Parameters under Field Conditions

To determine whether GmWRI1a overexpression altered the growth and agronomic traits of the transgenic lines, the three GmWRI1a-OE lines and WT plants were grown at the Transgenic Experimental Field of Northeast Agricultural University for 2 years (Figure 8). The results showed that the plant height, pod number, and seed number per plant of 32-2 (T4) line and the seed weight per 100 seeds of 31-1 (T4) line were altered compared with those of the WT in this study (Table 2). However, these agronomic traits did not show continuous and stable changes according to two-generation data. Therefore, we could not determine that GmWRI1a overexpression altered the agronomic traits of 32-2 and 31-1 transgenic lines.

3. Discussion

For enhancement of plant lipid production, three types of genetic engineering strategies can be employed, categorized as a ‘Push’ strategy (upregulation of fatty acid), a ‘Pull’ strategy (increasing TAG assembly), and the ‘Accumulation’ approach (enhancing TAG storage or inhibiting TAG breakdown) [29]. Overexpression of WRI1 is pivotal in the strategy, acting to upregulate (push) the de novo fatty acid pathway using a crucial transcription factor, combined with pulling the precursors toward the end products using rate-limiting enzymes, packaging TAG in oil bodies, and protecting TAG from degradation [30,31,32]. Transgenic plants overexpressing AtWRI1 or WRI1 orthologs have shown a significant increase in oil content in a number of studies [17,20,21,24,25,33,34]. In the present study, we developed three genetically stable transgenic soybean lines that overexpressed GmWRI1a. PCR and Southern blotting analysis of T3 and T4 transgenic lines confirmed that GmWRI1a had been integrated into the genome of transgenic receptor. The integration sites of the transgene cassette in the transgenic lines were rapidly identified by high-throughput sequencing of the genome. The foreign T-DNA integration sites of the 3-1 and 31-1 transgenic lines appeared to be genomic spacer regions, which did not affect coding regions of functional genes. This may have been the reason that GmWRI1a-OE plants were morphologically similar to WT plants under field conditions (Table 2). In combination with the results of Southern blotting, we determined that four copies of T-DNA fragments were integrated at one site in chromosome 05 in the 3-1 line, and three copies of T-DNA fragments were integrated into one site in chromosome 12 in the 31-1 line. Usually, genetic transformation using A. tumefaciens inserts a low number of copies in the host genome [35,36,37]. Low-copy-number transgenic events that show promising results for improvement of seed oil content are suitable for incorporation in breeding programs. Transformation events involving few transgene copies facilitate segregation in crosses to introduce a trait of interest into high-yielding cultivars aimed at the development of new commercial cultivars [38].
Using qRT-PCR, the expression levels of GmWRI1a and bar varied in different organs at different developmental stages in the transgenic lines, even though the genes were driven by the CaMV 35S promoter in all lines. Significantly higher expression levels of GmWRI1a were observed in the transgenic lines compared with that of the WT at advanced stages of seed development, which was consistent with the important role of GmWRI1 in soybean seed oil accumulation [28]. The expression levels of bar were higher at the seedling stage and lower at the R8 stage, which implied that bar is not involved in seed development. The reduced expression level of bar in the seed is favorable for safe human consumption of the seeds.
Previously, Chen et al. introduced the GmWRI1a gene driven by the seed-specific napin promoter into soybean cultivar Williams 82, and transgenic soybean seeds grown in greenhouse showed a significant increase compared to the WT [26]. In this study, the three genetically stable transgenic soybean lines, using the stronger CaMV 35S promoter to drive GmWRI1a expression, showed a significant increase in seed oil content. Moreover, the GmWRI1a was introduced into soybean cultivar DN50 that is a widely planted soybean cultivar in Northeast of China. The seed oil content in T3 plants was significantly higher than that of WT seeds. The seed oil content in the subsequent generation (T4) was similar to that in the preceding generation. Overexpression of GmWRI1a led to a more than 10% increase in seed oil content with no significant effect on protein content. So, the genetically stable transgenic lines obtained in this study could be directly applied to high-oil soybean breeding in Northeast of China.
In addition, overexpression of GmWRI1a changed the fatty acid composition of the seed. The transgenic seeds accumulated a higher content of linoleic acid (C18:2) than that of WT seeds. Unlike ZmWRI1 and WRI1 genes from other plant species [21]. Overexpression of GmWRI1 also upregulates genes encoding proteins involved in the late steps of TAG assembly in the endoplasmic reticulum, such as phosphatidylcholine diacylglycerol cholinephosphotransferase and lysophosphatidic acid acyltransferase, which likely activate acyl editing and production of more highly unsaturated-fatty-acid-containing TAGs [28]. Vogel et al. reported that the introduction of a seed-specific expression cassette carrying AtWRI1 into soybean led to levels of palmitate of up to approximately 20%, but no change in total oil levels [39]. However, An and Suh introduced the AtWRI1 gene driven by a seed-specific SiW6 promoter into Camelina sativa, wherein the expression of AtWRI1 caused an increase in total seed oil content by approximately 14% in transgenic lines compared to WT [24]. Moreover, the levels of oleic acid (C18:1) and eicosenoic acid (C20:1) were decreased, but there was an increase in the levels of linoleic acid (C18:2) and linolenic acid (C18:3) in transgenic lines compared to WT [24]. Heterologous expression of the same gene in variance plants may result in different results [24,40]. Even though AtWRI1 and GmWRI1 are higher homologously [26], they are both genes with different regulatory pathways in Arabidopsis and soybean [17,26,28]. Although both of them were introduced into soybean, the results obtained were not exactly similar. The exact differences and similarities of WRI1 transcriptional machinery among various plants still need to be further studied in the future.
Guo et al. reported that overexpression of GmWRI1b resulted in changes in the branch number and plant height [27]. However, in the present study, we did not observe stable changes in phenotypic traits in the 2-year experimental data. The difference may have been due to environmental influences or different insertion sites of the T-DNA. GmWRI1a can cause changes in phytohormone content and thus affect phenotypic traits, which will require further multi-year trials in the future to identify. Nevertheless, considering that the GmWRI1a-OE transgenic plants were morphologically similar to WT plants under field conditions (Table 2), it is highly likely that these transgenic lines could be used as important lines to breed new soybean cultivars with high seed oil content in the future.

4. Materials and Methods

4.1. Plant Materials

Soybean seeds of cultivars ‘Dongnong50’ (DN50) were provided by Key Laboratory of Soybean Biology in Chinese Ministry of Education, China.

4.2. Transformation and Identification of Transgene-Positive Plants

The expression cassette containing GmWRI1a was constructed using the pBI121 and pCAMBIA3300 vectors. These vectors are under the control of the constitutive promoter Cauliflower mosaic virus (CaMV) 35S and the nopaline synthase (NOS) terminator. Two marker genes are also present in the cassette structure: the bar gene, which encodes for phosphinothricin acetyl transferase (PAT) and confers resistance to the herbicide ammonium glufosinate, is used as a selective agent, and the NPTII gene, which encodes neomycin phosphotransferase and confers resistance to the antibiotic kanamycin, is used to select colonies containing the inserted transgene. The recombinant plasmid pCAMBIA3300-121-GmWRI1a was introduced into Agrobacterium tumefaciens strain EHA 105 by the freeze–thaw method and used for Agrobacterium-mediated transformation of the soybean cotyledonary node following a method described previously [9,41].
To detect transgenic plants harboring GmWRI1a, we performed LibertyLink strip analysis, Basta painting, PCR, and Southern blot analysis. The T0 transgenic plants were screened with Basta (135 g·L−1, 1:1000 (v/v) dilution); firstly, the regenerated plants that remained green compared with the WT were tested using the LibertyLink strip to determine the PAT protein content following the manufacturer’s instructions (Envirologix Inc., Portland, ME, USA). For T1 and T2 transgenic plants and wild-type soybean, PCR was conducted to amplify the bar gene and the CaMV 35S promoter using Bar+35S-specific primers (Table A1) to confirm T-DNA insertion. Genomic DNA was isolated using the Genomic DNA Purification Kit (Transgen Biotech, Beijing, China). The thermal cycling protocol comprised an initial denaturation at 94 °C for 3 min, followed by 30 cycles at 94 °C for 30 s, 64 °C for 30 s, and 72 °C for 1 min. After testing with Basta-resistance and PCR amplification, three GmWRI1a-OE lines (3-1, 31-1, and 32-2) were selected to be further identified by Southern blot analysis. Genomic DNA (30 µg) isolated from young leaves of homozygous T3 and T4 lines was digested with the restriction enzymes EcoRI and HindIII, respectively, at 37 °C overnight. Digested DNA was separated in 0.8% (w/v) agarose gel and blotted onto a Hybond N+ nylon membrane (Bio-Rad, Hercules, CA, USA) for hybridization. The sequence-specific fragment of the bar and GmWRI1a was DIG-labeled as the probe using the DIG-High Prime DNA Labeling and Detection Starter Kit I (Roche, Mannheim, Germany) in accordance with the manufacturer’s protocol.

4.3. Confirmation of Insertion Sites and Flanking Sequences

High-throughput DNA sequencing with 25× genome coverage was performed by BioMarker (Beijing, China). Contigs containing vector sequences and their putative flanking sequences were identified by BLAST searches against databases using binary vector sequences as query sequences. The selected contigs were then used as query sequences in BLAST searches against the soybean Williams 82 reference genome sequence (version Wm82.a2.v1) in SoyBase (https://soybase.org/ [accessed on 8 October 2020]) to identify the chromosomal position and flanking sequences of the vector fragments, including the inserted T-DNA and vector backbone fragments. The identified sites were PCR-amplified from genomic DNA isolated from transgenic plants, and the PCR products were sequenced for confirmation (Table A1).

4.4. Analysis of Gene Expression by Quantitative RT-PCR and Western Blotting

Different organs from transgenic and WT plants were collected for expression analysis. Total RNA was isolated from seedlings using TRIzol Reagent (Invitrogen, Carlsbad, CA, USA) in accordance with the manufacturer’s protocol. The isolated RNA was treated with RQ1 RNase-free DNase l (Promega, Madison, WI, USA) to remove any contaminating DNA. Real-time quantitative RT-PCR (qRT-PCR) was performed using the Chromo4 Real-Time PCR System (ABI PRISM 7900HT) and the SYBR Green PCR Master Mix Reagent (Takara, Otsu, Japan). Soybean GmActin4 was used as an internal control. The qRT-PCR protocol comprised 95 °C for 3 min, then 40 cycles of 95 °C for 5 s, and 60 °C for 30 s. The qRT-PCR reactions were performed following the manufacturer’s protocol with three biological and three technical replicates for each sample. The relative expression of the target gene was calculated using the 2−ΔΔCt method for all samples. All primers used are listed in Table A1.
Expression of the BAR protein in T4 plants was assessed by Western blot analysis. Total proteins isolated from young leaves were fractionated by dodecylsulphate-polyarylamide gel electrophoresis (SDS-PAGE) [42] using a Mighty Small II electrophoresis system (Hoefer Scientific Instruments, San Francisco, CA, USA). The proteins were resolved on a slab gel (10 × 8 × 0.75 cm) comprising a 13.5% (w/v) separation gel and a 4% (w/v) stacking gel, and electroblotted onto a pure nitrocellulose membrane (Midwest-Scientific, Valley Park, MO, USA). Immunoblot analysis was performed using BAR protein antibodies produced by the Shanghai YouLong Biotechnology Co., Ltd. (Shanghai, China).

4.5. Transcriptome Sequencing and Data Analysis

Soybean samples were planted in a greenhouse. Developing seeds of 3-1 at 21 DAF, 28DAF, and 42DAF were collected for RNA sequencing (RNA-seq). Three seeds from each development stage were collected and processed individually, generating three biological replicates from each development stage and three biological replicates from each construct. Total RNA was extracted with the TIANGEN RNAprep Pure Plant Kit. A total of 15 ug of RNA per sample was used to sequence the transcriptome. RNA was fragmented and used as a template for first-strand cDNA synthesis using reverse transcriptase and random primers, followed by second-strand cDNA synthesis. End repair and adding an A base to the 3′ end were performed on the double-stranded cDNA, and DNA adapter was then ligated to the DNA fragment. Finally, the adapter-ligated DNA was enriched by 15 cycles of PCR and gel purified for Illumina single-end sequencing.
After adapter clipping and quality filter, the clean reads were aligned to the soybean DN50 reference transcriptome using HisHat (Kim et al., 2015). Gene expression levels were evaluated in reads per kb per million reads (RPKM) on the basis of the number of reads mapped to the reference sequence. Differential expression analysis was performed using DEGseq (Love et al., 2014). The screening conditions for differentially expressed genes were set at a q < 0.05 and foldchange > 2. Finally, the differentially expressed genes were mapped to GO terms and the KEGG database, and significantly enriched GO and KEGG terms were thus identified.

4.6. Field Trial Methods

The T3 and T4 GmWRI1a-OE lines (3-1 and 31-1) and soybean ‘Dongnong 50’ (DN50) plants were grown under natural conditions at the Transgenic Experimental Field of Northeast Agricultural University (45°45′06″ N, 126°43′21″ E), Harbin, China, in 2019 and 2020. The experiment employed a randomized complete block design (RCBD) with three replicates. Seeds were sown in rows 3 m long and 0.65 m apart, with 6 cm spacing between plants. After full maturity, mature seeds were harvested from the plants and air-dried.
In total, 10 WT plants and 10 individuals of each transgenic line per accession were randomly sampled in each replication at the mature stage; thus, 30 plants for each accession were used for phenotypic analyses. Plant height, number of primary branches, number of primary internodes, pod number, seed number per plant, seed weight per plant, and 100-seed weight were measured. The experiments were performed with three replications.

4.7. Analysis of Seed Oil and Protein Contents

The seed oil content was analyzed using the Soxhlet extraction method [9,14]. The seed protein content was analyzed using the Kjeldahl method [43]. The total oil and protein contents were expressed on a percentage dry-weight basis.

4.8. Fatty Acid Composition

Powdered seeds (0.1 g) were used to analyze the fatty acid composition by gas chromatography (GC-14C, Shimadzu Company, Tokyo, Japan). Fatty acid extraction and analysis were performed in accordance with the method of Zhang et al. [44]. All test columns had nominal dimensions of 30 × 0.125 m with 0.13 μm film thickness. Operating conditions were as follows: carrier, hydric (400 mL min−1) split injection, injection temperature 250 °C, detector temperature 250 °C, and column temperature 210 °C [45,46].

4.9. Statistical Analysis

Data analyses were performed using IBM SPSS Statistics 19 (IBM, Armonk, NY, USA) and EXCEL 2010. A one-way analysis of variance (ANOVA) was used to compare the treatment means. The data are presented as means ± standard deviations (SD).

5. Conclusions

In this study, we generated three GmWRI1a overexpression lines, which exhibited consistent increases in seed oil content compared with that of the WT. The enhanced seed oil content remained stable and did not significantly affect the seed yield and agronomic traits. The three GmWRI1a overexpression lines increased unsaturated fatty acid (C18:2) content and decreased saturated fatty acid (C16:0) content in the seed. The transgenic soybean lines generated in this study showed potential for use in soybean oil production and breeding in the future.

Author Contributions

Z.W., B.S. and W.L. designed the experiments; Y.W., C.Y., P.S. and M.Y. carried out the experiments; Z.W., B.R. and J.H. analyzed the experimental results. Z.Z., Q.Z. and Z.W. analyzed the sequencing data. Z.W. and Y.W. wrote the manuscript. All authors have read and agreed to the published version of the manuscript.

Funding

This research was funded by the Creation and Application of New Soybean Germplasms with High Quality and Resistant to Disease and Insect in North of China (2021YFD1201103), the National Core Soybean Genetic Engineering Project (Contract No. 2016ZX08004003), the Chinese National Natural Science Foundation (31801386, 30971810), the Harbin Science Foundation (2017RAQXJ104), the Chinese Postdoctoral Science Foundation (2018M641839), and the ‘Academic Backbone’ Project of Northeast Agricultural University (16XG01).

Institutional Review Board Statement

Not applicable.

Informed Consent Statement

Not applicable.

Data Availability Statement

All data generated and analyzed in this study are included in this paper.

Conflicts of Interest

The authors declare no conflict of interest.

Appendix A

Figure A1. The identification of Basta resistance in transgenic plants. (A) Basta painting of T0 generation transgenic plant in the greenhouse using a 1:1000 diluted solution of the herbicide Basta (135 g L−1). (B) LibertyLink strip analysis of T0 generation transgenic plants; lanes 1–8 are transgenic plants.
Ijms 23 05084 g0a1
Figure A2. Sequencing results of PCR amplification product of bar and flanking region from genome DNA of 3-1 (A) and 31-1 (B) soybean. Bar gene’s sequences are in gray, genome DNA sequences are underlined, primers are highlighted in yellow.
Ijms 23 05084 g0a2

Appendix B

Table A1. Primer pairs used in the study.
GmWRI1a-P15′-ACTGCTGGATCCATGAAGAGGTCTCCAGCATC-3′
GmWRI1a-P25′-CGTGCGACTAGTTCATAGATCTAGAGCATAGTCAC-3′
35s+bar-F5′-TGTGATAACATGGTGGAGCAC-3′
35s+bar-R5′-AAATCTCGGTGACGGGCA-3′
GmWRI1a-probe-F5′-GCCTAAGCATCCAAGGAGGA-3′
GmWRI1a-probe-R5′-GATGATGCCTAGCAACCCCA-3′
BAR-target-F15′-GCGGTACCGGCAGGCTGAAG-3′
BAR-target-R15′-CCGCAGGAACCGCAGGAGTG-3′
Actin4-F5′-GTGTCAGCCATACTGTCCCCATTT-3′
Actin4-R5′-GTTTCAAGCTCTTGCTCGTAATCA-3′
QRTpcr-WRI1-F5′-CACCACAGCAGCACCAAGTTC-3′
QRTpcr-WRI1-R5′-TGCCCACCAAGTCATCATC-3′
QRTpcr-Bar-F5′-GTCCAGTCGTAGGCGTTGC-3′
QRTpcr-Bar-R5′-GTCTGCACCATCGTCAACCA-3′

References

  1. Samarth, N.B.; Mahanwar, M.P. Modified vegetable oil based additives as a future polymeric material-review. Open J. Org. Polym. Mater. 2015, 5, 1–22. [Google Scholar] [CrossRef] [Green Version]
  2. Savadi, S.; Lambani, N.; Kashyap, P.; Bisht, D.S. Genetic engineering approaches to enhance oil content in oilseed crops. Plant Growth Regul. 2017, 83, 207–222. [Google Scholar] [CrossRef]
  3. Chen, J.E.; Smith, A.G. A look at diacylglycerol acyltransferases (DGATs) in algae. J. Biotechnol. 2012, 162, 28–39. [Google Scholar] [CrossRef] [PubMed]
  4. Wilson, R.G. Seed composition. In Soybeans: Improvement, Production, and Uses; Boerma, H.R., Specht, J.E., Eds.; American Society of Agronomy; Crop Science Society of America; Soil Science Society of America: Madison, WI, USA, 2004; Volume 3, pp. 621–677. [Google Scholar]
  5. Gupta, P.K. Molecular Biology and Genetic Engineering; Deep and Deep Publications: New Delhi, India, 2018. [Google Scholar]
  6. Ruuska, S.A.; Girke, T.; Benning, C.; Ohlrogge, J.B. Contrapuntal networks of gene expression during Arabidopsis seed filling. Plant Cell 2002, 14, 1191–1206. [Google Scholar] [CrossRef] [Green Version]
  7. Yen, C.E.; Stone, S.J.; Koliwad, S.; Harris, C.; Farese, R.V. DGAT enzymes and triacylglycerol biosynthesis. J. Lipid. Res. 2008, 49, 2283–2301. [Google Scholar] [CrossRef] [Green Version]
  8. Zhao, J.Y.; Huang, J.X.; Chen, F.; Xu, F.; Ni, X.Y.; Xu, H.M.; Wang, Y.L.; Jiang, C.C.; Wang, H.; Xu, A.X.; et al. Molecular mapping of Arabidopsis thaliana lipid-related orthologous genes in Brassica napus. Theor. Appl. Genet. 2012, 124, 407–421. [Google Scholar] [CrossRef]
  9. Wang, Z.K.; Huang, W.J.; Chang, J.M.; Sebastian, A.; Li, Y.G.; Li, H.Y.; Wu, X.X.; Zhang, B.B.; Meng, F.L.; Li, W.B. Overexpression of SiDGAT1, a gene encoding acyl-CoA: Diacylglycerol acyltransferase from Sesamum indicum L. increases oil content in transgenic Arabidopsis and soybean. Plant Cell Tissue Organ Cult. 2014, 119, 399–410. [Google Scholar] [CrossRef]
  10. Lardizabal, K.; Effertz, R.; Levering, C.; Mai, J.; Pedroso, M.C.; Jury, T.; Aasen, E.; Gruys, K.; Bennett, K. Expression of Umvelopsis ramanniana DGAT2A in seed increases oil in soybean. Plant Physiol. 2008, 148, 89–96. [Google Scholar] [CrossRef] [Green Version]
  11. Santos-Mendoza, M.; Dubreucq, B.; Baud, S.; Parcy, F.; Caboche, M.; Lepiniec, L. Deciphering the regulatory networks that control seed development and maturation in Arabidopsis. Plant J. 2008, 54, 608–620. [Google Scholar] [CrossRef]
  12. Mu, J.; Tan, H.; Zheng, Q.; Fu, F.; Liang, Y.; Zhang, J.; Yang, X.; Wang, T.; Chong, K.; Wang, X.J.; et al. LEAFY COTYLEDON1 is a key regulator of fatty acid biosynthesis in Arabidopsis. Plant Physiol. 2008, 148, 1042–1054. [Google Scholar] [CrossRef] [PubMed] [Green Version]
  13. Grotewold, E. Transcription factors for predictive plant metabolic engineering: Are we there yet? Curr. Opin. Plant Biol. 2008, 19, 138–144. [Google Scholar] [CrossRef] [PubMed]
  14. Tan, H.L.; Yang, X.H.; Zhang, F.X.; Zheng, X.; Qu, C.M.; Mu, J.Y.; Fu, F.Y.; Li, J.N.; Guan, R.Z.; Zhang, H.S.; et al. Enhance seed oil production in canola by conditional expression of B. napus LEAFY COTYLEDON1 (BnLEC1) and LEC1-LIKE (BnL1) in developing seeds. Plant Physiol. 2011, 156, 1577–1588. [Google Scholar] [CrossRef] [Green Version]
  15. Zafar, S.; Li, Y.L.; Li, N.N.; Zhu, K.M.; Tan, X.L. Recent advances in enhancement of oil content in oilseed crops. J. Biotechnol. 2019, 301, 35–44. [Google Scholar] [CrossRef] [PubMed]
  16. Baud, S.; Mendoza, M.S.; To, A.; Harscoet, E.; Lepiniec, L.; Dubreucq, B. WRINKLED1 specifies the regulatory action of LEAFY COTYLEDON2 towards fatty acid metabolism during seed maturation in Arabidopsis. Plant J. 2007, 50, 825–838. [Google Scholar] [CrossRef] [PubMed]
  17. Cernac, A.; Benning, C. WRINKLED1 encodes an AP2/EREB domain protein involved in the control of storage compound biosynthesis in Arabidopsis. Plant J. 2004, 40, 575–585. [Google Scholar] [CrossRef]
  18. Maeo, K.; Tokuda, T.; Ayame, A.; Mitsui, N.; Kawai, T.; Tsukagoshi, H.; Ishiguro, S.; Nakamura, K. An AP2-type transcription factor, WRINKLED1, of Arabidopsis thaliana binds to the AW-box sequence conserved among proximal upstream regions of gene involved in fatty acid synthesis. Plant J. 2009, 60, 476–487. [Google Scholar] [CrossRef]
  19. Focks, N.; Benning, C. wrinkeld1: A novel, low-seed-oil mutant of Arabidopsis with a deficiency in the seed-specific regulation of carbohydrate metabolism. Plant Physiol. 1998, 118, 91–101. [Google Scholar] [CrossRef] [Green Version]
  20. Liu, J.; Hua, W.; Zhan, G.M.; Wei, F.; Wang, X.M.; Liu, G.H.; Wang, H.Z. Increasing seed mass and oil content in transgenic Arabidopsis by the overexpression of wri1-like gene from Brassica napus. Plant Physiol. Biochem. 2010, 48, 9–15. [Google Scholar] [CrossRef]
  21. Shen, B.; Allen, W.B.; Zheng, P.Z.; Li, C.J.; Glassman, K.; Ranch, J.; Nubel, D.; Tarczynski, M.C. Expression of ZmLEC1 and ZmWRI1 increases seed oil production in maize. Plant Physiol. 2010, 153, 980–987. [Google Scholar] [CrossRef] [Green Version]
  22. Sanjaya Durrett, T.P.; Weise, S.E.; Benning, C. Increasing the energy density of vegetative tissues by diverting carbon from starch to oil biosynthesis in transgenic Arabidopsis. Plant Biotechnol. J. 2011, 9, 874–883. [Google Scholar] [CrossRef]
  23. Pouvreau, B.; Baud, S.; Vernoud, V.; Morin, V.; Py, C.; Gendro, G.; Pichon, J.P.; Rouster, J.; Paul, W.; Rogowsky, P.M. Duplicate maize Wrinkled1 transcription factors activate target genes involved in seed oil biosynthesis. Plant Physiol. 2011, 156, 674–686. [Google Scholar] [CrossRef] [PubMed] [Green Version]
  24. An D and Suh: MC Overexpression of Arabidopsis WRI1 enhanced seed mass and storage oil content in Camelina sativa. Plant Biotechnol. Rep. 2015, 9, 137–148. [CrossRef]
  25. Yang, Y.; Munz, J.; Cass, C.; Zienkiewicz, A.; Kong, Q.; Ma, W.; Sanjaya Sedbrook, J.; Benning, C. Ectopic expression of WRINKLED1 affects fatty acid homeostasis in brachypodium distachyon vegetative tissues. Plant Physiol. 2015, 169, 1836–1847. [Google Scholar] [PubMed] [Green Version]
  26. Chen, L.; Zheng, Y.H.; Dong, Z.M.; Meng, F.F.; Sun, X.M.; Fan, X.H.; Zhang, Y.F.; Wang, M.L.; Wang, S.M. Soybean (Glycine max) WRINKLED1 transcription factor, GmWRI1a, positively regulates seed oil accumulation. Mol. Genet. Genom. 2018, 293, 401–415. [Google Scholar] [CrossRef] [PubMed]
  27. Guo, W.; Chen, L.M.; Chen, H.F.; Yang, H.L.; You, Q.B.; Bao, A.L.; Chen, S.L.; Han, Q.N.; Huang, Y.; Qiu, D.; et al. Overexpression of GmWRI1b in soybean stably improves plant architecture and associated yield parameters, and increases total seed oil production under field conditions. Plant Biotechnol. J. 2020, 18, 1639–1641. [Google Scholar] [CrossRef]
  28. Chen, B.B.; Zhang, G.Y.; Li, P.H.; Yang, J.H.; Guo, L.; Beening, C.; Wang, X.M.; Zhao, J. Multiple GmWRI1s are redundantly involved in seed filling and nodulation by regulating plastid glycolysis, lipid biosynthesis and homone signalling in soybean (Glycine max). Plant Biotechnol. J. 2020, 18, 155–171. [Google Scholar] [CrossRef] [PubMed] [Green Version]
  29. Vanhercke, T.; El Tahchy, A.; Shrestha, P.; Zhou, X.R.; Singh, S.P.; Petrie, J.R. Synergistic effect of WRI1 and DGAT1 coexpression on triacylglycerol biosynthesis in plants. FEBS Lett. 2013, 587, 364–369. [Google Scholar] [CrossRef] [Green Version]
  30. Vanhercke, T.; Dyer, J.M.; Mullen, R.T.; Kilaru, A.; Rahman, M.M.; Petrie, J.R.; Green, A.G.; Yurchenko, O.; Singh, S.P. Metabolic engineering for enhanced oil in biomass. Prog. Lipid. Res. 2019, 74, 103–129. [Google Scholar] [CrossRef]
  31. Kong, Q.; Yang, Y.; Guo, L.; Yuan, L.; Ma, W. Molecular basis of plant oil biosynthesis: Insights gained from studying the WRINKLED1 transcription factor. Front. Plant Sci. 2020, 11, 24. [Google Scholar] [CrossRef] [Green Version]
  32. Kong, Q.; Yuan, L.; Ma, W. WRINKLED1, a “Master regular” in transcriptional control of plant oil biosynthesis. Plants 2019, 8, 238. [Google Scholar] [CrossRef] [Green Version]
  33. Sun, R.; Ye, R.; Gao, L.; Zhang, L.; Wang, R.; Mao, T.; Zheng, Y.; Li, D.; Lin, Y. Characterization and ectopic expression OF CoWRI1, an AP2/EREBP domain-containing transcription factor from coconut (Cocos nucifera L.) Endosperm, changes the seeds oil content in transgenic Arabidopsis thatliana and rice (Oryza sativa L.). Front. Plant Sci. 2017, 8, 63. [Google Scholar] [CrossRef] [PubMed] [Green Version]
  34. Ye, J.; Wang, C.; Sun, Y.; Qu, J.; Mao, H.; Chua, N.H. Overexpression of a transcription factor increases lipid content in a woody Perennial Jatropha Curcas. Front. Plant Sci. 2018, 9, 1479. [Google Scholar] [CrossRef] [PubMed] [Green Version]
  35. Kohli, A.; Twyman, R.M.; Abranches, R.; Wegel, E.; Stoger, E.; Christou, P. Transgene integration, organization and interaction in plants. Plant Mol. Biol. 2003, 52, 247–258. [Google Scholar] [CrossRef] [PubMed]
  36. Olhoft, P.M.; Flagel, L.E.; Somers, D.A. T-DNA locus structure in a large population of soybean plants transformed using the agrobacterium-mediated cotyledonary-node method. Plant Biotechnol. J. 2004, 2, 289–300. [Google Scholar] [CrossRef]
  37. Oltmanns, H.; Frame, B.; Lee, L.Y.; Johnson, S.; Li, B.; Wang, K.; Gelvin, S.B. Generation of back-bone-free, low transgene copy plants by launching T-DNA from the agrobacterium chromosome. Plant Physiol. 2010, 152, 1158–1166. [Google Scholar] [CrossRef] [Green Version]
  38. Honna, P.T.; Fuganti-Pagliarini, R.; Ferreira, L.C.; Molinari, M.D.C.; Marin, S.R.R.; Oliveira, M.C.N.; Farias, J.B.R.; Neumaier, N.; Mertz-Henning, L.M.; Kanamori, N.; et al. Molecular, physiological, and agronomical characterization, in greenhouse and in field conditions, of soybean plants genetically modified with AtGolS2 gene for drought tolerance. Mol. Breed. 2016, 36, 157. [Google Scholar] [CrossRef] [Green Version]
  39. Vogel, P.A.; Noyer, S.B.; Park, H.; Nguyen, H.; Hou, L.; Changa, T.; Khang, H.L.; Ciftci, O.N.; Wang, T.; Cahoon, E.B.; et al. Expression of the Arabidopsis WRINKLED 1 transcription factor leads to higher accumulation of palmitate in soybean seed. Plant Biotechnol. J. 2019, 17, 1369–1379. [Google Scholar] [CrossRef]
  40. Kang, N.K.; Kim, E.K.; Kim, Y.U.; Lee, B.; Jeong, W.J.; Jeong, B.; Chang, Y.K. Increased lipid production by heterologous expression of AtWRI1 transcription factor in Nannochloropsis salina. Biotechnol. Biofuels 2017, 10, 231–245. [Google Scholar] [CrossRef]
  41. Liu, M.; Li, D.M.; Wang, Z.K.; Meng, F.L.; Li, Y.; Wu, X.X.; Teng, W.L.; Han, Y.P.; Li, W.B. Transgenic expression of ThIPK2 gene in soybean improves stress tolerance, oleic acid content and seed size. Plant Cell Tissue Organ Cult. 2012, 111, 277–289. [Google Scholar] [CrossRef]
  42. Laemmli, U.K. Cleavage of structural proteins during the assembly of the head of bacteriophage T4. Nature 1970, 227, 680–685. [Google Scholar] [CrossRef]
  43. Leng, J.T.; Chen, Y.Z.; Wang, Y.; Wu, C.X. Character analysis of newly-developed soybean varieties and breeding objectives in different regions of China. Soybean Sci. 2007, 26, 293–299. [Google Scholar]
  44. Zhang, Y.J.; Gao, H.M.; Jiang, C.Z.; Hu, M.Y.; Liu, B.Q.; Li, H. Fast analysis on fatty acids of soybean seed by gas chromatography. Soybean Sci. 2008, 5, 859–862. [Google Scholar]
  45. Panthee, D.R.; Pantalone, V.R.; Saxton, A.M. Modifier QTL for fatty acid composition in soybean oil. Euphytica 2006, 152, 67–73. [Google Scholar] [CrossRef]
  46. Xie, D.W.; Han, Y.P.; Zeng, Y.H.; Chang, W.; Teng, W.L.; Li, W.L. SSR- and SNP-related QTL underlying linolenic acid and other fatty acid contents in soybean seeds across multiple environments. Mol. Breed. 2012, 30, 169–179. [Google Scholar] [CrossRef]
Figure 1. Schematic map of plant expression gene construct pCAMBIA3300-121-GmWRI1a. LB/RB, left/right T-DNA border sequences; BIpR, coding region of the phosphinothricin acetyl-transferase gene driven by enhanced CaMV 35S promoter; GmWRI1a, coding region of the GmWRI1a gene driven by CaMV 35S promoter.
Ijms 23 05084 g001
Figure 2. Molecular biology identification of GmWRI1a-OE lines. (A) PCR amplification of bar and CaMV 35S promoter (1000 bp) from the genomic DNA of T1 transgenic plants. Lane M is 2000 bp molecular weight marker ladder; Lane—is WT plant (negative control); Lane+ is pCAMBIA3300-121-GmWRI1a (positive control); Lane H2O is water (negative control). (B) PCR amplification of bar and CaMV 35S promoter (1000 bp) from the genomic DNA of T2 transgenic plants; Lanes 1–5 are 1-1, 2-1, 3-1, 31-1, and 32-2, respectively; Lane M is 2000 bp molecular weight marker ladder; Lane—is WT plant (negative control); Lane+ is pCAMBIA3300-121-GmWRI1a (positive control). (C) Southern blotting analysis of the T3 and T4 transgenic lines after digesting genomic DNA with Hind III and EcoR I, and probing with digoxigenin labeled GmWRI1a. Lanes 1, 5, and 9 are genome DNA of T3 generations 3-1, 31-1, and 32-2 digested by Hind III, respectively; Lanes 2, 6, and 10 are genome DNA of T3 generations 3-1, 31-1, and 32-2 digested by EcoR I, respectively; Lanes 3, 7, and 11 are genome DNA of T4 generations 3-1, 31-1, and 32-2 digested by Hind III, respectively; Lanes 4, 8, and 12 are genome DNA of T4 generations 3-1, 31-1, and 32-2 digested by EcoR I, respectively; Lane M is 23 kb DNA marker; Lane -1 is genome DNA of DN50 digested by Hind III; Lane—is genome DNA of DN50 digested by EcoR I; Lane+ is positive plasmid. (D) Southern blotting hybridization analysis of the T3 and T4 generation transgenic soybean lines after digesting genomic DNA with Hind III and EcoR I and probing with digoxigenin-labeled bar. Lanes 1, 5, and 9 are genome DNA of T3 generations 3-1, 31-1, and 32-2 digested by Hind III,, respectively; Lanes 2, 6, and 10 are genome DNA of T3 generations 3-1, 31-1, and 32-2 digested by EcoR I, respectively; Lanes 3, 7, and 11 are genome DNA of T4 generations 3-1, 31-1, and 32-2 digested by Hind III, respectively; Lanes 4, 8, and 12 are genome DNA of T4 generations 3-1, 31-1, and 32-2 digested by EcoR I, respectively; Lane M is a 23 kb DNA marker; Lane-1 is genome DNA of DN50 digested by Hind III; Lane-2 is genome DNA of DN 50 digested by EcoR I; Lane+ is positive plasmid.
Ijms 23 05084 g002
Figure 3. Integration sites of the T-DNA in 3-1 and 31-1 soybean. (A) Location of primers designed for event-specific PCR detection of 3-1. (B) Location of primers designed for event-specific PCR detection of 31-1. (C) Confirmation of the integration sites of the 3-1, predicted on the basis of DNA sequencing and data analysis results; Lane—is water (negative control); Lane M is 2000 bp molecular weight marker ladder; Lanes 1–4 are PCR amplification of bar and flanking region from the genomic DNA of T3 generations 1-1, 31-1, 32-2, and 3-1 respectively; Lanes 5-8 are PCR amplification of bar and flanking region from the genomic DNA of T4 generations 1-1, 31-1, 32-2, and 3-1, respectively. (D) Confirmation of the integration sites of 31-1, predicted on the basis of DNA sequencing and data analysis results; Lane—is water (negative control); Lane M is 2000 bp molecular weight marker ladder; Lanes 1–4 are PCR amplification of bar and flanking region from the genomic DNA of T3 generations 1-1, 3-1, 32-2, and 31-1, respectively; Lanes 5–8 are PCR amplification of bar and flanking region from the genomic DNA of T4 generations 1-1, 3-1, 32-2, and 31-1, respectively.
Ijms 23 05084 g003
Figure 4. Relative expression level of GmWRI1a and bar genes in the different organs during development stages. Transgene expression was normalized using GmActin4 gene and calibrated using the same sample under control conditions. Data shown represent the means ± SD of three independent experiments, with each experiment consisting of three technical replicates. Statistically significant differences between transgenic and WT plants are marked with asterisks (** p < 0.01; ANOVA). (A) The relative expression level of the bar gene in the different organs at four development stages from the T3 and T4 generation 3-1 and 31-1 soybean. (B) The relative expression level of the GmWRI1a gene in the different organs at four development stages from the T3 and T4 generation 3-1 and 31-1 soybean.
Ijms 23 05084 g004
Figure 5. Western blotting analysis of the expression of BAR protein from the different tissues in T4 plants 3-1 (A) and 31-1 (B). Lane M is ladder marker; lane WT is leaf of wild-type soybean.
Ijms 23 05084 g005
Figure 6. Differential gene expression transcriptome analysis. (AC) Hierarchical cluster analysis of differential gene expression between 3-1 and DN50 at 21DAF, 28DAF, and 42DAF, respectively. Gene expression levels are shown using different colors, where blue represents a low expression level and red represents a high expression level. (DF) KEGG pathway classification of differentially expressed genes between 3-1 and DN50 at 21DAF, 28DAF, and 42DAF, respectively.
Ijms 23 05084 g006
Figure 7. Seed oil contents (A) and seed protein contents (B) of three GmWRI1a-OE lines and wild-type DN50 over 2 seasons. The data represent the means ± SD of three replicate experiments, and the values are in dry weight (DW) for seeds, ** indicate significant differences compared with the wild type at p < 0.01, respectively, as determined by one-way analysis of variance (ANOVA).
Ijms 23 05084 g007
Figure 8. Representative pictures showing plant architecture of the homozygous T4 generation plants and WT at harvest stage. (A) WT plants; (B) 3-1 plants; (C) 31-1 plants; (D) 32-2 plants.
Ijms 23 05084 g008
Table 1. Fatty acid composition of GmWRI1-OE lines and DN50.
LinesC16:0C18:0C18:1C18:2C18:3
DN5011.08 ± 0.023.46 ± 0.0123.68 ± 0.0949.71 ± 0.139.18 ± 0.03
3-110.95 ± 0.01 **3.36 ± 0.02 **20.13 ± 0.09 **52.71 ± 0.08 **9.85 ± 0.04 **
31-110.82 ± 0.02 **3.49 ± 0.0323.58 ± 0.1250.06 ± 0.08 **8.96 ± 0.06 **
32-210.40 ± 0.02 **3.06 ± 0.01 **22.90 ± 0.02 **50.90 ± 0.06 **9.70 ± 0.04 **
The data represent the means ± SD of the three replicate experiments, and the values were reported as the relative percentage of individual fatty acid in the total fatty acids. C16:0, C18:0, C18:1, C18:2, and C18:3 represent palmitic, stearic, oleic, linoleic, and linolenic acids, respectively. ** indicates significant differences compared with the wild type as determined by one-way ANOVA (p < 0.01).
Table 2. Agronomic performance of GmWRI1a-OE lines and WT plants in field.
GenotypePlant Height (cm)Number of Primary InternodeNumber of Primary BranchesPod Number
Per Plant
Seed Number
Per Plant
Seed Weight
Per 100 Seeds (g)
DN50 (WT)84.02 ± 12.8418.59 ± 2.143.31 ± 2.24117.84 ± 63.38257.79 ± 26.977.56 ± 0.77
3-1 (T3)88.67 ± 5.7018.59 ± 2.172.58 ± 2.1790.33 ± 15.60259.81 ± 18.427.72 ± 1.26
3-1 (T4)88.92 ± 8.5318.79 ± 1.533.29 ± 2.16104.50 ± 14.76245.89 ± 11.128.45 ± 0.86
31-1 (T3)86.00 ± 7.1018.74 ± 1.712.59 ± 2.0298.71 ± 47.10206.25 ± 21.898.02 ± 1.23
31-1 (T4)87.12 ± 5.0419.00 ± 1.222.74 ± 1.2991.12 ± 25.48207.73 ± 18.699.70 ± 1.06 **
32-2 (T3)85.33 ± 8.9319.00 ± 1.053.40 ± 2.24113.83 ± 43.54256.06 ± 25.908.62 ± 3.64
32-2 (T4)70.10 ± 8.38 **18.87 ± 1.412.10 ± 1.6974.73 ± 21.98 **157.61 ± 10.87 **8.43 ± 1.48
Values are means ± SD of three replicates. A total of 30 plants were measured in each independent measurement. ** is significantly different from the wild type as determined by one-way ANOVA (p < 0.01).
Publisher’s Note: MDPI stays neutral with regard to jurisdictional claims in published maps and institutional affiliations.

