Article

Relationship between Telomere Length, TERT Genetic Variability and TERT, TP53, SP1, MYC Gene Co-Expression in the Clinicopathological Profile of Breast Cancer

by
Marta Dratwa
1,*,
Barbara Wysoczanska
1,
Wioletta Brankiewicz
2,
Martyna Stachowicz-Suhs
3,
Joanna Wietrzyk
3,
Rafał Matkowski
4,5,
Marcin Ekiert
4,5,
Jolanta Szelachowska
4,5,
Adam Maciejczyk
4,5,
Mariusz Szajewski
6,7,
Maciej Baginski
2 and
Katarzyna Bogunia-Kubik
1,*
1
Laboratory of Clinical Immunogenetics and Pharmacogenetics, Hirszfeld Institute of Immunology and Experimental Therapy, Polish Academy of Sciences, 53-114 Wroclaw, Poland
2
Department of Pharmaceutical Technology and Biochemistry Faculty of Chemistry, Gdansk University of Technology, 80-233 Gdansk, Poland
3
Department of Experimental Oncology, Hirszfeld Institute of Immunology and Experimental Therapy, Polish Academy of Sciences, 53-114 Wroclaw, Poland
4
Breast Unit, Lower Silesian Oncology, Pulmonology and Hematology Center, 53-413 Wroclaw, Poland
5
Department of Oncology, Wroclaw Medical University, 53-413 Wroclaw, Poland
6
Department of Oncological Surgery, Gdynia Oncology Centre, 81-519 Gdynia, Poland
7
Division of Propaedeutics of Oncology, Medical University of Gdansk, 80-210 Gdansk, Poland
*
Authors to whom correspondence should be addressed.
Int. J. Mol. Sci. 2022, 23(9), 5164; https://doi.org/10.3390/ijms23095164
Submission received: 6 April 2022 / Revised: 15 April 2022 / Accepted: 4 May 2022 / Published: 5 May 2022
(This article belongs to the Special Issue Current Use and Perspectives of Molecular Assessment in Breast Cancer)

Abstract

:
The molecular mechanisms of telomerase reverse transcriptase (TERT) upregulation in breast cancer (BC) are complex. We compared genetic variability within TERT and telomere length with the clinical data of patients with BC. Additionally, we assessed the expression of the TERT, MYC, TP53 and SP1 genes in BC patients and in BC organoids (3D cell cultures obtained from breast cancer tissues). We observed the same correlation in the blood of BC patients and in BC organoids between the expression of TERT and TP53. Only in BC patients was a correlation found between the expression of the TERT and MYC genes and between TP53 and MYC. We found associations between TERT genotypes (rs2735940 and rs10069690) and TP53 expression and telomere length. BC patients with the TT genotype rs2735940 have a shorter telomere length, but patients with A allele rs10069690 have a longer telomere length. BC patients with a short allele VNTR-MNS16A showed higher expression of the SP1 and had a longer telomere. Our results bring new insight into the regulation of TERT, MYC, TP53 and SP1 gene expression related to TERT genetic variability and telomere length. Our study also showed for the first time a similar relationship in the expression of the above genes in BC patients and in BC organoids. These findings suggest that TERT genetic variability, expression and telomere length might be useful biomarkers for BC, but their prognostic value may vary depending on the clinical parameters of BC patients and tumor aggressiveness.

1. Introduction

Breast cancer (BC) is the most common malignant tumor neoplasm in women worldwide [1]. About ten percent of BC cases are associated with a genetic predisposition or family history, with variations by country and ethnicity [2]. BC is a heterogeneous and polygenic disease, and treatment strategies vary depending on the molecular subtype as well as the most common differentially expressed genes that exist in different disease subtypes [3].
The relationship between telomerase reverse transcriptase (TERT) and the risk of BC has been investigated in several publications in the contexts of gene polymorphism, telomere length and the mechanism of gene expression regulation [4]. Various mechanisms, including genetic mutations and epigenetic changes, have been proposed to explain the pleiotropic association of the 5p15.33 region in which the TERT gene resides with telomerase activity and cancer predisposition [5,6].
The TERT gene encodes the catalytic subunit of telomerase, which is a key enzyme for the maintenance of telomere length; therefore, genetic variations in this region likely influence BC risk through multiple distinct biological pathways, with telomere length being only one of the implied mechanisms [7,8]. The upregulation of the TERT gene in BC leads to the activation of telomerase, which contributes to the growth advantage and survival of tumor cells. The molecular mechanisms of TERT upregulation are complex, tumor subtype specific and may be clinically relevant [9,10]. The transcriptional regulation of the TERT gene is a complex process, and several mechanisms that may play a role have been described, including mutations in the TERT promoter that can alter the binding sites of transcription factors, e.g., MYC, SP1 and ETS family proteins [11,12].
In BC, mutation of the TERT promoter is rare; therefore, other genetic changes have been described such as gene amplification and the presence of gene copy number gains or single nucleotide polymorphisms (SNPs), which may play a regulatory function in TERT expression and be associated with different telomere lengths [13,14,15].
The present study investigated the relationship between TERT gene polymorphisms, both SNPs and a variable number of tandem repeats (VNTR), in the context of mRNA TERT gene expression and telomere length and clinical parameters in female patients with BC. Additionally, we assessed the expression of the TERT, MYC, TP53 and SP1 genes in patients with BC and in BC organoids.
In our study, the same correlation was found between the relative expression of TERT and TP53 in the whole blood of BC patients and in BC organoids. Moreover, we observed that the two TERT polymorphisms (rs2735940 and rs10069690) correlated with TP53 expression and telomere length. Additionally, BC patients with a short allele (S) within VNTR-MNS16A showed higher expression of the SP1 and had longer telomeres. Our results provide more information on the regulation of TERT in terms of mRNA expression as well as the genetic variability of TERT and telomere length in patients with BC. We have also shown that the TERT related genes MYC, TP53 and SP1 play an important role in BC carcinogenesis.

2. Results

2.1. Disparities of Single Nucleotide and VNTR-MNS16A TERT Gene Polymorphisms in BC

BC patients and healthy individuals were genotyped for TERT single nucleotide polymorphism (SNP; rs10069690, rs2735940, rs2736100 and rs2853669) and variable number tandem repeats MNS16A (VNTR-MNS16A). Their location in the TERT gene is shown in Figure 1. The genotype frequencies for all the SNPs were consistent with the Hardy–Weinberg equilibrium in both study groups. Table 1 shows the distribution of the TERT genotypes in our study group (BC women) and the control group (healthy women) and the frequency of these polymorphisms in the European population (using data from the Ensembl database, accessed on 2 February 2022). There was no difference in the distribution of alleles and genotypes between BC patients and healthy controls in any of the SNPs tested.
Four different VNTR-MNS16A alleles were detected in our BC patients and in the healthy controls (VNTR-333, VNTR-302, VNTR-274 and VNTR-234; Table 2). Patients with BC carried eight different genotypes (long (LL): 302/302, 302/333; short/long (SL): 243/302, 243/333, 274/302; short (SS): 243/243, 274/274, 243/274), but seven genotypes were noted in the control group (no 274/274 genotype as compared to BC patients). The tandem repeats rates were consistent with the Hardy–Weinberg equilibrium in the patients group, but an imbalance was observed in healthy subjects (Table 2). BC patients and healthy individuals showed no significant differences in the VNTR-MNS16A genotypes and allele frequencies.

2.2. Relationships between the Expression of TERT, SP1, MYC and TP53 Genes in BC Patients and BC Organoids

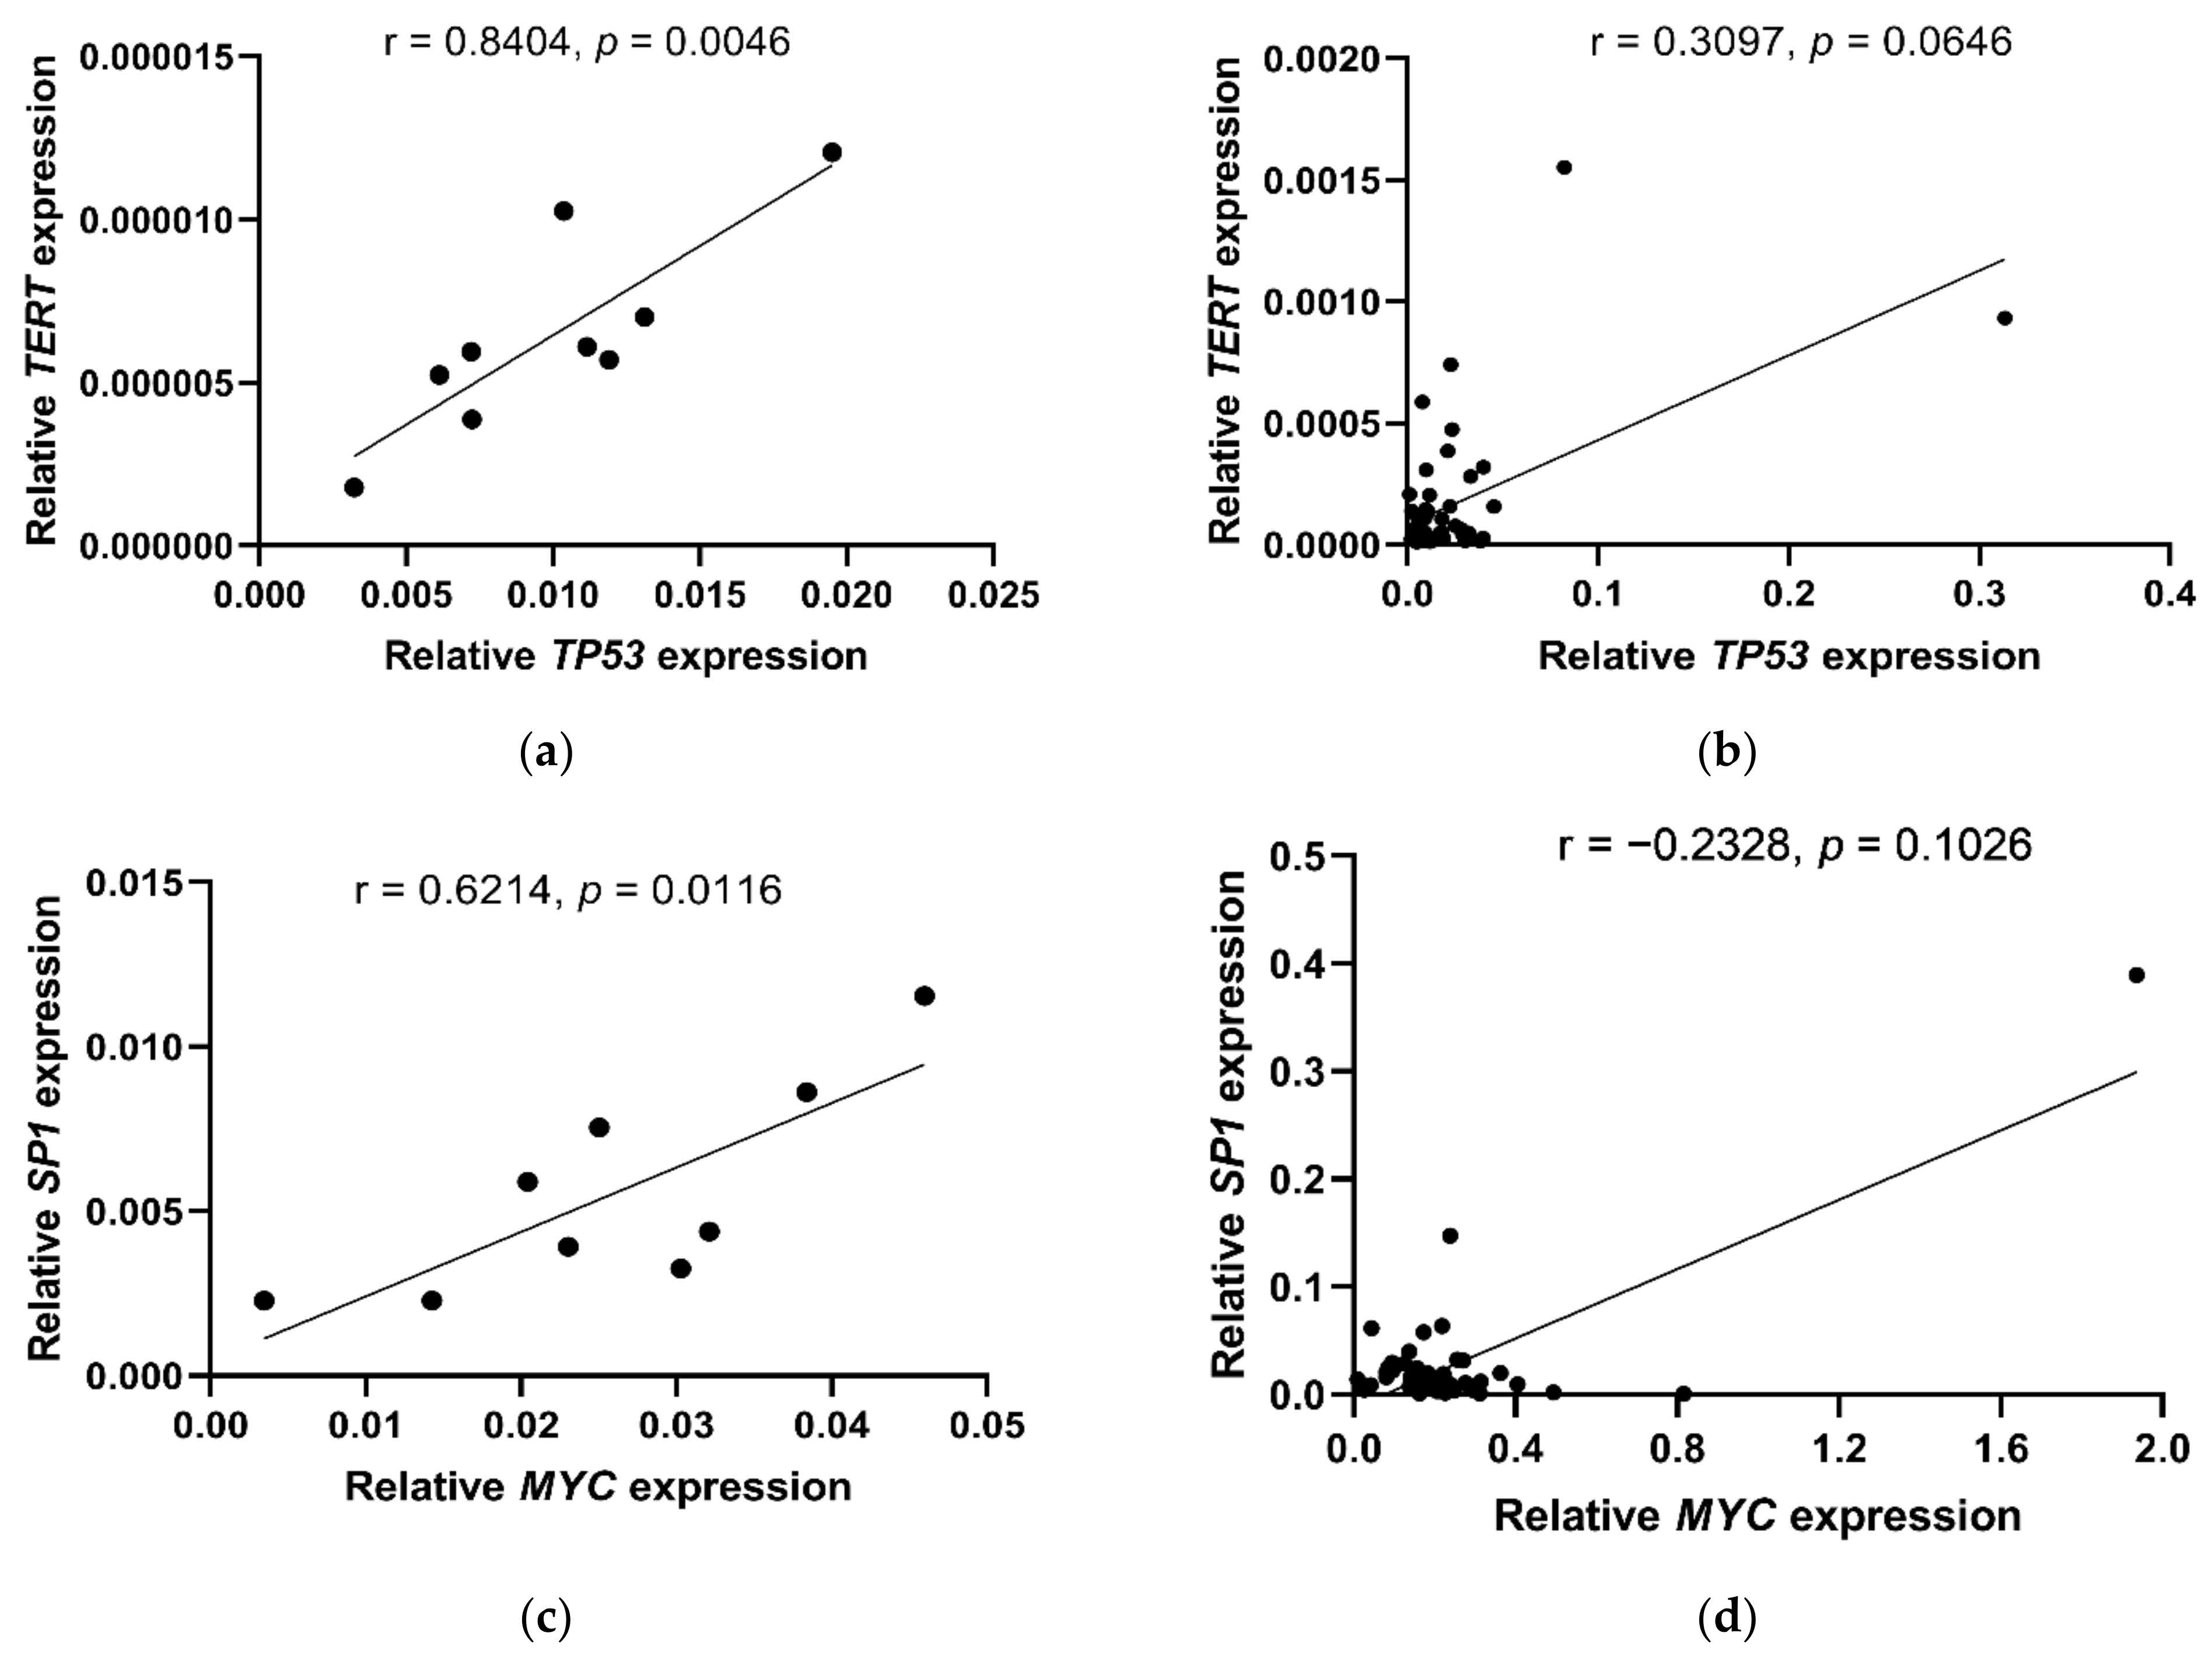
In this part of the study, we analyzed the relationships between TERT, SP1, MYC and TP53 expression, TERT polymorphisms and telomere length in both patients with BC (n = 50) and BC organoids (n = 9). We observed a correlation between the relative expression of TERT and TP53 in BC organoids (r = 0.8404, p = 0.0046; Figure 2a) and a trend towards this association in BC patients (r = 0.3097, p = 0.0646; Figure 2b). Moreover, we found a relationship between the expression of the SP1 and MYC genes only in BC organoids (r = 0.6214, p = 0.0116; Figure 2c) and not in BC patients (r =−0.2328, p = 0.1026; Figure 2d).
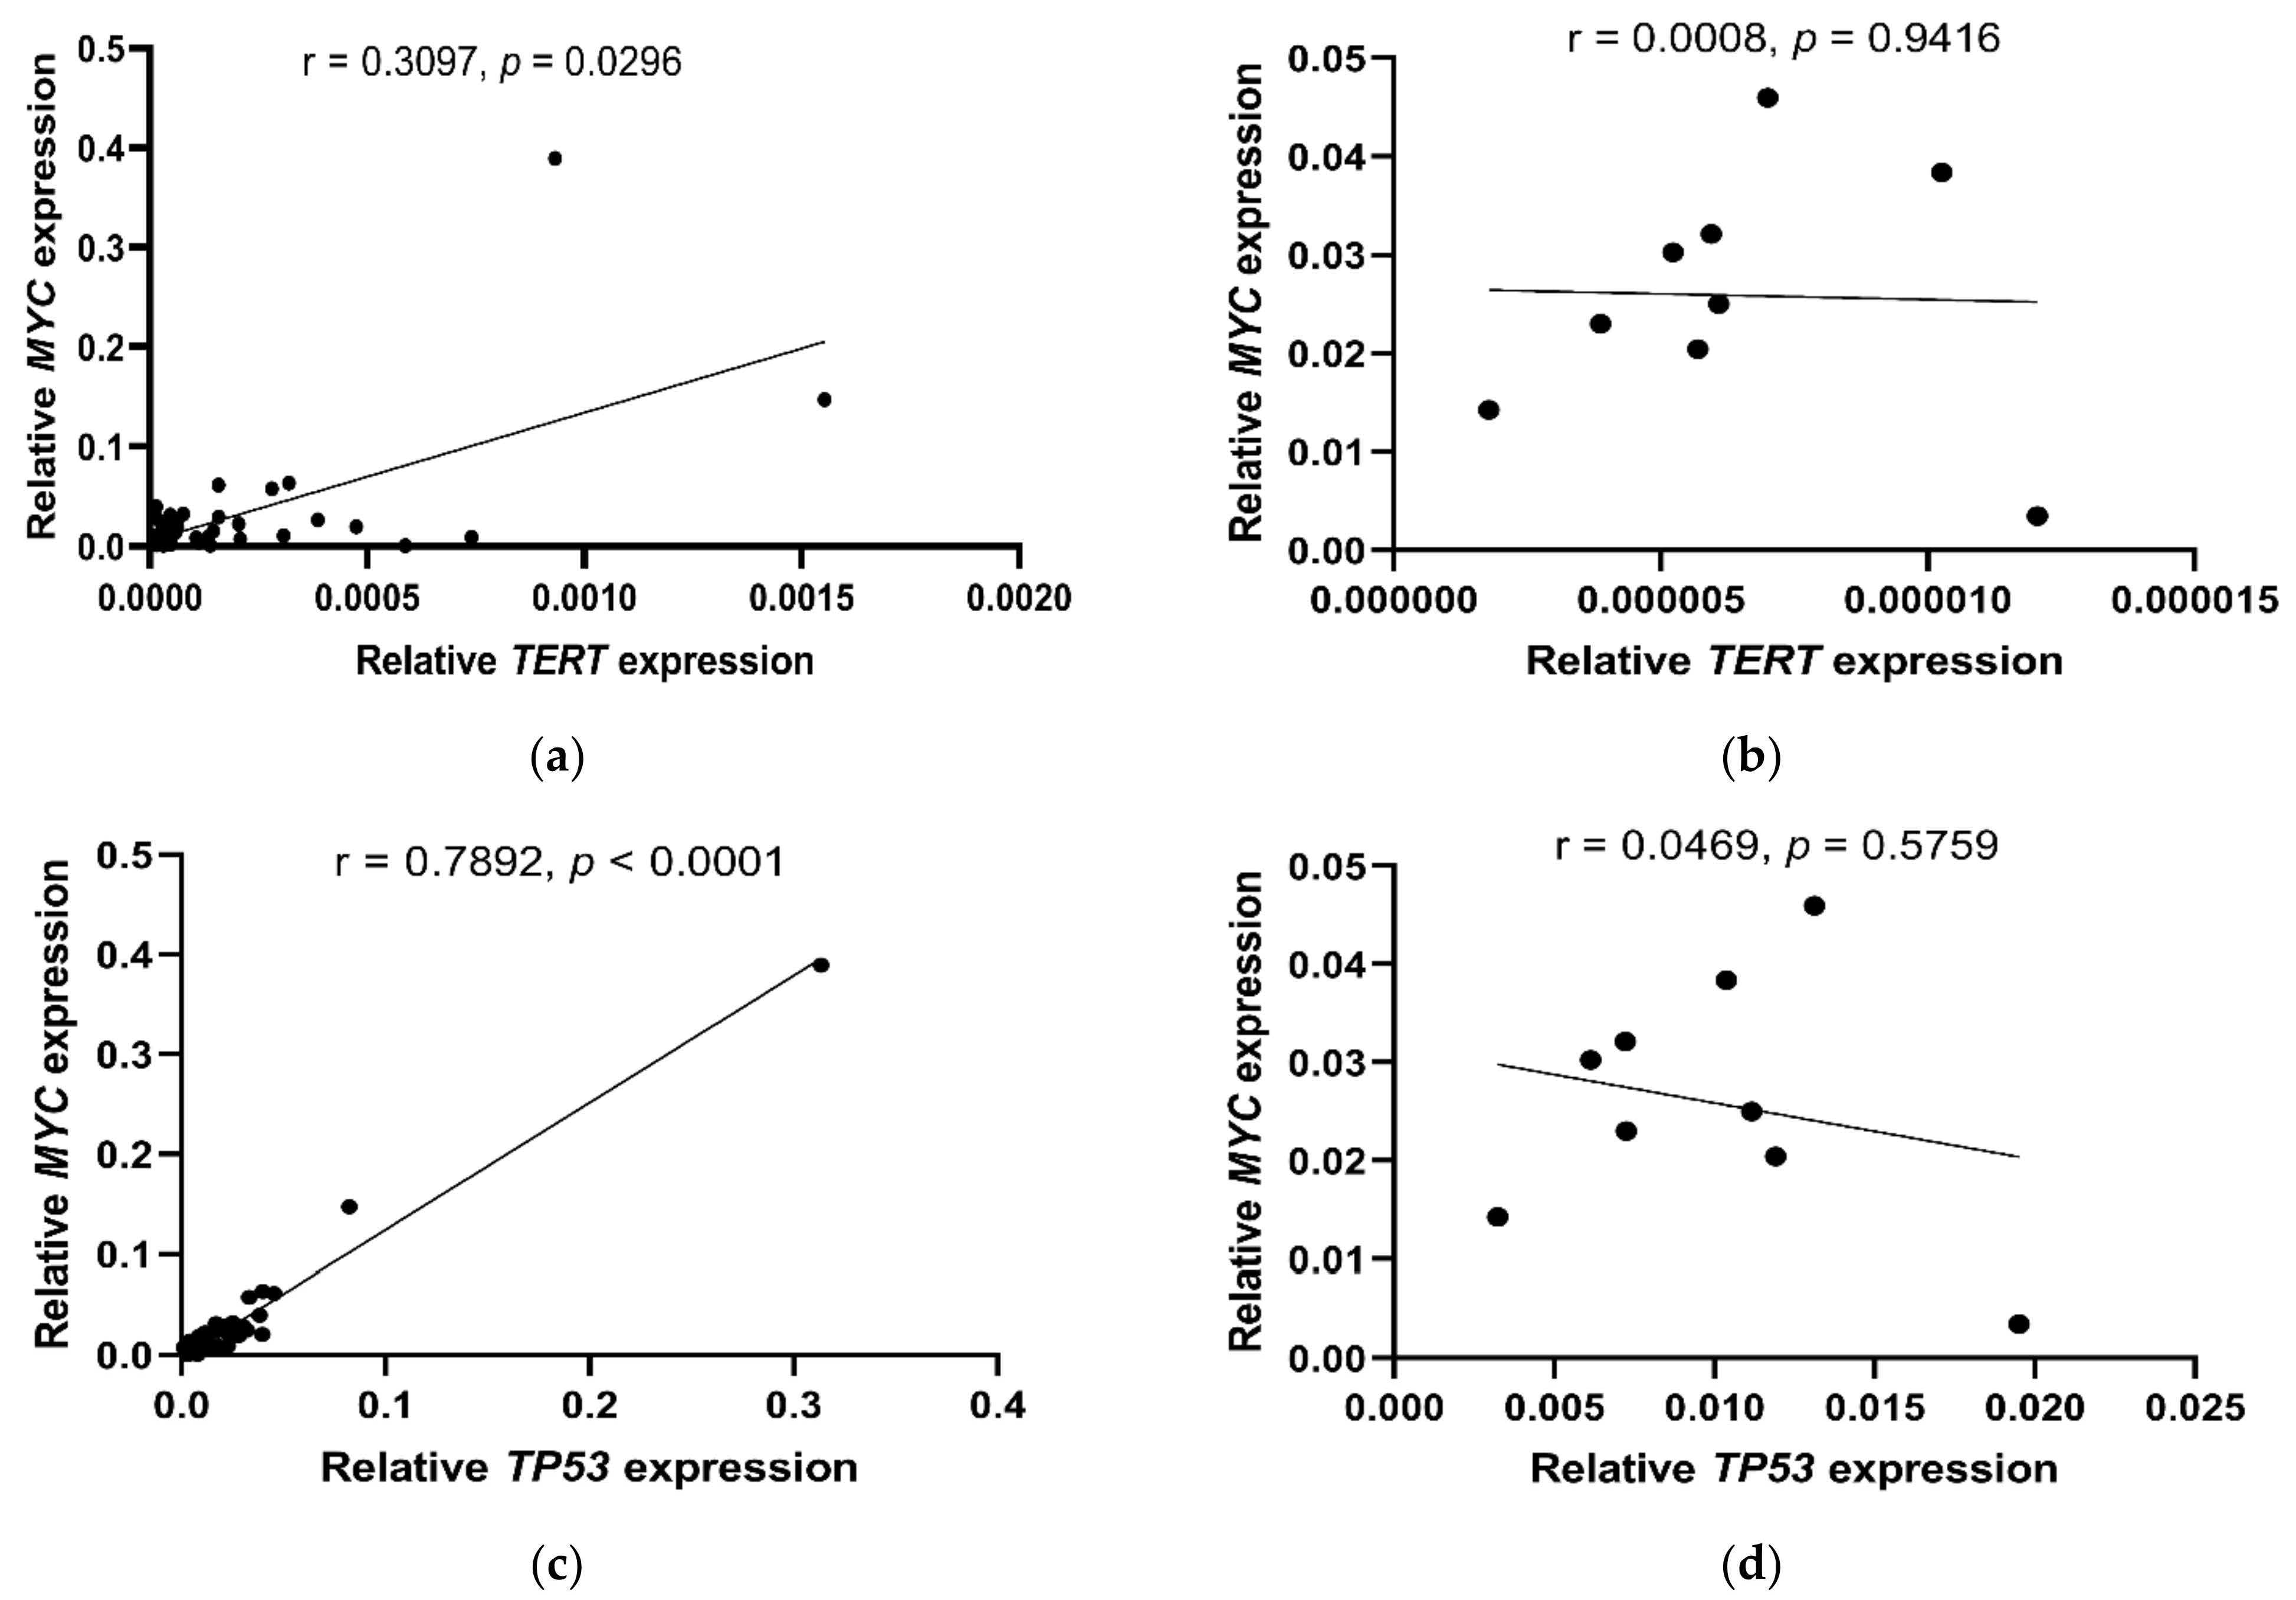
A correlation between the expression of the TERT and MYC genes (r = 0.3097, p = 0.0296; Figure 3a) and between the expression of the TP53 and MYC genes (r = 0.7892, p < 0.0001; Figure 3c) was also found, but only in BC patients and not in BC organoids (TERT/MYC: r = 0.0008, p = 0.9416; Figure 3b and TP53/MYC: r = 0.0469, p = 0.5759; Figure 3d).
Additionally, we only observed a trend toward associations between the relative gene expression of TERT (p = 0.0817) and SP1 (p = 0.0774) in the context of BC subtypes (Luminal with HER2 gene amplification, Luminal without HER2 gene amplification and Triple Negative BC). We observed no such associations between MYC and TP53 expressions. In addition, we observed a trend towards high estrogen receptor expression in patients with increased TP53 expression (above average) (p = 0.0894). Moreover, BC patients with low SP1 and MYC (below average) expression were characterized by high progesterone receptor expression (p = 0.0504 and p = 0.0897, respectively).

2.3. Genetic Variation in TERT, Telomere Length and Expression Level of TP53 and SP1 in BC Patients

We found a link between the expression level of TP53 and SP1, the genetic variability in TERT and telomere length. BC patients with the TERT (rs10069690) A allele (p = 0.0266; Figure 4a) and patients with the TERT (rs2735940) TT genotype had the highest relative expression of the TP53 gene (p = 0.0340; Figure 4b). Additionally, patients with the TERT (rs10069690) A allele had the longest telomeres (p = 0.0056) as compared to patients with the GG genotype (Figure 4c). However, patients with the TT genotype in TERT (rs2735940) did not have the longest telomeres compared to the other rs2735940 genotypes (CC vs. CT, p < 0.0001; CC vs. TT, p = 0.0562; CT vs. TT, p = 0.0074, Figure 4d). No significant associations were observed between either TERT rs2736100 (GG vs. TG, p = 0.5334; GG vs. TT, p = 0.3780; TG vs. TT, p = 0.7571) or TERT rs2853669 (CC vs. CT, p = 0.6034; CC vs. TT, p = 0.9039; CT vs. TT, p = 0.4233) and the relative expression levels of TP53. However, we observed that BC patients with the GG genotype rs2736100 had longer telomeres than women with the TG and TT genotypes (GG vs. TG, p < 0.0001; GG vs. TT, p = 0.0360; TG vs. TT, p = 0.0125).
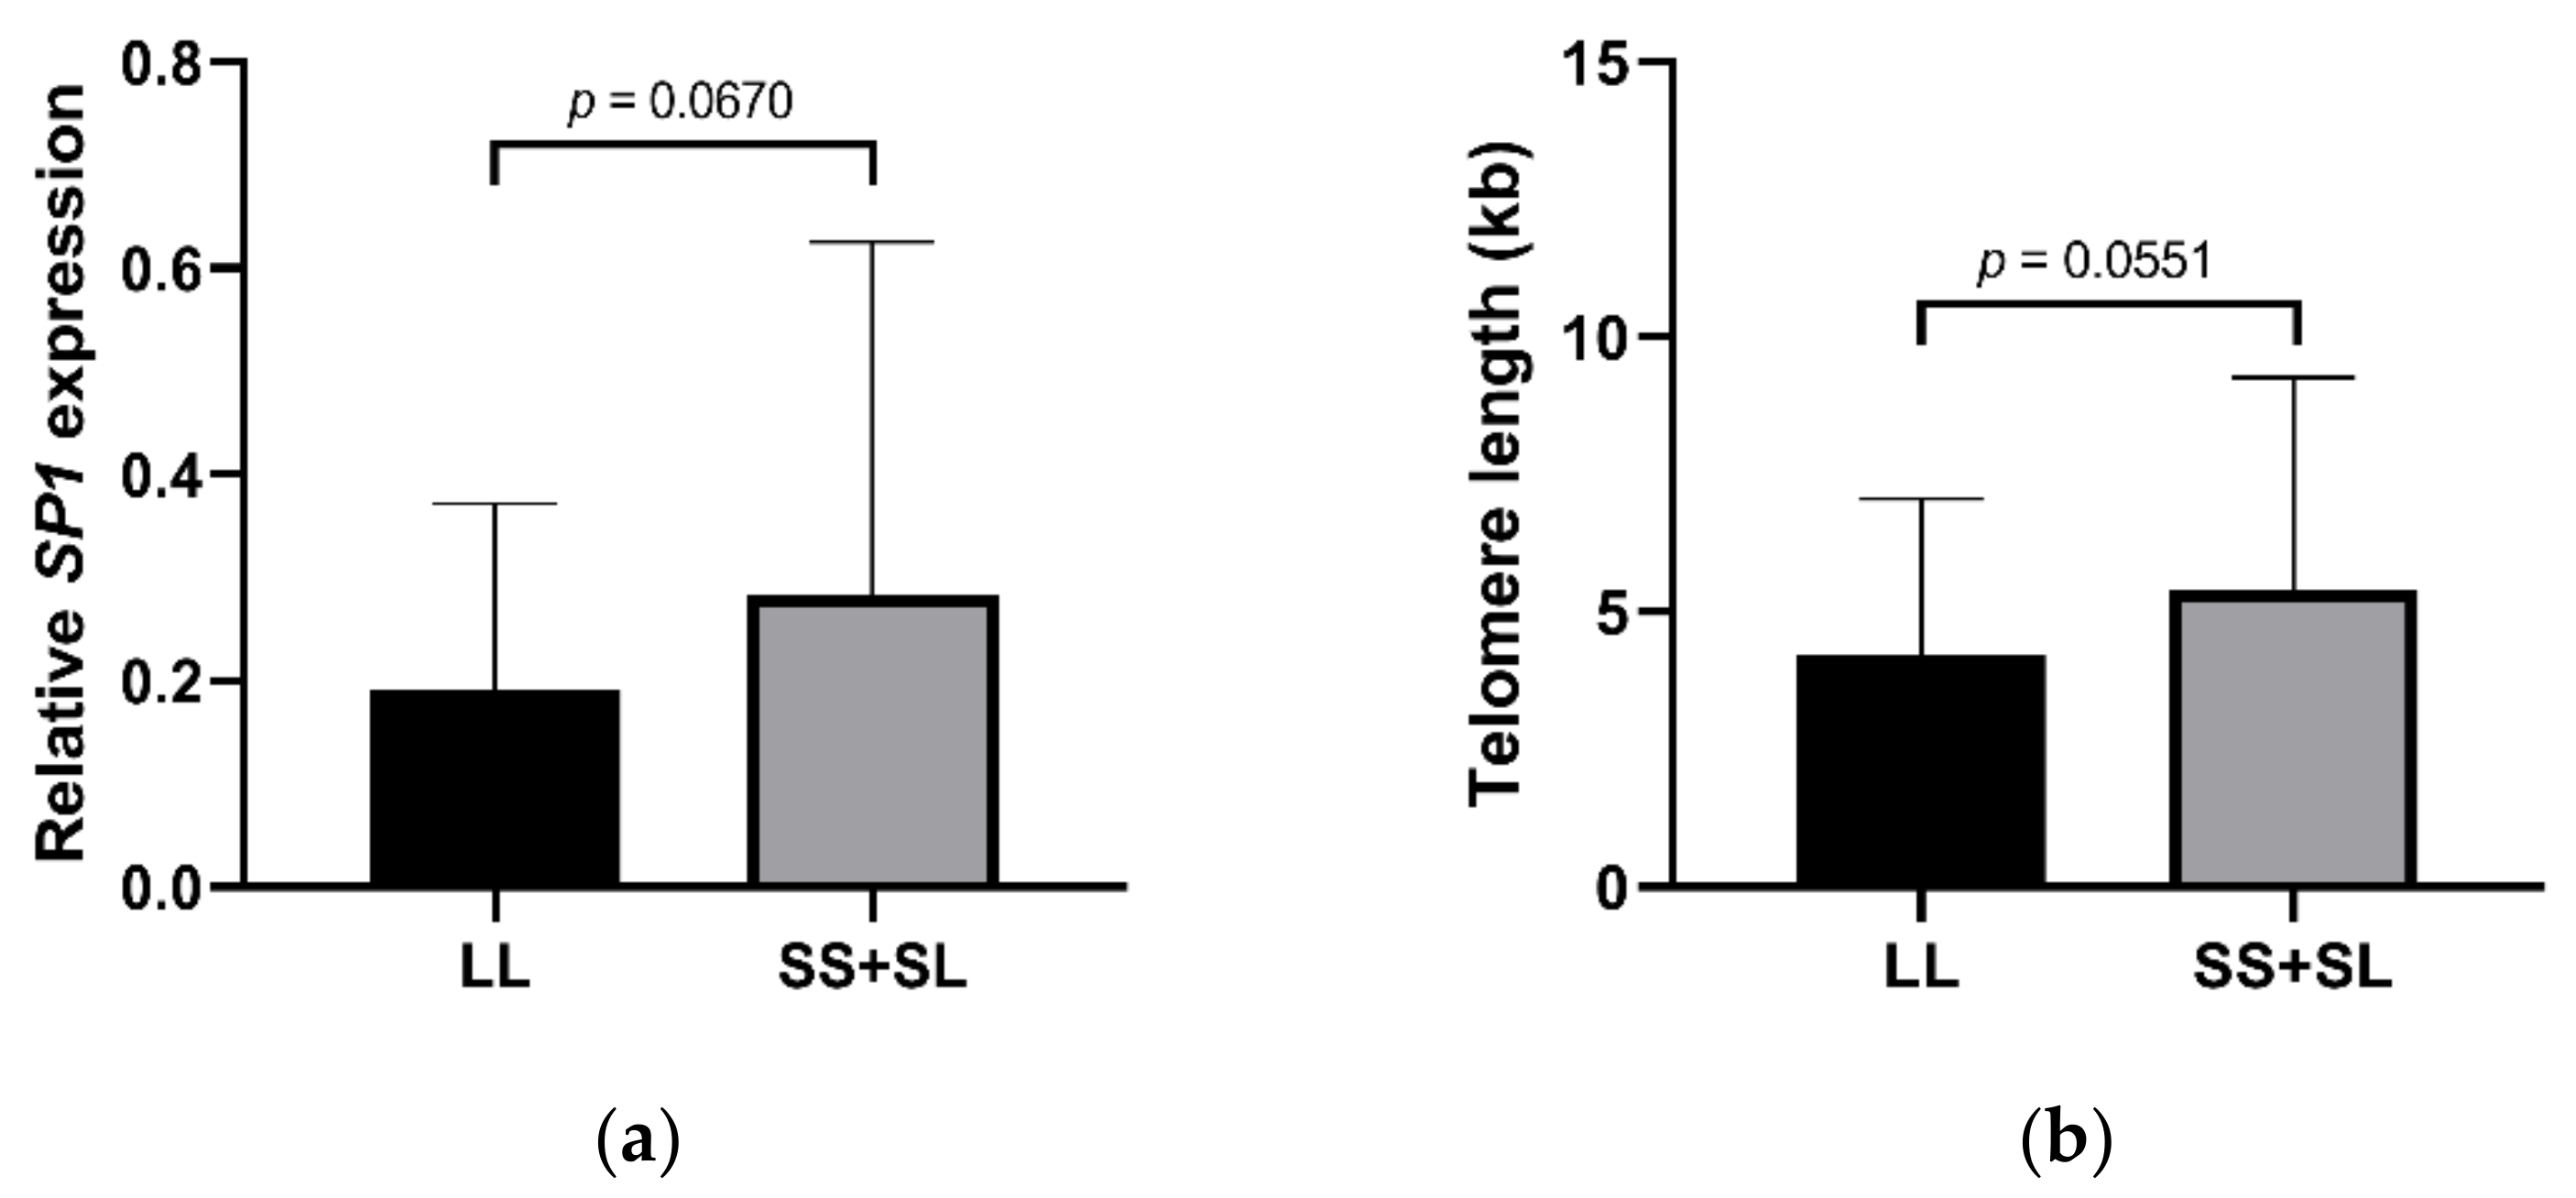
We noticed a trend for a relationship between SP1 gene expression and the TERT VNTR-MNS16A gene polymorphism in BC patients. BC patients with SL (243/302, 243/333, 274/302) and SS (243/243, 274/274, 243/274) VNTR-MNS16A genotypes had a higher relative expression of SP1 (p = 0.0670, Figure 5a) and the longest telomeres compared to the patients with LL genotypes (302/302, 302/333; p = 0.0551; Figure 5b).

2.4. Relationship between Gene Expression, TERT Genetic Variability, Telomere Length and Clinicopathological Hallmarks of Breast Cancer

In the present study, telomere length was measured in three independent groups: BC patients (n = 108), BC organoids (n = 9) and a group of healthy women (n = 100). We did not observe any significant differences between the telomere length in BC patients (4.95 ± 3.61 kb), healthy females (4.43 ± 2.26 kb) (Table 3) and BC organoids (3.75 ± 1.42 kb). We also did not notice any significant differences between the TERT genotypes (rs10069690, rs2735940, rs2736100, rs2853669, VNTR-MNS16A) and telomere length; the details are presented in Table S1 in the Supplementary Materials. In addition, no relationship was observed between telomere length and main clinical features (shown in Table 3).
It was observed that BC patients with an intermediate Ki67 proliferation index (25–50%) had the lowest relative expression of TP53—lower than patients with low (2–20%) and high (60–85%; p = 0.0221) levels of Ki67. Similarly, intermediate levels of Ki67 were characterized by the lowest expression of TERT, although this was not statistically significant. In addition, BC patients lacking the expression of the estrogen receptor tended to have lower relative TP53 expression (p = 0.0894).
Analysis of the TERT polymorphisms showed that BC patients with T allele rs2736100 and C rs2735940 had more invasive tumors (assessed according to histologic grade (G), describing the aggressiveness and dynamics of tumor development) than patients with the GG genotype (rs2736100, p = 0.0008) and TT genotype (rs2735940, p = 0.0055). Moreover, TERT rs10069690 polymorphism showed that patients with the A allele had HER2 gene amplification less frequently (p = 0.0268).
Additionally, BC patients with the GG genotype (rs2736100) had higher parathyroid hormone (PTH) levels (40.64 ± 16.78 pg/mL) than heterozygotes (28.11 ± 10.67 pg/mL; p = 0.0400) and TT homozygotes (35.36 ± 10.82 pg/mL; p = 0.0469). However, in the case of rs2735940 TERT polymorphism, it was observed that the heterozygous group of patients (28.73 ± 10.52 pg/mL) had the lowest concentration of PTH in the blood (p = 0.0408). For the TERT rs2853669 polymorphism, we only observed that BC patients with the TT genotype had higher blood estradiol levels (62.41 ± 61.90 pg/mL) compared to patients with C allele (25.80 ± 53.43 pg/mL; p = 0.0051).
The VNTR-MNS16A analysis showed that women with SS genotypes showed fewer invasive tumors classified by G feature than women with the LL or SL genotypes (p = 0.0181). Moreover, BC patients with heterozygous genotypes (SL) had less HER2 amplification/overexpression than patients with homozygous genotypes (SS + LL) (p = 0.0097).
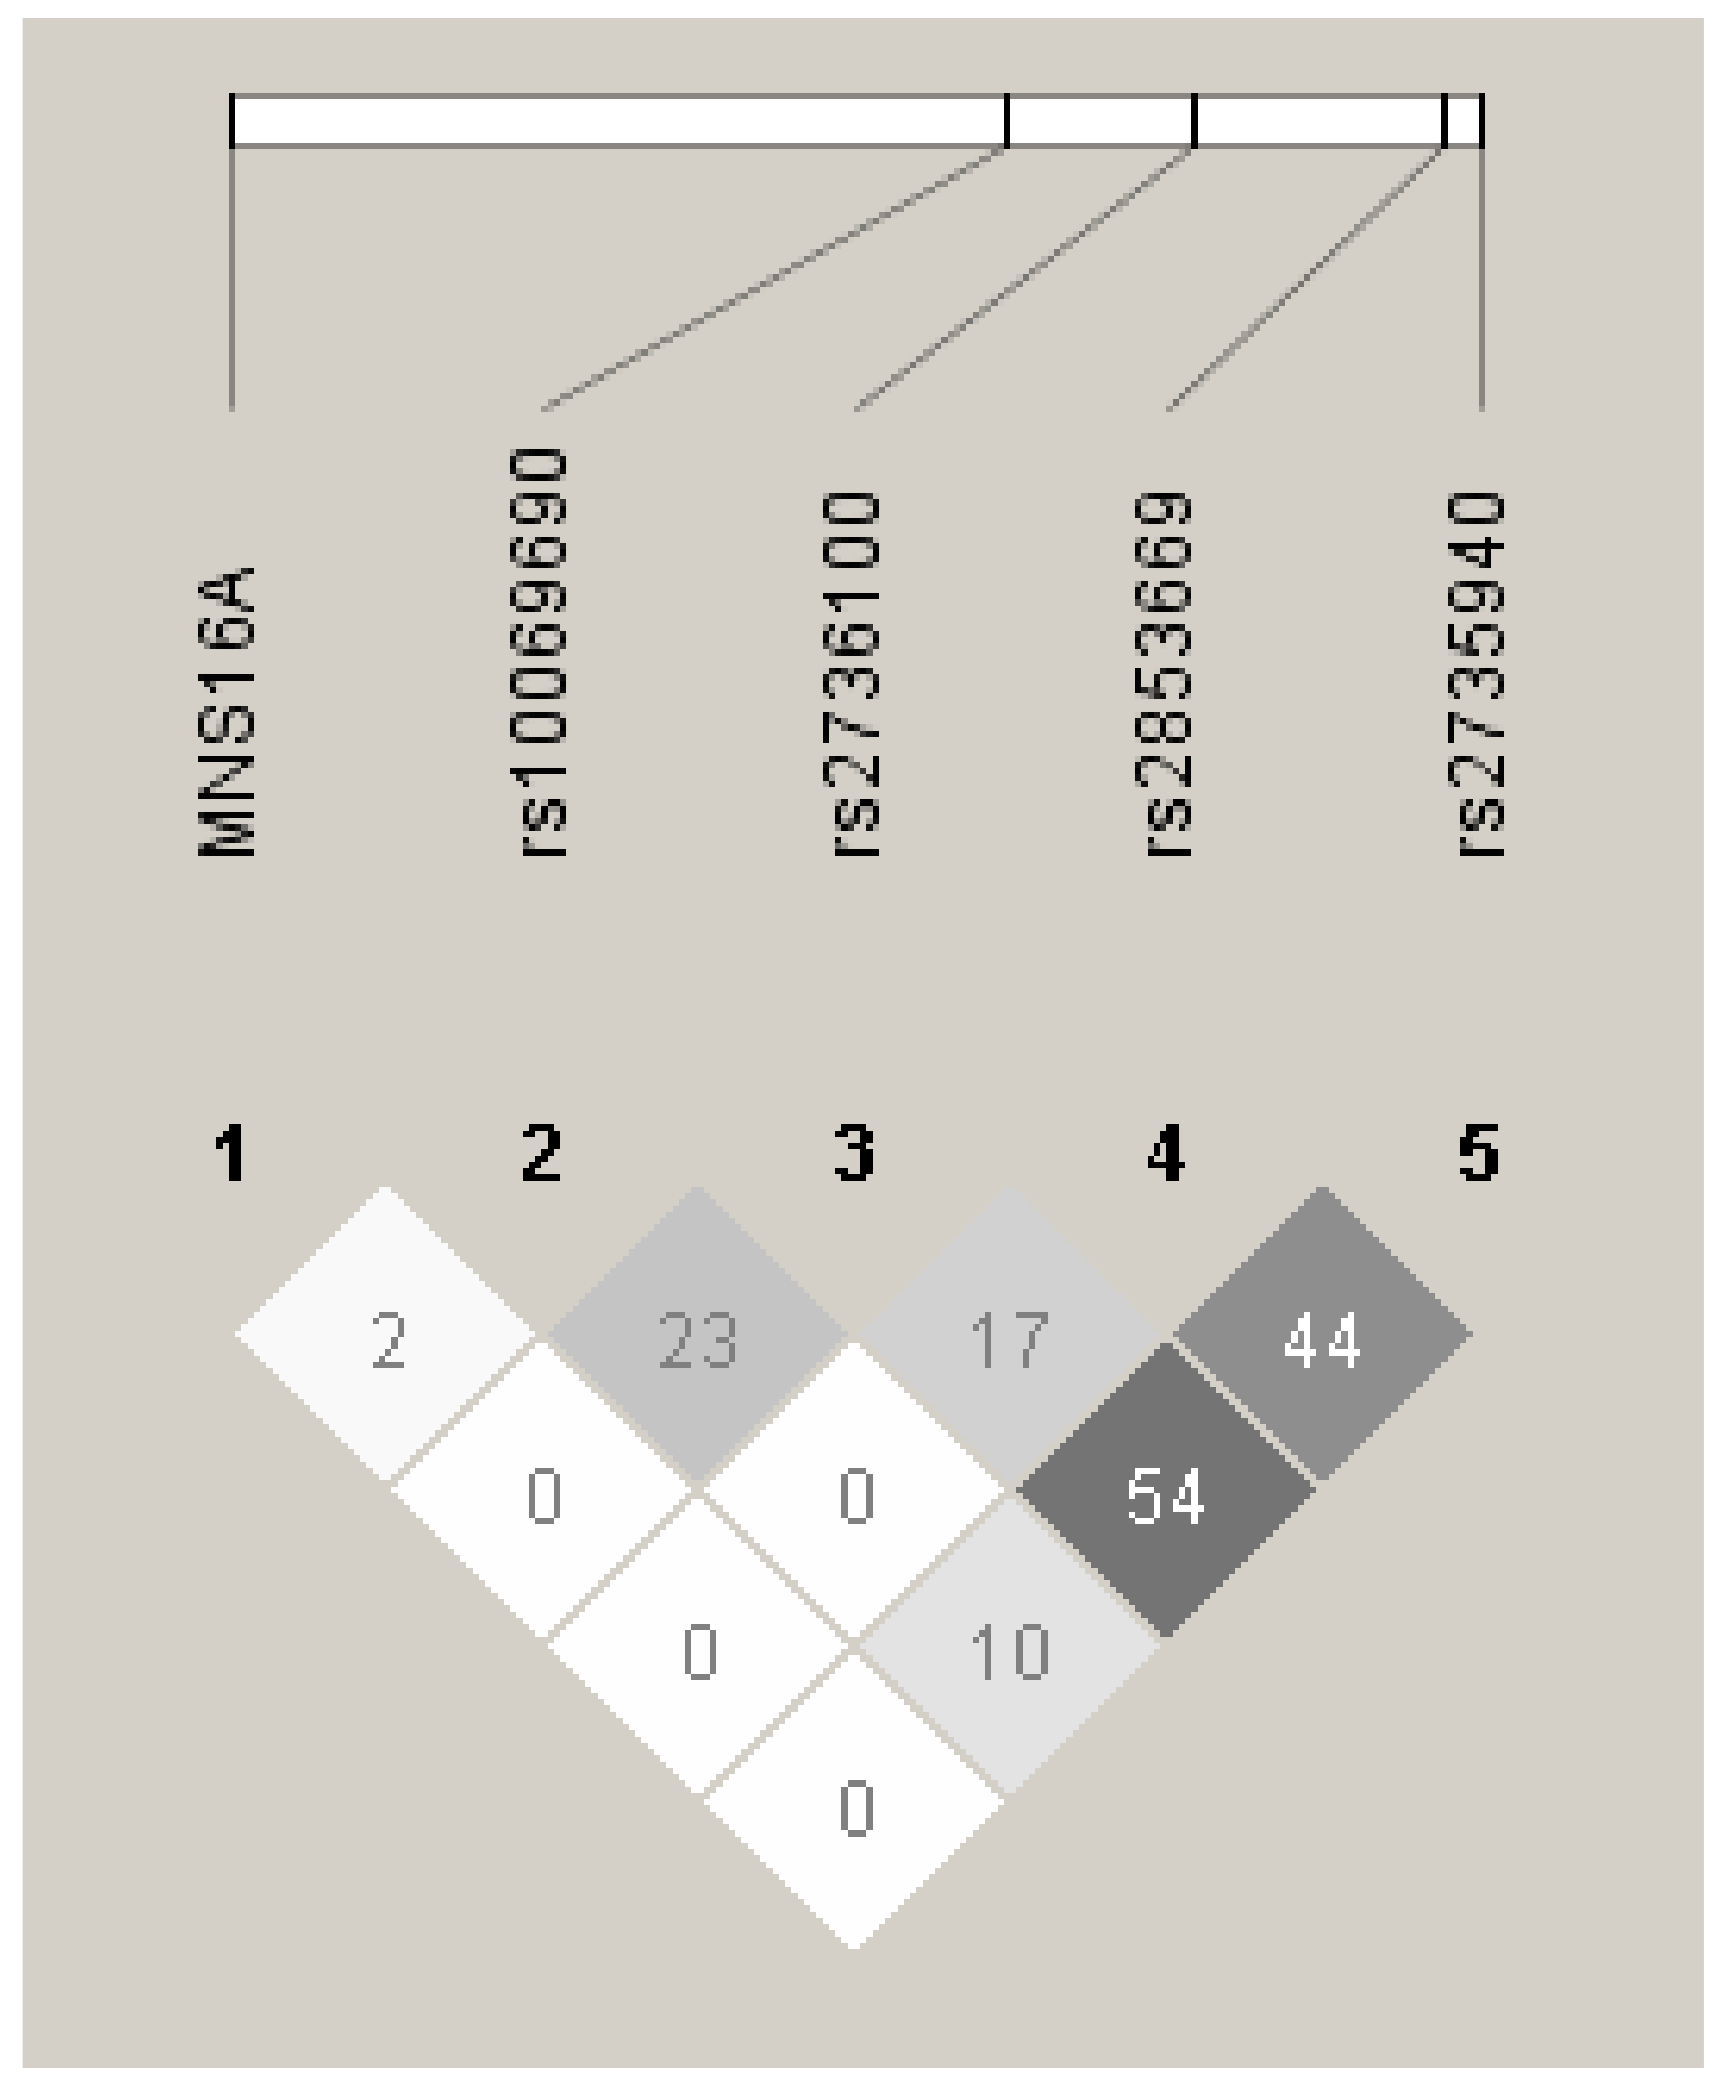
Additionally, we performed a linkage disequilibrium (LD) analysis and found that the two TERT SNPs (rs2736100 and rs2735940) were in a medium LD (r2 = 0.54 in BC patients; Figure 6). Moreover, three TERT SNPs (rs2736100, rs2853669 and rs2735940) were in a low LD (r2 = 0.10 in BC patients; Figure 6).
We observed an association between the two SNPs rs2853669 (allele C) and rs2735940 (genotype TT) by which BC patients with this combination of C allele and TT genotype presented higher levels of estradiol (54.58 ± 63.87 vs. 11.33 ± 11.04 pg/mL; p = 0.0484).
Additionally, further analysis showed that patients with the TCC (rs2736100, rs2853669 and rs2735940, respectively) were characterized by G feature (p = 0.0317). In addition, we observed a relationship between the combination of VNTR-MNS16A (L alleles) and TCC (rs2736100, rs2853669, rs2735940), showing that the BC patients with LTCC had more invasive tumors classified by G feature (p = 0.0029). Another combination showed that BC patients with the alleles T (rs2736100) and A (rs10069690) and with the SL genotype VNTR-MNS16A had a lower frequency of HER2 amplification/overexpression (p = 0.0008).

3. Discussion

Breast cancer (BC) is characterized by a high level of gene heterogeneity. The determination of the molecular/biologic subtypes of BC is an important issue for the classification of this disease according to the status of hormone receptors (estrogen and progesterone), the human epidermal growth factor receptor 2 (HER2) and the Ki67 proliferation index. All these variables, together with the presence of somatic and/or germline mutations, are important for the prognosis and individual treatment of BC patients.
TERT appears to play a significant role in the description of BC [16,17]. Therefore, our research covered TERT gene expression and telomere length, as well as the expression of the transcription factors MYC, SP1 and TP53 detected at the mRNA level. Moreover, the genetic variability of the TERT gene was detected at the level of SNPs and VNTR in the context of telomere length and the clinical parameters of patients with BC.
The TERT gene is a major functional subunit of telomerase, and telomere length is critical to genome stability. Although the molecular mechanisms of TERT regulation have been described in detail in many cancers, it is not well understood in BC. It is known that many cellular processes are related to the presence of telomerase and are associated with apoptosis, uncontrolled cell division, the breakdown of the division cycle and the repair of damaged DNA. In this context, the choice to examine TERT and TP53 gene expression seems justified. Molecular disruptions, e.g., mutation in both TERT and TP53 genes, can alter expression and often lead to aberrant telomerase activation that can induce uncontrolled cell proliferation and oncogenesis in BC.
In the present study, we showed that BC patients with a high Ki67 proliferation index (60–80%) had an increased relative expression of the TP53 gene compared to patients with a low Ki67 index (25–50%), who had a lower TP53 expression. Similar data, although not statistically significant, were observed in the expression of the TERT gene, where high levels of Ki67 were characterized by high TERT expression (see the Results section).
The TP53 gene is a well-known tumor suppressor gene—also known as the “guardian of the genome”—and its mutations may be considered a major biomarker of cancer. Its role has been associated with the regulation of apoptosis, cell cycle control and DNA damage repair processes [18].
We used cells from two sources, the blood of BC patients and BC organoids, to compare the expression of the TERT, TP53, MYC and SP1 genes. We found correlations within the genes TERT and TP53 in both of these two independent cell models.
It is important to know that under physiological conditions, the exposure of cells to various stress signals activates the p53 signaling pathway, allowing cells to activate several transcriptional programs, including cell cycle arrest, DNA repair, senescence and apoptosis, leading to the suppression of tumor growth [19,20]. It should be noted that all these processes are related to telomerase activity and the expression of TERT. Inactivation of the TP53 gene caused by mutation drives cell invasion, proliferation and survival, thereby facilitating cancer progression and metastasis [21]. Marei et al. highlights recent advances in the understanding of the regulatory network by which mutant p53 proteins can modulate the molecular signaling pathways involved in cancer progression and/or protection [22]. A mutation in the TP53 gene is detectable in approximately 50% of human breast, colon, lung, liver, prostate, bladder and skin cancers [23]. Many of these mutant p53 proteins are oncogenic and therefore modulate the ability of cancer cells to proliferate, escape apoptosis, invade and metastasize [24]. TP53 has also been documented to be involved in the cellular responses to dysfunctional telomeres. Guièze et al. showed that patients with chronic lymphocytic leukemia (CLL) with impaired TP53 have severe telomere dysfunction and high genomic instability. This group found that each type of TP53 alteration was associated with very short telomeres and high TERT expression. Additionally, the disruption of TP53 was characterized by the downregulation of the shelterin complex genes within the telomerase complex [25].
In our study, we observed a dual role of telomere length in the context of TP53 expression and TERT variability. BC patients with the TT genotype in the TERT promoter (rs2735940) have a shorter telomere length and higher TP53 expression. The opposite effect was observed in BC patients with A allele in intron 4 (rs10069690), who had a longer telomere length and higher TP53 gene expression (see Figure 4).
The relationship between telomere length and BC risk is contradictory. First, no significant association was found between telomere length and the risk of BC [26,27,28]. Secondly, some recent reports have suggested that longer telomere lengths have been associated with an increased risk of BC [29,30]. Pellat et al.’s study strongly suggests that both telomere length and telomere related genes influence BC risk and that the tumor estrogen and progesterone receptors appear to be important modifiers of the associations with telomere related genes and BC risk [8]. However, other studies found that a shorter telomere length was associated with an increased risk of BC [31]. Shen et al. observed that, overall, telomere length was not significantly associated with the risk of BC. However, they noted that a shorter telomere length may be associated with an increased risk of BC in premenopausal women [31]. Additionally, Pooley et al. found a strong association between a shorter telomere length and BC risk [32]. One study found that both shorter and longer telomeres were associated with an increased risk of BC [33]. Oztas et al. reported that the rs2736100 TERT C allele is not associated with BC risk, but Aydin et al. observed the opposite [34,35]. De Souza Rodrigues et al. showed that the TERT variants rs2736098, rs10069690 and rs2853676 were associated with an increased risk of BC [17]. Additionally, it was observed that the VNTR-MNS16A influences the risk of BC in the Iranian population but not in the Greeks and Americans [36]. A meta-analysis by Aziz et al. did not show any significant associations of rs2853669 (located in the promoter region of TERT) genotypes in Caucasian BC patients [37]. Moreover, Varadi et al. found no clear association between a reduction in hereditary or occasional BC risk with rs2853669 in a cohort of Swedish patients [38].
In our study, we did not observe any significant differences in telomere length in BC patients with the TERT rs2736100 and rs2853669 alleles and genotypes. However, we noticed that patients with TERT VNTR-MNS16A with a short (S) allele had longer telomeres and higher expression of SP1 mRNA (see Figure 5).
In an earlier study, Hofer et al. discussed the role of the VNTR-MNS16A polymorphism in the context of transcription factors and showed that transcription activity depends on various VNTR-MNS16A length variants presenting a different number of transcription factor binding sites for the GATA binding protein 1 [39].
In our study, we noticed a trend towards association between the expression of the SP1 gene and the TERT VNTR-MNS16A gene polymorphism. Our BC patients with the S allele had a higher relative expression of SP1 and longer telomeres than the patients with LL genotypes (see Figure 5a,b).
When we compared the genetic variability of TERT with the clinical data of the BC patients, we showed that BC patients with more invasive tumors were characterized by VNTR-MNS16A L allele and TCC (rs2736100, rs2853669 and rs2735940, respectively). Additionally, BC patients with the T allele (rs2736100), A allele (rs10069690) and SL genotype VNTR-MNS16A had a lower frequency of HER2 amplification/overexpression. Moreover, patients with the TT genotype (rs2735940) and with the C allele (rs2853669) were characterized by lower levels of estradiol and higher levels of progesterone. Regarding the analysis of clinical data, Bojesen et al. showed that TERT rs10069690 is associated with a risk of estrogen receptor negative BC and BC in BRCA1 mutation carriers, which is consistent with another observation that showed that most incidents of BC arising from BRCA1 mutation carriers are estrogen receptor negative [40]. In our present study, we did not observe any significant association of genotype and risk of BC or TERT SNP with estrogen and progesterone receptor status and BRCA1 mutation.
Interesting results documented by Gay-Bellile et al. presented the role of the TERT T349C (rs2853669) promoter polymorphism, which was not correlated with TERT expression, but carriers of the TC and CC genotypes had a significantly shorter disease-free survival [14]. Our present results confirm their observation of TERT expression in both BC patients and BC organoids, as TERT rs2853669 was not associated with TERT expression. Additionally, Gay-Bellile et al. showed that TERT gains found in 15–25% of cases were strongly correlated with increased TERT mRNA expression and worse patient prognosis in terms of disease-free and overall survival [14].
Our study provides definitive evidence of the genetic control of telomere length by some of the genetic variants in the TERT locus (e.g., VNTR-MNS16A, rs2735940, rs10069690). Additionally, we showed that TERT genetic variants could be potential prognostic biomarkers of BC associated with tumor invasiveness. Given the limitations of this study, future studies with a larger sample size to validate the current findings are needed, as well as functional studies to reveal the role of the TERT gene polymorphism and mRNA expression in BC carcinogenesis.

4. Materials and Methods

4.1. Patients and Controls

The study included 108 Polish women (age range at diagnosis: 32–86 years, median 61 years) treated for invasive breast cancer at the Lower Silesian Oncology, Pulmonology and Hematology Center (Wroclaw, Poland). The blood samples were collected at diagnosis after obtaining informed consent from the patients. All methods were according to the Declaration of Helsinki. The approval of the Bioethical Committee of Wroclaw Medical University was obtained for the study (No. KB—808/2019). Additionally, 100 healthy blood donors (age range: 18–59, median 21 years) served as a control group for the study of TERT polymorphisms and telomere length. Relationships between telomere length and the various clinical parameters of the studied group are presented in Table 3. Our study group included 8 women with different variants of germline mutations in the BRCA1 (c.181T > G (p.Cys61Gly); c.5266dupC)), BRCA2 (c.9227G > A; c.10202C > T (p.Thr3401Met)), CHEK2 (c.444 + 1G > A (IVS3 + 1G > A)) and PALB2 (c.172_175del) genes, 74 BC patients without these germline mutations and 26 BC patients who were not tested for germline mutations. All BC patients and control subjects were Polish Caucasians recruited from the population of Lower Silesia (south-western province of Poland, ≈ 2.9 M population in 2019).

4.2. Breast Cancer Organoids

The sample was the tissue from eight BC patients (age range at diagnosis: 37–76 years old, median 47 years) with infiltrating duct carcinoma [(NOS) 8500/3] G1, 2, 3 before radiotherapy, chemotherapy and other treatment. The tissues were delivered as a postoperational material from the Gdynia Oncology Center of the Polish Red Cross Maritime Hospital. The human material was sampled according to the local bioethical commission guidelines (but no particular permission was required since the material was obtained within regular surgery operations removing carcinoma). However, according to the bioethical commission guidelines, the informed consent of the patient was necessary and was obtained each time. The tissues were then washed using phosphate buffer saline (PBS 1 ×, Gibco, Waltham, MA, USA) and preserved in the transfer medium consisting of DMEM/F12, +10% Fetal Bovine Serum (FBS, Sigma-Aldrich, Saint Louis, MO, USA) + 100 µg/mL Penicillin/Streptomycin + 5 µg/mL Piramycin + 50 U/mL Polymyxin B before being isolated. After that, the tissues were washed with 1 × PBS in a Petri dish and then cut into small pieces using a surgical scalpel. The sample fragments were washed again with 1 × PBS, inserted into a 15 mL falcon tube (Sigma-Aldrich, Saint Louis, MO, USA) containing the mixed enzyme solution and then incubated for 16 h, 300 rpm, 37 °C. After incubation, the samples were filtered using 100 μm and 40 μm cell strainer (Corning, New York, NY, USA) and then centrifuged at 600× g for 5 min. The supernatant was discarded, and the pellet containing tissue fragments was washed with 1 × PBS and centrifuged at 600× g for 5 min. One part of the material was frozen using RNA later (Thermo Fisher Scientific, Waltham, MA, USA) or 50% DMEM/F12 + 44% FBS + 6% Dimethyl sulfoxide (DMSO, Sigma-Aldrich, Saint Louis, MO, USA) and Nunc type freezing ampoules (Thermo Fisher Scientific, Waltham, MA, USA). The remnant pellet was then resuspended with the culture initiation media and cultured in a 6-well plate (37 °C, 5% CO2) for 48 h. Afterwards, the media mix was removed and the stimulation medium was added, which was replaced every 3 days. Next, the cells were transferred into T75 flasks and cultured in the stimulation medium until reaching a confluence of 80%. The cultured cells were then detached using trypsin (Sigma-Aldrich, Saint Louis, MO, USA) and incubated for 1–3 min at 37 °C, and medium containing FBS was added to neutralize trypsin. The detached cells were centrifuged at 600× g for 5 min at room temperature. The cells were counted using a Z series Coulter Counter by Beckman Coulter, Indianapolis, IN, USA. Eventually, the cells were frozen using RNA later or 75% stimulation medium + 15% FBS + 10% DMSO and Nunc type freezing ampoules. The ampoules were stored at −80 °C until further analysis.

4.3. DNA Extraction

Genomic DNA was isolated from 200 μL of peripheral blood taken on EDTA using the NucleoSpin Blood kit (MACHEREY-NAGEL GmbH & Co. KG, Dueren, Germany) according to the manufacturer’s instructions. Genomic DNA from the BC organoids was isolated using NucleoSpin Tissue XS kits (MACHEREY-NAGEL GmbH & Co. KG, Dueren, Germany). DNA concentration and purity were quantified on a DeNovix DS-11 spectrophotometer (DeNovix Inc., Wilmington, DE, USA). The isolated DNA was then stored at −20 °C until TERT genotyping and evaluation of the telomere length in patients with BC and BC organoids.

4.4. Genotyping of TERT Gene Polymorphisms

The selection of the studied single nucleotide polymorphisms (SNPs) within the TERT gene was based on results of the SNP Function Prediction tool available on the website of the National Institute of Environmental Health Sciences (NCBI Database), as well as other auxiliary databases (https://snpinfo.niehs.nih.gov/snpinfo/snpfunc.html (accessed on 2 February 2022); https://www.ncbi.nlm.nih.gov/snp/ (accessed on 2 February 2022); https://www.ensembl.org/index.html (accessed on 2 February 2022). The following criteria were used: minor allele frequency in Caucasians above 10%, change in RNA and/or amino acid chain, potential splicing site and/or miRNA binding site.
Based on the above criteria, four TERT SNPs were selected for the study: rs10069690 (G > A) located in intron 4; rs2736100 (G > T) located in intron 2; rs2853669 (T > C) and rs2735940 (T > C), both located in the promoter region at −245 bp (Ets2 binding site) and 1327 bp upstream of the transcription start site, respectively. The TERT polymorphisms were determined by LightSNiP typing assays (TIB MOLBIOL, Berlin, Germany) using quantitative polymerase chain reaction (qPCR). Amplifications were performed on a LightCycler480 II Real-Time PCR system (Roche Diagnostics International AG, Rotkreuz, Switzerland) according to the recommendations of the manufacturer. The PCR conditions were as follows: 95 °C for 10 min followed by 45 cycles of 95 °C for 10 s, 60 °C for 10 s and 72 °C for 15 s. PCR was followed by one cycle of 95 °C for 30 s, 40 °C for 2 min and gradual melting from 75 °C to 40 °C.

4.5. VNTR-MNS16A Genotyping of the TERT Gene

The presence of the VNTR-MNS16A TERT gene polymorphism was assessed in BC patients and in healthy women by PCR amplification followed by electrophoresis in sequencing gel, as described by Wysoczanska et al. [41]. PCR was performed in a 2720 Thermal Cycler instrument (Applied Biosystems, Foster City, CA, USA) using the forward and reverse primer sequences (5′-AGGATTCTGATCTCTGAAGGGTG-3′ and 5′-TAMRA-TCTGCCTGAGGAAGGACGTATG-3′) prepared by Genomed (Warsaw, Poland). The amplification procedure included an initial denaturation step for 5 min at 95 °C, followed by 35 cycles: 30 s at 95 °C, 30 s at 65 °C, 30 s at 72 °C and a final extension step for 10 min at 72 °C. The PCR products were diluted with formamide and a GeneScan™500 ROX™ dye Size Standard (Applied Biosystems, Foster City, CA, USA). The samples were denatured at 95 °C for 5 min and analyzed on the 3500 Genetic Analyzer (Applied Biosystems, Foster City, CA, USA) with an eight-capillary system filled with POP7 polymer (Applied Biosystems, Foster City, CA, USA). The alleles were identified using the GeneMapper software version 4.2 (Applied Biosystems, Foster City, CA, USA).

4.6. Quantification of Telomere Length

Mean telomere length was measured in the genomic DNA samples of 108 BC patients, 100 controls and 9 BC organoids. The DNA samples were diluted with nuclease-free water to a concentration of 5 ng/mL. Telomere length measurements were performed on a LightCycler480 II Real-Time PCR system (Roche Diagnostics International, Rotkreuz, Switzerland) using qPCR test kits (ScienCell’s Absolute Human Telomere Length Quantification qPCR Assay Kit [AHTLQ], Carlsbad, CA, USA), as previously described by Dratwa et al. [42]. The PCR conditions were as follows: 95 °C for 10 min followed by 32 cycles of 95 °C for 20 s, 52 °C for 20 s and 72 °C for 45 s. Data analysis was conducted according to the manufacturer’s instructions. All reactions were run in three replicates.

4.7. Extraction of RNA, Reverse Transcription and TERT, SP1, MYC and TP53 Genes Expression Study

The RNA of 50 patients with BC and 9 BC organoids was extracted from 106 cells suspended in RNA Extracol (EURx, Gdansk, Poland) or RNA later (Thermo Fisher Scientific, Waltham, MA, USA) according to the manufacturer’s instructions. RNA purity and integrity were verified on a DeNovix DS-11 spectrophotometer (DeNovix Inc., Wilmington, DE, USA) and gel electrophoresis. A total of 1 μg/μL of the isolated RNA was used for the reverse transcription reaction. cDNA was synthesized using the High Capacity cDNA Reverse Transcriptase kit (Applied Biosystems™, Foster City, CA, USA), and 0.5 μL of RNase Inhibitor (Applied Biosystems™, Foster City, CA, USA) was added per sample to convert the extracted and purified RNA into cDNA. The conversion step was performed on a SimpliAmp™ Thermal Cycler (Applied Biosystems®, Foster City, CA, USA). After this step, the samples were stored in a freezer at −20 °C until further use.
Four genes were included in the expression experiments: TERT (Hs_00972,650_m1), SP1 (Hs_00916521_m1), MYC (Hs_00153408_m1) and TP53 (Hs_01034249_m1). GAPDH (Hs02786624_g1) and ACTB (Hs_01060665_g1) were used as housekeeping genes to normalize RNA expression data. TaqMan® Gene expression assays were used for detection (Applied Biosystems Foster City, CA, USA), and qPCR was performed using the LightCycler 480 II Real-Time PCR system (Roche Diagnostics International, Rotkreuz, Switzerland). The following protocol was used for each PCR sample: 5 μL of cDNA, 1 μL (20×) each primer/probe, 10 μL (2×) of TaqMan® Gene Expression Master Mix (Applied Biosystems™, Foster City, CA, USA), 4 μL of ultra-pure water. Amplification was performed under the following conditions: initial denaturation for 10 min at 95 °C was followed by 40 cycles of denaturation for 15 s at 95 °C and annealing for 1 min at 60 °C. Relative genes’ expression levels were calculated by the 2−ΔCT method. Each sample was analyzed in triplicate to validate the technique and CT values, according to the international standards for the evaluation of gene expression by real-time PCR.

4.8. Statistical Analysis

The null hypothesis that there is no difference between the frequency of alleles and genotypes between patients and controls was verified with the Fisher’s exact test, calculated using the online tool http://vassarstats.net/tab2x2.htm (version as of 2 February 2022). In each experiment, the normality of the data was verified with the Shapiro-Wilk test. The remaining statistical analyses of the differences between the groups were performed using one-way analysis of variance (ANOVA) to determine the significance of intergroup differences, and the obtained p-values were corrected by the Benjamini and Hochberg method. Taking into account that the distribution of some data deviates from the normal distribution, the non-parametric U Mann–Whitney test was performed for the comparison of telomere lengths and gene expression. The correlations were statistically evaluated using the Pearson correlation (PC) test or the Spearman r test. The statistical calculations were performed by the GraphPad Prism software (GraphPad Software, La Jolla, CA, USA, version 8.0.1) and the Real Statistics Resource Pack for Microsoft Excel 2019 (version 16.0.10369.20032, Microsoft Corporation, Redmont, Washington, DC, USA). The probability (p) values < 0.05 were considered statistically significant, while the trend index was between 0.05 and 0.10.

Supplementary Materials

The following supporting information can be downloaded at: https://www.mdpi.com/article/10.3390/ijms23095164/s1.

Author Contributions

Conceptualization, M.D., B.W. and K.B.-K.; methodology, M.D., B.W., W.B., M.S.-S., M.B., J.W. and K.B.-K.; formal analysis, M.D., B.W. and K.B.-K.; investigation, M.D. and W.B.; resources, M.D., W.B., M.S.-S, M.B., R.M., M.E., J.S., A.M., J.W., M.S. and K.B.-K.; data curation, M.D., W.B., M.S.-S., R.M. and K.B.-K.; writing—original draft preparation, M.D., B.W., W.B. and K.B.-K.; writing—review and editing, M.D., B.W., W.B., M.S.-S., M.B., R.M, M.E., J.S., A.M., J.W., M.S and K.B.-K.; supervision, J.W., M.B. and K.B.-K.; project administration, M.B., J.W. and K.B.-K.; All authors have read and agreed to the published version of the manuscript.

Funding

This work was supported by the TARGETTELO project No. STRATEGMED3/306853 from the National Centre for Research and Development, Warsaw, Poland. This research was partially funded by the Polish National Science Center, grant number 2017/27/B/NZ5/01167.

Institutional Review Board Statement

This study was conducted according to the guidelines of the Declaration of Helsinki and approved by the Institutional Ethics Committee of Wroclaw Medical University (protocol code: 808/2019).

Informed Consent Statement

Informed consent was obtained from all subjects involved in the study.

Data Availability Statement

The data presented in this study are available upon request from the corresponding author. The data are not publicly available due to privacy or ethical restrictions.

Acknowledgments

The authors would like to thank Natalia Labedz and Artur Anisiewicz for their assistance.

Conflicts of Interest

The authors declare no conflict of interest.

References

  1. Sung, H.; Ferlay, J.; Siegel, R.L.; Laversanne, M.; Soerjomataram, I.; Jemal, A.; Bray, F. Global Cancer Statistics 2020: GLOBOCAN Estimates of Incidence and Mortality Worldwide for 36 Cancers in 185 Countries. CA Cancer J. Clin. 2021, 71, 209–249. [Google Scholar] [CrossRef] [PubMed]
  2. Yadav, S.; LaDuca, H.; Polley, E.C.; Hu, C.; Niguidula, N.; Shimelis, H.; Lilyquist, J.; Na, J.; Lee, K.Y.; Gutierrez, S.; et al. Racial and Ethnic Differences in Multigene Hereditary Cancer Panel Test Results for Women with Breast Cancer. J. Natl. Cancer Inst. 2021, 113, 1429–1433. [Google Scholar] [CrossRef] [PubMed]
  3. Woodward, E.R.; van Veen, E.M.; Evans, D.G. From BRCA1 to Polygenic Risk Scores: Mutation-Associated Risks in Breast Cancer-Related Genes. Breast Care 2021, 16, 202–213. [Google Scholar] [CrossRef] [PubMed]
  4. Li, Z.Y.; Dong, Y.L.; Feng, Y.; Zhang, Z.; Cao, X.Z. Polymorphisms in the telomerase reverse transcriptase promoter are associated with risk of breast cancer: A meta-analysis. J. Cancer Res. Ther. 2016, 12, 1040–1044. [Google Scholar] [CrossRef]
  5. Chen, H.; Majumdar, A.; Wang, L.; Kar, S.; Brown, K.M.; Feng, H.; Turman, C.; Dennis, J.; Easton, D.; Michailidou, K.; et al. Large-scale cross-cancer fine-mapping of the 5p15.33 region reveals multiple independent signals. HGG Adv. 2021, 2, 100041. [Google Scholar] [CrossRef]
  6. Haiman, C.A.; Chen, G.K.; Vachon, C.M.; Canzian, F.; Dunning, A.; Millikan, R.C.; Wang, X.; Ademuyiwa, F.; Ahmed, S.; Ambrosone, C.B.; et al. A common variant at the TERT-CLPTM1L locus is associated with estrogen receptor-negative breast cancer. Nat. Genet. 2011, 43, 1210–1214. [Google Scholar] [CrossRef]
  7. Savage, S.A.; Chanock, S.J.; Lissowska, J.; Brinton, L.A.; Richesson, D.; Peplonska, B.; Bardin-Mikolajczak, A.; Zatonski, W.; Szeszenia-Dabrowska, N.; Garcia-Closas, M. Genetic variation in five genes important in telomere biology and risk for breast cancer. Br. J. Cancer 2007, 97, 832–836. [Google Scholar] [CrossRef] [Green Version]
  8. Pellatt, A.J.; Wolff, R.K.; Torres-Mejia, G.; John, E.M.; Herrick, J.S.; Lundgreen, A.; Baumgartner, K.B.; Giuliano, A.R.; Hines, L.M.; Fejerman, L.; et al. Telomere length, telomere-related genes, and breast cancer risk: The breast cancer health disparities study. Genes Chromosomes Cancer 2013, 52, 595–609. [Google Scholar] [CrossRef] [Green Version]
  9. Daniel, M.; Peek, G.W.; Tollefsbol, T.O. Regulation of the human catalytic subunit of telomerase (hTERT). Gene 2012, 498, 135–146. [Google Scholar] [CrossRef] [Green Version]
  10. Kirkpatrick, K.L.; Clark, G.; Ghilchick, M.; Newbold, R.F.; Mokbel, K. hTERT mRNA expression correlates with telomerase activity in human breast cancer. Eur. J. Surg. Oncol. 2003, 29, 321–326. [Google Scholar] [CrossRef] [Green Version]
  11. Xu, D.; Dwyer, J.; Li, H.; Duan, W.; Liu, J.P. Ets2 maintains hTERT gene expression and breast cancer cell proliferation by interacting with c-Myc. J. Biol. Chem. 2008, 283, 23567–23580. [Google Scholar] [CrossRef] [PubMed] [Green Version]
  12. Kyo, S.; Takakura, M.; Taira, T.; Kanaya, T.; Itoh, H.; Yutsudo, M.; Ariga, H.; Inoue, M. Sp1 cooperates with c-Myc to activate transcription of the human telomerase reverse transcriptase gene (hTERT). Nucleic Acids Res. 2000, 28, 669–677. [Google Scholar] [CrossRef] [Green Version]
  13. Helbig, S.; Wockner, L.; Bouendeu, A.; Hille-Betz, U.; McCue, K.; French, J.D.; Edwards, S.L.; Pickett, H.A.; Reddel, R.R.; Chenevix-Trench, G.; et al. Functional dissection of breast cancer risk-associated TERT promoter variants. Oncotarget 2017, 8, 67203–67217. [Google Scholar] [CrossRef] [PubMed]
  14. Gay-Bellile, M.; Véronèse, L.; Combes, P.; Eymard-Pierre, E.; Kwiatkowski, F.; Dauplat, M.M.; Cayre, A.; Privat, M.; Abrial, C.; Bignon, Y.J.; et al. TERT promoter status and gene copy number gains: Effect on TERT expression and association with prognosis in breast cancer. Oncotarget 2017, 8, 77540–77551. [Google Scholar] [CrossRef] [PubMed]
  15. Da Silva, E.M.; Selenica, P.; Vahdatinia, M.; Pareja, F.; Da Cruz Paula, A.; Ferrando, L.; Gazzo, A.M.; Dopeso, H.; Ross, D.S.; Bakhteri, A.; et al. TERT promoter hotspot mutations and gene amplification in metaplastic breast cancer. NPJ Breast Cancer 2021, 7, 43. [Google Scholar] [CrossRef] [PubMed]
  16. Kroupa, M.; Rachakonda, S.; Vymetalkova, V.; Tomasova, K.; Liska, V.; Vodenkova, S.; Cumova, A.; Rossnerova, A.; Vodickova, L.; Hemminki, K.; et al. Telomere length in peripheral blood lymphocytes related to genetic variation in telomerase, prognosis and clinicopathological features in breast cancer patients. Mutagenesis 2020, 35, 491–497. [Google Scholar] [CrossRef]
  17. De Souza Rodrigues, K.; Nunes de Matos Neto, J.; Haddad, R.; Madureira de Oliveira, D. Clinical relevance of telomerase polymorphism for breast cancer: A systematic review. J. BUON 2017, 22, 1494–1499. [Google Scholar]
  18. Vogelstein, B.; Lane, D.; Levine, A.J. Surfing the p53 network. Nature 2000, 408, 307–310. [Google Scholar] [CrossRef]
  19. Kastenhuber, E.R.; Lowe, S.W. Putting p53 in Context. Cell 2017, 170, 1062–1078. [Google Scholar] [CrossRef] [Green Version]
  20. Salomao, N.; Karakostis, K.; Hupp, T.; Vollrath, F.; Vojtesek, B.; Fahraeus, R. What do we need to know and understand about p53 to improve its clinical value? J. Pathol. 2021, 254, 443–453. [Google Scholar] [CrossRef]
  21. Miller, L.D.; Smeds, J.; George, J.; Vega, V.B.; Vergara, L.; Ploner, A.; Pawitan, Y.; Hall, P.; Klaar, S.; Liu, E.T.; et al. An expression signature for p53 status in human breast cancer predicts mutation status, transcriptional effects, and patient survival. Proc. Natl. Acad. Sci. USA 2005, 102, 13550–13555. [Google Scholar] [CrossRef] [PubMed] [Green Version]
  22. Marei, H.E.; Althani, A.; Afifi, N.; Hasan, A.; Caceci, T.; Pozzoli, G.; Morrione, A.; Giordano, A.; Cenciarelli, C. p53 signaling in cancer progression and therapy. Cancer Cell Int. 2021, 21, 703. [Google Scholar] [CrossRef] [PubMed]
  23. Parikh, N.; Hilsenbeck, S.; Creighton, C.J.; Dayaram, T.; Shuck, R.; Shinbrot, E.; Xi, L.; Gibbs, R.A.; Wheeler, D.A.; Donehower, L.A. Effects of TP53 mutational status on gene expression patterns across 10 human cancer types. J. Pathol. 2014, 232, 522–533. [Google Scholar] [CrossRef] [PubMed] [Green Version]
  24. Silwal-Pandit, L.; Vollan, H.K.; Chin, S.F.; Rueda, O.M.; McKinney, S.; Osako, T.; Quigley, D.A.; Kristensen, V.N.; Aparicio, S.; Børresen-Dale, A.L.; et al. TP53 mutation spectrum in breast cancer is subtype specific and has distinct prognostic relevance. Clin. Cancer Res. 2014, 20, 3569–3580. [Google Scholar] [CrossRef] [PubMed] [Green Version]
  25. Guièze, R.; Pages, M.; Véronèse, L.; Combes, P.; Lemal, R.; Gay-Bellile, M.; Chauvet, M.; Callanan, M.; Kwiatkowski, F.; Pereira, B.; et al. Telomere status in chronic lymphocytic leukemia with TP53 disruption. Oncotarget 2016, 7, 56976–56985. [Google Scholar] [CrossRef] [PubMed] [Green Version]
  26. De Vivo, I.; Prescott, J.; Wong, J.Y.; Kraft, P.; Hankinson, S.E.; Hunter, D.J. A prospective study of relative telomere length and postmenopausal breast cancer risk. Cancer Epidemiol. Biomark. Prev. 2009, 18, 1152–1156. [Google Scholar] [CrossRef] [Green Version]
  27. Zheng, Y.L.; Ambrosone, C.; Byrne, C.; Davis, W.; Nesline, M.; McCann, S.E. Telomere length in blood cells and breast cancer risk: Investigations in two case-control studies. Breast Cancer Res. Treat. 2010, 120, 769–775. [Google Scholar] [CrossRef] [Green Version]
  28. Kim, S.; Sandler, D.P.; Carswell, G.; De Roo, L.A.; Parks, C.G.; Cawthon, R.; Weinberg, C.R.; Taylor, J.A. Telomere length in peripheral blood and breast cancer risk in a prospective case-cohort analysis: Results from the Sister Study. Cancer Causes Control. 2011, 22, 1061–1066. [Google Scholar] [CrossRef] [Green Version]
  29. Svenson, U.; Nordfjäll, K.; Stegmayr, B.; Manjer, J.; Nilsson, P.; Tavelin, B.; Henriksson, R.; Lenner, P.; Roos, G. Breast cancer survival is associated with telomere length in peripheral blood cells. Cancer Res. 2008, 68, 3618–3623. [Google Scholar] [CrossRef] [Green Version]
  30. Gramatges, M.M.; Telli, M.L.; Balise, R.; Ford, J.M. Longer relative telomere length in blood from women with sporadic and familial breast cancer compared with healthy controls. Cancer Epidemiol. Biomark. Prev. 2010, 19, 605–613. [Google Scholar] [CrossRef] [Green Version]
  31. Shen, J.; Terry, M.B.; Gurvich, I.; Liao, Y.; Senie, R.T.; Santella, R.M. Short Telomere Length and Breast Cancer Risk: A Study in Sister Sets. Cancer Res. 2007, 67, 5538–5544. [Google Scholar] [CrossRef] [PubMed] [Green Version]
  32. Pooley, K.A.; Sandhu, M.S.; Tyrer, J.; Shah, M.; Driver, K.E.; Luben, R.N.; Bingham, S.A.; Ponder, B.A.; Pharoah, P.D.; Khaw, K.T.; et al. Telomere length in prospective and retrospective cancer case-control studies. Cancer Res. 2010, 70, 3170–3176. [Google Scholar] [CrossRef] [Green Version]
  33. Qu, S.; Wen, W.; Shu, X.O.; Chow, W.H.; Xiang, Y.B.; Wu, J.; Ji, B.T.; Rothman, N.; Yang, G.; Cai, Q.; et al. Association of leukocyte telomere length with breast cancer risk: Nested case-control findings from the Shanghai Women’s Health Study. Am. J. Epidemiol. 2013, 177, 617–624. [Google Scholar] [CrossRef] [PubMed] [Green Version]
  34. Oztas, E.; Kara, H.; Kara, Z.P.; Aydogan, M.U.; Uras, C.; Ozhan, G. Association Between Human Telomerase Reverse Transcriptase Gene Variations and Risk of Developing Breast Cancer. Genet. Test Mol. Biomark. 2016, 20, 459–464. [Google Scholar] [CrossRef] [PubMed]
  35. Aydin, M.; Sümbül, A.T.; Camuz Hilaloğullari, G.; Bayram, S. Genetic polymorphisms in human telomerase reverse transcriptase (hTERT) gene polymorphisms do not associated with breast cancer in patients in a turkish population: Hospital-based case-control study. Cell Mol. Biol. 2018, 64, 108–115. [Google Scholar] [CrossRef]
  36. Zagouri, F.; Sergentanis, T.N.; Gazouli, M.; Tsigginou, A.; Dimitrakakis, C.; Eleutherakis-Papaiakovou, E.; Papaspyrou, I.; Chrysikos, D.; Theodoropoulos, G.; Zografos, G.C.; et al. HTERT MNS16A polymorphism in breast cancer: A case-control study. Mol. Biol. Rep. 2012, 39, 10859–10863. [Google Scholar] [CrossRef]
  37. Aziz, M.A.; Jafrin, S.; Islam, M.S. Human TERT promoter polymorphism rs2853669 is associated with cancers: An updated meta-analysis. Hum. Cell 2021, 34, 1066–1081. [Google Scholar] [CrossRef]
  38. Varadi, V.; Brendle, A.; Grzybowska, E.; Johansson, R.; Enquist, K.; Butkiewicz, D.; Pamula-Pilat, J.; Pekala, W.; Hemminki, K.; Lenner, P.; et al. A functional promoter polymorphism in the TERT gene does not affect inherited susceptibility to breast cancer. Cancer Genet. Cytogenet. 2009, 190, 71–74. [Google Scholar] [CrossRef]
  39. Hofer, P.; Zöchmeister, C.; Behm, C.; Brezina, S.; Baierl, A.; Doriguzzi, A.; Vanas, V.; Holzmann, K.; Sutterlüty-Fall, H.; Gsur, A. MNS16A tandem repeat minisatellite of human telomerase gene: Functional studies in colorectal, lung and prostate cancer. Oncotarget 2017, 8, 28021–28027. [Google Scholar] [CrossRef] [Green Version]
  40. Bojesen, S.E.; Pooley, K.A.; Johnatty, S.E.; Beesley, J.; Michailidou, K.; Tyrer, J.P.; Edwards, S.L.; Pickett, H.A.; Shen, H.C.; Smart, C.E.; et al. Multiple independent variants at the TERT locus are associated with telomere length and risks of breast and ovarian cancer. Nat. Genet. 2013, 45, 371–384. [Google Scholar] [CrossRef]
  41. Wysoczanska, B.; Dratwa, M.; Gebura, K.; Mizgala, J.; Mazur, G.; Wrobel, T.; Bogunia-Kubik, K. Variability within the human TERT gene, telomere length and predisposition to chronic lymphocytic leukemia. Oncol. Targets Ther. 2019, 12, 4309–4320. [Google Scholar] [CrossRef] [PubMed] [Green Version]
  42. Dratwa, M.; Wysoczanska, B.; Turlej, E.; Anisiewicz, A.; Maciejewska, M.; Wietrzyk, J.; Bogunia-Kubik, K. Heterogeneity of telomerase reverse transcriptase mutation and expression, telomerase activity and telomere length across human cancer cell lines cultured in vitro. Exp. Cell Res. 2020, 396, 112298. [Google Scholar] [CrossRef] [PubMed]
Figure 1. Genomic structure of the human telomerase TERT gene and the location of the studied SNPs and VNTR polymorphism. The exons are shown in grey, while the intronic regions are in white.
Ijms 23 05164 g001
Figure 2. Relationships between expression of TERT, TP53, SP1, MYC genes observed in BC organoids (a,c) and BC patients (b,d). Statistical analysis was performed using the Pearson correlation (PC) test (a,c) and the Spearman r correlation test (b,d).
Ijms 23 05164 g002
Figure 3. Relationships between the expression of TERT, MYC and TP53 genes observed in the blood of BC patients (a,c) and BC organoids (b,d). Statistical analysis was performed using the Spearman r correlation test (a,c) and the Pearson correlation (PC) test (b,d).
Ijms 23 05164 g003
Figure 4. Associations between the TERT gene polymorphisms (10069690 and rs2735940), relative expression of the TP53 gene (a,b), and telomere length (c,d) in patients with BC. The Mann–Whitney U test was employed to assess the significance of differences in the expression levels of TP53 and rs10069690 (a) and in telomere length (c). The Kruskal–Wallis test with the Original FDR method of Benjamini and Hochberg was used to assess the significance of the relative expression of TP53 and the genotypes in rs2735940 (b), as well as differences in telomere length (d).
Ijms 23 05164 g004
Figure 5. Relationship between the TERT VNTR-MNS16A polymorphism, relative SP1 expression and telomere length. High relative expression of the SP1 gene is associated with short allele (S) TERT VNTR-MNS16A (a), which was associated with long telomeres (b). The Mann-Whitney U test was employed to assess the significance of differences in the expression level of SP1 (a) and the differences of telomere length (b).
Ijms 23 05164 g005
Figure 6. Analysis of linkage disequilibrium in patients with BC. Darker color shows higher r2 values, while the value shown in the squares is r2 × 102. LD was considered to be medium for r2 > 20 and strong for r2 > 80. The chart was created using the Haploview 4.2 software.
Ijms 23 05164 g006
Table 1. Distribution of TERT genotypes in our group of patients with BC, the control group and the European population.
TERT Genetic
Polymorphism
GenotypeBC Patients
Frequency
Control Group
Frequency
EUR Population
Frequency
rs10069690
(intron 4)
GG
AG
AA
59 (53.2%)
48 (43.2%)
4 (3.6%)
46 (48.4%)
42 (44.2%)
7 (7.4%)
265 (52.7%)
198 (39.4%)
40 (8.0%)
rs2735940
(promoter region)
CC
TC
TT
35 (30.9%)
54 (47.8%)
24 (21.2%)
22 (23.2%)
54 (56.8%)
19 (20.0%)
127 (25.2%)
238 (47.3%)
138 (27.4%)
rs2736100
(intron 2)
GG
TG
TT
28 (23.7%)
52 (44.1%)
38 (32.2%)
24 (22.6%)
52 (49.1%)
30 (28,3%)
134 (26.6%)
234 (46.5%)
135 (26.8%)
rs2853669
(promoter region)
CC
CT
TT
11 (9.8%)
40 (35.7%)
61 (54.5%)
8 (7.5%)
39 (36.8%)
59 (55.7%)
49 (9.7%)
192 (38.2%)
262 (52.1%)
Table 2. TERT VNTR-MNS16A genotype distribution and telomere length in BC patients and healthy controls.
TERT
VNTR-MNS16A Genotypes
BC Patients (n)Telomere Length
(Mean ± Std. Deviation) [kb]
Health
Controls
(n)
Telomere Length
(Mean ± Std. Deviation) [kb]
Long VNTR-MNS16A (LL)
302/302414.21 ± 2.85363.79 ± 1.59
302/333
23
Short/Long VNTR-MNS16A (SL)
243/302404.95 ± 3.05464.66 ± 1.48
243/33312
274/30256
Short VNTR-MNS16A (SS)
243/243116.72 ± 5.4867.80 ± 5.33
274/2743not detected
243/27421
Table 3. Relationships between telomere length and various clinical parameters in patients with BC.
BC PatientsnTelomere Length
Median (IQR) [kb]
p-Value
Age (range)18–59 years1085.53 (2.68–5.94)0.4903
Estrogen receptorPositive
Negative
93
7
3.44 (2.64–5.76)
5.02 (3.15–5.87)
0.2502
HER2 amplificationPositive
Negative
15
83
4.24 (2.78–6.99)
3.36 (2.64–5.57)
0.3299
Progesterone receptorPositive
Negative
88
14
3.53 (2.65–5.92)
5.08 (2.93–6.46)
0.3261
Molecular subtypesLuminal with HER2 gene amplification154.70 (2.75–7.09)0.4797
Luminal without HER2 gene amplification763.37 (2.62–5.86)
Triple Negative BC75.02 (2.93–5.86)
UICC TNM stageI
II
III
48
40
5
3.83 (2.41–5.67)
3.27 (2.69–6.28)
3.26 (3.13–4.08)
0.9433
Pathologic lymph nodes statuspN0
pN+
77
24
3.39 (2.64–5.15)
4.12 (2.71–5.94)
0.4666
Germline mutation (BRCA1, BRCA2, CHEK2, PALB2)Positive
Negative
8
74
6.66 (2.74–6.05)
4.02 (2.66–6.28)
0.6727
Publisher’s Note: MDPI stays neutral with regard to jurisdictional claims in published maps and institutional affiliations.