Alterations to Cerebral Perfusion, Metabolite Profiles, and Neuronal Morphology in the Hippocampus and Cortex of Male and Female Mice during Chronic Exposure to a High-Salt Diet
Abstract
:1. Introduction
2. Results
2.1. Cerebral Blood Flow
2.2. Brain Metabolite Concentrations
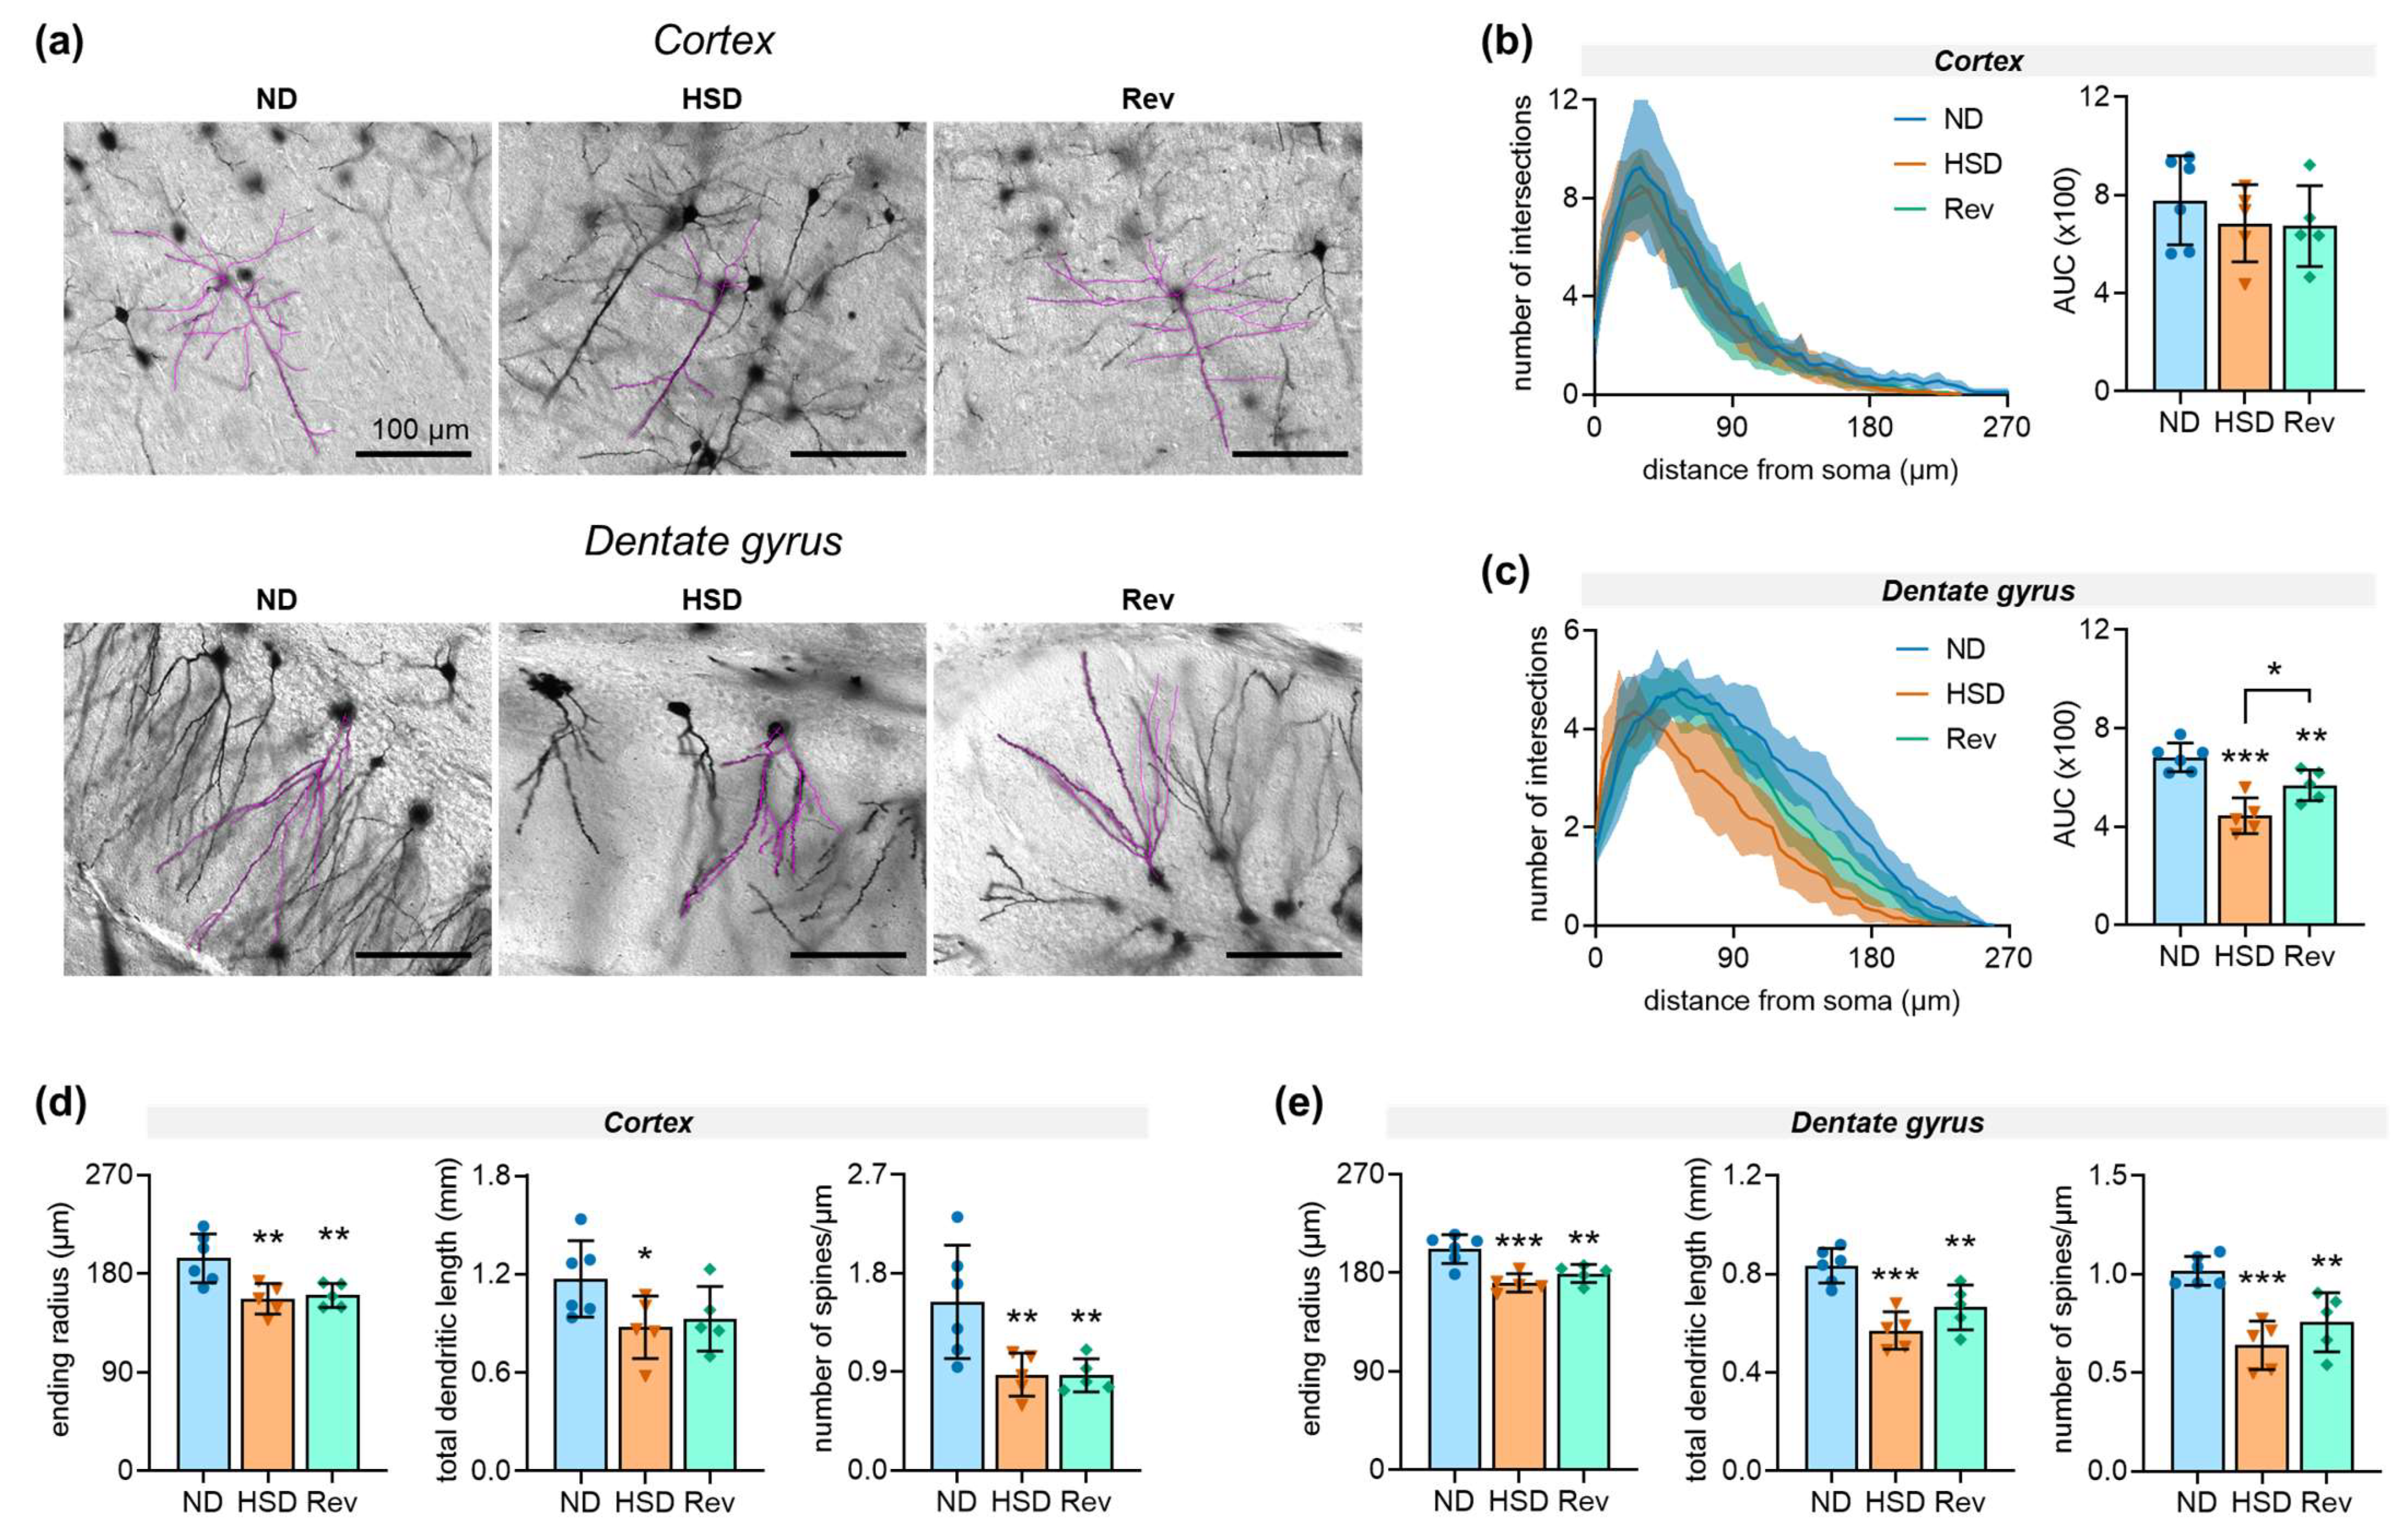
2.3. Neuronal Morphology
3. Discussion
4. Materials and Methods
4.1. Animals
4.2. Magnetic Resonance Imaging (MRI) and Spectroscopy (MRS)
4.3. Tail-Cuff Plethysmography
4.4. Histology
4.5. Statistics
Author Contributions
Funding
Institutional Review Board Statement
Data Availability Statement
Acknowledgments
Conflicts of Interest
Abbreviations
Appendix A
| Table 1 | |||
| Body weight, females: | age F(2,71) = 61.90, p < 0.001; | diet F(2,71) = 27.89, p < 0.001; | interaction F(4,71) = 11.85, p < 0.001 |
| Food intake, females: | age F(2,21) = 4.91, p = 0.020; | diet F(2,21) = 8.64, p = 0.002; | interaction F(4,21) = 2.43, p = 0.080 |
| Water intake, females: | age F(1,12) = 1.22, p = 0.290; | diet F(2,12) = 43.40, p < 0.001; | interaction F(2,12) = 14.38, p < 0.001 |
| Body weight, males: | age F(2,44) = 4.02, p = 0.030; | diet F(2,44) = 2.47, p = 0.100; | interaction F(4,44) = 1.20, p = 0.320 |
| Food intake, males: | age F(2,36) = 1.94, p = 0.160; | diet F(2,36) = 30.90, p < 0.001; | interaction F(4,36) = 5.16, p = 0.002 |
| Water intake, males: | age F(1,25) = 2.69, p = 0.110; | diet F(2,25) = 83.87, p < 0.001; | interaction F(2,25) = 32.35, p < 0.001 |
| Table 2 | |||
| Mean arterial pressure: | age F(2,118) = 6.19, p = 0.003; | diet F(2,118) = 1.47, p = 0.2339; | interaction F(4,118) = 0.543, p = 0.704 |
| Heart rate: | age F(2,91) = 15.75, p < 0.001; | diet F(2,91) = 1.08, p = 0.344; | interaction F(4,91) = 0.569, p = 0.686 |
| Ejection fraction: | age F(2,86) = 1.08, p = 0.345; | diet F(2,86) = 0.263, p = 0.770; | interaction F(4,86) = 0.9637, p = 0.432 |
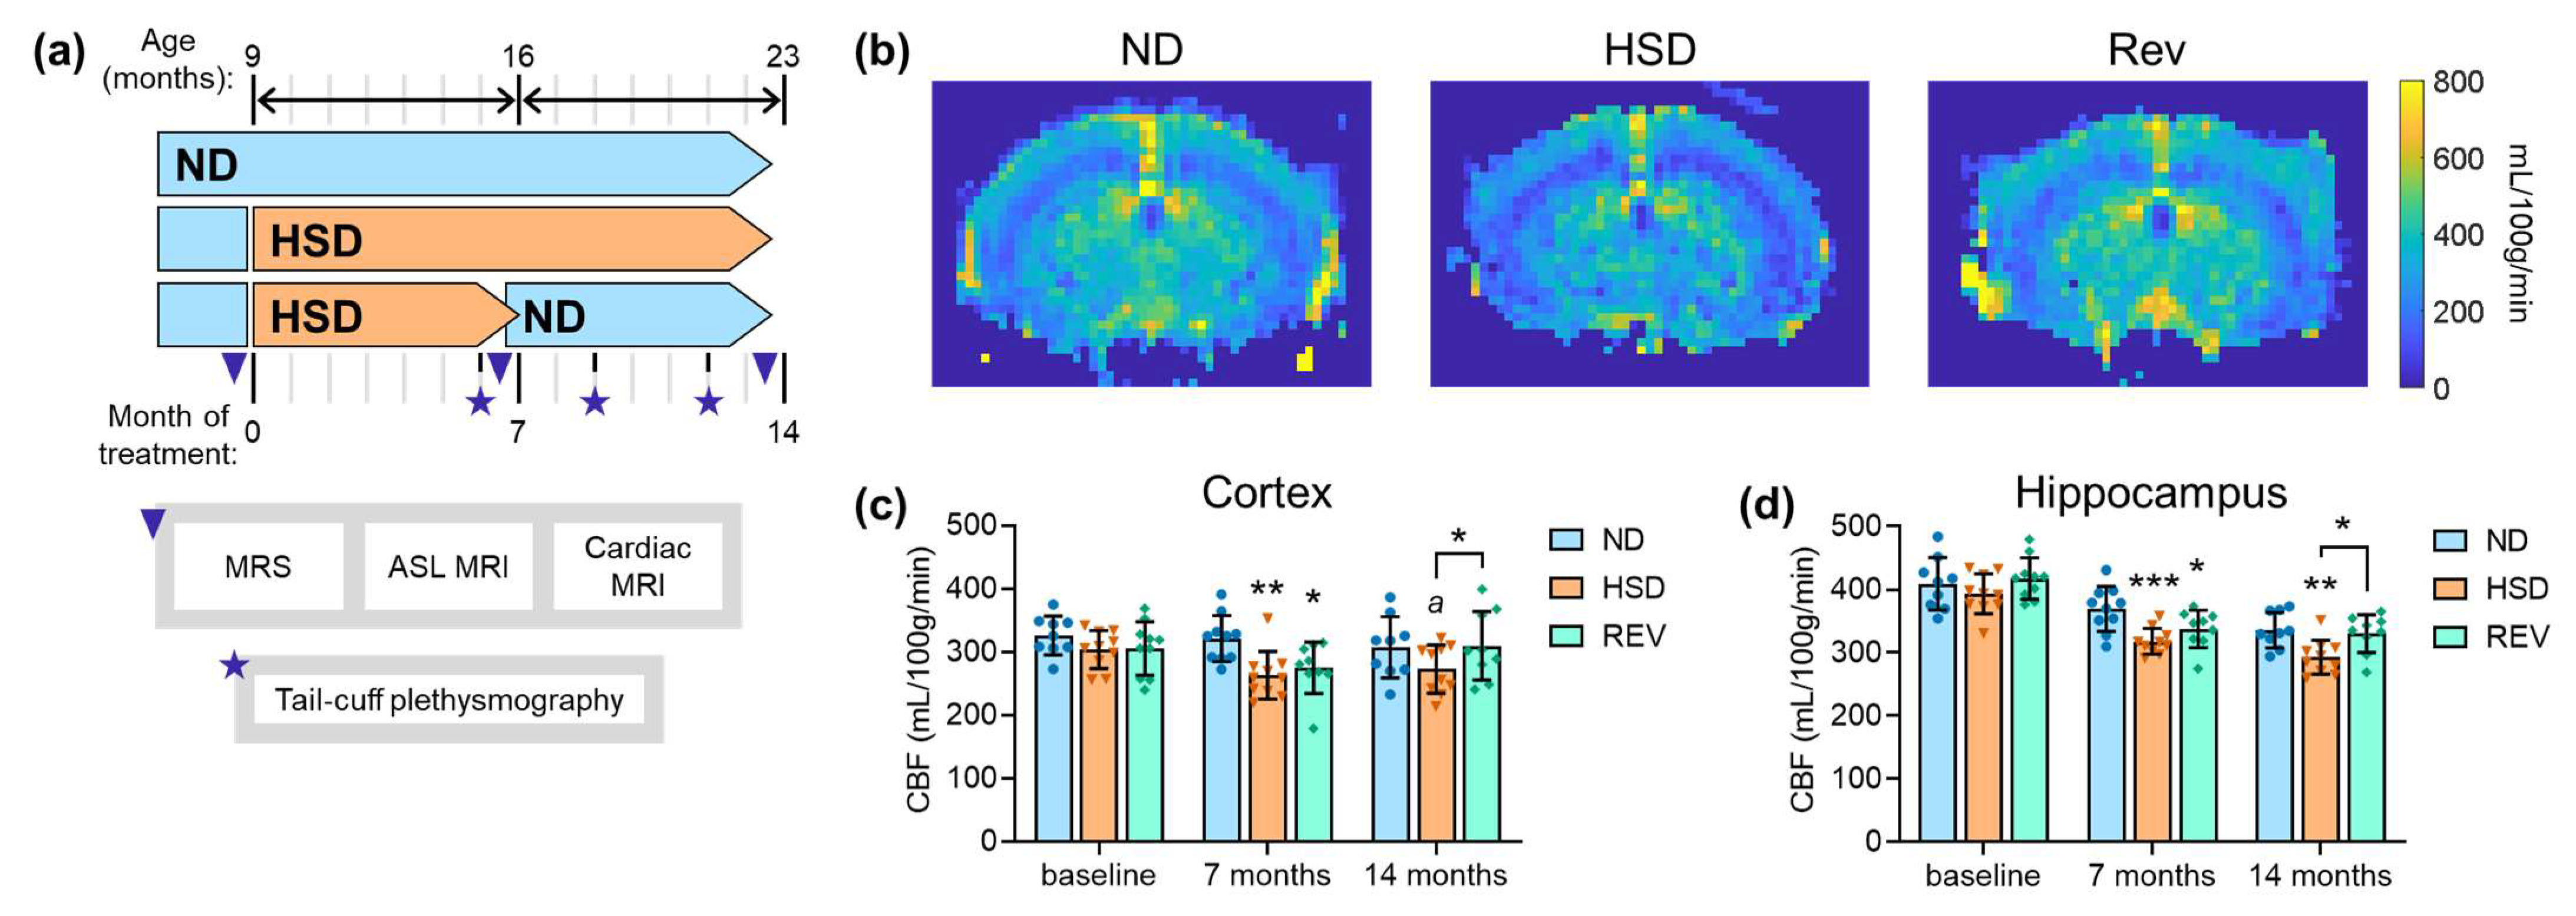
| Figure 1 | |||
| Figure 1C: | age F(2,77) = 2.88, p = 0.062; | diet F(2,77) = 6.52, p = 0.002; | interaction F(4,77) = 1.22, p = 0.310 |
| Figure 1D: | age F(2,77) = 60.33, p < 0.001; | diet F(2,77) = 10.93, p < 0.001; | interaction F(4,77) = 1.36, p = 0.256 |
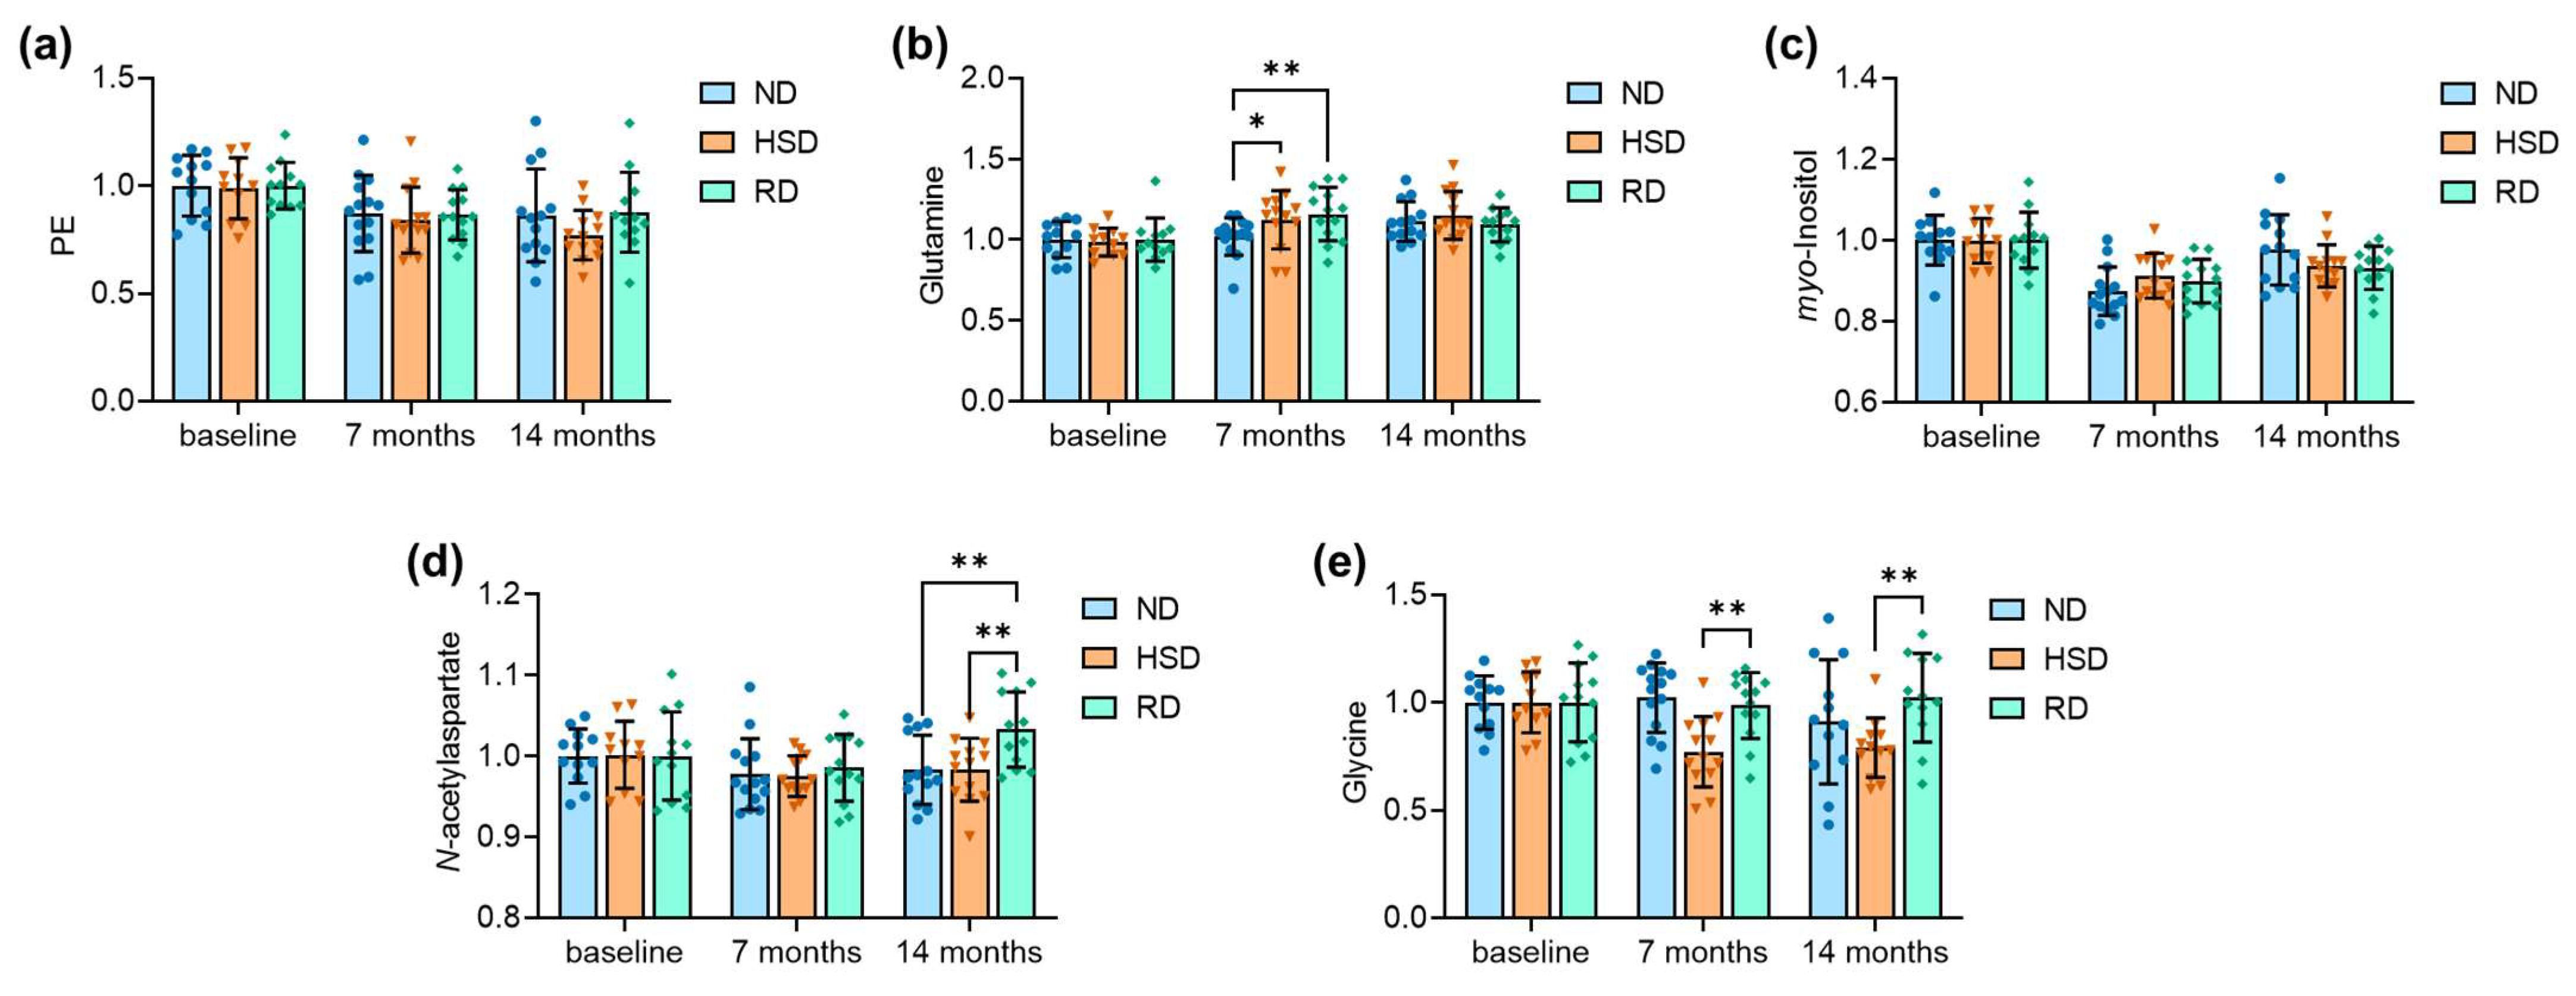
| Figure 3 | |||
| Figure 3A: | age F(2,104) = 11.24, p < 0.001; | diet F(2,104) = 1.09, p = 0.342; | interaction F(4,104) = 0.387, p = 0.818 |
| Figure 3B: | age F(2,104) = 8.89, p < 0.001; | diet F(2,104) = 1.14, p = 0.324; | interaction F(4,104) = 1.61, p = 0.179 |
| Figure 3C: | age F(2,104) = 26.79, p < 0.001; | diet F(2,104) = 0.13, p = 0.882; | interaction F(4,104) = 1.62, p = 0.176 |
| Figure 3D: | age F(2,104) = 3.19, p = 0.045; | diet F(2,104) = 2.72, p = 0.071; | interaction F(4,104) = 1.70, p = 0.156 |
| Figure 3E: | age F(2,104) = 2.68, p = 0.074; | diet F(2,104) = 7.22, p = 0.001; | interaction F(4,104) = 2.43, p = 0.052 |
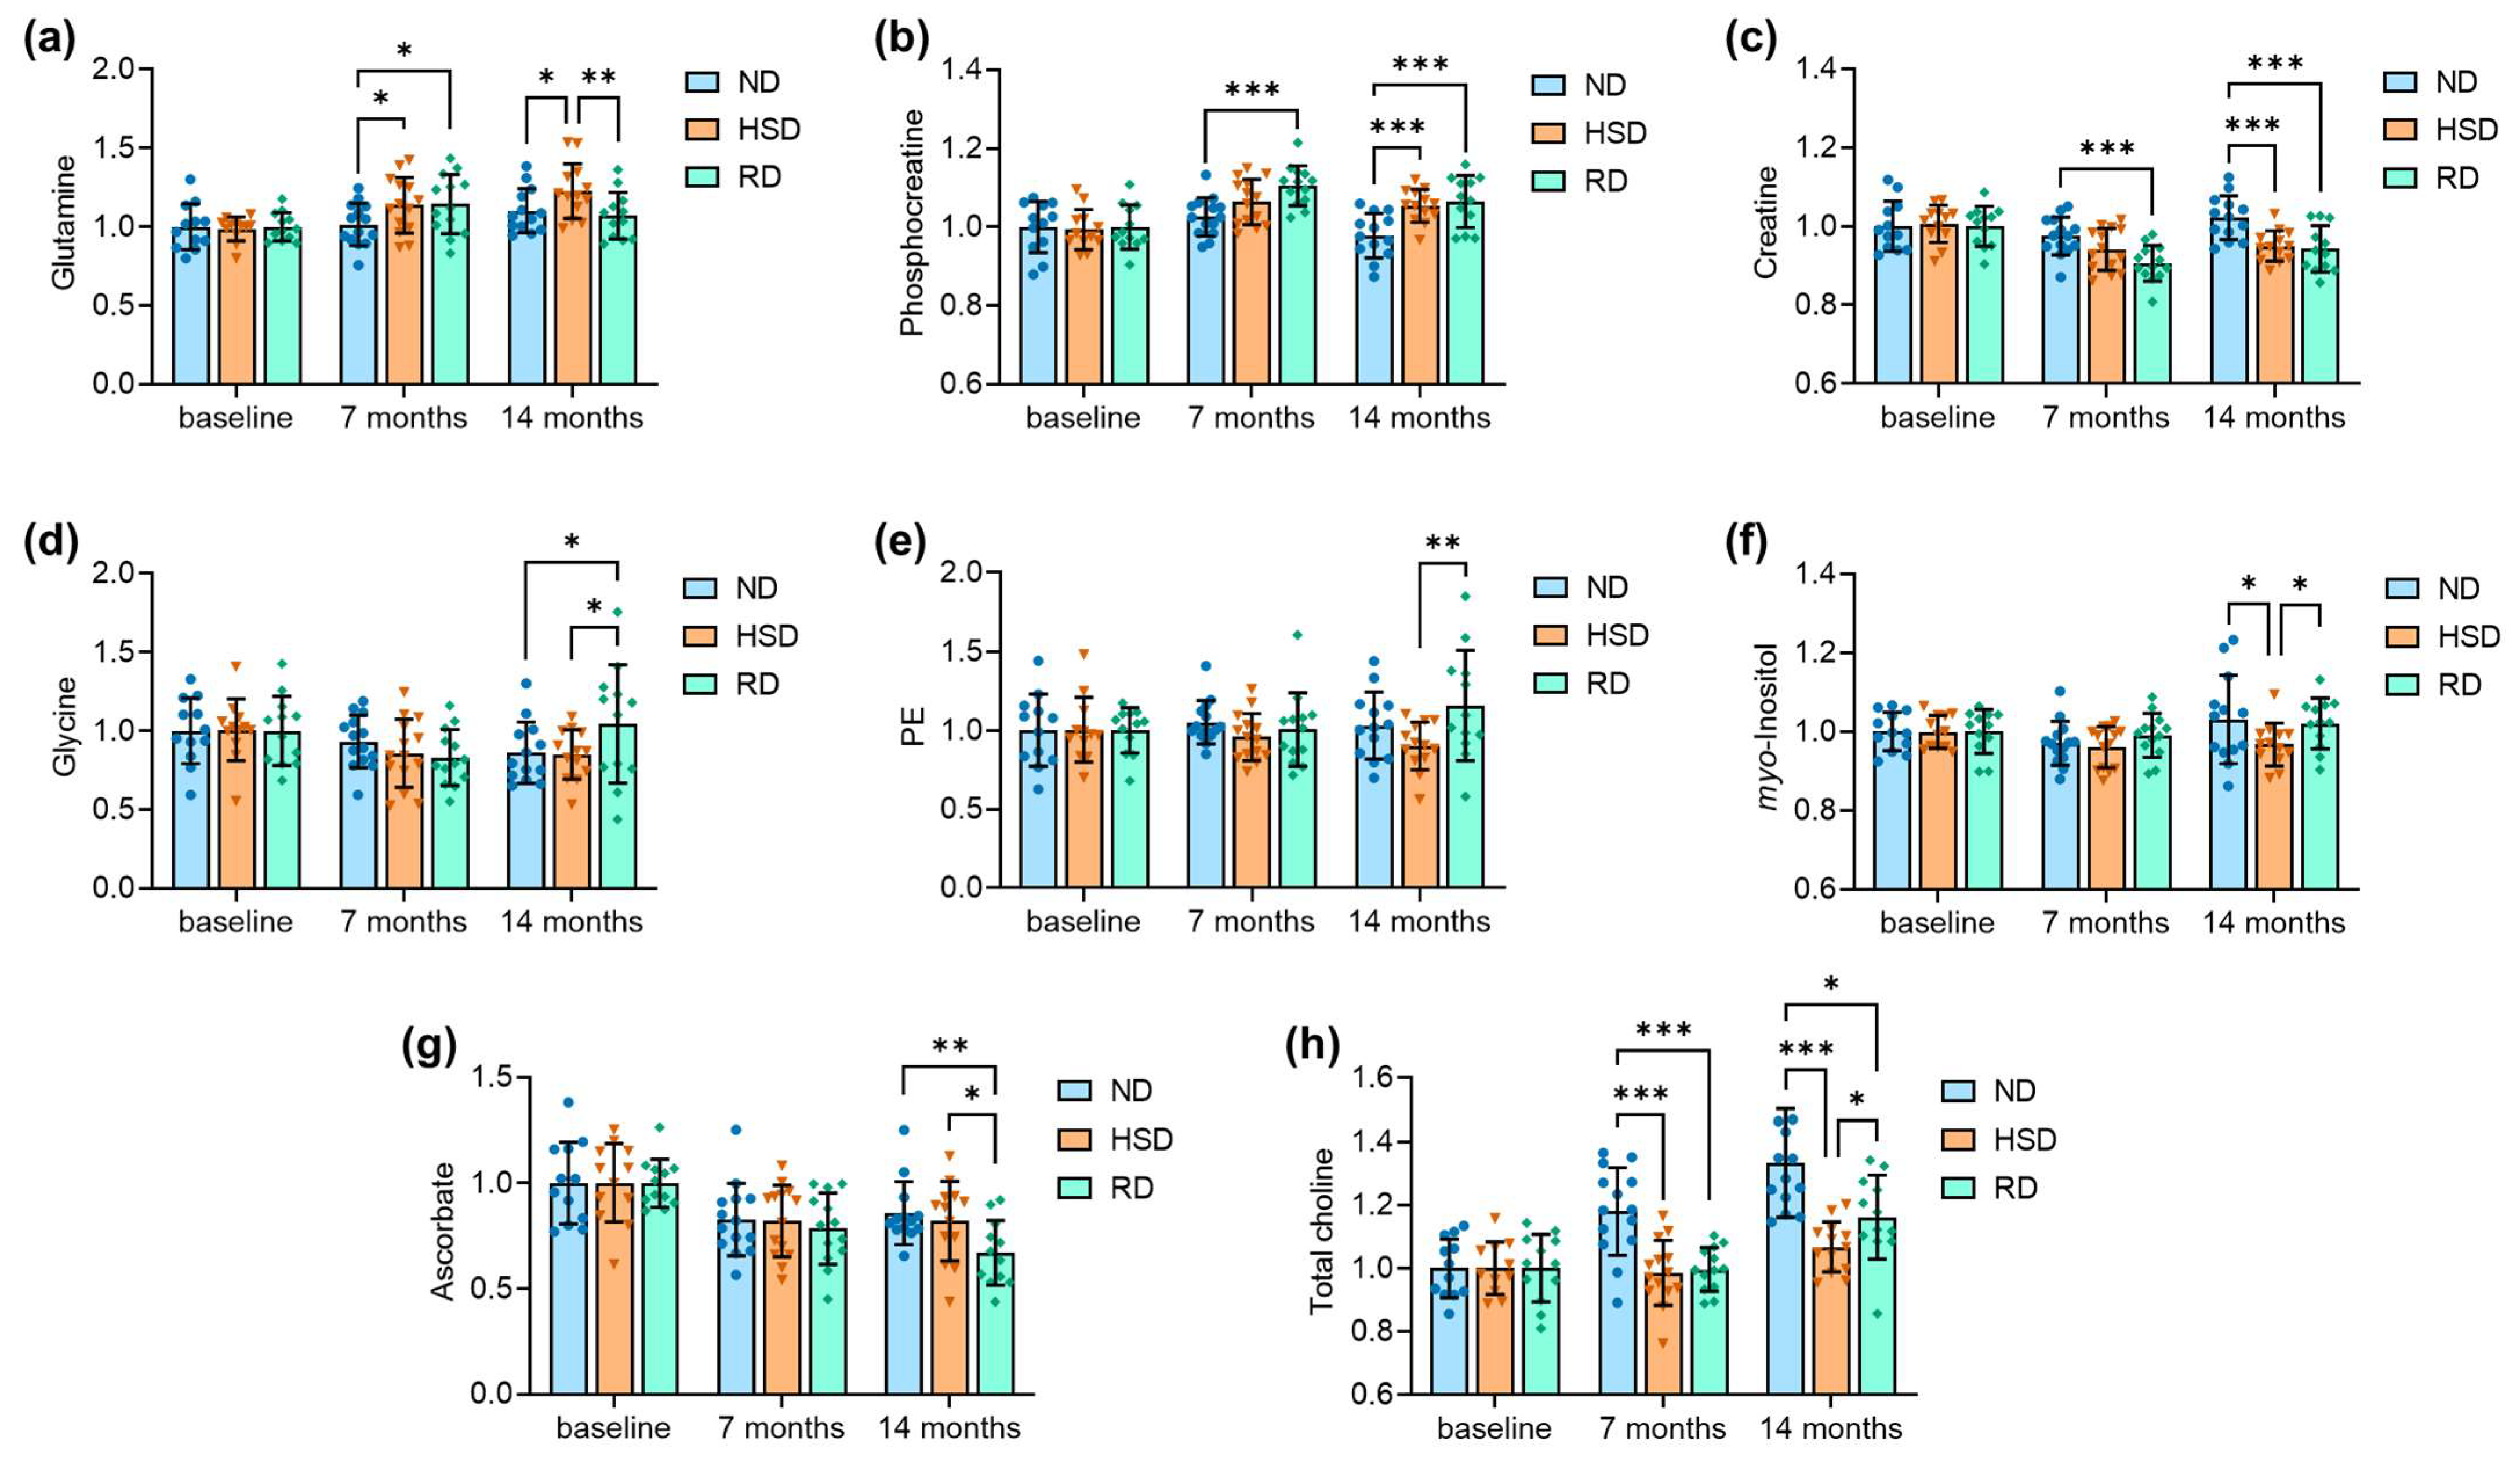
| Figure 4 | |||
| Figure 4A: | age F(2,106) = 8.72, p < 0.001; | diet F(2,106) = 2.73, p = 0.070; | interaction F(4,106) = 2.21, p = 0.073 |
| Figure 4B: | age F(2,106) = 14.13, p < 0.001; | diet F(2,106) = 9.86, p < 0.001; | interaction F(4,106) = 2.98, p = 0.022 |
| Figure 4C: | age F(2,106) = 13.59, p < 0.001; | diet F(2,106) = 9.08, p < 0.001; | interaction F(4,106) = 2.83, p = 0.028 |
| Figure 4D: | age F(2,106) = 3.36, p = 0.038; | diet F(2,106) = 0.565, p = 0.570; | interaction F(4,106) = 1.68, p = 0.168 |
| Figure 4E: | age F(2,106) = 0.21, p = 0.815; | diet F(2,106) = 2.33, p = 0.102; | interaction F(4,106) = 1.51, p = 0.206 |
| Figure 4F: | age F(2,106) = 2.92, p = 0.059; | diet F(2,106) = 2.27, p = 0.108; | interaction F(4,106) = 1.12, p = 0.352 |
| Figure 4G: | age F(2,106) = 18.43, p < 0.001; | diet F(2,106) = 2.26, p = 0.110; | interaction F(4,106) = 1.19, p = 0.320 |
| Figure 4H: | age F(2,106) = 26.45, p < 0.001; | diet F(2,106) = 19.04, p < 0.001; | interaction F(4,106) = 5.03, p < 0.001 |
| Figure 5 | |||
| Figure 5B: | F(2,13) = 0.64, p = 0.541 | ||
| Figure 5C: | F(2,13) = 18.60, p < 0.001 | ||
| Figure 5D: | end radius F(2,13) = 8.24, p = 0.005; | total length F(2,13) = 3.16, p = 0.076; | # spines F(2,13) = 6.84, p = 0.009 |
| Figure 5E: | end radius F(2,13) = 12.9, p < 0.001; | total length F(2,13) = 15.8, p < 0.001; | # spines F(2,13) = 15.2, p < 0.001 |
| Baseline | 7 Months | 14 Months | |||||||
|---|---|---|---|---|---|---|---|---|---|
| ND | HSD | RD | ND | HSD | RD | ND | HSD | RD | |
| Cortex | |||||||||
| Alanine | 0.079 ± 0.042 | 0.068 ± 0.032 | 0.091 ± 0.033 | 0.125 ± 0.050 | 0.057 ± 0.036 | 0.117 ± 0.084 | 0.083 ± 0.045 | 0.075 ± 0.038 | 0.077 ± 0.043 |
| Aspartate | 0.214 ± 0.042 | 0.230 ± 0.061 | 0.237 ± 0.035 | 0.217 ± 0.038 | 0.235 ± 0.043 | 0.231 ± 0.039 | 0.220 ± 0.049 | 0.183 ± 0.041 | 0.235 ± 0.045 |
| Creatine | 0.493 ± 0.054 | 0.491 ± 0.052 | 0.501 ± 0.032 | 0.474 ± 0.027 | 0.465 ± 0.045 | 0.477 ± 0.020 | 0.495 ± 0.030 | 0.489 ± 0.025 | 0.482 ± 0.029 |
| Phosphocreatine | 0.507 ± 0.054 | 0.509 ± 0.052 | 0.499 ± 0.032 | 0.526 ± 0.027 | 0.535 ± 0.045 | 0.523 ± 0.020 | 0.505 ± 0.030 | 0.511 ± 0.025 | 0.518 ± 0.029 |
| GABA | 0.163 ± 0.016 | 0.158 ± 0.023 | 0.150 ± 0.028 | 0.158 ± 0.029 | 0.158 ± 0.018 | 0.145 ± 0.020 | 0.140 ± 0.029 | 0.129 ± 0.025 | 0.144 ± 0.013 |
| Glutamine | 0.360 ± 0.040 | 0.363 ± 0.036 | 0.371 ± 0.050 | 0.367 ± 0.042 | 0.410 ± 0.063 | 0.430 ± 0.061 | 0.401 ± 0.044 | 0.419 ± 0.054 | 0.405 ± 0.039 |
| Glutamate | 1.233 ± 0.073 | 1.211 ± 0.074 | 1.249 ± 0.121 | 1.246 ± 0.061 | 1.237 ± 0.070 | 1.245 ± 0.096 | 1.161 ± 0.091 | 1.159 ± 0.067 | 1.228 ± 0.083 |
| Glutathione | 0.162 ± 0.018 | 0.159 ± 0.013 | 0.156 ± 0.012 | 0.148 ± 0.013 | 0.154 ± 0.008 | 0.151 ± 0.016 | 0.143 ± 0.012 | 0.147 ± 0.013 | 0.139 ± 0.015 |
| Glycine | 0.119 ± 0.015 | 0.123 ± 0.021 | 0.107 ± 0.019 | 0.122 ± 0.019 | 0.098 ± 0.020 | 0.105 ± 0.016 | 0.101 ± 0.043 | 0.093 ± 0.028 | 0.109 ± 0.022 |
| myo-Inositol | 0.505 ± 0.031 | 0.488 ± 0.026 | 0.492 ± 0.034 | 0.441 ± 0.03 | 0.447 ± 0.026 | 0.442 ± 0.027 | 0.493 ± 0.044 | 0.458 ± 0.026 | 0.459 ± 0.026 |
| Lactate | 0.231 ± 0.143 | 0.239 ± 0.090 | 0.222 ± 0.093 | 0.181 ± 0.082 | 0.198 ± 0.090 | 0.194 ± 0.102 | 0.186 ± 0.049 | 0.190 ± 0.041 | 0.156 ± 0.065 |
| NAA | 1.111 ± 0.037 | 1.093 ± 0.044 | 1.081 ± 0.059 | 1.086 ± 0.049 | 1.063 ± 0.027 | 1.065 ± 0.045 | 1.092 ± 0.048 | 1.073 ± 0.042 | 1.116 ± 0.050 |
| Taurine | 1.343 ± 0.062 | 1.346 ± 0.044 | 1.344 ± 0.064 | 1.308 ± 0.057 | 1.290 ± 0.048 | 1.304 ± 0.038 | 1.258 ± 0.104 | 1.261 ± 0.083 | 1.258 ± 0.072 |
| Ascorbate | 0.172 ± 0.032 | 0.178 ± 0.023 | 0.182 ± 0.027 | 0.165 ± 0.032 | 0.168 ± 0.032 | 0.148 ± 0.026 | 0.152 ± 0.071 | 0.140 ± 0.043 | 0.146 ± 0.046 |
| NAAG | 0.048 ± 0.022 | 0.049 ± 0.025 | 0.046 ± 0.017 | 0.053 ± 0.014 | 0.062 ± 0.016 | 0.051 ± 0.014 | 0.054 ± 0.022 | 0.052 ± 0.016 | 0.057 ± 0.016 |
| PE | 0.250 ± 0.035 | 0.235 ± 0.033 | 0.241 ± 0.026 | 0.218 ± 0.044 | 0.197 ± 0.034 | 0.209 ± 0.028 | 0.215 ± 0.054 | 0.180 ± 0.027 | 0.212 ± 0.045 |
| Choline | 0.128 ± 0.011 | 0.134 ± 0.011 | 0.131 ± 0.013 | 0.145 ± 0.011 | 0.135 ± 0.015 | 0.132 ± 0.009 | 0.156 ± 0.015 | 0.146 ± 0.008 | 0.141 ± 0.02 |
| Hippocampus | |||||||||
| Alanine | 0.133 ± 0.038 | 0.138 ± 0.046 | 0.137 ± 0.032 | 0.142 ± 0.035 | 0.125 ± 0.035 | 0.162 ± 0.063 | 0.146 ± 0.056 | 0.130 ± 0.021 | 0.131 ± 0.047 |
| Aspartate | 0.145 ± 0.045 | 0.126 ± 0.053 | 0.137 ± 0.045 | 0.109 ± 0.041 | 0.115 ± 0.032 | 0.118 ± 0.047 | 0.125 ± 0.055 | 0.117 ± 0.049 | 0.122 ± 0.028 |
| Creatine | 0.505 ± 0.032 | 0.519 ± 0.027 | 0.528 ± 0.027 | 0.492 ± 0.024 | 0.488 ± 0.028 | 0.478 ± 0.024 | 0.516 ± 0.028 | 0.493 ± 0.020 | 0.497 ± 0.031 |
| Phosphocreatine | 0.495 ± 0.032 | 0.481 ± 0.027 | 0.472 ± 0.027 | 0.508 ± 0.024 | 0.512 ± 0.028 | 0.522 ± 0.024 | 0.484 ± 0.028 | 0.507 ± 0.02 | 0.503 ± 0.031 |
| GABA | 0.175 ± 0.038 | 0.175 ± 0.026 | 0.170 ± 0.030 | 0.204 ± 0.049 | 0.187 ± 0.034 | 0.185 ± 0.037 | 0.181 ± 0.052 | 0.177 ± 0.032 | 0.163 ± 0.044 |
| Glutamine | 0.296 ± 0.043 | 0.290 ± 0.026 | 0.311 ± 0.028 | 0.301 ± 0.04 | 0.329 ± 0.051 | 0.356 ± 0.059 | 0.327 ± 0.041 | 0.355 ± 0.05 | 0.333 ± 0.046 |
| Glutamate | 0.880 ± 0.063 | 0.870 ± 0.066 | 0.873 ± 0.033 | 0.905 ± 0.065 | 0.901 ± 0.051 | 0.918 ± 0.088 | 0.867 ± 0.067 | 0.879 ± 0.046 | 0.908 ± 0.054 |
| Glutathione | 0.150 ± 0.012 | 0.147 ± 0.014 | 0.139 ± 0.012 | 0.149 ± 0.018 | 0.150 ± 0.011 | 0.144 ± 0.013 | 0.131 ± 0.016 | 0.143 ± 0.011 | 0.139 ± 0.016 |
| Glycine | 0.127 ± 0.026 | 0.123 ± 0.024 | 0.126 ± 0.028 | 0.118 ± 0.021 | 0.105 ± 0.027 | 0.105 ± 0.022 | 0.109 ± 0.025 | 0.104 ± 0.019 | 0.132 ± 0.047 |
| myo-Inositol | 0.581 ± 0.028 | 0.573 ± 0.024 | 0.559 ± 0.031 | 0.564 ± 0.032 | 0.550 ± 0.03 | 0.553 ± 0.031 | 0.599 ± 0.065 | 0.554 ± 0.031 | 0.570 ± 0.036 |
| Lactate | 0.276 ± 0.065 | 0.250 ± 0.084 | 0.263 ± 0.049 | 0.211 ± 0.066 | 0.226 ± 0.055 | 0.236 ± 0.075 | 0.159 ± 0.045 | 0.215 ± 0.038 | 0.170 ± 0.092 |
| NAA | 0.780 ± 0.041 | 0.785 ± 0.022 | 0.780 ± 0.037 | 0.812 ± 0.032 | 0.804 ± 0.030 | 0.798 ± 0.041 | 0.783 ± 0.037 | 0.784 ± 0.031 | 0.783 ± 0.037 |
| Taurine | 1.284 ± 0.050 | 1.298 ± 0.032 | 1.277 ± 0.057 | 1.295 ± 0.068 | 1.297 ± 0.071 | 1.318 ± 0.041 | 1.272 ± 0.065 | 1.309 ± 0.068 | 1.292 ± 0.056 |
| Ascorbate | 0.238 ± 0.046 | 0.230 ± 0.043 | 0.244 ± 0.028 | 0.197 ± 0.041 | 0.189 ± 0.039 | 0.191 ± 0.041 | 0.204 ± 0.036 | 0.189 ± 0.043 | 0.163 ± 0.037 |
| NAAG | 0.034 ± 0.018 | 0.033 ± 0.013 | 0.029 ± 0.015 | 0.042 ± 0.007 | 0.038 ± 0.013 | 0.041 ± 0.011 | 0.042 ± 0.015 | 0.046 ± 0.016 | 0.043 ± 0.016 |
| PE | 0.186 ± 0.043 | 0.187 ± 0.038 | 0.180 ± 0.026 | 0.196 ± 0.026 | 0.179 ± 0.028 | 0.180 ± 0.042 | 0.192 ± 0.040 | 0.169 ± 0.028 | 0.208 ± 0.063 |
| Choline | 0.101 ± 0.026 | 0.131 ± 0.029 | 0.112 ± 0.023 | 0.142 ± 0.034 | 0.114 ± 0.025 | 0.132 ± 0.028 | 0.157 ± 0.039 | 0.133 ± 0.035 | 0.109 ± 0.052 |
References
- Mente, A.; O’Donnell, M.; Yusuf, S. Sodium Intake and Health: What Should We Recommend Based on the Current Evidence? Nutrients 2021, 13, 3232. [Google Scholar] [CrossRef] [PubMed]
- Muller, M.; Van Der Graaf, Y.; Visseren, F.L.; Mali, W.P.T.M.; Geerlings, M.I.; SMART Study Group. Hypertension and longitudinal changes in cerebral blood flow: The SMART-MR study. Ann. Neurol. 2012, 71, 825–833. [Google Scholar] [CrossRef] [PubMed]
- Glodzik, L.; Rusinek, H.; Tsui, W.; Pirraglia, E.; Kim, H.-J.; Deshpande, A.; Li, Y.; Storey, P.; Randall, C.; Chen, J.; et al. Different Relationship Between Systolic Blood Pressure and Cerebral Perfusion in Subjects With and Without Hypertension. Hypertension 2019, 73, 197–205. [Google Scholar] [CrossRef] [PubMed]
- Canavan, M.; O’Donnell, M.J. Hypertension and Cognitive Impairment: A Review of Mechanisms and Key Concepts. Front. Neurol. 2022, 13, 821135. [Google Scholar] [CrossRef] [PubMed]
- Huang, L.; Trieu, K.; Yoshimura, S.; Neal, B.; Woodward, M.; Campbell, N.R.C.; Li, Q.; Lackland, D.T.; Leung, A.A.; Anderson, C.A.M.; et al. Effect of dose and duration of reduction in dietary sodium on blood pressure levels: Systematic review and meta-analysis of randomised trials. BMJ 2020, 368, m315. [Google Scholar] [CrossRef] [Green Version]
- Qiu, C.; Winblad, B.; Fratiglioni, L. The age-dependent relation of blood pressure to cognitive function and dementia. Lancet Neurol. 2005, 4, 487–499. [Google Scholar] [CrossRef]
- Launer, L.J.; Masaki, K.; Petrovitch, H.; Foley, D.; Havlik, R.J. The association between midlife blood pressure levels and late-life cognitive function. The Honolulu-Asia Aging Study. JAMA 1995, 274, 1846–1851. [Google Scholar] [CrossRef]
- Elmståhl, S.; Widerström, E. Orthostatic intolerance predicts mild cognitive impairment: Incidence of mild cognitive impairment and dementia from the Swedish general population cohort Good Aging in Skåne. Clin. Interv. Aging 2014, 9, 1993–2002. [Google Scholar] [CrossRef] [Green Version]
- Holm, H.; Nägga, K.; Nilsson, E.D.; Melander, O.; Minthon, L.; Bachus, E.; Fedorowski, A.; Magnusson, M. Longitudinal and postural changes of blood pressure predict dementia: The Malmö Preventive Project. Eur. J. Epidemiol. 2017, 32, 327–336. [Google Scholar] [CrossRef] [Green Version]
- Xia, X.; Wang, R.; Vetrano, D.L.; Grande, G.; Laukka, E.J.; Ding, M.; Fratiglioni, L.; Qiu, C. From Normal Cognition to Cognitive Impairment and Dementia: Impact of Orthostatic Hypotension. Hypertension 2021, 78, 769–778. [Google Scholar] [CrossRef]
- Hughes, D.; Judge, C.; Murphy, R.; Loughlin, E.; Costello, M.; Whiteley, W.; Bosch, J.; O’Donnell, M.; Canavan, M. Association of Blood Pressure Lowering With Incident Dementia or Cognitive Impairment. JAMA 2020, 323, 1934–1944. [Google Scholar] [CrossRef] [PubMed]
- Ou, Y.N.; Tan, C.C.; Shen, X.N.; Xu, W.; Hou, X.H.; Dong, Q.; Tan, L.; Yu, J.T. Blood Pressure and Risks of Cognitive Im-pairment and Dementia: A Systematic Review and Meta-Analysis of 209 Prospective Studies. Hypertension 2020, 76, 217–225. [Google Scholar] [CrossRef] [PubMed]
- O’Brien, E. Salt—Too much or too little? Lancet 2016, 388, 439–440. [Google Scholar] [CrossRef] [PubMed]
- Kendig, M.D.; Morris, M.J. Reviewing the effects of dietary salt on cognition: Mechanisms and future directions. Asia Pac. J. Clin. Nutr. 2019, 28, 6–14. [Google Scholar]
- Chugh, G.; Asghar, M.; Patki, G.; Bohat, R.; Jafri, F.; Allam, F.; Dao, A.T.; Mowrey, C.; Alkadhi, K.; Salim, S. A High-Salt Diet Further Impairs Age-Associated Declines in Cognitive, Behavioral, and Cardiovascular Functions in Male Fischer Brown Norway Rats. J. Nutr. 2013, 143, 1406–1413. [Google Scholar] [CrossRef] [Green Version]
- Guo, C.-P.; Wei, Z.; Huang, F.; Qin, M.; Li, X.; Wang, Y.-M.; Wang, Q.; Wang, J.-Z.; Liu, R.; Zhang, B.; et al. High salt induced hypertension leads to cognitive defect. Oncotarget 2017, 8, 95780–95790. [Google Scholar] [CrossRef] [Green Version]
- Liu, Y.-Z.; Chen, J.-K.; Li, Z.-P.; Zhao, T.; Ni, M.; Li, D.-J.; Jiang, C.-L.; Shen, F.-M. High-salt diet enhances hippocampal oxidative stress and cognitive impairment in mice. Neurobiol. Learn. Mem. 2014, 114, 10–15. [Google Scholar] [CrossRef]
- Ge, Q.; Wang, Z.; Wu, Y.; Huo, Q.; Qian, Z.; Tian, Z.; Ren, W.; Zhang, X.; Han, J. High salt diet impairs memory-related synaptic plasticity via increased oxidative stress and suppressed synaptic protein expression. Mol. Nutr. Food Res. 2017, 61, 1700134. [Google Scholar] [CrossRef] [Green Version]
- Faraco, G.; Brea, D.; Garcia-Bonilla, L.; Wang, G.; Racchumi, G.; Chang, H.; Buendia, I.; Santisteban, M.; Segarra, S.G.; Koizumi, K.; et al. Dietary salt promotes neurovascular and cognitive dysfunction through a gut-initiated TH17 response. Nat. Neurosci. 2018, 21, 240–249. [Google Scholar] [CrossRef]
- Yuan, M.; Wang, Y.; Wen, J.; Jing, F.; Zou, Q.; Pu, Y.; Pan, T.; Cai, Z. Dietary Salt Disrupts Tricarboxylic Acid Cycle and Induces Tau Hyperphosphorylation and Synapse Dysfunction during Aging. Aging Dis. 2022, 13, 1532. [Google Scholar] [CrossRef]
- Overlack, A.; Ruppert, M.; Kolloch, R.; Kraft, K.; Stumpe, K.O. Age is a major determinant of the divergent blood pressure responses to varying salt intake in essential hypertension. Am. J. Hypertens. 1995, 8, 829–836. [Google Scholar] [CrossRef] [PubMed]
- Sonnay, S.; Gruetter, R.; Duarte, J.M.N. How Energy Metabolism Supports Cerebral Function: Insights from 13C Magnetic Resonance Studies In vivo. Front. Neurosci. 2017, 11, 288. [Google Scholar] [CrossRef] [PubMed] [Green Version]
- Duarte, J.M.; Lei, H.; Mlynárik, V.; Gruetter, R. The neurochemical profile quantified by in vivo1H NMR spectroscopy. NeuroImage 2012, 61, 342–362. [Google Scholar] [CrossRef] [PubMed] [Green Version]
- Lizarbe, B.; Soares, A.F.; Larsson, S.; Duarte, J.M.N.; Lizarbe, B.; Soares, A.F.; Larsson, S.; Duarte, J.M.N. Neurochemical Modifications in the Hippocampus, Cortex and Hypothalamus of Mice Exposed to Long-Term High-Fat Diet. Front. Neurosci. 2019, 12, 985. [Google Scholar] [CrossRef] [PubMed]
- Garcia-Serrano, A.M.; A Mohr, A.; Philippe, J.; Skoug, C.; Spégel, P.; Duarte, J.M. Cognitive Impairment and Metabolite Profile Alterations in the Hippocampus and Cortex of Male and Female Mice Exposed to a Fat and Sugar-Rich Diet are Normalized by Diet Reversal. Aging Dis. 2022, 13, 267. [Google Scholar] [CrossRef] [PubMed]
- Garcia-Serrano, A.M.; Vieira, J.P.P.; Fleischhart, V.; Duarte, J.M.N. Taurine and N-acetylcysteine treatments prevent memory impairment and metabolite profile alterations in the hippocampus of high-fat diet-fed female mice. Nutr. Neurosci. 2022, 1–13. [Google Scholar] [CrossRef]
- Duarte, J.M.; Do, K.Q.; Gruetter, R. Longitudinal neurochemical modifications in the aging mouse brain measured in vivo by 1H magnetic resonance spectroscopy. Neurobiol. Aging 2014, 35, 1660–1668. [Google Scholar] [CrossRef]
- Cudalbu, C.; Lanz, B.; Duarte, J.M.; Morgenthaler, F.D.; Pilloud, Y.; Mlynárik, V.; Gruetter, R. Cerebral Glutamine Metabolism under Hyperammonemia Determined in vivo by Localized 1H and 15N NMR Spectroscopy. J. Cereb. Blood Flow Metab. 2011, 32, 696–708. [Google Scholar] [CrossRef] [Green Version]
- Berthet, C.; Xin, L.; Buscemi, L.; Benakis, C.; Gruetter, R.; Hirt, L.; Lei, H. Non-Invasive Diagnostic Biomarkers for Estimating the Onset Time of Permanent Cerebral Ischemia. J. Cereb. Blood Flow Metab. 2014, 34, 1848–1855. [Google Scholar] [CrossRef] [Green Version]
- Kitada, K.; Daub, S.; Zhang, Y.; Klein, J.D.; Nakano, D.; Pedchenko, T.; Lantier, L.; LaRocque, L.M.; Marton, A.; Neubert, P.; et al. High salt intake reprioritizes osmolyte and energy metabolism for body fluid conservation. J. Clin. Investig. 2017, 127, 1944–1959. [Google Scholar] [CrossRef] [Green Version]
- Heikkinen, T.; Lehtimäki, K.; Vartiainen, N.; Puolivali, J.; Hendricks, S.J.; Glaser, J.R.; Bradaia, A.; Wadel, K.; Touller, C.; Kontkanen, O.; et al. Characterization of Neurophysiological and Behavioral Changes, MRI Brain Volumetry and 1H MRS in zQ175 Knock-In Mouse Model of Huntington’s Disease. PLoS ONE 2012, 7, e50717. [Google Scholar] [CrossRef] [PubMed]
- Corcoba, A.; Steullet, P.; Duarte, J.M.N.; Van de Looij, Y.; Monin, A.; Cuenod, M.; Gruetter, R.; Do, K.Q. Glutathione Deficit Affects the Integrity and Function of the Fimbria/Fornix and Anterior Commissure in Mice: Relevance for Schizophrenia. Int. J. Neuropsychopharmacol. 2015, 19, pyv110. [Google Scholar] [CrossRef] [PubMed] [Green Version]
- Faraco, G.; Hochrainer, K.; Segarra, S.G.; Schaeffer, S.; Santisteban, M.M.; Menon, A.; Jiang, H.; Holtzman, D.M.; Anrather, J.; Iadecola, C. Dietary salt promotes cognitive impairment through tau phosphorylation. Nature 2019, 574, 686–690. [Google Scholar] [CrossRef] [PubMed]
- Heras-Garvin, A.; Refolo, V.; Reindl, M.; Wenning, G.K.; Stefanova, N. High-salt diet does not boost neuroinflammation and neurodegeneration in a model of α-synucleinopathy. J. Neuroinflamm. 2020, 17, 35. [Google Scholar] [CrossRef] [PubMed]
- Deng, Z.; Wang, Y.; Zhou, L.; Shan, Y.; Tan, S.; Cai, W.; Liao, S.; Peng, L.; Lu, Z. High salt-induced activation and expression of inflammatory cytokines in cultured astrocytes. Cell Cycle 2017, 16, 785–794. [Google Scholar] [CrossRef] [Green Version]
- Yasmin, A.; Pitkänen, A.; Jokivarsi, K.; Poutiainen, P.; Gröhn, O.; Immonen, R. MRS Reveals Chronic Inflammation in T2w MRI-Negative Perilesional Cortex—A 6-Months Multimodal Imaging Follow-Up Study. Front. Neurosci. 2019, 13, 863. [Google Scholar] [CrossRef] [Green Version]
- Iorio, E.; Podo, F.; Leach, M.O.; Koutcher, J.; Blankenberg, F.G.; Norfray, J.F. A novel roadmap connecting the 1H-MRS total choline resonance to all hallmarks of cancer following targeted therapy. Eur. Radiol. Exp. 2021, 5, 1–14. [Google Scholar] [CrossRef]
- Cui, H.; Yang, S.; Zheng, M.; Liu, R.; Zhao, G.; Wen, J. High-salt intake negatively regulates fat deposition in mouse. Sci. Rep. 2017, 7, 2053. [Google Scholar] [CrossRef]
- Frieler, R.A.; Vigil, T.M.; Song, J.; Leung, C.; Lumeng, C.N.; Mortensen, R.M. High-fat and high-sodium diet induces metabolic dysfunction in the absence of obesity. Obesity 2021, 29, 1868–1881. [Google Scholar] [CrossRef]
- Nilsson, P.M.; Korduner, J.; Magnusson, M. Metabolically Healthy Obesity (MHO)—New Research Directions for Personalised Medicine in Cardiovascular Prevention. Curr. Hypertens. Rep. 2020, 22, 18. [Google Scholar] [CrossRef] [Green Version]
- Aguiar, S.L.F.; Miranda, M.C.G.; Guimarães, M.A.F.; Santiago, H.C.; Queiroz, C.P.; Cunha, P.D.S.; Cara, D.C.; Foureaux, G.; Ferreira, A.J.; Cardoso, V.N.; et al. High-Salt Diet Induces IL-17-Dependent Gut Inflammation and Exacerbates Colitis in Mice. Front. Immunol. 2018, 8, 1969. [Google Scholar] [CrossRef] [PubMed]
- Smiljanec, K.; Lennon, S.L. Sodium, hypertension, and the gut: Does the gut microbiota go salty? Am. J. Physiol. Circ. Physiol. 2019, 317, H1173–H1182. [Google Scholar] [CrossRef] [PubMed]
- Heiberg, E.; Sjögren, J.; Ugander, M.; Carlsson, M.; Engblom, H.; Arheden, H. Design and validation of Segment - freely available software for cardiovascular image analysis. BMC Med. Imaging 2010, 10, 1. [Google Scholar] [CrossRef] [PubMed] [Green Version]
- Gottschalk, M. Look-Locker FAIR TrueFISP for arterial spin labelling on mouse at 9.4 T. NMR Biomed. 2019, 33, e4191. [Google Scholar] [CrossRef] [PubMed]
- Meissner, A.; Visanji, N.P.; Momen, M.A.; Feng, R.; Francis, B.M.; Bolz, S.; Hazrati, L. Tumor Necrosis Factor-α Underlies Loss of Cortical Dendritic Spine Density in a Mouse Model of Congestive Heart Failure. J. Am. Hear. Assoc. 2015, 4, e001920. [Google Scholar] [CrossRef] [Green Version]
- Ferreira, T.A.; Blackman, A.V.; Oyrer, J.; Jayabal, S.; Chung, A.J.; Watt, A.J.; Sjöström, P.J.; Van Meyel, D.J. Neuronal morphometry directly from bitmap images. Nat. Methods 2014, 11, 982–984. [Google Scholar] [CrossRef]
| Female | Male | ||||||
|---|---|---|---|---|---|---|---|
| ND | HSD | Rev | ND | HSD | Rev | ||
| Body weight (mean ± SD) | Baseline | 24.9 ± 1.7 (9) | 24.5 ± 0.9 (10) | 25.8 ± 2.1 (10) | 31.8 ± 2.0 (7) | 32.0 ± 2.6 (6) | 31.5 ± 4.3 (7) |
| 7 months | 29.4 ± 3.5 (9) | 24.4 ± 1.5 (10) *** | 24.9 ± 2.0 (9) *** | 32.5 ± 1.1 (6) | 28.6 ± 2.3 (6) * | 28.6 ± 3.5 (6) * | |
| 14 months | 34.7 ± 3.6 (7) | 26.5 ± 1.7 (10) *** | 35.6±4.2 (6) ### | 33.8 ± 2.2 (6) | 31.0 ± 2.6 (5) | 33.6 ± 5.3 (4) | |
| Food intake (range) | Month 1 | 19–24 | 24–28 * | 25–28 * | 24–29 | 30–44 ** | 32–53 *** |
| Month 8 | 23–29 | 29–37 * | 26–31 | 27–33 | 36–51 *** | 32–42 * ## | |
| Month 9 | 21–27 | 26–38 * | 21–24 ## | 22–29 | 33–52 *** | 26–33 ### | |
| Water intake (range) | Month 1 | 24–42 | 58–74 ** | 50–68 ** | 27–39 | 73–106 *** | 68–95 *** |
| Month 8 | 26–43 | 88–118 *** | 27–45 ### | 30–35 | 92–120 *** | 32–39 ### | |
| ND | HSD | Rev | ||
|---|---|---|---|---|
| MAP (mm Hg) | Month 6 | 103 ± 10 (15) | 102 ± 7 (15) | 99 ± 12 (16) |
| Month 9 | 101 ± 8 (15) | 102 ± 8 (14) | 101 ± 8 (15) | |
| Month 12 | 99 ± 11 (14) | 94 ± 8 (13) | 93 ± 6 (10) | |
| Ejection fraction (%) | Baseline | 70 ± 9 (11) | 72 ± 7 (12) | 67 ± 6 (12) |
| 7 months | 69 ± 7 (11) | 66 ± 10 (10) | 69 ± 5 (10) | |
| 14 months | 65 ± 7 (10) | 69 ± 8 (9) | 67 ± 6 (10) | |
| Heart rate (bmp) | Baseline | 605 ± 54 (12) | 600 ± 38 (12) | 614 ± 51 (12) |
| 7 months | 600 ± 47 (11) | 589 ± 50 (10) | 580 ± 33 (10) | |
| 14 months | 564 ± 41 (11) | 543 ± 41 (11) | 548 ± 27 (11) | |
Disclaimer/Publisher’s Note: The statements, opinions and data contained in all publications are solely those of the individual author(s) and contributor(s) and not of MDPI and/or the editor(s). MDPI and/or the editor(s) disclaim responsibility for any injury to people or property resulting from any ideas, methods, instructions or products referred to in the content. |
© 2022 by the authors. Licensee MDPI, Basel, Switzerland. This article is an open access article distributed under the terms and conditions of the Creative Commons Attribution (CC BY) license (https://creativecommons.org/licenses/by/4.0/).
Share and Cite
Meissner, A.; Garcia-Serrano, A.M.; Vanherle, L.; Rafiee, Z.; Don-Doncow, N.; Skoug, C.; Larsson, S.; Gottschalk, M.; Magnusson, M.; Duarte, J.M.N. Alterations to Cerebral Perfusion, Metabolite Profiles, and Neuronal Morphology in the Hippocampus and Cortex of Male and Female Mice during Chronic Exposure to a High-Salt Diet. Int. J. Mol. Sci. 2023, 24, 300. https://doi.org/10.3390/ijms24010300
Meissner A, Garcia-Serrano AM, Vanherle L, Rafiee Z, Don-Doncow N, Skoug C, Larsson S, Gottschalk M, Magnusson M, Duarte JMN. Alterations to Cerebral Perfusion, Metabolite Profiles, and Neuronal Morphology in the Hippocampus and Cortex of Male and Female Mice during Chronic Exposure to a High-Salt Diet. International Journal of Molecular Sciences. 2023; 24(1):300. https://doi.org/10.3390/ijms24010300
Chicago/Turabian StyleMeissner, Anja, Alba M. Garcia-Serrano, Lotte Vanherle, Zeinab Rafiee, Nicholas Don-Doncow, Cecilia Skoug, Sara Larsson, Michael Gottschalk, Martin Magnusson, and João M. N. Duarte. 2023. "Alterations to Cerebral Perfusion, Metabolite Profiles, and Neuronal Morphology in the Hippocampus and Cortex of Male and Female Mice during Chronic Exposure to a High-Salt Diet" International Journal of Molecular Sciences 24, no. 1: 300. https://doi.org/10.3390/ijms24010300
APA StyleMeissner, A., Garcia-Serrano, A. M., Vanherle, L., Rafiee, Z., Don-Doncow, N., Skoug, C., Larsson, S., Gottschalk, M., Magnusson, M., & Duarte, J. M. N. (2023). Alterations to Cerebral Perfusion, Metabolite Profiles, and Neuronal Morphology in the Hippocampus and Cortex of Male and Female Mice during Chronic Exposure to a High-Salt Diet. International Journal of Molecular Sciences, 24(1), 300. https://doi.org/10.3390/ijms24010300


