
Ligand-Based Drug Design of Novel Antimicrobials against Staphylococcus aureus by Targeting Bacterial Transcription


Abstract
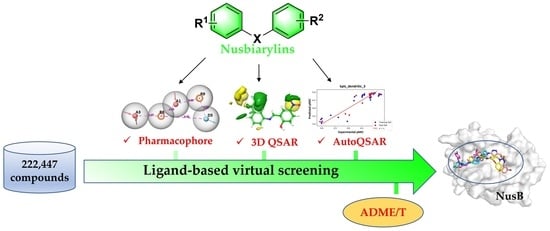
1. Introduction
2. Results and Discussion
2.1. Development of Ligand-Based Pharmacophore Hypothesis
2.2. Three-Dimensional QSAR
2.2.1. 3D QSAR Model
2.2.2. Y-Randomization Test
2.2.3. Contour Maps Analysis
2.3. AutoQSAR
2.4. Pharmacophore-Based Virtual Screening
2.5. 3D QSAR, Auto QSAR, and ADME/T Prediction
2.6. Docking Studies and Binding Free Energy Calculation
2.6.1. Docking Sites Prediction
2.6.2. Binding Modes Analysis and Free Energy Calculation
3. Materials and Methods
3.1. Data Preparation
3.2. Ligand Preparation
3.3. Creation of Ligand-Based Pharmacophore Model
3.4. Three-Dimensional QSAR Model Construction
3.5. Y-Randomization Test
3.6. Machine Learning-Based AutoQSAR Model Generation
3.7. Creation of Database and Pharmacophore-Based Virtual Screening
3.8. QSAR Screening and ADME/T Calculation
3.9. Docking and Binding Free Energy Calculation
4. Conclusions
Supplementary Materials
Author Contributions
Funding
Institutional Review Board Statement
Informed Consent Statement
Data Availability Statement
Acknowledgments
Conflicts of Interest
References
- David, M.Z. MRSA community pneumonia: A global perspective on resistance. Lancet Infect. Dis. 2016, 16, 1309–1310. [Google Scholar] [CrossRef] [PubMed]
- Wertheim, H.F.L.; Melles, D.C.; Vos, M.C.; van Leeuwen, W.; van Belkum, A.; Verbrugh, H.A.; Nouwen, J.L. The role of nasal carriage in Staphylococcus aureus infections. Lancet Infect. Dis. 2005, 5, 751–762. [Google Scholar] [CrossRef]
- Bal, A.M.; Gould, I.M. Antibiotic resistance in Staphylococcus aureus and its relevance in therapy. Expert Opin. Pharmacother. 2005, 6, 2257–2269. [Google Scholar] [CrossRef] [PubMed]
- Grundmann, H.; Aires-de-Sousa, M.; Boyce, J.; Tiemersma, E. Emergence and resurgence of meticillin-resistant Staphylococcus aureus as a public-health threat. Lancet 2006, 368, 874–885. [Google Scholar] [CrossRef] [PubMed]
- Chambers, H.F.; Deleo, F.R. Waves of resistance: Staphylococcus aureus in the antibiotic era. Nat. Rev. Microbiol. 2009, 7, 629–641. [Google Scholar] [CrossRef]
- WHO. WHO Publishes List of Bacteria for Which New Antibiotics Are Urgently Needed. Available online: https://www.who.int/news/item/27-02-2017-who-publishes-list-of-bacteria-for-which-new-antibiotics-are-urgently-needed (accessed on 13 November 2022).
- WHO. Lack of Innovation Set to Undermine Antibiotic Performance and Health Gains. Available online: https://www.who.int/news/item/22-06-2022-22-06-2022-lack-of-innovation-set-to-undermine-antibiotic-performance-and-health-gains (accessed on 13 November 2022).
- Nathan, C.; Goldberg, F.M. Outlook: The profit problem in antibiotic R&D. Nat. Rev. Drug Discov. 2005, 4, 887–891. [Google Scholar]
- Murakami, K.S.; Darst, S.A. Bacterial RNA polymerases: The wholo story. Curr. Opin. Struct. Biol. 2003, 13, 31–39. [Google Scholar] [CrossRef]
- Ma, C.; Yang, X.; Lewis, P.J. Bacterial Transcription as a Target for Antibacterial Drug Development. Microbiol. Mol. Biol. Rev. 2016, 80, 139–160. [Google Scholar] [CrossRef]
- Greive, S.J.; Lins, A.F.; von Hippel, P.H. Assembly of an RNA-protein complex. Binding of NusB and NusE (S10) proteins to boxA RNA nucleates the formation of the antitermination complex involved in controlling rRNA transcription in Escherichia coli. J. Biol. Chem. 2005, 280, 36397–36408. [Google Scholar] [CrossRef]
- Luttgen, H.; Robelek, R.; Muhlberger, R.; Diercks, T.; Schuster, S.C.; Kohler, P.; Kessler, H.; Bacher, A.; Richter, G. Transcriptional regulation by antitermination. Interaction of RNA with NusB protein and NusB/NusE protein complex of Escherichia coli. J. Mol. Biol. 2002, 316, 875–885. [Google Scholar] [CrossRef]
- Torres, M.; Balada, J.M.; Zellars, M.; Squires, C.; Squires, C.L. In vivo effect of NusB and NusG on rRNA transcription antitermination. J. Bacteriol. 2004, 186, 1304–1310. [Google Scholar] [CrossRef] [PubMed]
- Court, D.L.; Patterson, T.A.; Baker, T.; Costantino, N.; Mao, X.; Friedman, D.I. Structural and functional analyses of the transcription-translation proteins NusB and NusE. J. Bacteriol. 1995, 177, 2589–2591. [Google Scholar] [CrossRef] [PubMed]
- Das, R.; Loss, S.; Li, J.; Waugh, D.S.; Tarasov, S.; Wingfield, P.T.; Byrd, R.A.; Altieri, A.S. Structural biophysics of the NusB:NusE antitermination complex. J. Mol. Biol. 2008, 376, 705–720. [Google Scholar] [CrossRef] [PubMed]
- Said, N.; Krupp, F.; Anedchenko, E.; Santos, K.F.; Dybkov, O.; Huang, Y.H.; Lee, C.T.; Loll, B.; Behrmann, E.; Burger, J.; et al. Structural basis for lambdaN-dependent processive transcription antitermination. Nat. Microbiol. 2017, 2, 17062. [Google Scholar] [CrossRef] [PubMed]
- Luo, X.; Hsiao, H.H.; Bubunenko, M.; Weber, G.; Court, D.L.; Gottesman, M.E.; Urlaub, H.; Wahl, M.C. Structural and functional analysis of the E. coli NusB-S10 transcription antitermination complex. Mol. Cell 2008, 32, 791–802. [Google Scholar] [CrossRef] [PubMed]
- Stagno, J.R.; Altieri, A.S.; Bubunenko, M.; Tarasov, S.G.; Li, J.; Court, D.L.; Byrd, R.A.; Ji, X. Structural basis for RNA recognition by NusB and NusE in the initiation of transcription antitermination. Nucleic Acids Res. 2011, 39, 7803–7815. [Google Scholar] [CrossRef]
- Yang, X.; Ma, C.; Lewis, P.J. Identification of inhibitors of bacterial RNA polymerase. Methods 2015, 86, 45–50. [Google Scholar] [CrossRef]
- Cossar, P.J.; Ma, C.; Gordon, C.P.; Ambrus, J.I.; Lewis, P.J.; McCluskey, A. Identification and validation of small molecule modulators of the NusB-NusE interaction. Bioorganic Med. Chem. Lett. 2017, 27, 162–167. [Google Scholar] [CrossRef]
- Cossar, P.J.; Abdel-Hamid, M.K.; Ma, C.; Sakoff, J.A.; Trinh, T.N.; Gordon, C.P.; Lewis, P.J.; McCluskey, A. Small-Molecule Inhibitors of the NusB-NusE Protein-Protein Interaction with Antibiotic Activity. ACS Omega 2017, 2, 3839–3857. [Google Scholar] [CrossRef]
- Yang, X.; Luo, M.J.; Yeung, A.C.M.; Lewis, P.J.; Chan, P.K.S.; Ip, M.; Ma, C. First-In-Class Inhibitor of Ribosomal RNA Synthesis with Antimicrobial Activity against Staphylococcus aureus. Biochemistry 2017, 56, 5049–5052. [Google Scholar] [CrossRef]
- Tsang, T.F.; Qiu, Y.; Lin, L.; Ye, J.; Ma, C.; Yang, X. Simple Method for Studying in Vitro Protein-Protein Interactions Based on Protein Complementation and Its Application in Drug Screening Targeting Bacterial Transcription. ACS Infect. Dis. 2019, 5, 521–527. [Google Scholar] [CrossRef] [PubMed]
- Qiu, Y.; Chan, S.T.; Lin, L.; Shek, T.L.; Tsang, T.F.; Zhang, Y.; Ip, M.; Chan, P.K.; Blanchard, N.; Hanquet, G.; et al. Nusbiarylins, a new class of antimicrobial agents: Rational design of bacterial transcription inhibitors targeting the interaction between the NusB and NusE proteins. Bioorganic Chem. 2019, 92, 103203. [Google Scholar] [CrossRef] [PubMed]
- Qiu, Y.; Chan, S.T.; Lin, L.; Shek, T.L.; Tsang, T.F.; Barua, N.; Zhang, Y.; Ip, M.; Chan, P.K.; Blanchard, N.; et al. Design, synthesis and biological evaluation of antimicrobial diarylimine and -amine compounds targeting the interaction between the bacterial NusB and NusE proteins. Eur. J. Med. Chem. 2019, 178, 214–231. [Google Scholar] [CrossRef] [PubMed]
- Qiu, Y.; Chu, A.J.; Tsang, T.F.; Zheng, Y.; Lam, N.M.; Li, K.S.L.; Ip, M.; Yang, X.; Ma, C. Synthesis and biological evaluation of nusbiarylin derivatives as bacterial rRNA synthesis inhibitor with potent antimicrobial activity against MRSA and VRSA. Bioorganic Chem. 2022, 124, 105863. [Google Scholar] [CrossRef] [PubMed]
- Qiu, Y.; Ma, C. HPLC, quantitative NMR and HRMS spectroscopic data of nusbiarylins as a new class of antimicrobial agents. Data Brief 2020, 29, 105313. [Google Scholar] [CrossRef] [PubMed]
- Chu, A.J.; Qiu, Y.; Harper, R.; Lin, L.; Ma, C.; Yang, X. Nusbiarylins Inhibit Transcription and Target Virulence Factors in Bacterial Pathogen Staphylococcus aureus. Int. J. Mol. Sci. 2020, 21, 5772. [Google Scholar] [CrossRef] [PubMed]
- Tintori, C.; Manetti, F.; Botta, M. Pharmacophoric models and 3D QSAR studies of the adenosine receptor ligands. Curr. Top. Med. Chem. 2010, 10, 1019–1035. [Google Scholar] [CrossRef]
- Ouassaf, M.; Qais, F.A.; Belaidi, S.; Bakhouch, M.; Mohamed, A.S.; Chtita, S. Combined Pharmacophore Modeling, 3D-QSAR, Molecular Docking and Molecular Dynamics Study on Indolyl-aryl-sulfone Derivatives as New HIV1 Inhibitors. Acta Chim. Slov. 2022, 69, 489–506. [Google Scholar] [CrossRef]
- Chalkha, M.; Akhazzane, M.; Moussaid, F.Z.; Daoui, O.; Nakkabi, A.; Bakhouch, M.; Chtita, S.; Elkhattabi, S.; Housseini, A.I.; El Yazidi, M. Design, synthesis, characterization: In vitro screening, molecular docking, 3D-QSAR, and ADME-Tox investigations of novel pyrazole derivatives as antimicrobial agents. New J. Chem. 2022, 46, 2747–2760. [Google Scholar] [CrossRef]
- Ye, J.; Yang, X.; Ma, C. QSAR, Docking, and Molecular Dynamics Simulation Studies of Sigmacidins as Antimicrobials against Streptococci. Int. J. Mol. Sci. 2022, 23, 4085. [Google Scholar] [CrossRef]
- Yang, X.; Ma, C.; Lewis, P. A vector system that allows simple generation of mutant Escherichia coli RNA polymerase. Plasmid 2014, 75, 37–41. [Google Scholar] [CrossRef] [PubMed]
- Ma, C.; Yang, X.; Kandemir, H.; Mielczarek, M.; Johnston, E.B.; Griffith, R.; Kumar, N.; Lewis, P.J. Inhibitors of bacterial transcription initiation complex formation. ACS Chem. Biol. 2013, 8, 1972–1980. [Google Scholar] [CrossRef] [PubMed]
- Mielczarek, M.; Devakaram, R.V.; Ma, C.; Yang, X.; Kandemir, H.; Purwono, B.; Black, D.S.; Griffith, R.; Lewis, P.J.; Kumar, N. Synthesis and biological activity of novel bis-indole inhibitors of bacterial transcription initiation complex formation. Org. Biomol. Chem. 2014, 12, 2882–2894. [Google Scholar] [CrossRef] [PubMed]
- Kandemir, H.; Ma, C.; Kutty, S.K.; Black, D.S.; Griffith, R.; Lewis, P.J.; Kumar, N. Synthesis and biological evaluation of 2,5-di(7-indolyl)-1,3,4-oxadiazoles, and 2- and 7-indolyl 2-(1,3,4-thiadiazolyl)ketones as antimicrobials. Bioorganic Med. Chem. 2014, 22, 1672–1679. [Google Scholar] [CrossRef] [PubMed]
- Mielczarek, M.; Thomas, R.V.; Ma, C.; Kandemir, H.; Yang, X.; Bhadbhade, M.; Black, D.S.; Griffith, R.; Lewis, P.J.; Kumar, N. Synthesis and biological activity of novel mono-indole and mono-benzofuran inhibitors of bacterial transcription initiation complex formation. Bioorganic Med. Chem. 2015, 23, 1763–1775. [Google Scholar] [CrossRef] [PubMed]
- Thach, O.; Mielczarek, M.; Ma, C.; Kutty, S.K.; Yang, X.; Black, D.S.; Griffith, R.; Lewis, P.J.; Kumar, N. From indole to pyrrole, furan, thiophene and pyridine: Search for novel small molecule inhibitors of bacterial transcription initiation complex formation. Bioorganic Med. Chem. 2016, 24, 1171–1182. [Google Scholar] [CrossRef]
- Wenholz, D.S.; Zeng, M.; Ma, C.; Mielczarek, M.; Yang, X.; Bhadbhade, M.; Black, D.S.C.; Lewis, P.J.; Griffith, R.; Kumar, N. Small molecule inhibitors of bacterial transcription complex formation. Bioorganic Med. Chem. Lett. 2017, 27, 4302–4308. [Google Scholar] [CrossRef]
- Ma, C.; Yang, X.; Lewis, P.J. Bacterial Transcription Inhibitor of RNA Polymerase Holoenzyme Formation by Structure-Based Drug Design: From in Silico Screening to Validation. ACS Infect. Dis. 2016, 2, 39–46. [Google Scholar] [CrossRef]
- Ye, J.; Chu, A.J.; Lin, L.; Yang, X.; Ma, C. First-In-Class Inhibitors Targeting the Interaction between Bacterial RNA Polymerase and Sigma Initiation Factor Affect the Viability and Toxin Release of Streptococcus pneumoniae. Molecules 2019, 24, 2902. [Google Scholar] [CrossRef]
- Ye, J.; Chu, A.J.; Harper, R.; Chan, S.T.; Shek, T.L.; Zhang, Y.; Ip, M.; Sambir, M.; Artsimovitch, I.; Zuo, Z.; et al. Discovery of Antibacterials That Inhibit Bacterial RNA Polymerase Interactions with Sigma Factors. J. Med. Chem. 2020, 63, 7695–7720. [Google Scholar] [CrossRef]
- Ye, J.; Chu, A.J.; Lin, L.; Chan, S.T.; Harper, R.; Xiao, M.; Artsimovitch, I.; Zuo, Z.; Ma, C.; Yang, X. Benzyl and benzoyl benzoic acid inhibitors of bacterial RNA polymerase-sigma factor interaction. Eur. J. Med. Chem. 2020, 208, 112671. [Google Scholar] [CrossRef] [PubMed]
- Vazquez, J.; Lopez, M.; Gibert, E.; Herrero, E.; Luque, F.J. Merging Ligand-Based and Structure-Based Methods in Drug Discovery: An Overview of Combined Virtual Screening Approaches. Molecules 2020, 25, 4723. [Google Scholar] [CrossRef] [PubMed]
- Mason, J.S.; Good, A.C.; Martin, E.J. 3-D pharmacophores in drug discovery. Curr. Pharm. Des. 2001, 7, 567–597. [Google Scholar] [CrossRef] [PubMed]
- Hansch, C.; Fujita, T. p-σ-π Analysis. A Method for the Correlation of Biological Activity and Chemical Structure. J. Am. Chem. Soc. 2002, 86, 1616–1626. [Google Scholar] [CrossRef]
- Bacilieri, M.; Moro, S. Ligand-based drug design methodologies in drug discovery process: An overview. Curr. Drug Discov. Technol. 2006, 3, 155–165. [Google Scholar] [CrossRef]
- Hall, M.L.; Calkins, D.; Sherman, W. Automated Protocol for Large-Scale Modeling of Gene Expression Data. J. Chem. Inf. Model. 2016, 56, 2216–2224. [Google Scholar] [CrossRef]
- Ye, J.; Yang, X.; Xu, M.; Chan, P.K.; Ma, C. Novel N-Substituted oseltamivir derivatives as potent influenza neuraminidase inhibitors: Design, synthesis, biological evaluation, ADME prediction and molecular docking studies. Eur. J. Med. Chem. 2019, 182, 111635. [Google Scholar] [CrossRef]
- Ye, J.; Lin, L.; Xu, J.; Chan, P.K.; Yang, X.; Ma, C. Design, Synthesis, Biological Evaluation and In Silico Studies of Pyrazole-Based NH2-Acyl Oseltamivir Analogues as Potent Neuraminidase Inhibitors. Pharmaceuticals 2021, 14, 371. [Google Scholar] [CrossRef]
- Fährrolfes, R.; Bietz, S.; Flachsenberg, F.; Meyder, A.; Nittinger, E.; Otto, T.; Volkamer, A.; Rarey, M. Proteins Plus: A web portal for structure analysis of macromolecules. Nucleic Acids Res. 2017, 45, W337–W343. [Google Scholar] [CrossRef]
- Rücker, C.; Rücker, G.; Meringer, M. Y-randomization and its variants in QSPR/QSAR. J. Chem. Inf. Model. 2007, 47, 2345–2357. [Google Scholar] [CrossRef]
- Yang, X.; Molimau, S.; Doherty, G.P.; Johnston, E.B.; Marles-Wright, J.; Rothnagel, R.; Hankamer, B.; Lewis, R.J.; Lewis, P.J. The structure of bacterial RNA polymerase in complex with the essential transcription elongation factor NusA. EMBO Rep. 2009, 10, 997–1002. [Google Scholar] [CrossRef] [PubMed]
- Ma, C.; Mobli, M.; Yang, X.; Keller, A.N.; King, G.F.; Lewis, P.J. RNA polymerase-induced remodelling of NusA produces a pause enhancement complex. Nucleic Acids Res. 2015, 43, 2829–2840. [Google Scholar] [CrossRef] [PubMed]
- Yang, X.; Ma, C. In Vitro Transcription Assays and Their Application in Drug Discovery. J. Vis. Exp. 2016, 115, e54256. [Google Scholar] [CrossRef] [PubMed]


| Cpd. | MIC (μg/mL) | MW | MIC (M) | pMIC | 3D QSAR | AutoQSAR | ||
|---|---|---|---|---|---|---|---|---|
| Predicted pMIC | Δ d | Predicted pMIC | Δ d | |||||
| 1 | 8 | 260.22 | 3.07 × 10⁻⁵ | 4.512 | 4.609 | −0.096 | 4.780 | −0.267 |
| 2 a | 4 | 260.22 | 1.54 × 10⁻⁵ | 4.813 | 4.516 | 0.297 | 4.767 | 0.046 |
| 3 | 8 | 260.22 | 3.07 × 10⁻⁵ | 4.512 | 4.599 | −0.086 | 4.705 | −0.192 |
| 4 | 4 | 256.26 | 1.56 × 10⁻⁵ | 4.807 | 4.781 | 0.026 | 4.892 | −0.086 |
| 5 | 4 | 256.26 | 1.56 × 10⁻⁵ | 4.807 | 4.698 | 0.108 | 4.832 | −0.025 |
| 6 a | 4 | 256.26 | 1.56 × 10⁻⁵ | 4.807 | 4.669 | 0.138 | 4.895 | −0.088 |
| 7 | 4 | 298.34 | 1.34 × 10⁻⁵ | 4.873 | 4.834 | 0.038 | 4.936 | −0.063 |
| 8 | 4 | 272.26 | 1.47 × 10⁻⁵ | 4.833 | 4.934 | −0.102 | 4.858 | −0.025 |
| 9 | 16 | 272.26 | 5.88 × 10⁻⁵ | 4.231 | 4.507 | −0.276 | 4.721 | −0.490 |
| 10 | 4 | 272.26 | 1.47 × 10⁻⁵ | 4.833 | 4.971 | −0.138 | 4.863 | −0.030 |
| 11 a | 4 | 300.27 | 1.33 × 10⁻⁵ | 4.875 | 4.862 | 0.013 | 4.941 | −0.066 |
| 12 b | 2 | 300.27 | 6.66 × 10⁻⁶ | 5.176 | 5.203 | −0.027 | 4.889 | 0.287 |
| 13 b | 2 | 300.27 | 6.66 × 10⁻⁶ | 5.176 | 5.183 | −0.006 | 4.881 | 0.296 |
| 14 a | 8 | 266.25 | 3.00 × 10⁻⁵ | 4.522 | 4.119 | 0.403 | 4.322 | 0.200 |
| 15 | 4 | 272.26 | 1.47 × 10⁻⁵ | 4.833 | 4.841 | −0.008 | 4.830 | 0.003 |
| 16 a | 4 | 272.26 | 1.47 × 10⁻⁵ | 4.833 | 4.907 | −0.074 | 4.874 | −0.041 |
| 17 a | 4 | 285.26 | 1.40 × 10⁻⁵ | 4.853 | 4.903 | −0.050 | 4.932 | −0.078 |
| 18 a,b | 2 | 321.31 | 6.22 × 10⁻⁶ | 5.206 | 4.930 | 0.276 | 4.852 | 0.354 |
| 19 b | 2 | 267.24 | 7.48 × 10⁻⁶ | 5.126 | 4.810 | 0.316 | 4.766 | 0.360 |
| 20 | 4 | 267.24 | 1.50 × 10⁻⁵ | 4.825 | 4.674 | 0.151 | 4.525 | 0.300 |
| 21 | 4 | 267.24 | 1.50 × 10⁻⁵ | 4.825 | 4.771 | 0.054 | 4.713 | 0.112 |
| 22 | 4 | 281.27 | 1.42 × 10⁻⁵ | 4.847 | 4.936 | −0.089 | 4.705 | 0.142 |
| 23 b | 2 | 300.27 | 6.66 × 10⁻⁶ | 5.176 | 5.113 | 0.063 | 4.884 | 0.293 |
| 24 | 4 | 349.36 | 1.14 × 10⁻⁵ | 4.941 | 4.930 | 0.011 | 4.874 | 0.067 |
| 25 b | 2 | 340.25 | 5.88 × 10⁻⁶ | 5.231 | 5.195 | 0.035 | 4.865 | 0.366 |
| 26 | 4 | 315.28 | 1.27 × 10⁻⁵ | 4.897 | 5.073 | −0.176 | 4.938 | −0.042 |
| 27 a | 4 | 363.35 | 1.10 × 10⁻⁵ | 4.958 | 5.003 | −0.045 | 4.969 | −0.011 |
| 28 | 4 | 392.39 | 1.02 × 10⁻⁵ | 4.992 | 4.964 | 0.028 | 4.949 | 0.042 |
| 29 a | 8 | 318.33 | 2.51 × 10⁻⁵ | 4.600 | 5.004 | −0.404 | 4.916 | −0.316 |
| 30 | 8 | 318.33 | 2.51 × 10⁻⁵ | 4.600 | 4.656 | −0.056 | 4.835 | −0.235 |
| 32 | 8 | 318.33 | 2.51 × 10⁻⁵ | 4.600 | 4.644 | −0.044 | 4.835 | −0.235 |
| 33 | 8 | 266.25 | 3.00 × 10⁻⁵ | 4.522 | 4.119 | 0.403 | 4.322 | 0.200 |
| 34 a | 4 | 266.25 | 1.50 × 10⁻⁵ | 4.823 | 4.785 | 0.038 | 4.648 | 0.175 |
| 35 a | 4 | 266.25 | 1.50 × 10⁻⁵ | 4.823 | 4.506 | 0.318 | 4.708 | 0.115 |
| 36 | 4 | 242.23 | 1.65 × 10⁻⁵ | 4.782 | 4.647 | 0.136 | 4.893 | −0.111 |
| 37 | 4 | 298.34 | 1.34 × 10⁻⁵ | 4.873 | 5.053 | −0.181 | 4.937 | −0.064 |
| 38 | 4 | 298.34 | 1.34 × 10⁻⁵ | 4.873 | 4.835 | 0.038 | 4.936 | −0.063 |
| 39 | 4 | 298.34 | 1.34 × 10⁻⁵ | 4.873 | 4.794 | 0.079 | 4.940 | −0.067 |
| 40 | 4 | 258.23 | 1.55 × 10⁻⁵ | 4.810 | 4.703 | 0.107 | 4.809 | 0.001 |
| 41 | 16 | 258.23 | 6.20 × 10⁻⁵ | 4.208 | 4.325 | −0.117 | 4.471 | −0.263 |
| 42 a | 4 | 258.23 | 1.55 × 10⁻⁵ | 4.810 | 4.928 | −0.118 | 4.772 | 0.038 |
| 43 b | 2 | 276.68 | 7.23 × 10⁻⁶ | 5.141 | 4.591 | 0.550 | 4.907 | 0.234 |
| 44 b | 2 | 276.68 | 7.23 × 10⁻⁶ | 5.141 | 4.524 | 0.617 | 4.812 | 0.329 |
| 45 | 8 | 276.68 | 2.89 × 10⁻⁵ | 4.539 | 4.558 | −0.019 | 4.842 | −0.303 |
| 46 a | 8 | 310.23 | 2.58 × 10⁻⁵ | 4.589 | 4.774 | −0.185 | 4.835 | −0.246 |
| 47 | 16 | 310.23 | 5.16 × 10⁻⁵ | 4.288 | 4.679 | −0.392 | 4.797 | −0.509 |
| 48 | 8 | 310.23 | 2.58 × 10⁻⁵ | 4.589 | 4.545 | 0.044 | 4.838 | −0.250 |
| 49 | 4 | 286.24 | 1.40 × 10⁻⁵ | 4.855 | 4.890 | −0.035 | 4.910 | −0.055 |
| 50a | 4 | 248.28 | 1.61 × 10⁻⁵ | 4.793 | 4.748 | 0.045 | 4.659 | 0.134 |
| 51 | 4 | 292.29 | 1.37 × 10⁻⁵ | 4.864 | 4.826 | 0.037 | 4.923 | −0.059 |
| 52 | 128 | 279.29 | 4.58 × 10⁻⁴ | 3.339 | 3.156 | 0.183 | 3.550 | −0.212 |
| 53 a,c | 256 | 239.24 | 1.07 × 10⁻³ | 2.971 | 3.565 | −0.595 | 3.294 | −0.323 |
| 54 | 32 | 246.26 | 1.30 × 10⁻⁴ | 3.886 | 3.711 | 0.175 | 3.644 | 0.242 |
| 55 a | 256 | 260.29 | 9.84 × 10⁻⁴ | 3.007 | 3.299 | −0.292 | 3.359 | −0.352 |
| 56 c | 256 | 221.25 | 1.16 × 10⁻³ | 2.937 | 3.502 | −0.565 | 3.154 | −0.217 |
| 57 c | 256 | 250.25 | 1.02 × 10⁻³ | 2.990 | 3.298 | −0.308 | 3.076 | −0.086 |
| 58 a | 64 | 266.25 | 2.40 × 10⁻⁴ | 3.619 | 3.685 | −0.066 | 3.423 | 0.196 |
| 59 | 256 | 266.25 | 9.61 × 10⁻⁴ | 3.017 | 3.269 | −0.252 | 3.156 | −0.139 |
| 60 a | 256 | 266.25 | 9.61 × 10⁻⁴ | 3.017 | 2.777 | 0.240 | 3.170 | −0.153 |
| 61 | 32 | 345.15 | 9.27 × 10⁻⁵ | 4.033 | 4.136 | −0.103 | 3.567 | 0.466 |
| ID | HypoID | Scores | |||||
|---|---|---|---|---|---|---|---|
| Select | Survival | Site | Vector | Volume | BEDROC | ||
| 1 | AADRR_1 | 1.608 | 4.885 | 0.781 | 0.957 | 0.840 | 0.639 |
| 2 | AADRR_2 | 1.554 | 4.838 | 0.818 | 0.958 | 0.810 | 0.639 |
| 3 | AADRR_3 | 1.527 | 4.821 | 0.841 | 0.950 | 0.805 | 0.629 |
| 4 | AAARR_1 | 1.496 | 4.778 | 0.786 | 0.958 | 0.840 | 0.639 |
| 5 | AAARR_2 | 1.476 | 4.774 | 0.819 | 0.927 | 0.853 | 0.639 |
| 6 | AADRR_4 | 1.492 | 4.771 | 0.800 | 0.948 | 0.831 | 0.634 |
| 7 | AADRR_5 | 1.584 | 4.769 | 0.674 | 0.985 | 0.827 | 0.615 |
| 8 | AADRR_6 | 1.587 | 4.749 | 0.676 | 0.971 | 0.816 | 0.644 |
| 9 | AAARR_3 | 1.495 | 4.659 | 0.678 | 0.971 | 0.817 | 0.644 |
| 10 | AAARR_4 | 1.478 | 4.644 | 0.680 | 0.961 | 0.827 | 0.627 |
| 11 | ADRR_1 | 1.208 | 5.004 | 0.998 | 1.000 | 0.895 | 1.000 |
| 12 | ADRR_2 | 1.170 | 4.966 | 0.999 | 1.000 | 0.894 | 0.982 |
| 13 | AARR_1 | 1.142 | 4.938 | 0.999 | 1.000 | 0.894 | 1.000 |
| 14 | ADRR_3 | 1.344 | 4.614 | 0.786 | 0.955 | 0.830 | 0.644 |
| 15 | ADRR_4 | 1.293 | 4.564 | 0.833 | 0.936 | 0.803 | 0.641 |
| 16 | ADRR_5 | 1.330 | 4.547 | 0.731 | 0.955 | 0.832 | 0.614 |
| 17 | ADRR_6 | 1.314 | 4.529 | 0.756 | 0.947 | 0.813 | 0.617 |
| 18 | ADRR_7 | 1.298 | 4.526 | 0.771 | 0.947 | 0.811 | 0.636 |
| 19 | AARR_2 | 1.215 | 4.453 | 0.832 | 0.904 | 0.804 | 0.644 |
| 20 | AARR_3 | 1.201 | 4.446 | 0.787 | 0.949 | 0.810 | 0.644 |
| SD | r2 | r2 CV | r2 Scramble | Stability | F | P | RMSE | Q2 | Pearson-r |
|---|---|---|---|---|---|---|---|---|---|
| 0.212 | 0.895 | 0.756 | 0.502 | 0.943 | 110.6 | 4.05 × 10⁻¹⁹ | 0.29 | 0.792 | 0.895 |
| Iteration | r2 Rand | r2cv Rand | Iteration | r2 Rand | r2cv Rand |
|---|---|---|---|---|---|
| 1 | 0.586 | 0.097 | 6 | 0.759 | 0.470 |
| 2 | 0.741 | 0.214 | 7 | 0.414 | −0.238 |
| 3 | 0.436 | −0.202 | 8 | 0.727 | 0.323 |
| 4 | 0.701 | 0.121 | 9 | 0.728 | −0.001 |
| 5 | 0.634 | 0.016 | 10 | 0.626 | 0.107 |
| ID | Model Code | score | S.D. | R2 | RMSE | Q2 | Factor |
|---|---|---|---|---|---|---|---|
| 1 | kpls_dendritic_3 | 0.848 | 0.251 | 0.846 | 0.232 | 0.867 | 1 |
| 2 | kpls_linear_3 | 0.833 | 0.256 | 0.840 | 0.254 | 0.840 | 1 |
| 3 | kpls_linear_14 | 0.820 | 0.266 | 0.820 | 0.266 | 0.838 | 1 |
| 4 | kpls_dendritic_14 | 0.818 | 0.270 | 0.815 | 0.256 | 0.851 | 1 |
| 5 | kpls_radial_14 | 0.813 | 0.273 | 0.810 | 0.264 | 0.841 | 1 |
| 6 | kpls_linear_9 | 0.810 | 0.270 | 0.819 | 0.271 | 0.824 | 1 |
| 7 | kpls_radial_9 | 0.804 | 0.282 | 0.803 | 0.277 | 0.816 | 1 |
| 8 | kpls_radial_44 | 0.802 | 0.282 | 0.821 | 0.273 | 0.761 | 1 |
| 9 | kpls_linear_50 | 0.8015 | 0.277 | 0.825 | 0.272 | 0.776 | 1 |
| 10 | kpls_molprint2D_22 | 0.7957 | 0.279 | 0.823 | 0.275 | 0.764 | 1 |
| Parameters | J098-0498 | 1067-0401 | M013-0558 | F186-0261 | |
|---|---|---|---|---|---|
| Screening | Phase Screen Score | 1.599 | 1.506 | 1.606 | 1.511 |
| 3D QSAR_pMIC | 4.01 | 3.98 | 4.15 | 3.81 | |
| AutoQSAR_pMIC | 3.81 | 4.16 | 3.83 | 3.82 | |
| ADME/T | QPlogS | −6.30 | −6.22 | −6.84 | −6.42 |
| Human Oral Absorption (%) | 96.49 | 81.61 | 100.00 | 100.00 | |
| QPPCaco | 459.59 | 103.39 | 918.22 | 1170.89 | |
| QPlogKhsa | 0.31 | 0.18 | 0.67 | 0.23 | |
| QPPMDCK | 214.947 | 178.206 | 451.12 | 279.964 | |
| #metab | 6 | 4 | 3 | 4 | |
| QPlogHERG | −7.21 | −6.75 | −7.09 | −6.80 | |
| CNS | −2 | −2 | −1 | −1 | |
| CYP2D6 | false | false | false | false | |
| Hepatotoxicity | true | true | true | true | |
| Rat Oral LD50 (g/kg) | 67.95 | 4.74 | 9.29 | 5.72 |
| ID | XP Docking Score (kcal/mol) | (kcal/mol) |
|---|---|---|
| J098-0498 | −2.63 | −58.64 |
| 1067-0401 | −2.49 | −64.08 |
| M013-0558 | −2.98 | −60.72 |
| F186-0261 | −2.39 | −65.08 |
Disclaimer/Publisher’s Note: The statements, opinions and data contained in all publications are solely those of the individual author(s) and contributor(s) and not of MDPI and/or the editor(s). MDPI and/or the editor(s) disclaim responsibility for any injury to people or property resulting from any ideas, methods, instructions or products referred to in the content. |
© 2022 by the authors. Licensee MDPI, Basel, Switzerland. This article is an open access article distributed under the terms and conditions of the Creative Commons Attribution (CC BY) license (https://creativecommons.org/licenses/by/4.0/).
Share and Cite
Ye, J.; Yang, X.; Ma, C. Ligand-Based Drug Design of Novel Antimicrobials against Staphylococcus aureus by Targeting Bacterial Transcription. Int. J. Mol. Sci. 2023, 24, 339. https://doi.org/10.3390/ijms24010339
Ye J, Yang X, Ma C. Ligand-Based Drug Design of Novel Antimicrobials against Staphylococcus aureus by Targeting Bacterial Transcription. International Journal of Molecular Sciences. 2023; 24(1):339. https://doi.org/10.3390/ijms24010339
Chicago/Turabian StyleYe, Jiqing, Xiao Yang, and Cong Ma. 2023. "Ligand-Based Drug Design of Novel Antimicrobials against Staphylococcus aureus by Targeting Bacterial Transcription" International Journal of Molecular Sciences 24, no. 1: 339. https://doi.org/10.3390/ijms24010339
APA StyleYe, J., Yang, X., & Ma, C. (2023). Ligand-Based Drug Design of Novel Antimicrobials against Staphylococcus aureus by Targeting Bacterial Transcription. International Journal of Molecular Sciences, 24(1), 339. https://doi.org/10.3390/ijms24010339