Article

A Proteomic Approach Reveals That miR-423-5p Modulates Glucidic and Amino Acid Metabolism in Prostate Cancer Cells

1
Department of Precision Medicine, University of Campania “Luigi Vanvitelli”, Via L. De Crecchio 7, 80138 Naples, Italy
2
John van Geest Cancer Research Centre, Nottingham Trent University, Nottingham NG11 8NS, UK
3
Medicina Futura Group, Coleman S.p.A, Via Alcide De Gasperi 107/109/111, Acerra, 80011 Naples, Italy
4
Laboratory of Precision and Molecular Oncology, Biogem Scarl, Institute of Genetic Research, Contrada Camporeale, 83031 Ariano Irpino, Italy
5
Department of Advanced Medical and Surgical Sciences “DAMSS”, University of Campania “Luigi Vanvitelli”, Via S. M. di Costantinopoli 104, 80138 Naples, Italy
6
Department of Experimental Medicine, University of Campania “Luigi Vanvitelli”, 80138 Naples, Italy
*
Author to whom correspondence should be addressed.
These authors contributed equally to this work.
Int. J. Mol. Sci. 2023, 24(1), 617; https://doi.org/10.3390/ijms24010617
Submission received: 18 November 2022 / Revised: 22 December 2022 / Accepted: 25 December 2022 / Published: 29 December 2022

Abstract

:
Recently, we have demonstrated that miR-423-5p modulates the growth and metastases of prostate cancer (PCa) cells both in vitro and in vivo. Here, we have studied the effects of miR-423-5p on the proteomic profile in order to identify its intracellular targets and the affected pathways. Applying a quantitative proteomic approach, we analyzed the effects on the protein expression profile of miR-423-5p-transduced PCa cells. Moreover, a computational analysis of predicted targets of miR-423-5p was carried out by using several target prediction tools. Proteomic analysis showed that 63 proteins were differentially expressed in miR-423-5-p-transfected LNCaP cells if compared to controls. Pathway enrichment analysis revealed that stable overexpression of miR-423-5p in LNCaP PCa cells induced inhibition of glycolysis and the metabolism of several amino acids and a parallel downregulation of proteins involved in transcription and hypoxia, the immune response through Th17-derived cytokines, inflammation via amphorin signaling, and ion transport. Moreover, upregulated proteins were related to the S phase of cell cycle, chromatin modifications, apoptosis, blood coagulation, and calcium transport. We identified seven proteins commonly represented in miR-423-5p targets and differentially expressed proteins (DEPs) and analyzed their expression and influence on the survival of PCa patients from publicly accessible datasets. Overall, our findings suggest that miR-423-5p induces alterations in glucose and amino acid metabolism in PCa cells paralleled by modulation of several tumor-associated processes.

1. Introduction

Prostate cancer (PCa) is one the most common cancers worldwide in males [1,2]. Despite screening based on the prostate-specific antigen (PSA), the diagnosis and treatment of PCa are frequently delayed because specific symptoms and biomarkers are lacking in the early stage [3]. Consequently, it is crucial to understand the molecular bases of PCa in order to develop novel strategies for both diagnosis and treatment.
MicroRNAs (miRNAs) are small non-coding RNAs highly conserved during evolution and key regulators of numerous genes involved in physiological processes and diseases including cancer. They can modulate several biological mechanisms by post-transcriptional inhibition of gene expression affecting downstream proteins and, therefore, cancer-related pathways. By interacting with 3′ untranslated regions (3′UTRs) of mRNA targets, miRNAs can play important regulatory roles as either oncogenes or tumor suppressors. In addition, the role of miRNAs is not limited to cancer cells, they can also act on immune, endothelial and stromal cells in the tumor tissue microenvironment, thus modulating tumor development, progression and spreading [4,5,6].
Although earlier studies showed a strong correlation between miRNAs and PCa, the investigation of new miRNAs with therapeutic and diagnostic potential is still ongoing [7,8].
Several studies revealed the double function of miR-423-5p in malignancies. miR-423-5p has been linked to cell invasion and migration in lung cancer, brain metastases, malignant phenotype and chemoresistance in glioblastoma, and cell growth in gastric cancer [9,10,11,12,13]. Conversely, it can inhibit cancer proliferation and invasion in ovarian cancer as well as colon cancer progression by the activation of caspase-dependent apoptosis [14,15].
Finally, we have recently shown that miR-423-5p plays a tumor suppressive role by inhibiting the long non-coding RNA (lncRNA) MALAT1-mediated proliferation, migration, and invasion of PCa cells. Gene expression analysis of cancer progression in PCa models overexpressing miR-423-5p demonstrated a strong reduction of both metastatic and angiogenesis processes. Moreover, these data were strongly supported by a reduction in the proliferation and metastatization induced by miR-423-5p overexpression in xenografted NOD/SCID mice [16].
Based on these results and in order to investigate the protein targets of miR-423-5p in PCa cells, we applied a quantitative proteomic approach to analyze the downstream effects on the protein expression profile of miR-423-5p-transduced PCa cells. Moreover, a computational analysis of predicted target genes of miR-423-5p was carried out by using several target prediction tools including DIANA microT-CDS, TargetScan_Human_v8.0, mirDIP v4.1, and mirDB. Results from proteomic analysis were integrated with prediction analysis and previously validated miR-423-5p targets have been additionally characterized by Gene Expression Profiling Interactive Analysis (GEPIA) and Human Protein Atlas online tools to evaluate the impact of the miR-423-5p on protein expression and clinical progression in PCa.

2. Results

2.1. Proteomic Profiling of LNCaP Cells Overexpressing miR-423-5p

To investigate the effect of miR-423-5p on its intracellular targets, we performed a quantitative SWATH proteomic analysis of PCa LNCaP cells, both those expressing miR-423-5p mimic and the control transduced with the empty vector.
Differential expression analysis showed that 63 proteins were significantly differentially expressed in the LNCaP cells overexpressing miR-423-5p compared to control, of which 19 proteins were downregulated and 44 upregulated (Figure 1A–C). A complete list of differentially expressed proteins (DEPs) is available in Table S1.
Pathway enrichment analysis of all up- and down-regulated proteins using the online software MetaCore (Thomson Reuters) identified several pathways, (Table 1 and Table 2) modulated following miR-423-5p mimic expression. We found that most of the proteins, whose expression was downregulated, are mainly involved in cellular metabolism, such as IDO1 (Indoleamine 2,3-dioxygenase-1) effect on T cell metabolism, glycolysis and gluconeogenesis, and histamine, glutathione, tyrosine, catecholamine, and ascorbate metabolisms (Figure 2). In fact, we observed a decreased expression of G6PD (Glucose-6-phosphate dehydrogenase), HX2 (Hexokinase 2), ALDH2 (Aldehyde dehydrogenase 2 family), and LDHA (Lactate dehydrogenase A) (Table 1, Figure 2). Other downregulated proteins are involved in immune response, related to Myeloid-derived suppressor cells and M2 macrophages in cancer, MIF-mediated glucocorticoid regulation, and MIF-JAB signaling. Proteins involved in transcription and hypoxia, such as HIF-1 targets’ pathways and transcriptional assembly, were also significantly downregulated (Table 1, Figure 2). Conversely, proteins whose expression was upregulated were mostly associated with cell metabolism, such as galactose metabolism, neolacto-series GSL (Glycosphingolipid) metabolism, peptidase activity, and the lysosomal pathway but also with clathrin vesicles formation, G-protein signaling, and the HP1 role in transcriptional silencing (Table 2, Figure 2). Furthermore, when both downregulated and upregulated proteins were analyzed as process networks, those involved in the immune response through Th17-derived cytokines, inflammation via amphorin signaling, and ion transport were downregulated. Conversely, those related to the cell cycle S phase, chromatin modifications, apoptosis, blood coagulation, and calcium transport were upregulated (Table 3 and Table 4, Figure 2). Although several pathways and processes were identified in response to miR-423-5p overexpression, cellular metabolism, immune response, and transcription appear to be the ones that are mainly affected as indicated by the pathway enrichment analysis of proteomic data (p-value ≤ 0.05). Protein–protein interaction (PPI) networks of significant downregulated and upregulated proteins in LNCaP PCa cells expressing miR-423-5p mimic compared to control (empty vector) made by STRING analysis of proteomic data confirmed Metacore enrichment analysis [17]. As shown in Figure 3A, the majority of the proteins downregulated by miR-423-5p are involved in the pentose phosphate pathway, glycolysis, and carbon metabolism in cancer (G6PH and LDHA), as well as the biosynthesis of amino acids (SHMT2 and ASNS). Conversely, upregulated proteins in LNCaP PCa cells overexpressing miR-423-5p are involved in catabolic mechanisms related to amino acids metabolism and lysosome function (TPP1, DPP7 and, CTSH) (Figure 3B).

2.2. Prediction of Functional Targets by Integrative Analysis of miRNA Predicted Targets and Protein Expression Data

Previous studies show that miR-423-5p is involved in the downregulation of lncRNA MALAT1 and promotes cell proliferation, migration, and invasion in PCa cells [16]. Moreover, the overexpression of this miRNA in PCa cells is associated with increased survival of PCa patients and reduced metastasis formation in mouse models [16]. To evaluate the targets involved in the role played by miR-423-5p in PCa, a target prediction analysis was performed. By using four target prediction tools, a total of 6695 miRNA target genes (miTGs) were identified of which 77 (1.2%) were represented in all databases (Table 5, Figure 4A) [18,19,20,21]. From the output list, miRNA targets predicted by two or more prediction tools were considered for further analysis. Then, an integrated analysis between predicted miRNA targets and DEPs identified in this study was performed. As shown in the Venn diagram, seven targets were found commonly represented between miR-423-5p target genes and DEPs in LNCaP cells overexpressing miR-423-5p (Figure 4B). A detailed summary of the seven genes/proteins commonly represented in the prediction analysis results and proteomic data is given in Table 6.

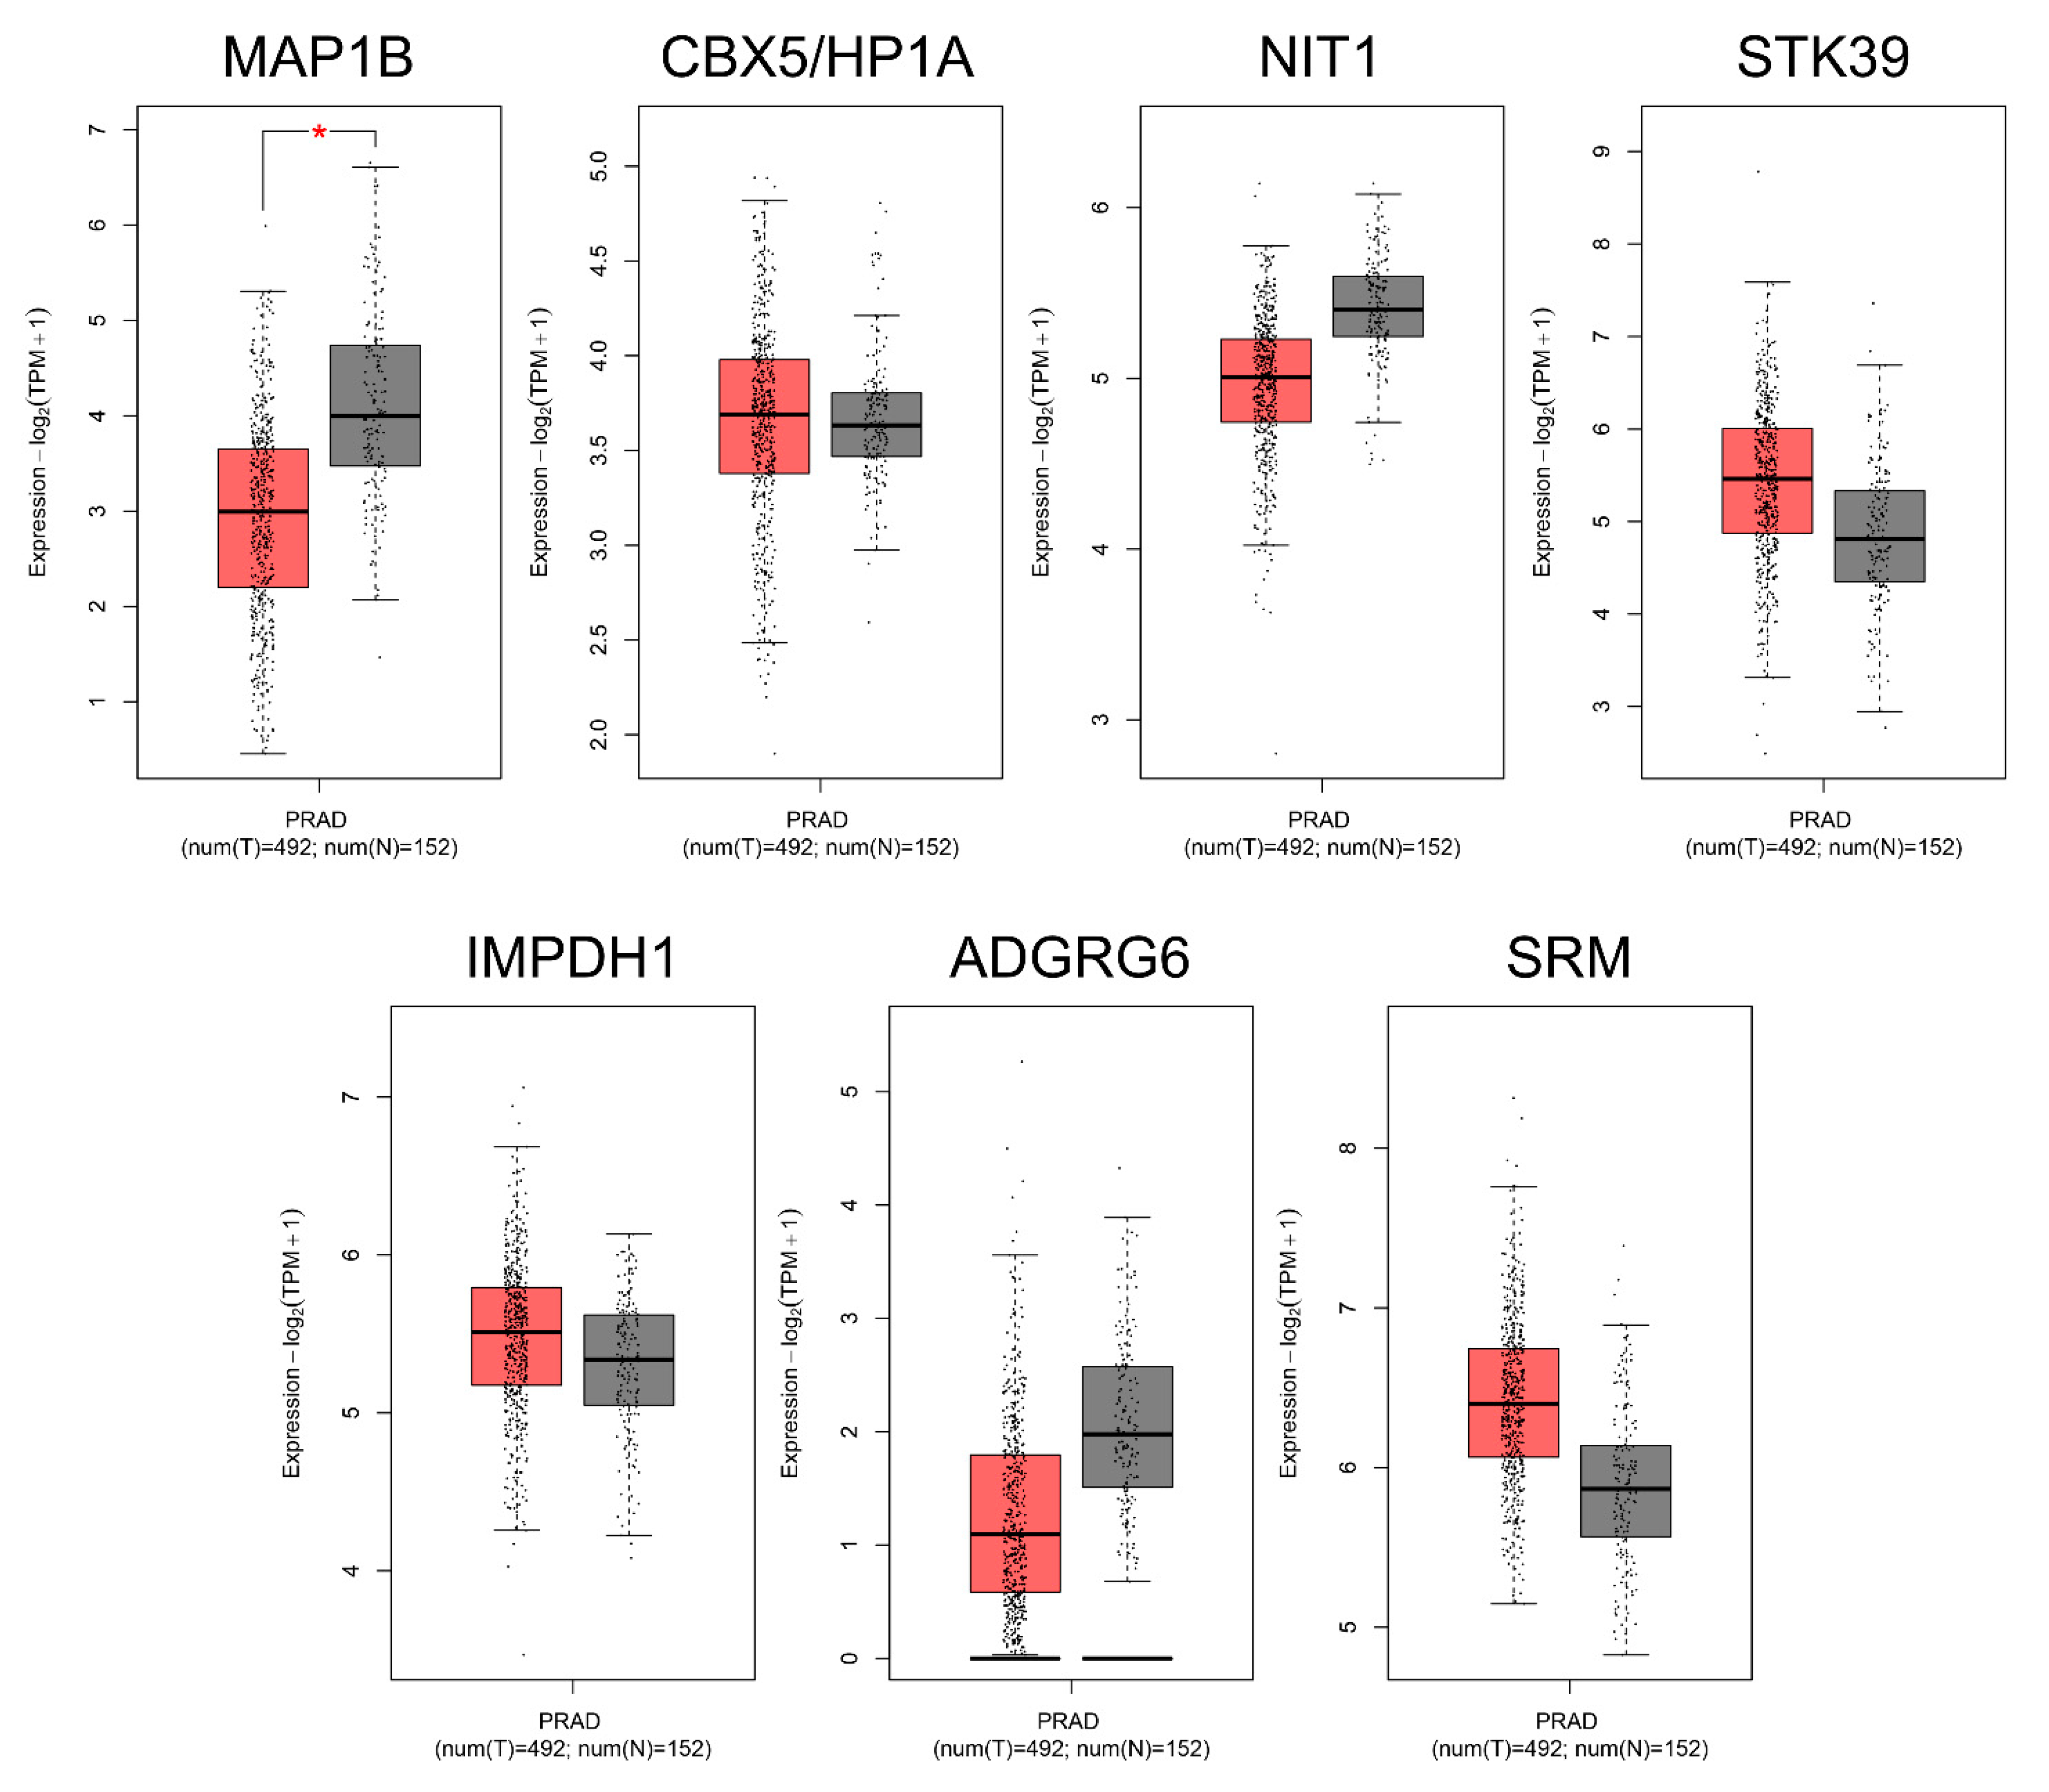
2.3. Protein Expression Analysis and Gene Expression Profiling of miR-423-5p Targets in Prostate Cancer

To understand the known experimental interaction between miR-423-5p and the seven validated differentially expressed target proteins from the proteomic analysis, the DIANA TarBase v8 database was used [22]. TarBase analysis showed that there is a known interaction between miR-423-5p and five out of the seven targets, namely, Microtubule-associated protein 1B (MAP1B), Chromobox 5 (CBX5/HP1A), Inosine-5′-monophosphate dehydrogenase 1 (IMPDH1), Adhesion G-protein coupled receptor G6 (ADGRG6), and Spermidine synthase (SRM), and reported at different tissue levels including bone marrow, kidney, and cervix at different experimental conditions. However, there was no known experimentally validated interaction reported between miR-423-5p and the abovementioned target genes in PCa (Table S2) [23,24,25,26,27].
To exploit the expression of protein targets of miR-423-5p in the LNCaP PCa cell line, we performed a protein expression analysis using the Expression Atlas for the previously identified seven targets in the LNCaP cell line [28]. All protein targets showed a high expression in the LNCaP cell line (High: >1.000 Parts per billion) as reported in Table 7.
Moreover, in order to extend the analysis to data from patients, a gene expression analysis was performed using GEPIA2 based on The Cancer Genome Atlas-Prostate Adenocarcinoma (TCGA-PRAD) and the Genotype-Tissue Expression (GTEx) project data [29].
Comparison of mRNA expression in prostate adenocarcinoma (Tumour, T = 492) versus normal prostate tissue (Normal, N = 152) showed a significant difference for microtubule-associated protein 1B (MAP1B). Conversely, the other evaluated and validated targets CBX5/HP1A, NIT1, STK39, IMPDH1, ADGRG6, and SRM did not show any significant differences (Figure 5).
Finally, the analysis of the expression of IMDH1 (gene IMDPH1) and SPEE (gene SRM), which were downregulated in LNCaP cells overexpressing miR-423-5p from the proteomic analysis, showed an opposite trend at the transcriptomic level using the TCGA-PRAD and GTEx datasets, suggesting that the lowered expression of these target proteins is mediated by the overexpression of miR-423-5p in PCa cells (Table 7). This evidence is supported by the real-time expression profiling (RT-qPCR) of miR-423-5p in several human PCa cell lines (Figure S1). In fact, we observed a lower expression of miR-423-5p in LNCaP cells that was at the limit of detection if compared to DU-145 and PC-3 cells. Moreover, to determine the prognostic significance of miR-423-5p, an overall survival analysis using the ENCORI Pan-Cancer platform was performed [30]. Two clinical subgroups that consisted of patients with high and low levels of miR-423-5p were obtained but no significant correlations between the expression levels of miR-423-5p and prognosis in PRAD groups was found (log-rank p = 0.96) (Figure S2).

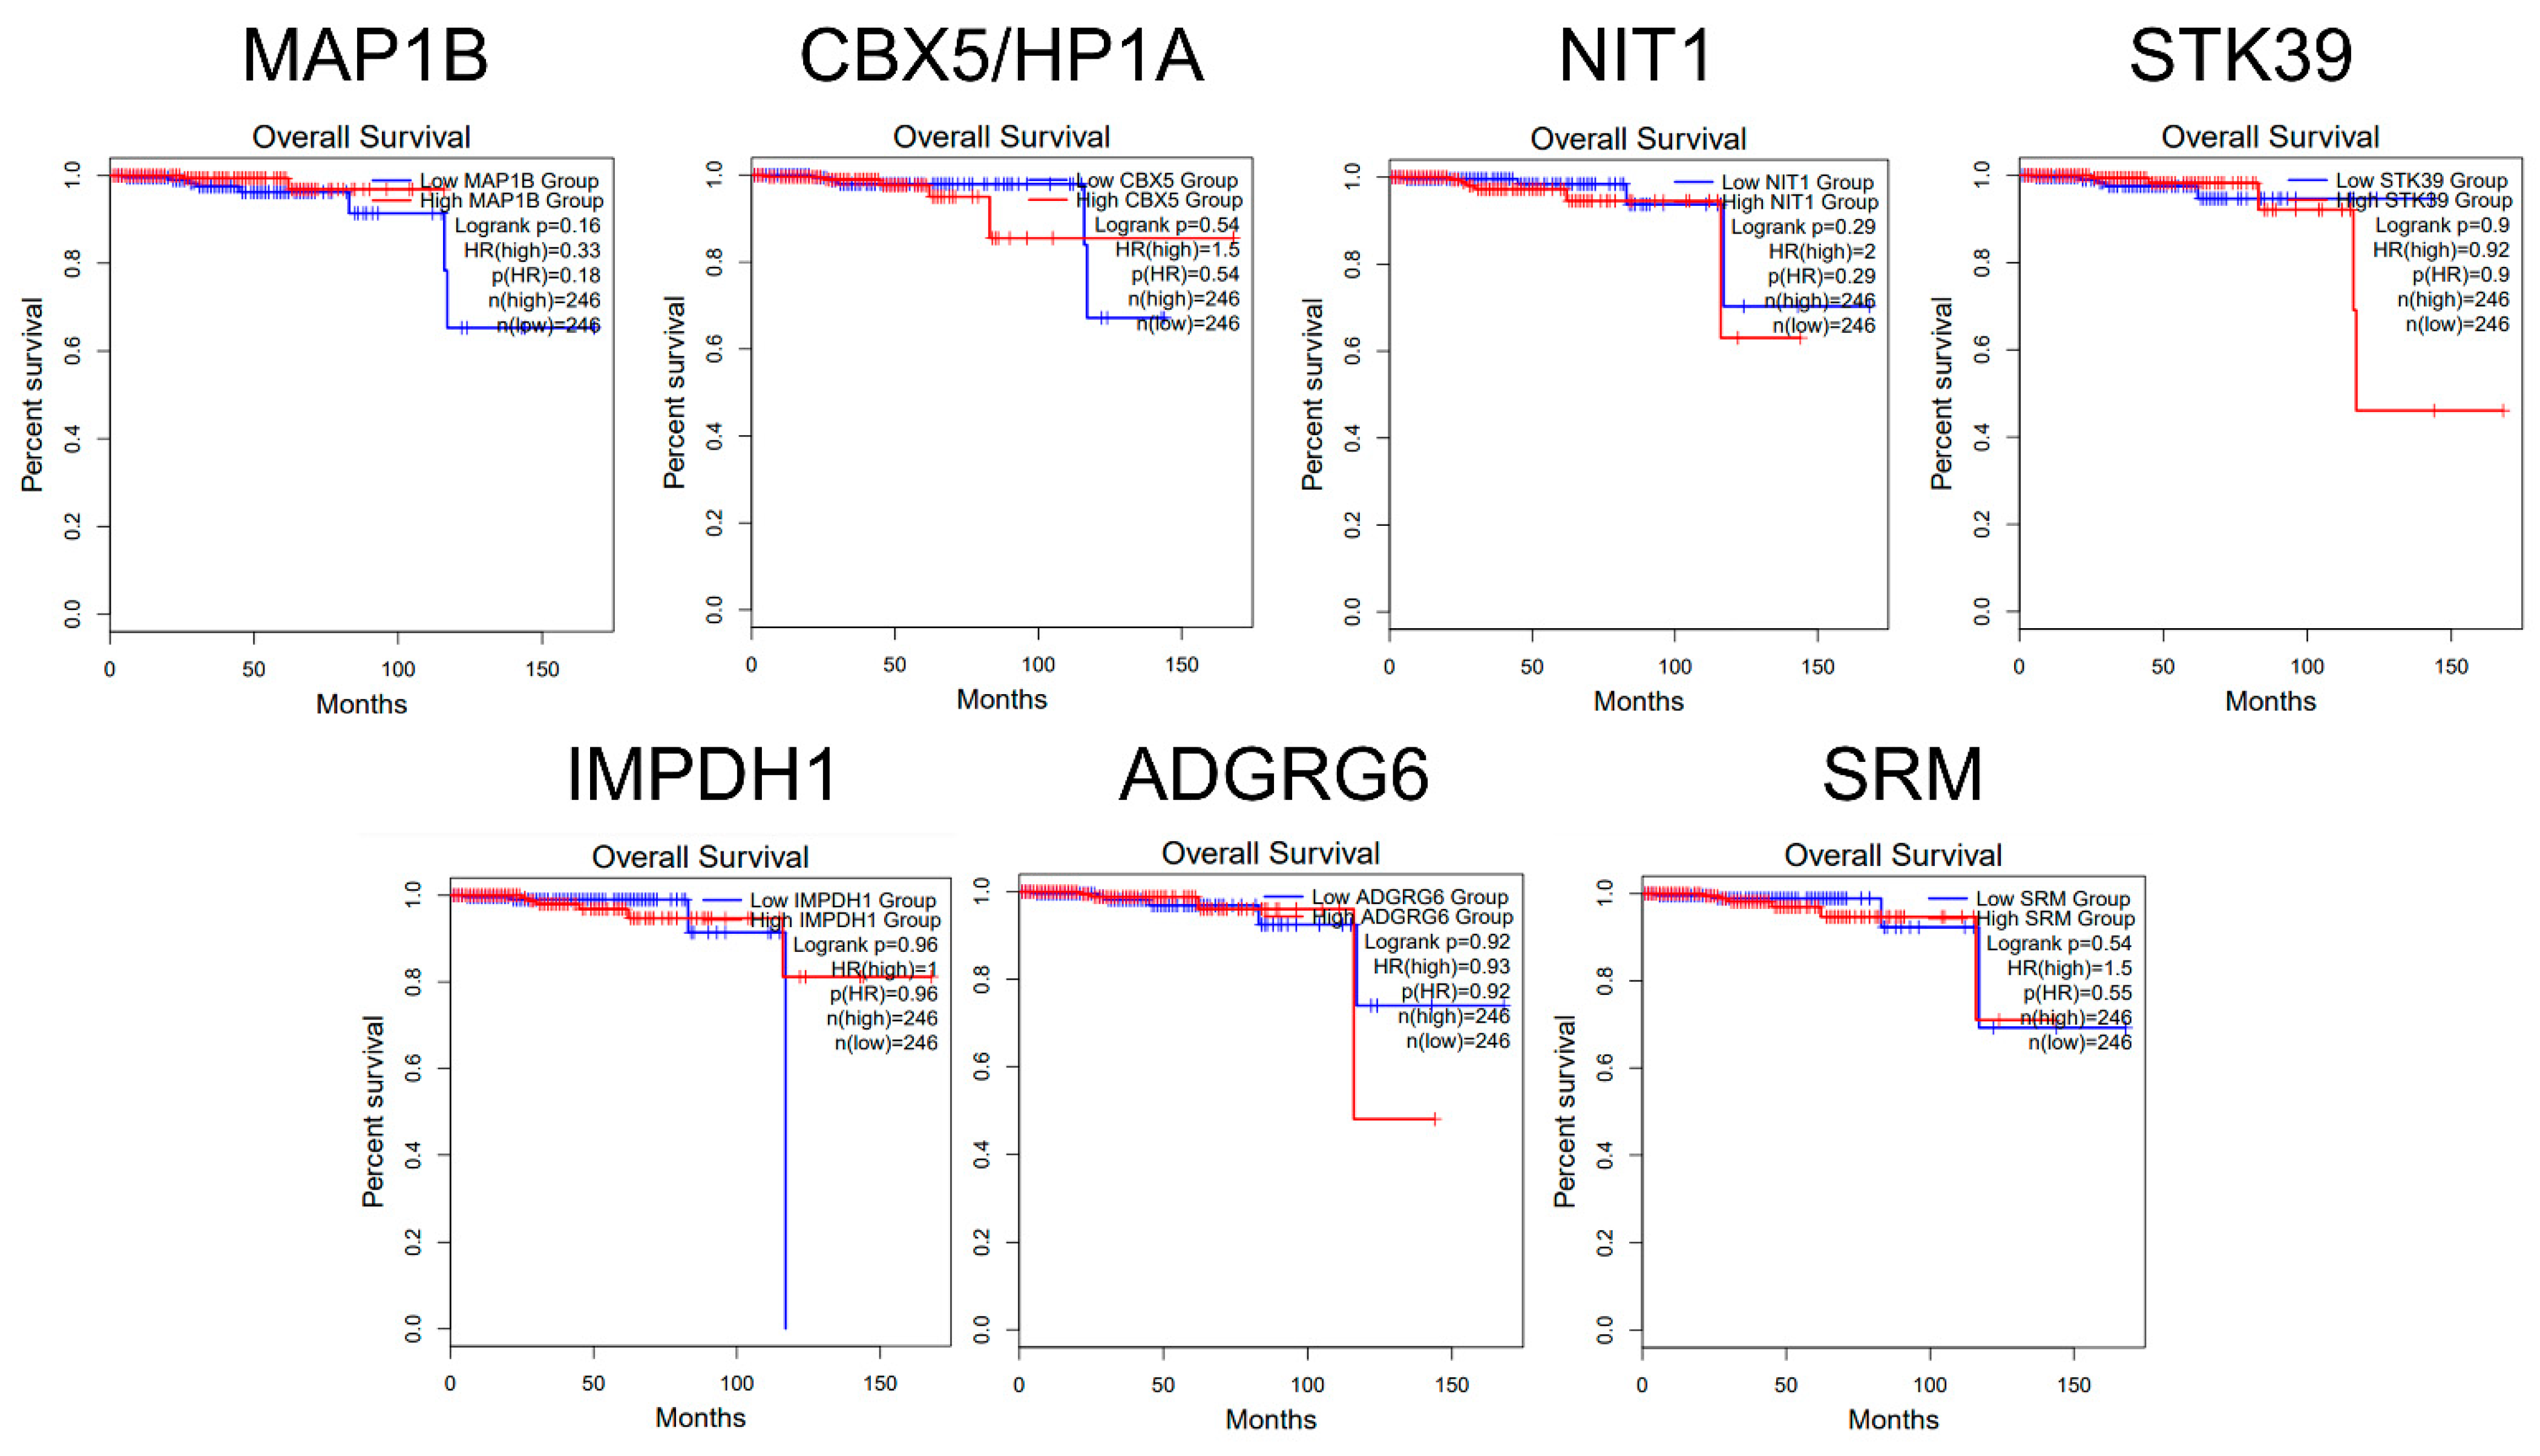
2.4. Overall Survival Analysis Based on the Expression of miR-423-5p Target Genes

To evaluate the clinical significance of the modulation of the miRNA targets in PCa, we conducted a Kaplan–Meier analysis of the overall survival using the GEPIA2 online tool [29]. Cohorts of 246 patients were assigned to low and high expression levels of mRNA for the targets found differentially expressed and no significant differences were detected in the overall survival for these targets (Figure 6).

3. Discussion

In the present manuscript, we investigated downstream pathways that are affected by miR-423-5p expression using mass-spectrometry analysis. We found that cellular metabolism, amino acid metabolism, and transcription are the main affected pathways. IDO1 (Indoleamine 2,3-dioxygenase-1) effect on T cell metabolism, glycolysis and gluconeogenesis, and histamine, glutathione, tyrosine, catecholamine, and ascorbate metabolisms, were the metabolic pathways affected by downregulated proteins. In these pathways, a decreased expression of G6PD, HX2, ALDH2, and LDHA was found. Other downregulated proteins are associated with immune response, including those related to Myeloid-derived suppressor cells and M2 macrophages in cancer, MIF-mediated glucocorticoid regulation, and MIF-JAB signaling. Upregulated proteins were mostly associated with cell metabolism, such as galactose metabolism, neolacto-series GSL (Glycosphingolipid) metabolism, peptidase activity, and the lysosomal pathway but also with clathrin vesicles formation, G-protein signaling, and the HP1 role in transcriptional silencing. miR-423-5p’s role in the regulation of metabolic pathways is still under-investigated. We provide for the first time, at least to our knowledge, that miR-423-5p regulates cellular metabolism in cancer cells. However, it was reported that miR-423-5p induces inhibition of neoglucogenesis, hyperglycemia, and liver deposition in an animal model of diabetes [31]. These data were confirmed in a model of gestational diabetes in which the repression of miR-423-5p ameliorated hepatic gluconeogenesis and insulin resistance [32]. G6PD, another target of miR-423-5p involved in the pentose phosphate pathway (PPP) and glucose metabolisms, was also downregulated in a model of preeclampsia and gestational hypertension [33]. In cancers, PPP has been upregulated if compared to normal counterparts becoming a possible target for therapy [34,35,36,37,38]. The involvement of G6PD in drug resistance in patients affected by acute myeloid leukemia was reported by Gregory et al. and, more recently, similar results were found in patients with multiple myeloma [39,40]. Interestingly, we have previously reported that G6PDH inhibition blocks proliferation and metastases of head and neck squamous cancer cells in vivo, and this effect was paralleled by enhanced autophagy [41,42]. These effects are in agreement with our findings about the involvement of miR-423-5p in the autophagic processes in hepatocellular cancer cell lines [43]. Conversely, no previous reports exist on the role of miR-423-5p in the regulation of amino acid metabolism. The HIF-1 pathway was also downregulated by miR-423-5p. This result is again in agreement with our previously reported findings on the anti-angiogenic effects of miR-423-5p in PCa cell lines [16]. In fact, in PCa cell lines, we have found a strong downregulation of both vascular endothelial growth factor (VEGF) B and C that are, in turn, induced by the HIF-1 pathway. It has also to be considered that miR-423-5p was reported to have pro-apoptotic effects in both cardiocytes and renal proximal tubular epithelial cells during hypoxia/reoxygenation, confirming its role in the regulation of cellular hypoxic homeostasis [44,45]. Although miR-423-5p involvement in the transcriptional silencing of HP1A is highly likely due to its post-transcriptional regulatory roles, its role in clathrin vesicle formation, and G-protein signaling, is not known, thus, requiring further investigations. We have also found an increase in the activity of lysosome formation. In this light, we have previously reported that the overexpression of miR-423-5p in hepatocellular cancer cells induced an increased activation of the autophagic process with the involvement of lysosome and the formation of abundant autophagic vacuoles [43]. Among the protein targets of miR-423-5p, we have found SPEE, which is involved in both amino acid metabolism and cancer [46]. In fact, spermidine has a role in the regulation of cancer cell proliferation and is involved in anti-cancer immune surveillance [46]. Other protein targets were MAP1B, CBX5, NIT1, STK39, IMDH1, and AGRG6. Interestingly, five out of the seven targets, namely, Micro-tubule-associated protein 1B (MAP1B), Chromobox protein homolog 5 (CBX5/HP1A), Inosine-5′-monophosphate dehydrogenase 1 (IMPDH1), Adhesion G-protein coupled receptor G6 (ADGRG6), and Spermidine synthase (SRM), are reported at different tissue levels, including cervix, kidney and bone marrow, at different experimental conditions. Integrating the results from the proteomic analysis in LNCaP cells and the gene expression profiling for the miR-423-5p targets in PRAD, we found that IMDPH1 and SRM showed an opposite trend at transcriptomic level, indicating that miR-423-5p could interact on these miTGs in PCa. Since we previously reported that the overexpression of miR-423-5p was able to inhibit MALAT1-mediated proliferation, migration, and invasion of PCa cells, we evaluated the clinical significance of miR-423-5p in the TCGA-PRAD dataset using the ENCORI Pan-Cancer analysis platform and no significant correlations between the expression level of miR-423-5p and prognosis in PRAD groups was detected [16]. Furthermore, the analysis of miTGs with GEPIA2 based on The Cancer Genome Atlas-Prostate Adenocarcinoma (TCGA-PRAD) and the Genotype-Tissue Expression (GTEx) project data demonstrated only for MAP1B a statistically significant higher expression in tumors if compared to normal counterpart in PCa patients. These results were likely due to the limited size of the samples analyzed and included in the publicly available dataset. There are no previous reports on MAP1B in PCa, but it was demonstrated to be associated with several processes in other cancers. MAPs are proteins that participate in the organization of cell cytoskeletons taking part in the microtubule assembly that is essential for the maintenance of cellular structure during cell division [47,48]. MAPs have been also correlated to microtubule dynamics required for cell motility and metastatization [49]. MAP1B was expressed to different extents in multiple cancers with a higher degree in central nervous system tumors and its levels were found to predict shorter survival and higher grade in urothelial cancers [50].

4. Materials and Methods

4.1. Cell Lines and Growth Conditions

LNCaP (ATCC® CRL-1740™), DU-145 (ATCC® HTB-81™) and PC-3 (ATCC® CRL-1435™) PCa cell lines were purchased from ATCC as previously reported [16]. LNCaP cells were cultured in RPMI-1640 (11530586, Gibco Life Technologies, Carlsbad, CA, USA), DU-145 cells in EMEM (BE12-6621, Lonza, Basel, Switzerland) and PC-3 cells in F-12 k Nut Mix (1×) (21127-022, Gibco Life Technologies, Carlsbad, CA, USA). The media were supplemented with 10% (v/v) foetal calf serum (FCS) and 1% (w/v) L-glutamine (Lonza, Basel, Switzerland). Cells were incubated at 37 °C in 5% (v/v) CO2 and 100% (v/v) humidity.

4.2. Reverse Transcription Quantitative Real-Time PCR (RT-qPCR)

RNA was extracted from PC-3, DU-145 and LNCaP PCa cell lines using RNeasy Mini Kit (74106, Qiagen, Hilden, Germany) according to the manufacturer protocol. TaqMan Micro RNA Reverse Transcription Kit (4366596, Applied Biosystems, Waltham, MA, USA) was used to obtain cDNA using specific reverse transcription primers for miR-423-5p and U6 as housekeeping gene (4427975, Applied Biosystems, Waltham, MA, USA). RT-qPCR was performed using TaqMan Universal PCR Master Mix (4304437, Applied Biosystems, Waltham, MA, USA) and specific qPCR primers for miR-423-5p and U6 (4427975, Applied Biosystems, Waltham, MA, USA) were used. The results were analyzed using 2–∆∆Ct method and data are shown as mean ± SD.

4.3. Retroviral Expression of Empty Vector and miR-423-5p-Mimic

LNCaP PCa cells were seeded in a 96-well plate, 35,000 cells/well, and treated with Sh MIMIC Lenti miR-423-5p lentiviral particles (V1SMHS_000254, GE Healthcare Dharmacon, Lafayette, CO, USA) at 2.5, 5, 10, and 20 MOI. Control empty backbone cells were obtained using lentiviral particles generated from the pLKO.1 Empty plasmid (MISSION® pLKO.1-puro Empty Vector Control Plasmid DNA, SHC001, Sigma Aldrich, St. Louis, MO, USA). Hexadimethrine Bromide (H9268-5G, Sigma Aldrich, St. Louis, MO, USA) was used in complete growth media for each cell line to facilitate the infection. After 16 h incubation, infection media was removed and replaced with complete growth medium for each cell line. Puromycin (Invivogen, San Diego, CA, USA) was then added to each cell’s complete growth medium at a final concentration of 1 µg/mL for the selection. The lentiviral particles used to infect LNCaP were produced according to the manufacturer’s recommendations. The lentiviral packaging mix was purchased from Sigma (MISSION® Lentiviral Packaging Mix, SHP001, Sigma Aldrich, St. Louis, MO, USA). MOI of 5 was selected for the following experiments.

4.4. Liquid Chromatography with Tandem Mass Spectrometry (LC-MS/MS) Analysis

Samples (~50 µg protein) were reduced/alkylated and digested as described previously [51]. Then, samples were dried and resuspended in 5% (v/v) acetonitrile + 0.1% (v/v) formic acid and transferred to an HPLC vial for MS analysis in both SWATH (Sequential Window Acquisition of all Theoretical Mass Spectra) and IDA (information-dependent acquisition) modes. Each sample was analyzed on a SCIEX TripleTof 6600 mass spectrometer coupled in line with an Eksigent ekspert nano LC 425 system running in microflow as described previously with minor modifications [52]. For IDA (Information-Dependent Analysis) to generate a spectral library, 8 μL of pooled sample in triplicate were injected by autosampler (Eksigent nanoLC 425 LC system, Dublin, OH, USA) in microflow at 5 μL/min directly onto a YMC Triart-C18 column (15 cm, 3 μm, 300 μm i.d.) using gradient elution (2–40% Mobile phase B, followed by washing at 80% B and re-equilibration) over 87 min. For SWATH/DIA (Data-Independent Analysis), 3 μL was injected on the same gradient elution profile over 57 min. Mobile phases consisted of A: 0.1% formic acid; B: acetonitrile containing 0.1% (v/v) formic acid. IDA analysis was carried out in positive ion mode with a 250 ms survey scan, m/z range 400–1250; Top 30 peaks selected for fragmentation, accumulation time 50 ms per experiment, cycle time 1.8 s. SWATH analysis used 100 variable windows, 25 ms per window, 100–1500 m/z using the SCIEX Duospray source with a 50 μm electrode at 5500 V.

4.5. Library Generation, Spectral Alignment, and Fold Change Analysis

Spectral libraries were constructed from three IDA runs of pooled samples spiked with HRM-kit retention time peptides (iRT, Biognosys AG, Schlieren, Switzerland), searched using ProteinPilot 5.0 (SCIEX, Macclesfield, UK) against the Swissprot human database (January 2016). The resulting ion library file was aligned against the iRT peptides, and the SWATH data was obtained using the OneOmics cloud processing platform (SCIEX, Warrington, UK) with the following parameters: six peptides per protein, six transitions per peptide, XIC width set at 75 ppm, 5 min extraction window. Analysis of six biological replicates per group was carried out in Protein Expression Workflow within OneOmics to identify significantly differentially expressed proteins, and a 75% confidence limit and a minimum of two peptides per protein were used as criteria for assessing fold change. Differentially expressed proteins (DEPs) were defined as downregulated if fold change (FC) ≤ −1.5. and upregulated if fold change (FC) ≥ 1.5.

4.6. Bioinformatic Analysis

The pathway enrichment analysis on proteomics data was performed using METACORE (version 6.34.69200, Clarivate Analytics, London, UK), available online: https://portal.genego.com (accessed on 11 April 2018). Protein–protein interaction (PPI) network analysis was performed with the search tool for retrieval of interacting genes/proteins database (STRING, version V11.0), available online: http://stringdb.org (accessed on 19 October 2022). Medium confidence was applied for the analysis and the Markov Cluster Algorithm (MCA) performed to extract clusters of densely connected nodes from biological networks.
Target prediction analysis of miRNA hsa-miR-423-5p was performed using four different prediction tools: DIANA microT-CDS Version 5.0, available online: https://dianalab.e-ce.uth.gr/html/dianauniverse/index.php?r=microT_CDS (accessed on 25 September 2022), TargetScan_Human Release v8.0, available online: https://www.targetscan.org/vert_80/ (accessed on 25 September 2022), mirDIP Release v4.1, available online: https://ophid.utoronto.ca/mirDIP/ (accessed on 25 September 2022), mirDB Version v6.0, available online: http://mirdb.org/ (accessed on 25 September 2022) [18,19,20,21]. Targets predicted by two or more prediction tools were selected for further analysis.
Venny v2.1 software tool, available online: https://bioinfogp.cnb.csic.es/tools/venny/ (accessed on 25 September 2022) was used to identify common targets between the prediction analysis and proteomic analysis.
Database of experimentally supported miRNA–gene interaction tool DIANA TarBase Version 8.0, available online: https://dianalab.e-ce.uth.gr/html/diana/web/index.php?r=tarbasev8/index (accessed on 25 September 2022) was used to study known interaction between hsa-miR-423-5p and validated target proteins in existing PCa studies [22]. Expression Atlas Release 38, available online: https://www.ebi.ac.uk/gxa/home (accessed on 26 September 2022), and GEPIA2, available online: http://gepia2.cancer-pku.cn/#index (accessed on 26 September 2022) were used to study the expression pattern of validated proteins and miTGs in existing PCa studies [28,29].
Gene expression profiles of miTGs were generated using GEPIA2 with the following parameters: |Log2FC| Cutoff: 1, p-value Cutoff: 0.01, log scale: log2(TPM + 1) matching TCGA normal and GTEx data.
Overall Survival plots were obtained using the “Survival Analysis” module of GEPIA2 with default parameters including a 95% confidence interval, “Median” Group cut off and Hazard Ratio (calculated based on the Cox PH model) using both the TCGA-PRAD and GTEx prostate datasets.
To correlate miR-423-5p expression levels with overall survival in PCa, “Pan-Cancer” module of RNA Interactome - ENCORI (The Encyclopedia of RNA Interactomes) v2.0 platform was used. Available online: https://starbase.sysu.edu.cn/ (accessed on 19 December 2022).

5. Conclusions

In conclusion, our data indicate that miR-423-5p could induce a metabolic switch inhibiting essential energetic processes such as glycolysis and interfering with the biosynthetic amino acidic pathways in PCa cells. These effects are paralleled by the interference with angiogenetic processes as previously reported by us in PCa cells and in agreement with our previous reports on the autophagic pathway activation mediated by miR-423-5p in other cancer models. Further in vitro and in vivo experiments are needed in order to validate the identified miR-423-5-p targets. These data can open a scenario of intervention based on targeting of the newly identified miR-423-5p interactors.

Supplementary Materials

The following supporting information can be downloaded at: https://www.mdpi.com/article/10.3390/ijms24010617/s1.

Author Contributions

Conceptualization, S.Z., V.D., T.R. and M.C.; validation, A.K.M. and D.J.B.; formal analysis, M.S.T., A.K.M. and D.J.B.; investigation, A.L. (Amalia Luce), C.F. and M.S.T.; resources, T.R. and M.C.; data curation, C.F., A.K.M., D.J.B. and J.V.; writing—original draft preparation, A.L. (Amalia Luce), C.F., M.S.T. and M.C.; writing—review and editing, A.L. (Angela Lombardi), S.Z., M.B., R.A., R.S., L.S. and S.N.; visualization, A.L. (Amalia Luce), C.F., M.S.T., A.K.M., A.R. and M.B.; supervision, S.Z., V.D., T.R. and M.C.; project administration, V.D., T.R. and M.C.; funding acquisition, T.R. and M.C. All authors have read and agreed to the published version of the manuscript.

Funding

This research was funded by the Italian Association for Cancer Research (AIRC)-IG 20711 (to M.C.).

Institutional Review Board Statement

Not applicable.

Informed Consent Statement

Not applicable.

Data Availability Statement

Proteomics data presented in this study have been provided as a Supplementary Table (Table S1). Bioinformatic data analyzed in this study are publicly available.

Conflicts of Interest

The funder had no role in the design, execution, interpretation, or writing of the study.

References

  1. Siegel, R.L.; Miller, K.D.; Fuchs, H.E.; Jemal, A. Cancer statistics, 2022. CA Cancer J. Clin. 2022, 72, 7–33. [Google Scholar] [CrossRef] [PubMed]
  2. Dyba, T.; Randi, G.; Bray, F.; Martos, C.; Giusti, F.; Nicholson, N.; Gavin, A.; Flego, M.; Neamtiu, L.; Dimitrova, N.; et al. The European cancer burden in 2020: Incidence and mortality estimates for 40 countries and 25 major cancers. Eur. J. Cancer 2021, 157, 308–347. [Google Scholar] [CrossRef] [PubMed]
  3. Asif, S.; Teply, B.A. Biomarkers for Treatment Response in Advanced Prostate Cancer. Cancers 2021, 13, 5723. [Google Scholar] [CrossRef] [PubMed]
  4. Calin, G.A.; Croce, C.M. MicroRNA Signatures in Human Cancers. Nat. Rev. Cancer 2006, 6, 857–866. [Google Scholar] [CrossRef]
  5. Peng, Y.; Croce, C.M. The role of MicroRNAs in human cancer. Signal Transduct. Target. Ther. 2016, 1, 15004. [Google Scholar] [CrossRef] [Green Version]
  6. He, B.; Zhao, Z.; Cai, Q.; Zhang, Y.; Zhang, P.; Shi, S.; Xie, H.; Peng, X.; Yin, W.; Tao, Y.; et al. miRNA-based biomarkers, therapies, and resistance in Cancer. Int. J. Biol. Sci. 2020, 16, 2628–2647. [Google Scholar] [CrossRef]
  7. Vanacore, D.; Boccellino, M.; Rossetti, S.; Cavaliere, C.; D’Aniello, C.; Di Franco, R.; Romano, F.J.; Montanari, M.; La Mantia, E.; Piscitelli, R.; et al. Micrornas in prostate cancer: An overview. Oncotarget 2017, 8, 50240–50251. [Google Scholar] [CrossRef] [Green Version]
  8. Luu, H.N.; Lin, H.-Y.; Sørensen, K.D.; Ogunwobi, O.O.; Kumar, N.; Chornokur, G.; Phelan, C.; Jones, D.; Kidd, L.; Batra, J.; et al. miRNAs associated with prostate cancer risk and progression. BMC Urol. 2017, 17, 18. [Google Scholar] [CrossRef] [Green Version]
  9. Huang, Y.; Feng, G. MiR-423-5p aggravates lung adenocarcinoma via targeting CADM1. Thorac. Cancer 2020, 12, 210–217. [Google Scholar] [CrossRef]
  10. Sun, G.; Ding, X.; Bi, N.; Wu, L.; Wang, J.; Zhang, W.; Dong, X.; Lv, N.; Song, Y.; Zhan, Q.; et al. MiR-423-5p in brain metastasis: Potential role in diagnostics and molecular biology. Cell Death Dis. 2018, 9, 936. [Google Scholar] [CrossRef]
  11. Li, S.; Zeng, A.; Hu, Q.; Yan, W.; Liu, Y.; You, Y. miR-423-5p contributes to a malignant phenotype and temozolomide chemoresistance in glioblastomas. Neuro-Oncology 2016, 19, 55–65. [Google Scholar] [CrossRef] [PubMed] [Green Version]
  12. Liu, J.; Wang, X.; Yang, X.; Liu, Y.; Shi, Y.; Ren, J.; Guleng, B. miRNA423-5p regulates cell proliferation and invasion by targeting trefoil factor 1 in gastric cancer cells. Cancer Lett. 2014, 347, 98–104. [Google Scholar] [CrossRef] [PubMed]
  13. Li, H.; Xue, S.; Zhang, X.; Li, F.; Bei, S.; Feng, L. CircRNA PVT1 modulated cell migration and invasion through Epithelial-Mesenchymal Transition (EMT) mediation in gastric cancer through miR-423-5p/Smad3 pathway. Regen. Ther. 2022, 21, 25–33. [Google Scholar] [CrossRef] [PubMed]
  14. Tang, X.; Zeng, X.; Huang, Y.; Chen, S.; Lin, F.; Yang, G.; Yang, N. miR-423-5p serves as a diagnostic indicator and inhibits the proliferation and invasion of ovarian cancer. Exp. Ther. Med. 2018, 15, 4723–4730. [Google Scholar] [CrossRef] [Green Version]
  15. Jia, W.; Yu, T.; An, Q.; Cao, X.; Pan, H. MicroRNA-423-5p inhibits colon cancer growth by promoting caspase-dependent apoptosis. Exp. Ther. Med. 2018, 16, 1225–1231. [Google Scholar] [CrossRef] [Green Version]
  16. Ferri, C.; Di Biase, A.; Bocchetti, M.; Zappavigna, S.; Wagner, S.; Le Vu, P.; Luce, A.; Cossu, A.M.; Vadakekolathu, J.; Miles, A.; et al. MiR-423-5p prevents MALAT1-mediated proliferation and metastasis in prostate cancer. J. Exp. Clin. Cancer Res. 2022, 41, 20. [Google Scholar] [CrossRef]
  17. Szklarczyk, D.; Gable, A.L.; Lyon, D.; Junge, A.; Wyder, S.; Huerta-Cepas, J.; Simonovic, M.; Doncheva, N.T.; Morris, J.H.; Bork, P.; et al. STRING v11: Protein–protein association networks with increased coverage, supporting functional discovery in genome-wide experimental datasets. Nucleic Acids Res. 2019, 47, D607–D613. [Google Scholar] [CrossRef] [Green Version]
  18. Paraskevopoulou, M.D.; Georgakilas, G.; Kostoulas, N.; Vlachos, I.S.; Vergoulis, T.; Reczko, M.; Filippidis, C.; Dalamagas, T.; Hatzigeorgiou, A.G. DIANA-microT web server v5.0: Service integration into miRNA functional analysis workflows. Nucleic Acids Res. 2013, 41, W169–W173. [Google Scholar] [CrossRef] [Green Version]
  19. McGeary, S.E.; Lin, K.S.; Shi, C.Y.; Pham, T.M.; Bisaria, N.; Kelley, G.M.; Bartel, D.P. The biochemical basis of microRNA targeting efficacy. Science 2019, 366, eaav1741. [Google Scholar] [CrossRef]
  20. Tokar, T.; Pastrello, C.; Rossos, A.E.M.; Abovsky, M.; Hauschild, A.-C.; Tsay, M.; Lu, R.; Jurisica, I. mirDIP 4.1—Integrative database of human microRNA target predictions. Nucleic Acids Res. 2017, 46, D360–D370. [Google Scholar] [CrossRef]
  21. Chen, Y.; Wang, X. miRDB: An online database for prediction of functional microRNA targets. Nucleic Acids Res. 2019, 48, D127–D131. [Google Scholar] [CrossRef] [PubMed] [Green Version]
  22. Karagkouni, D.; Paraskevopoulou, M.D.; Chatzopoulos, S.; Vlachos, I.S.; Tastsoglou, S.; Kanellos, I.; Papadimitriou, D.; Kavakiotis, I.; Maniou, S.; Skoufos, G.; et al. DIANA-TarBase v8: A decade-long collection of experimentally supported miRNA–gene interactions. Nucleic Acids Res. 2017, 46, D239–D245. [Google Scholar] [CrossRef] [PubMed] [Green Version]
  23. Balakrishnan, I.; Yang, X.; Brown, J.; Ramakrishnan, A.; Torok-Storb, B.; Kabos, P.; Hesselberth, J.R.; Pillai, M.M. Genome-Wide Analysis of miRNA-mRNA Interactions in Marrow Stromal Cells. Stem Cells 2013, 32, 662–673. [Google Scholar] [CrossRef] [PubMed] [Green Version]
  24. Karginov, F.V.; Hannon, G.J. Remodeling of Ago2–mRNA interactions upon cellular stress reflects miRNA complementarity and correlates with altered translation rates. Genes Dev. 2013, 27, 1624–1632. [Google Scholar] [CrossRef] [Green Version]
  25. Whisnant, A.; Bogerd, H.P.; Flores, O.; Ho, P.; Powers, J.G.; Sharova, N.; Stevenson, M.; Chen, C.-H.; Cullen, B.R. In-Depth Analysis of the Interaction of HIV-1 with Cellular microRNA Biogenesis and Effector Mechanisms. mBio 2013, 4, e00193-13. [Google Scholar] [CrossRef] [Green Version]
  26. Haecker, I.; Gay, L.A.; Yang, Y.; Hu, J.; Morse, A.M.; McIntyre, L.M.; Renne, R. Ago HITS-CLIP Expands Understanding of Kaposi’s Sarcoma-associated Herpesvirus miRNA Function in Primary Effusion Lymphomas. PLoS Pathog. 2012, 8, e1002884. [Google Scholar] [CrossRef] [Green Version]
  27. Xue, Y.; Ouyang, K.; Huang, J.; Zhou, Y.; Ouyang, H.; Li, H.; Wang, G.; Wu, Q.; Wei, C.; Bi, Y.; et al. Direct Conversion of Fibroblasts to Neurons by Reprogramming PTB-Regulated MicroRNA Circuits. Cell 2013, 152, 82–96. [Google Scholar] [CrossRef] [Green Version]
  28. Papatheodorou, I.; Fonseca, N.A.; Keays, M.; Tang, A.; Barrera, E.; Bazant, W.; Burke, M.; Füllgrabe, A.; Fuentes, A.M.-P.; George, N.; et al. Expression Atlas: Gene and protein expression across multiple studies and organisms. Nucleic Acids Res. 2017, 46, D246–D251. [Google Scholar] [CrossRef]
  29. Tang, Z.; Kang, B.; Li, C.; Chen, T.; Zhang, Z. GEPIA2: An enhanced web server for large-scale expression profiling and interactive analysis. Nucleic Acids Res. 2019, 47, W556–W560. [Google Scholar] [CrossRef] [Green Version]
  30. Li, J.-H.; Liu, S.; Zhou, H.; Qu, L.-H.; Yang, J.-H. starBase v2.0: Decoding miRNA-ceRNA, miRNA-ncRNA and protein–RNA interaction networks from large-scale CLIP-Seq data. Nucleic Acids Res. 2013, 42, D92–D97. [Google Scholar] [CrossRef]
  31. Yang, W.; Wang, J.; Chen, Z.; Chen, J.; Meng, Y.; Chen, L.; Chang, Y.; Geng, B.; Sun, L.; Dou, L.; et al. NFE2 Induces miR-423-5p to Promote Gluconeogenesis and Hyperglycemia by Repressing the Hepatic FAM3A-ATP-Akt Pathway. Diabetes 2017, 66, 1819–1832. [Google Scholar] [CrossRef] [PubMed] [Green Version]
  32. Ye, Z.; Wang, S.; Huang, X.; Chen, P.; Deng, L.; Li, S.; Lin, S.; Wang, Z.; Liu, B. Plasma exosomal microRNAs Associated with Metabolism as Early Predictor of Gestational Diabetes Mellitus. Diabetes 2022, 71, 2272–2283. [Google Scholar] [CrossRef] [PubMed]
  33. Bin Yu, B.; Zhu, H.-D.; Shi, X.-L.; Chen, P.-P.; Sun, X.-M.; Xia, G.-Y.; Fang, M.; Zhong, Y.-X.; Tang, X.-L.; Zhang, T.; et al. iTRAQ-based quantitative proteomic analysis of thoracic aortas from adult rats born to preeclamptic dams. Clin. Proteom. 2021, 18, 22. [Google Scholar] [CrossRef]
  34. Patra, K.C.; Hay, N. The pentose phosphate pathway and cancer. Trends Biochem. Sci. 2014, 39, 347–354. [Google Scholar] [CrossRef] [Green Version]
  35. Lin, R.; Elf, S.; Shan, C.; Kang, H.-B.; Ji, Q.; Zhou, L.; Hitosugi, T.; Zhang, L.; Zhang, S.; Seo, J.H.; et al. 6-Phosphogluconate dehydrogenase links oxidative PPP, lipogenesis and tumour growth by inhibiting LKB1–AMPK signalling. Nature 2015, 17, 1484–1496. [Google Scholar] [CrossRef] [Green Version]
  36. Jiang, P.; Du, W.; Yang, X. A critical role of glucose-6-phosphate dehydrogenase in TAp73-mediated cell proliferation. Cell Cycle 2013, 12, 3720–3726. [Google Scholar] [CrossRef] [Green Version]
  37. Jones, N.P.; Schulze, A. Targeting cancer metabolism—Aiming at a tumour’s sweet-spot. Drug Discov. Today 2012, 17, 232–241. [Google Scholar] [CrossRef]
  38. Pavlova, N.N.; Thompson, C.B. The Emerging Hallmarks of Cancer Metabolism. Cell Metab. 2016, 23, 27–47. [Google Scholar] [CrossRef] [Green Version]
  39. Gregory, M.A.; D’Alessandro, A.; Alvarez-Calderon, F.; Kim, J.; Nemkov, T.; Adane, B.; Rozhok, A.I.; Kumar, A.; Kumar, V.; Pollyea, D.A.; et al. ATM/G6PD-driven redox metabolism promotes FLT3 inhibitor resistance in acute myeloid leukemia. Proc. Natl. Acad. Sci. USA 2016, 113, E6669–E6678. [Google Scholar] [CrossRef] [Green Version]
  40. Li, R.; Ke, M.; Qi, M.; Han, Z.; Cao, Y.; Deng, Z.; Qian, J.; Yang, Y.; Gu, C. G6PD promotes cell proliferation and dexamethasone resistance in multiple myeloma via increasing anti-oxidant production and activating Wnt/β-catenin pathway. Exp. Hematol. Oncol. 2022, 11, 77. [Google Scholar] [CrossRef]
  41. Mele, L.; Paino, F.; Papaccio, F.; Regad, T.; Boocock, D.; Stiuso, P.; Lombardi, A.; Liccardo, D.; Aquino, G.; Barbieri, A.; et al. A new inhibitor of glucose-6-phosphate dehydrogenase blocks pentose phosphate pathway and suppresses malignant proliferation and metastasis in vivo. Cell Death Dis. 2018, 9, 572. [Google Scholar] [CrossRef] [PubMed] [Green Version]
  42. Mele, L.; la Noce, M.; Paino, F.; Regad, T.; Wagner, S.; Liccardo, D.; Papaccio, G.; Lombardi, A.; Caraglia, M.; Tirino, V.; et al. Glucose-6-phosphate dehydrogenase blockade potentiates tyrosine kinase inhibitor effect on breast cancer cells through autophagy perturbation. J. Exp. Clin. Cancer Res. 2019, 38, 160. [Google Scholar] [CrossRef] [PubMed] [Green Version]
  43. Stiuso, P.; Potenza, N.; Lombardi, A.; Ferrandino, I.; Monaco, A.; Zappavigna, S.; Vanacore, D.; Mosca, N.; Castiello, F.; Porto, S.; et al. MicroRNA-423-5p Promotes Autophagy in Cancer Cells and Is Increased in Serum From Hepatocarcinoma Patients Treated with Sorafenib. Mol. Ther. Nucleic Acids 2015, 4, e233. [Google Scholar] [CrossRef]
  44. Zhu, X.; Lu, X. MiR-423-5p inhibition alleviates cardiomyocyte apoptosis and mitochondrial dysfunction caused by hypoxia/reoxygenation through activation of the wnt/β-catenin signaling pathway via targeting MYBL2. J. Cell. Physiol. 2019, 234, 22034–22043. [Google Scholar] [CrossRef] [PubMed]
  45. Yuan, X.-P.; Liu, L.-S.; Chen, C.-B.; Zhou, J.; Zheng, Y.-T.; Wang, X.-P.; Han, M.; Wang, C.-X. MicroRNA-423-5p facilitates hypoxia/reoxygenation-induced apoptosis in renal proximal tubular epithelial cells by targeting GSTM1 via endoplasmic reticulum stress. Oncotarget 2017, 8, 82064–82077. [Google Scholar] [CrossRef] [PubMed] [Green Version]
  46. Holbert, C.E.; Cullen, M.T.; Casero, R.A.; Stewart, T.M. Polyamines in cancer: Integrating organismal metabolism and antitumour immunity. Nat. Rev. Cancer 2022, 22, 467–480. [Google Scholar] [CrossRef]
  47. Halpain, S.; Dehmelt, L. The MAP1 family of microtubule-associated proteins. Genome Biol. 2006, 7, 224. [Google Scholar] [CrossRef]
  48. Dehmelt, L.; Halpain, S. The MAP2/Tau family of microtubule-associated proteins. Genome Biol. 2004, 6, 204. [Google Scholar] [CrossRef] [Green Version]
  49. Bhat, K.M.; Setaluri, V. Microtubule-Associated Proteins as Targets in Cancer Chemotherapy. Clin. Cancer Res. 2007, 13, 2849–2854. [Google Scholar] [CrossRef] [Green Version]
  50. Chien, T.-M.; Chan, T.-C.; Huang, S.K.-H.; Yeh, B.-W.; Li, W.-M.; Huang, C.-N.; Li, C.-C.; Wu, W.-J.; Li, C.-F. Role of Microtubule-Associated Protein 1b in Urothelial Carcinoma: Overexpression Predicts Poor Prognosis. Cancers 2020, 12, 630. [Google Scholar] [CrossRef]
  51. Balahmar, R.M.; Boocock, D.J.; Coveney, C.; Ray, S.; Vadakekolathu, J.; Regad, T.; Ali, S.; Sivasubramaniam, S. Identification and characterisation of NANOG+/ OCT-4high/SOX2+ doxorubicin-resistant stem-like cells from transformed trophoblastic cell lines. Oncotarget 2018, 9, 7054–7065. [Google Scholar] [CrossRef] [PubMed]
  52. Vyas, F.S.; Hargreaves, A.J.; Bonner, P.L.; Boocock, D.J.; Coveney, C.; Dickenson, J.M. A1 adenosine receptor-induced phosphorylation and modulation of transglutaminase 2 activity in H9c2 cells: A role in cell survival. Biochem. Pharmacol. 2016, 107, 41–58. [Google Scholar] [CrossRef] [PubMed]
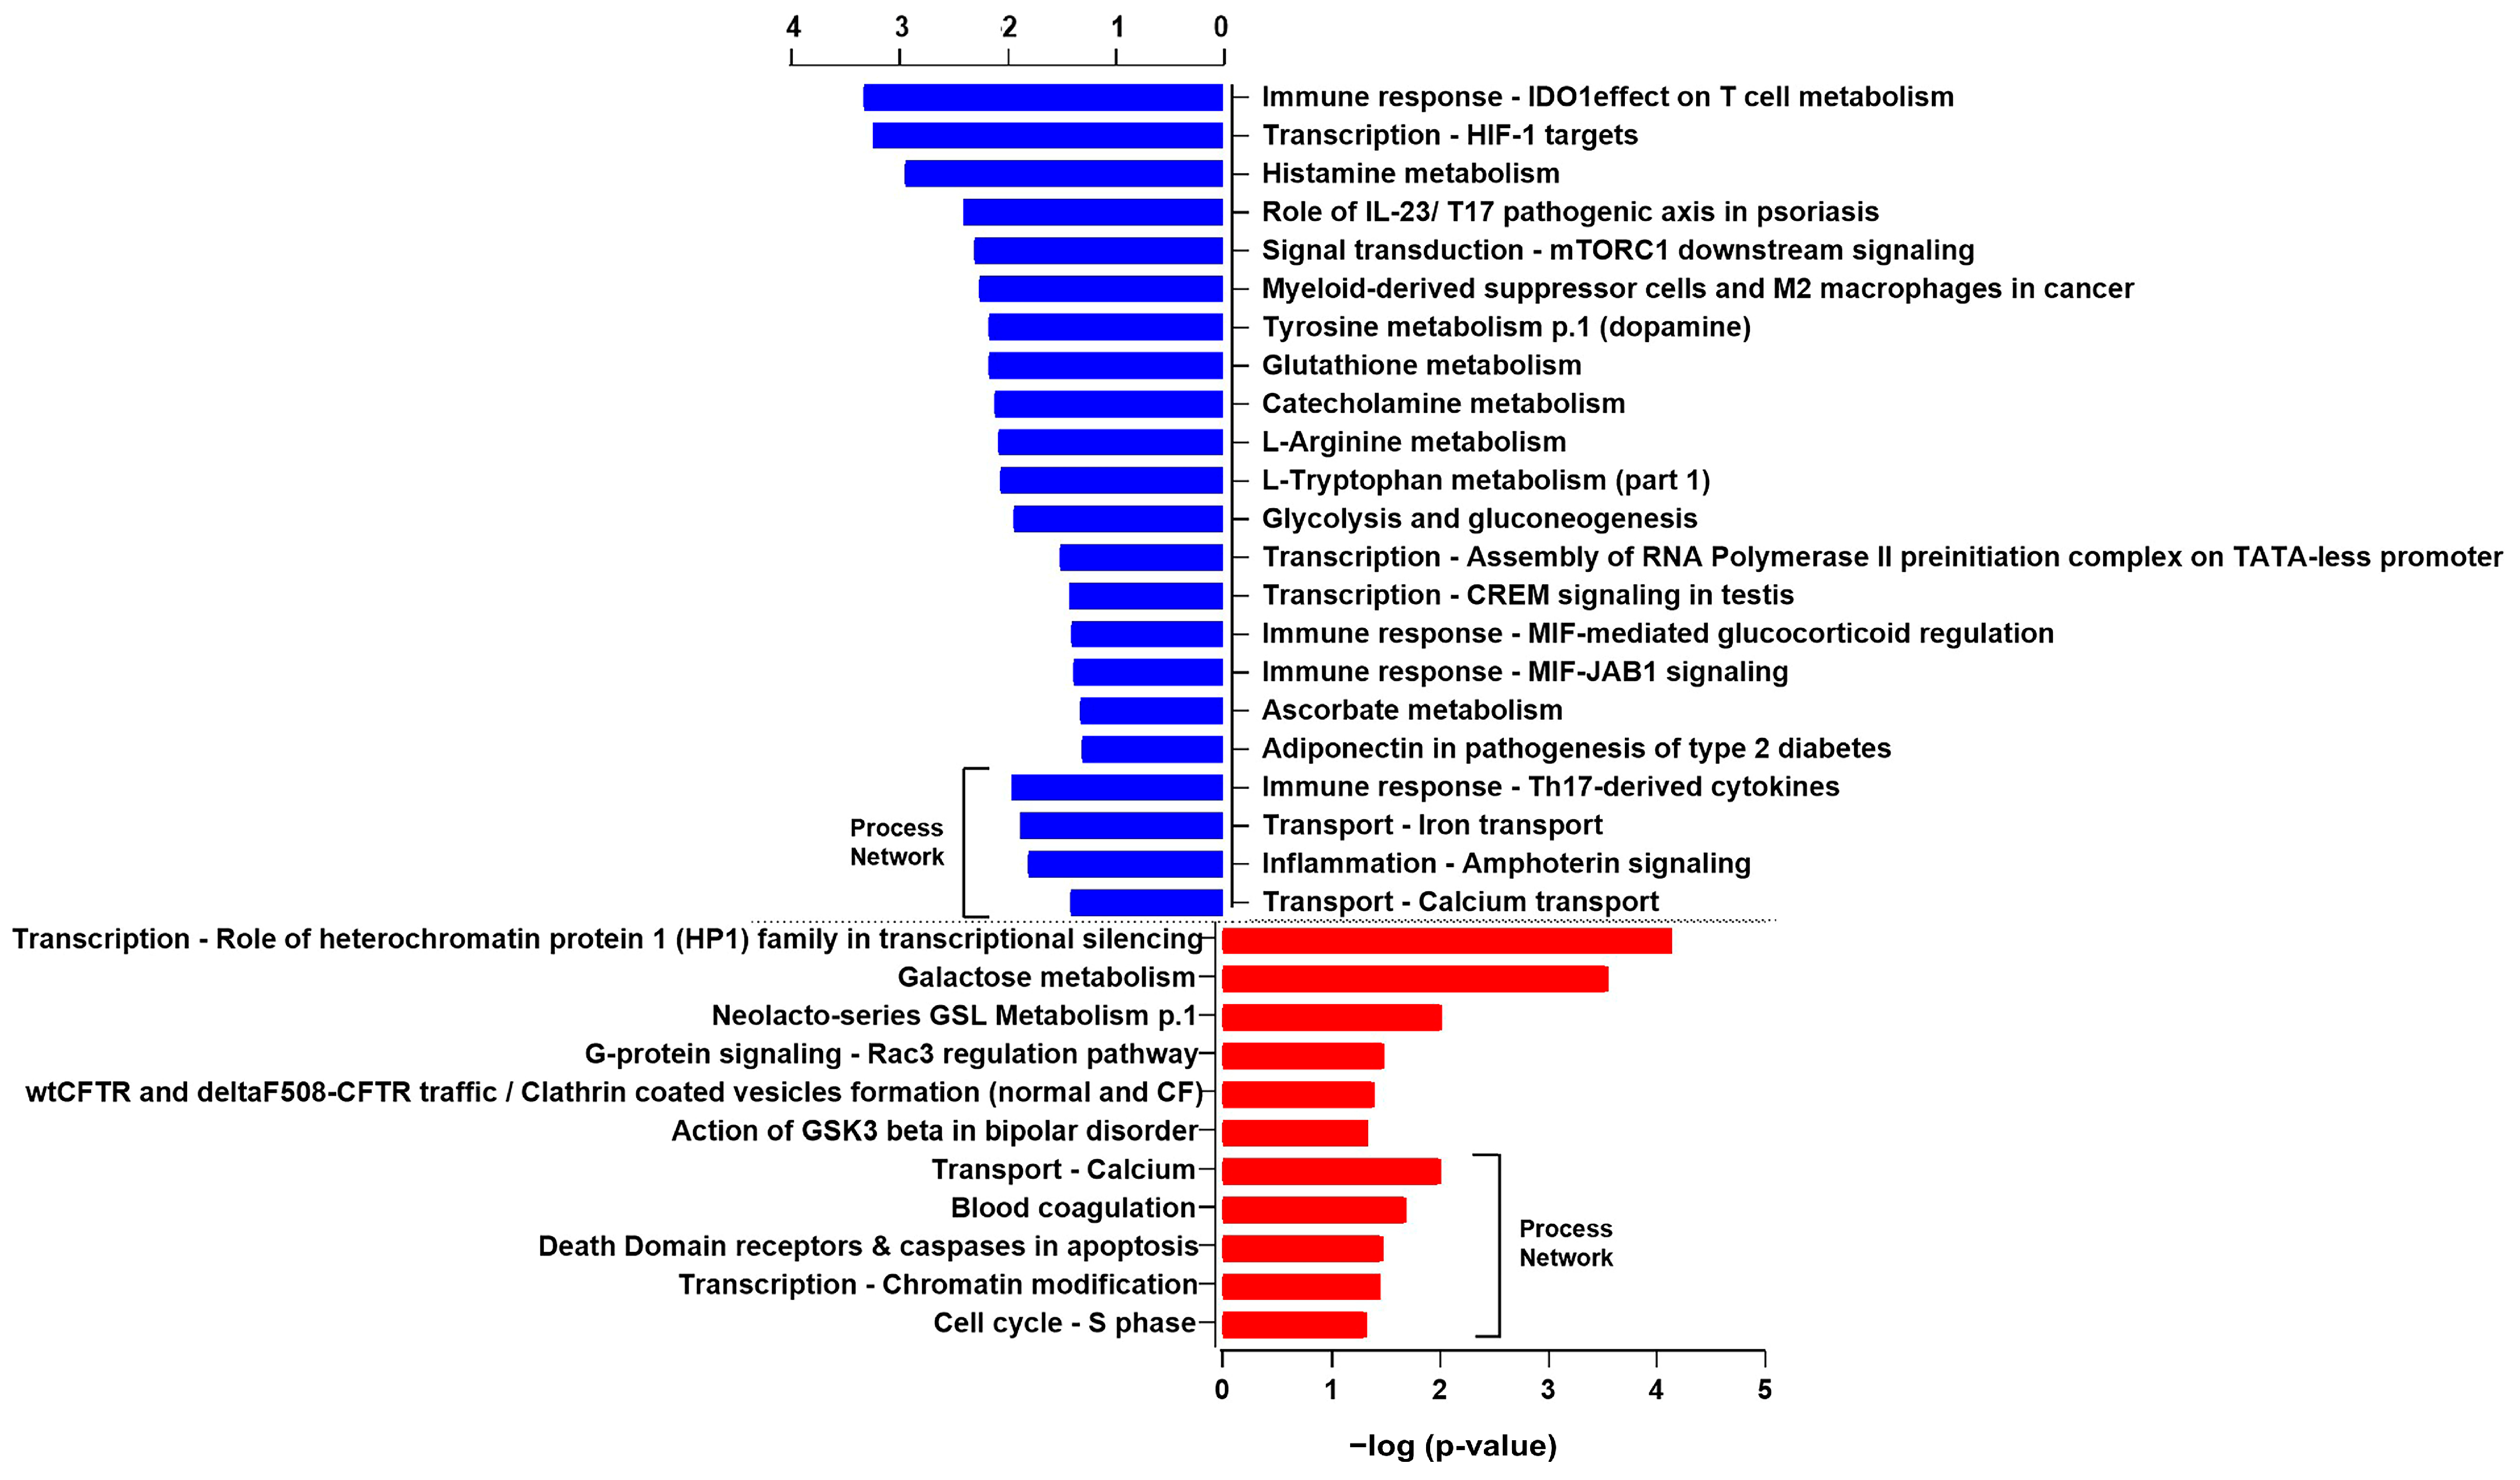
Figure 1. Differentially expressed proteins (DEPs) in LNCaP PCa cells expressing miR-423-5p mimic compared to control (empty vector) evaluated by quantitative SWATH-mass spectrometry and defined downregulated if fold change (FC) ≤ −1.5, and upregulated if fold change (FC) ≥ 1.5. Data analysis performed with the SCIEX OneOmics cloud processing platform (n = 6 biological replicates, OneOmics confidence over 75%). (A) Heatmap representation of the average of proteomic data (C = ctr, empty vector; T = treated, mimic miR-423-5p) and heatmap of the individual replicates (empty vector and mimic miR-423-5p). (B) Histogram graph of the top ten downregulated proteins. (C) Histogram graph of the top ten upregulated proteins.
Ijms 24 00617 g001
Figure 2. MetaCore enrichment analysis of proteomics data in LNCaP PCa cells overexpressing miR-423-5p. Significant pathways and process networks from downregulated (red) and upregulated (blue) proteins in LNCaP PCa cells expressing miR-423-5p mimic compared to control (empty vector). Quantitative SWATH-mass spectrometry data analysis performed with the SCIEX OneOmics cloud processing platform (n = 6 biological replicates).
Ijms 24 00617 g002
Figure 3. STRING analysis of proteomics data. Protein–protein interaction (PPI) networks of significant downregulated (A) and upregulated (B) proteins in LNCaP PCa cells expressing miR-423-5p mimic compared to control (empty vector). Analysis was performed with the search tool for retrieval of interacting genes/proteins database (STRING, version V11.0, [17]). Available online: http://stringdb.org, (accessed on 19 October 2022). Medium confidence was applied for the analysis and the Markov Cluster Algorithm (MCA) performed to extract clusters of densely connected nodes from biological networks.
Ijms 24 00617 g003
Figure 4. Summary of target genes of hsa-miR-423-5p (miTGs). (A) Venn diagram to identify common targets predicted by DIANA microT-CDS, TargetScan_Human_v8.0, mirDIP, and mirDB. (B) Venn diagram showing the targets commonly represented between DEPs and predicted miTGs.
Ijms 24 00617 g004
Figure 5. Gene expression analysis performed with GEPIA2 for the predicted miTGs in prostate adenocarcinoma (PRAD) samples (red, T = 492) and normal tissue (grey, N = 152) from TCGA and GTEx projects. Gene expression (log2(TPM + 1)) for MAP1B, CBX5/HP1A, NIT1, STK39, IMPDH1, ADGRG6 and SRM. Significant difference shown with an asterisk: *  p-value ≤ 0.01.
Ijms 24 00617 g005
Figure 6. Kaplan–Meier plots for mRNA expression derived from the online GEPIA2 tool for sets of high (red) and low (blue) expression level cohorts. ‘N’ represents the size of the patient cohorts involved in the study with high and low expression of mir-423-5p targets.
Ijms 24 00617 g006
Table 1. MetaCore enrichment analysis of proteomics data in LNCaP PCa cells overexpressing miR-423-5p. Significant pathways modulated by downregulated proteins in LNCaP PCa cells expressing miR-423-5p mimic compared to control (empty vector) (p-value ≤0.05). Quantitative SWATH-mass spectrometry data analysis performed with the SCIEX OneOmics cloud processing platform (n = 6 biological replicates).
Pathways Modulated by Downregulated ProteinsTotalIn Datap-ValueNetwork Objects from Active Data
1Immune response_The effect of IDO1 on T cell metabolism8934.910 × 10−4LDHA, HX2, G6PD
2Transcription_HIF-1 targets9535.945 × 10−4LDHA, TfR1, HX2
3Histamine metabolism2921.185 × 10−3ALDHA1, ALDH2
4Role of IL-23/T17 pathogenic axis in psoriasis5424.067 × 10−3Calgranulin A,
Calgranulin B
5Signal transduction_mTORC1 downstream signaling6125.163 × 10−3GRB10, G6PD
6Myeloid-derived suppressor cells and M2 macrophages in cancer6425.669 × 10−3Calgranulin A,
Calgranulin B
7Tyrosine metabolism p.1 (dopamine)7126.937 × 10−3ALDHA1, ALDH2
8Glutathione metabolism7126.937 × 10−3GSTT2, G6PD
9Catecholamine metabolism7627.914 × 10−3ALDHA1, ALDH2
10L-Arginine metabolism7928.529 × 10−3ALDHA1, ALDH2
11L-Tryptophan metabolism (part 1)8128.950 × 10−3ALDHA1, ALDH2
12Glycolysis and gluconeogenesis9421.191 × 10−2LDHA, HX2
13Transcription_Assembly of RNA Polymerase II preinitiation complex on TATA-less promoters1813.164 × 10−2AMH
14Transcription_CREM signaling in testis2213.854 × 10−2HX2
15Immune response_MIF-mediated glucocorticoid regulation2314.026 × 10−2MIF
16Immune response_MIF-JAB1 signaling2414.197 × 10−2MIF
17Ascorbate metabolism2814.880 × 10−2ALDH2
18Adiponectin in pathogenesis of type 2 diabetes2915.050 × 10−2ACADM
Table 2. MetaCore enrichment analysis of proteomics data in LNCaP PCa cells overexpressing miR-423-5p. Significant pathways modulated by upregulated proteins in LNCaP PCa cells expressing miR-423-5p mimic compared to control (empty vector) (p-value ≤ 0.05). Quantitative SWATH-mass spectrometry data analysis performed with the SCIEX OneOmics cloud processing platform (n = 6 biological replicates).
Pathways Modulated by Upregulated ProteinsTotalIn Datap-ValueNetwork Objects from Active Data
1Transcription_Role of heterochromatin protein 1 (HP1) family in transcriptional silencing4037.294 × 10−5HP1 alpha, HP1 beta, HP1
2Galactose metabolism6332.843 × 10−4GALK1, GALT
3Neolacto-series GSL Metabolism p.17229.649 × 10−3ASNA1
4G-protein signaling_Rac3 regulation pathway1613.279 × 10−2Calmyrin
5wtCFTR and deltaF508-CFTR traffic/Clathrin coated vesicles formation (normal and CF)2014.083 × 10−2Myosin I
6Action of GSK3 beta in bipolar disorder2314.681 × 10−2MAP-1B
Table 3. MetaCore enrichment analysis of proteomics data in LNCaP PCa cells overexpressing miR-423-5p. Significant process networks modulated by downregulated proteins in LNCaP PCa cells expressing miR-423-5p mimic compared to control (empty vector) (p-value ≤ 0.05). Quantitative SWATH-mass spectrometry data analysis performed with the SCIEX OneOmics cloud processing platform (n = 6 biological replicates).
Process Networks Modulated by Downregulated ProteinsTotalIn Datap-ValueNetwork Objects from Active Data
1Immune response_Th17-derived cytokines9821.128 × 10−2Calgranulin A,
Calgranulin B
2Transport_Iron transport10821.359 × 10−2TfR1, Junctin
3Inflammation_Amphoterin signaling11821.608 × 10−2Calgranulin A,
Calgranulin B
4Transport_Calcium transport19223.987 × 10−2Calgranulin A,
Junctin
Table 4. MetaCore enrichment analysis of proteomics data in LNCaP PCa cells overexpressing miR-423-5p. Significant process networks modulated by upregulated proteins in LNCaP PCa cells expressing miR-423-5p mimic compared to control (empty vector) (p-value ≤ 0.05). Quantitative SWATH-mass spectrometry data analysis performed with the SCIEX OneOmics cloud processing platform (n = 6 biological replicates).
Process Networks Modulated by
Upregulated Proteins
TotalIn Datap-ValueNetwork Objects from Active Data
1Transport_Calcium19239.894 × 10−3Annexin V, Calmyrin
2Blood coagulation9422.056 × 10−2Annexin V,
Annexin IV
3Apoptosis Death Domain receptors & caspases in apoptosis12323.390 × 10−2PEA15
4Transcription_Chromatin modification12723.595 × 10−2HP1 alpha, HP1 beta
5Cell cycle_S phase14924.806 × 10−2HP1 alpha, HP1
Table 5. Target genes of hsa-miR-423-5p (miTGs) predicted by DIANA microT-CDS, TargetScan_Human_v8.0, mirDIP, and mirDB.
Prediction ToolsPredicted miTGs
(miRNA Target Genes)
DIANA microT-CDS935
TargetScan_Human_v8.0232
mirDIP6413
mirDB698
Targets predicted by all 4 tools6695
Targets predicted by a
minimum 2/4 prediction tools
1100
Table 6. Predicted target genes of hsa-miR-423-5p (miTGs) and corresponding proteins modulated by the overexpression of miR-423-5p in LNCaP cells.
Gene NameProtein NameProtein DescriptionFC 1
miR-423-5p/ctr
MAP1BMAP1BMicrotubule-associated protein 1B2.27
CBX5/HP1ACBX5Chromobox protein homolog 51.62
NIT1NIT1Deaminated glutathione amidase1.62
STK39STK39STE20/SPS1-related
proline-alanine-rich protein kinase
1.56
IMPDH1IMDH1Inosine-5′-monophosphate
dehydrogenase 1
−2.49
ADGRG6AGRG6Adhesion G-protein coupled receptor G6−2.75
SRMSPEESpermidine synthase−2.75
1 FC: Fold Change obtained with Protein Expression Workflow using OneOmics Suite (Sciex).
Table 7. Expression status of miR-423-5p target proteins from mass spectrometry analysis, protein expression level in LNCaP cell line from Atlas, and miTGs expression pattern of prostate adenocarcinoma (PRAD) dataset obtained using GEPIA2.
Protein NameProtein DescriptionProtein Expression Status LNCaP Cell Line with
miR-423-5p/ctr
Protein Expression Level
LNCaP Cell Line 1
miTGs 2
Name
Transcriptomic
Expression Status
PRAD 3
(T/N)
MAP1BMicrotubule-associated protein 1BUpregulatedHighMAP1BDownregulated
CBX5Chromobox protein homolog 5UpregulatedHighCBX5/HP1AUpregulated
NIT1Deaminated glutathione
amidase
UpregulatedHighNIT1Downregulated
STK39STE20/SPS1-related
proline-alanine-rich protein kinase
UpregulatedHighSTK39Upregulated
IMDH1Inosine-5′-monophosphate
dehydrogenase 1
DownregulatedHighIMPDH1Upregulated
AGRG6Adhesion G-protein coupled
receptor G6
DownregulatedHighADGRG6Downregulated
SPEESpermidine SynthaseDownregulatedHighSRMUpregulated
1 In Expression Atlas database protein expression values are expressed in parts per billion; 2 miTGs: miRNA Target Genes; 3 PRAD: Prostate Adenocarcinoma, datasets from TCGA and GTEx projects including T = Tumoral (prostate adenocarcinoma) and N = Normal samples (prostate tissue).
Disclaimer/Publisher’s Note: The statements, opinions and data contained in all publications are solely those of the individual author(s) and contributor(s) and not of MDPI and/or the editor(s). MDPI and/or the editor(s) disclaim responsibility for any injury to people or property resulting from any ideas, methods, instructions or products referred to in the content.

