
Type 2 Diabetes in Obesity: A Systems Biology Study on Serum and Adipose Tissue Proteomic Profiles

 , ,
, , 
Abstract
:1. Introduction
2. Results
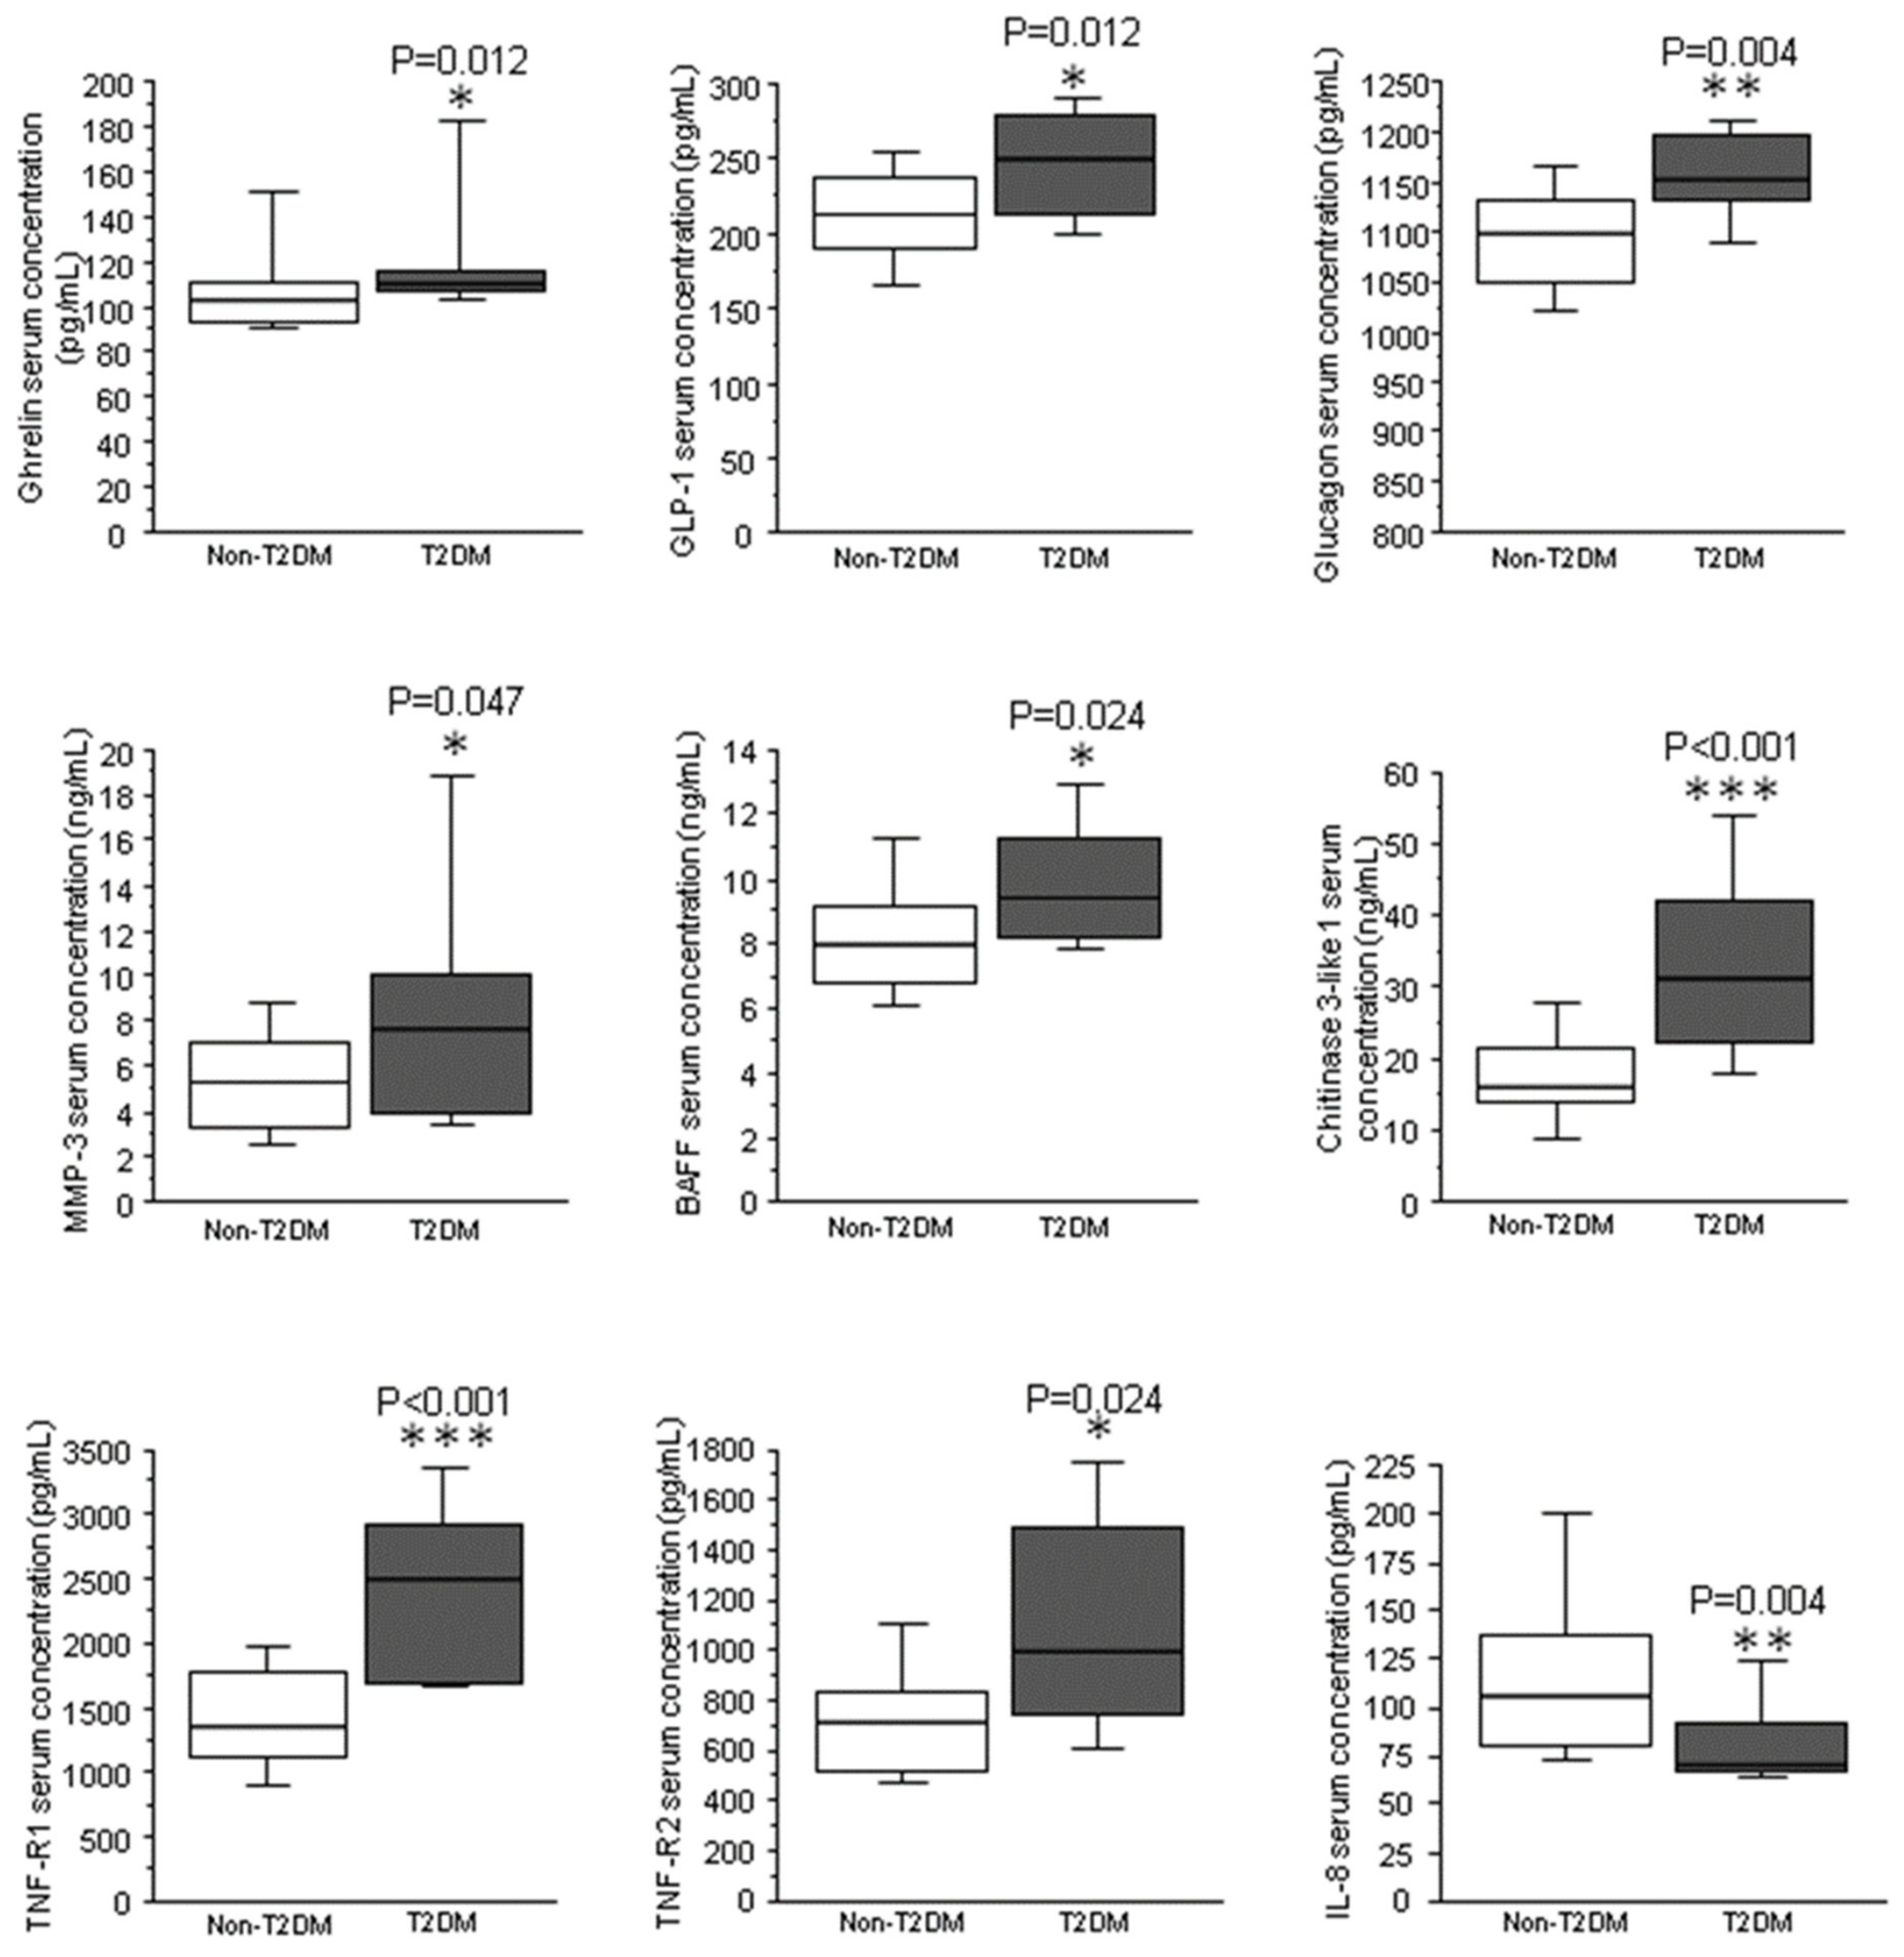
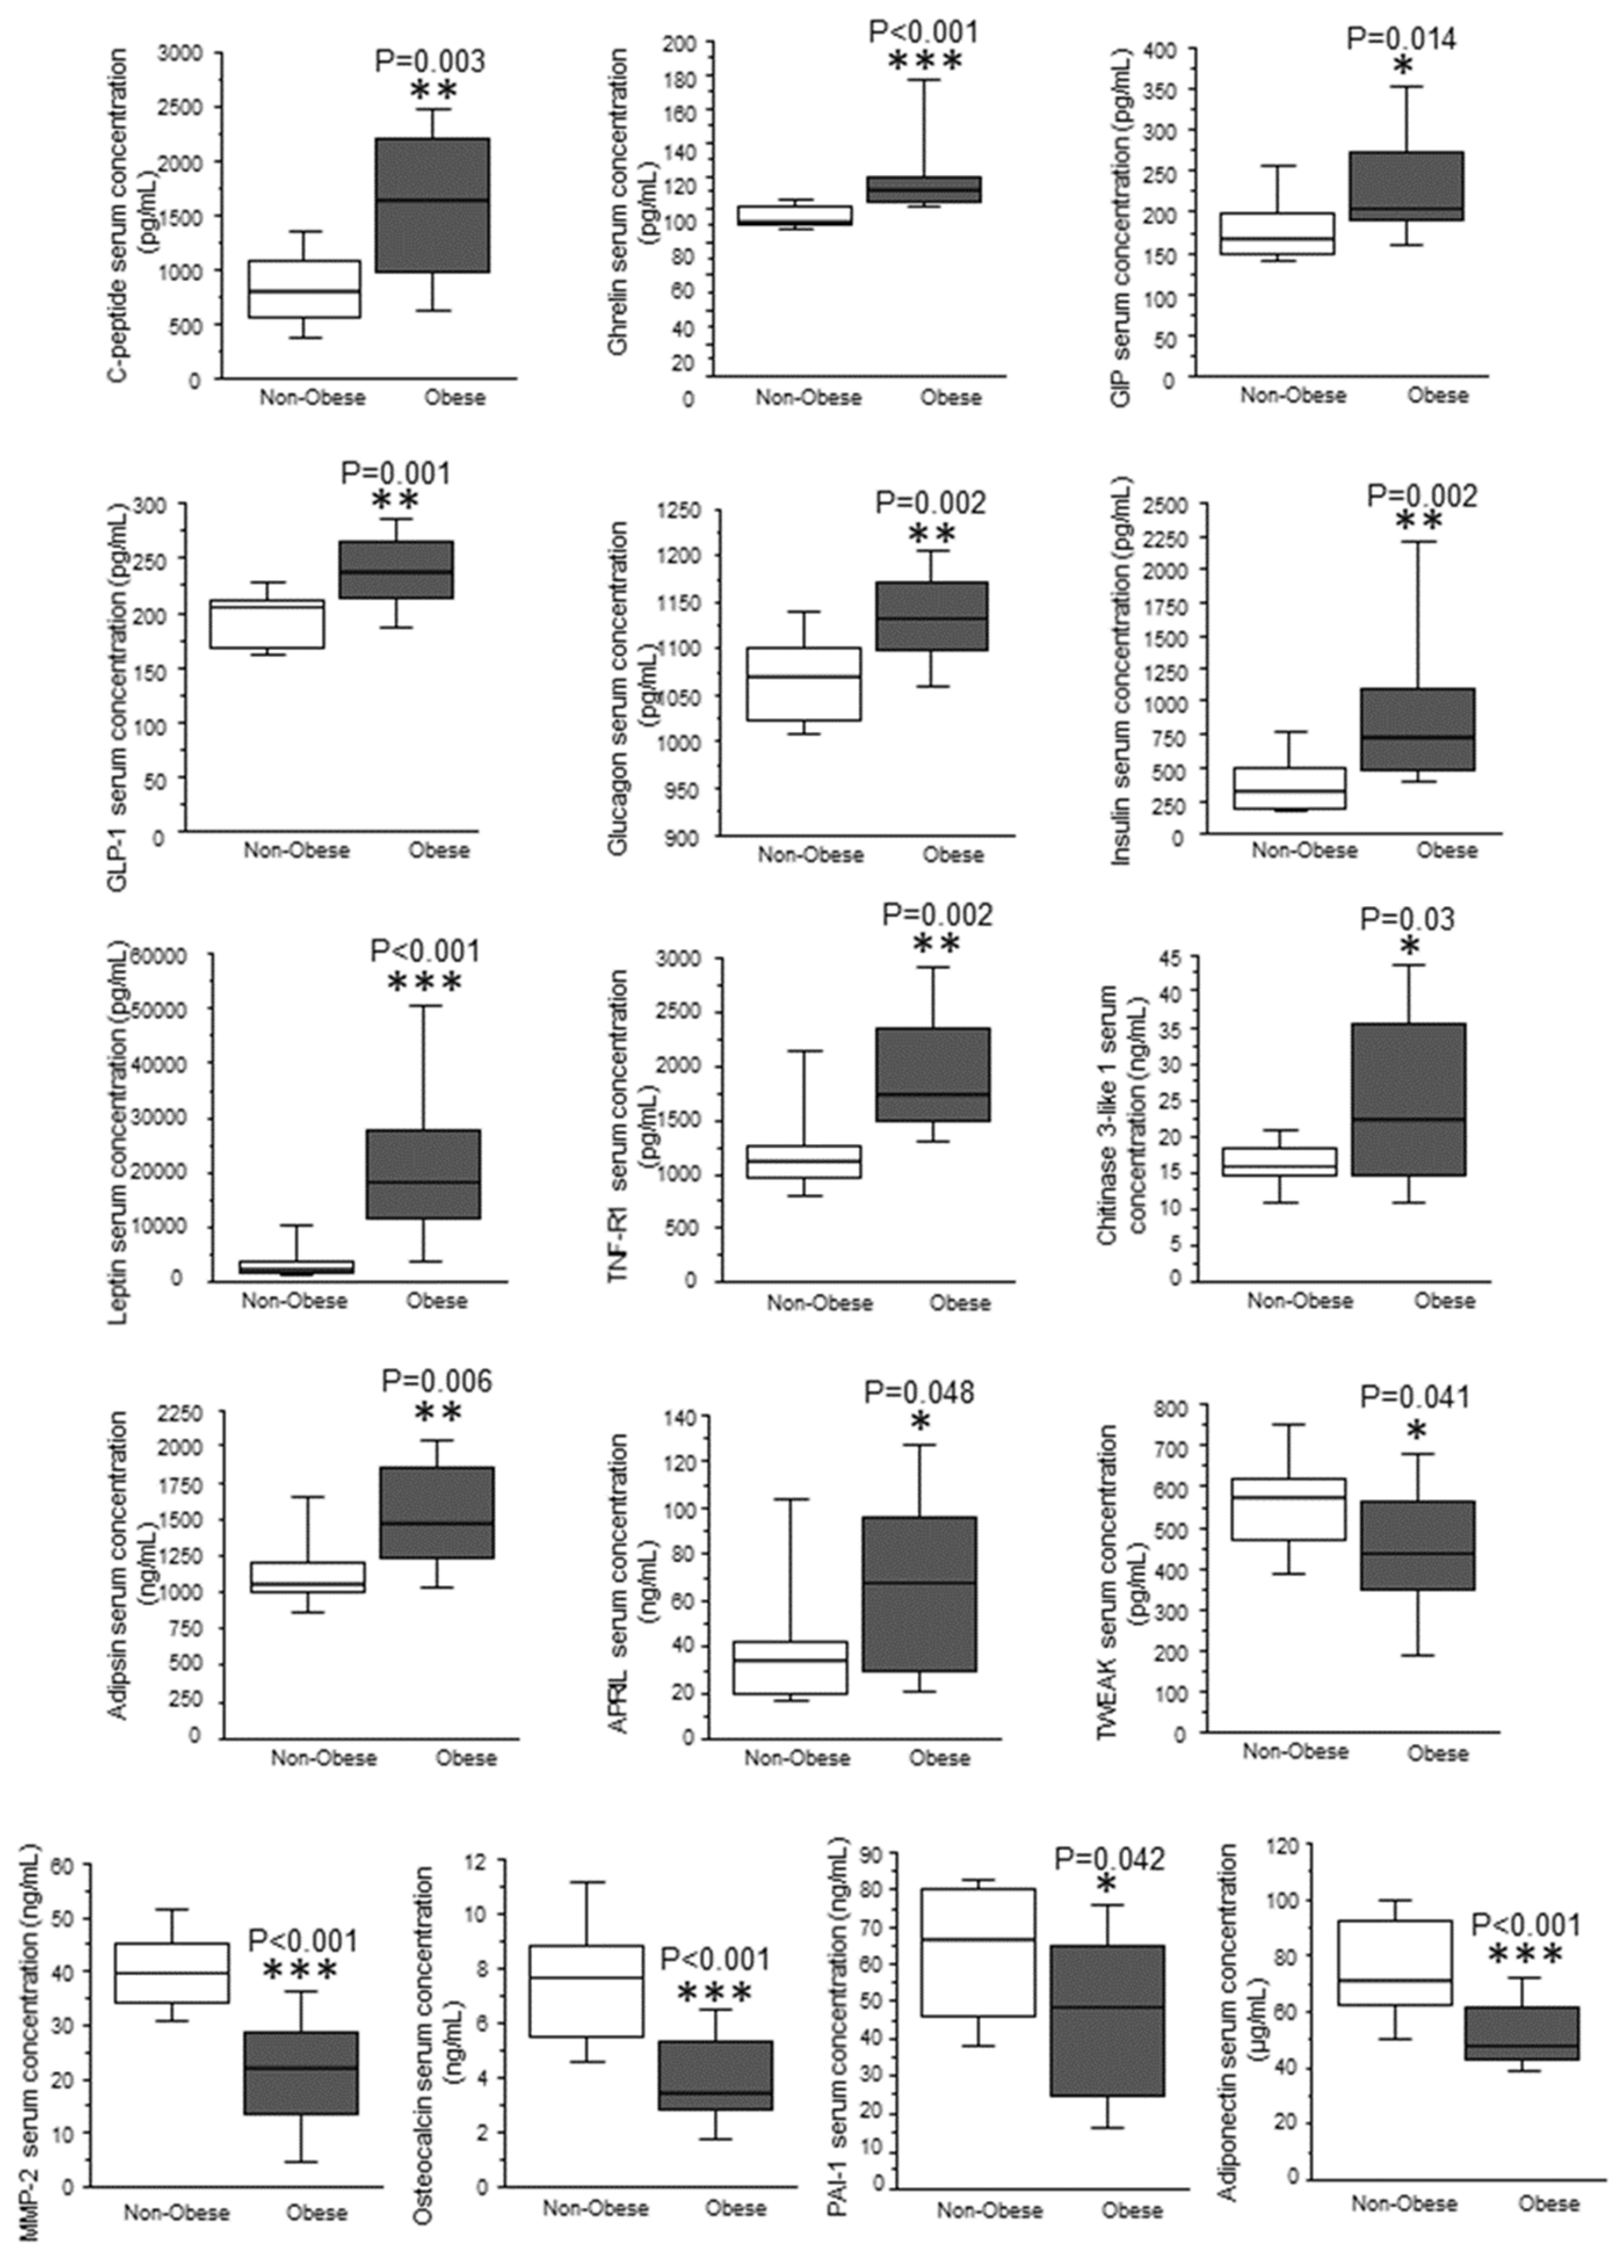
2.1. Influence of Type 2 Diabetes on Serum Proteins of Obese Individuals
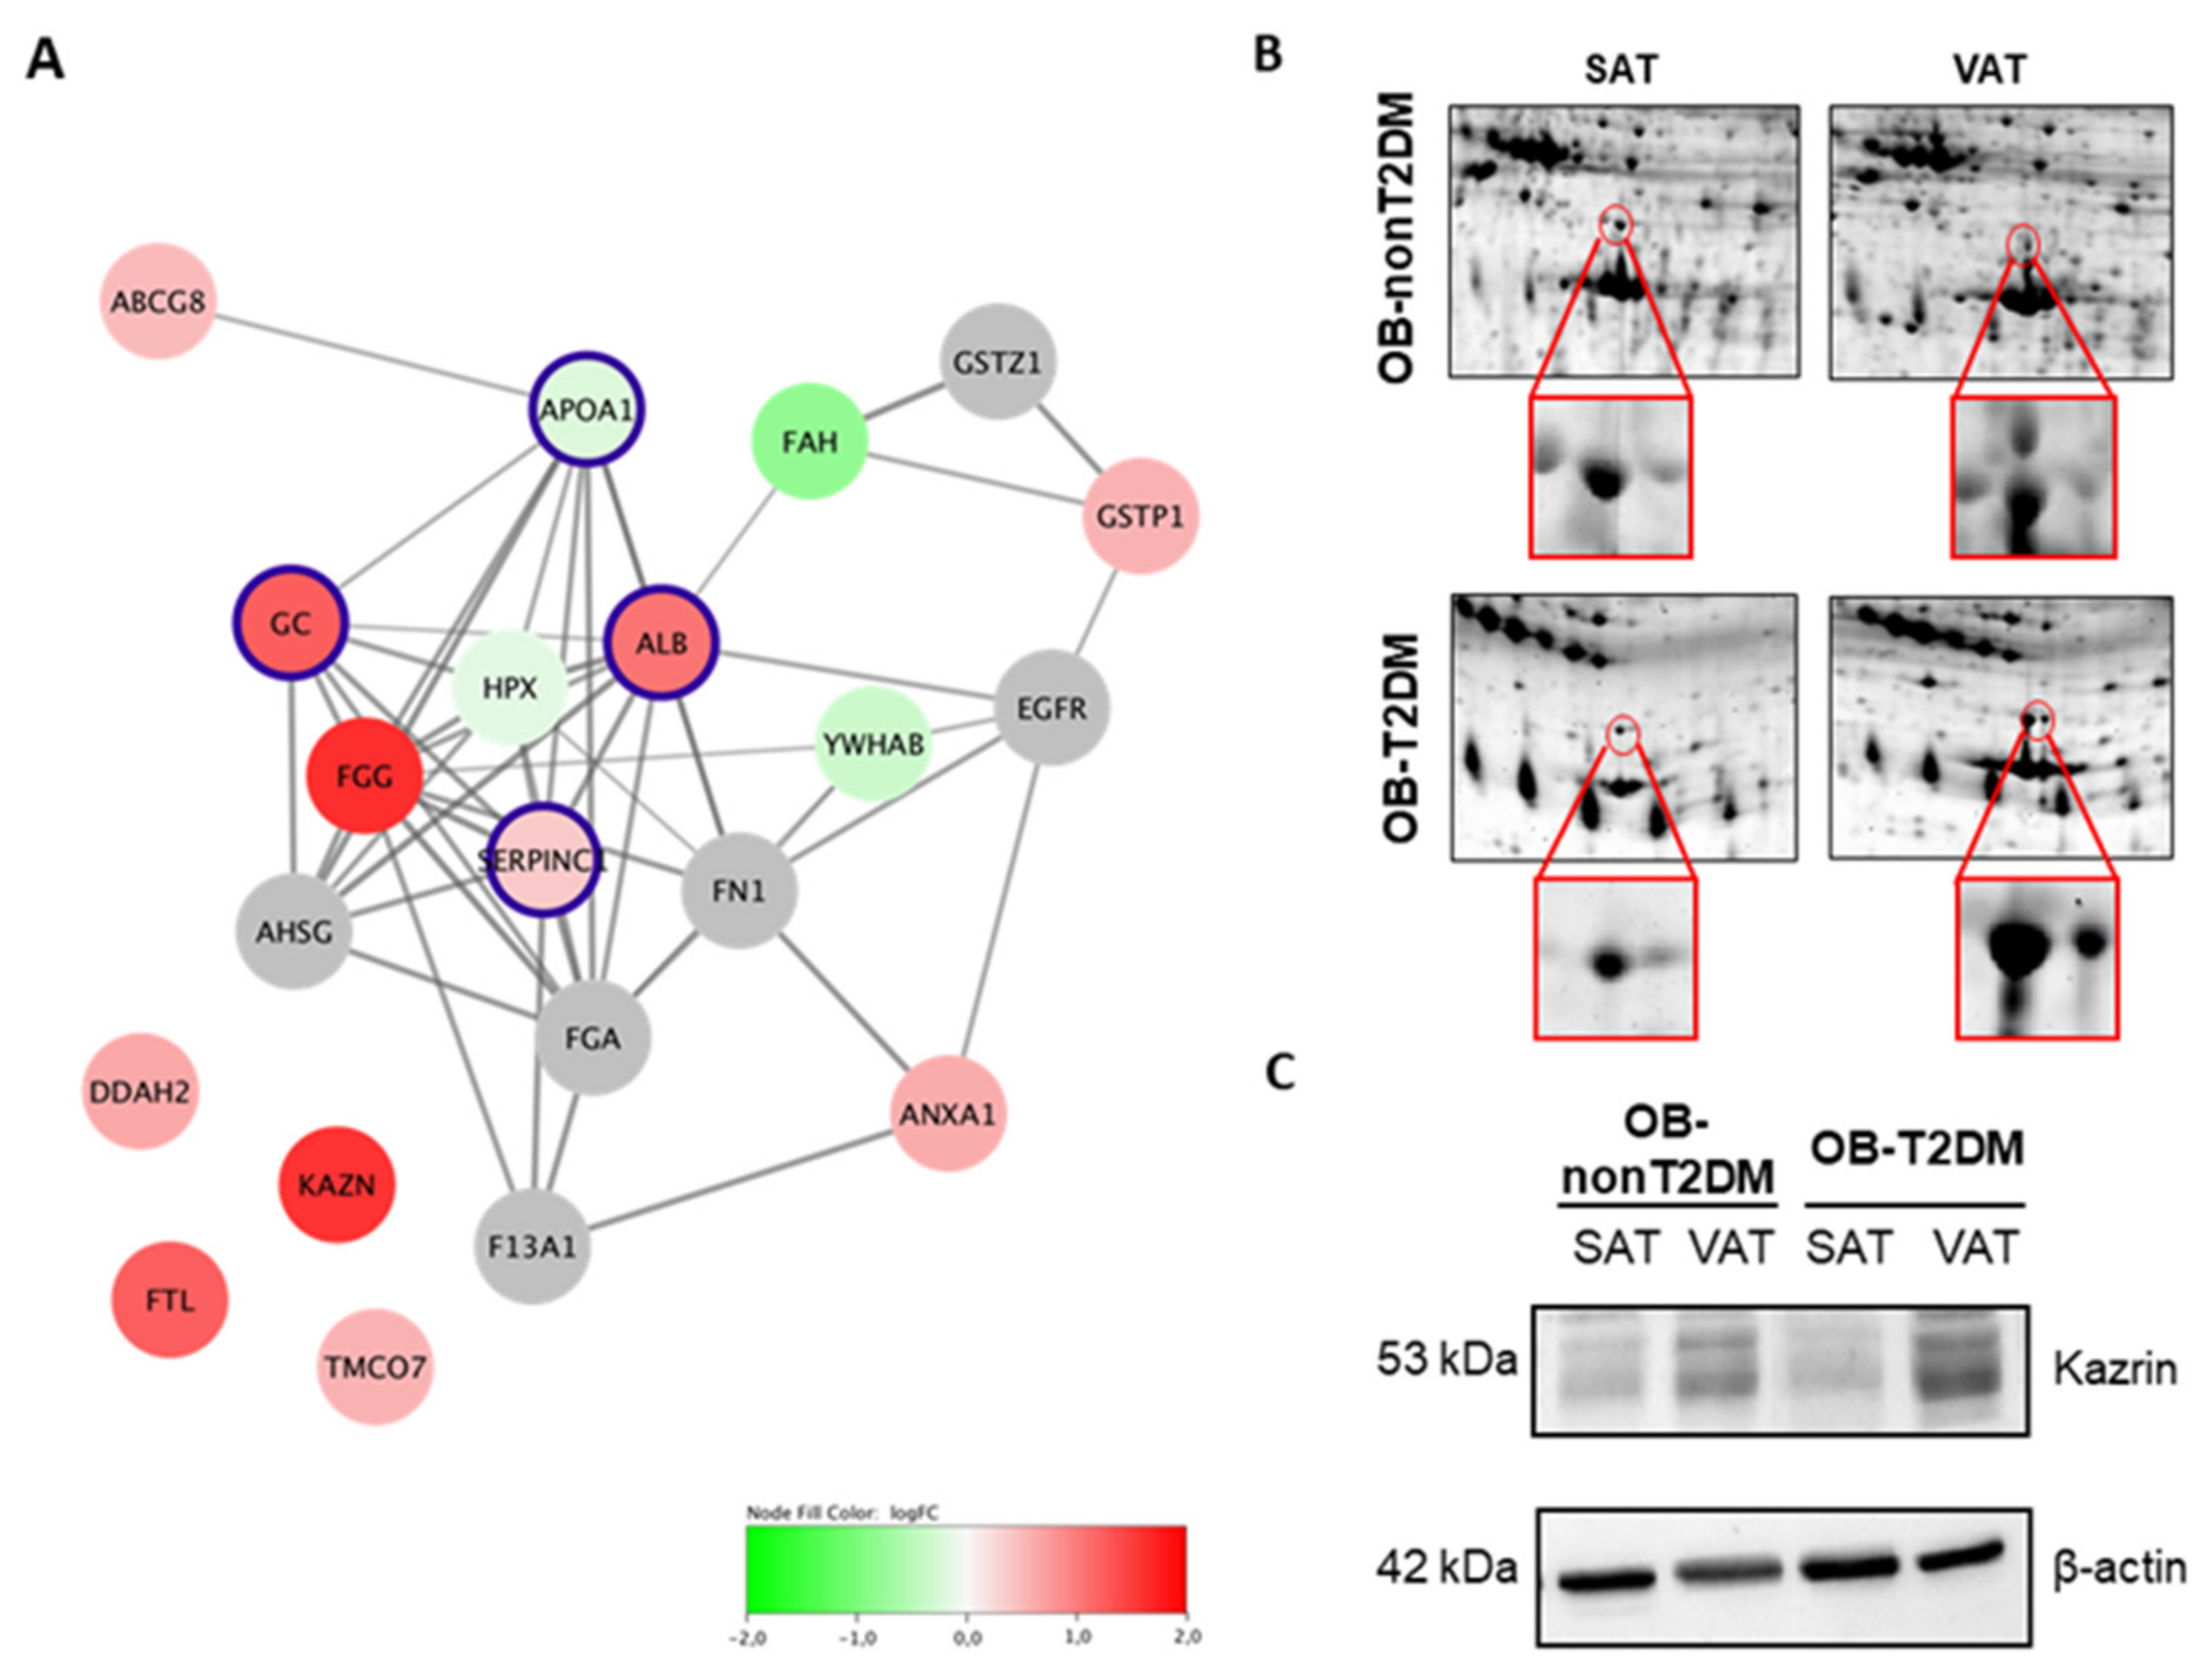
2.2. Differential Protein Expression between Subcutaneous and Visceral White Adipose Tissue
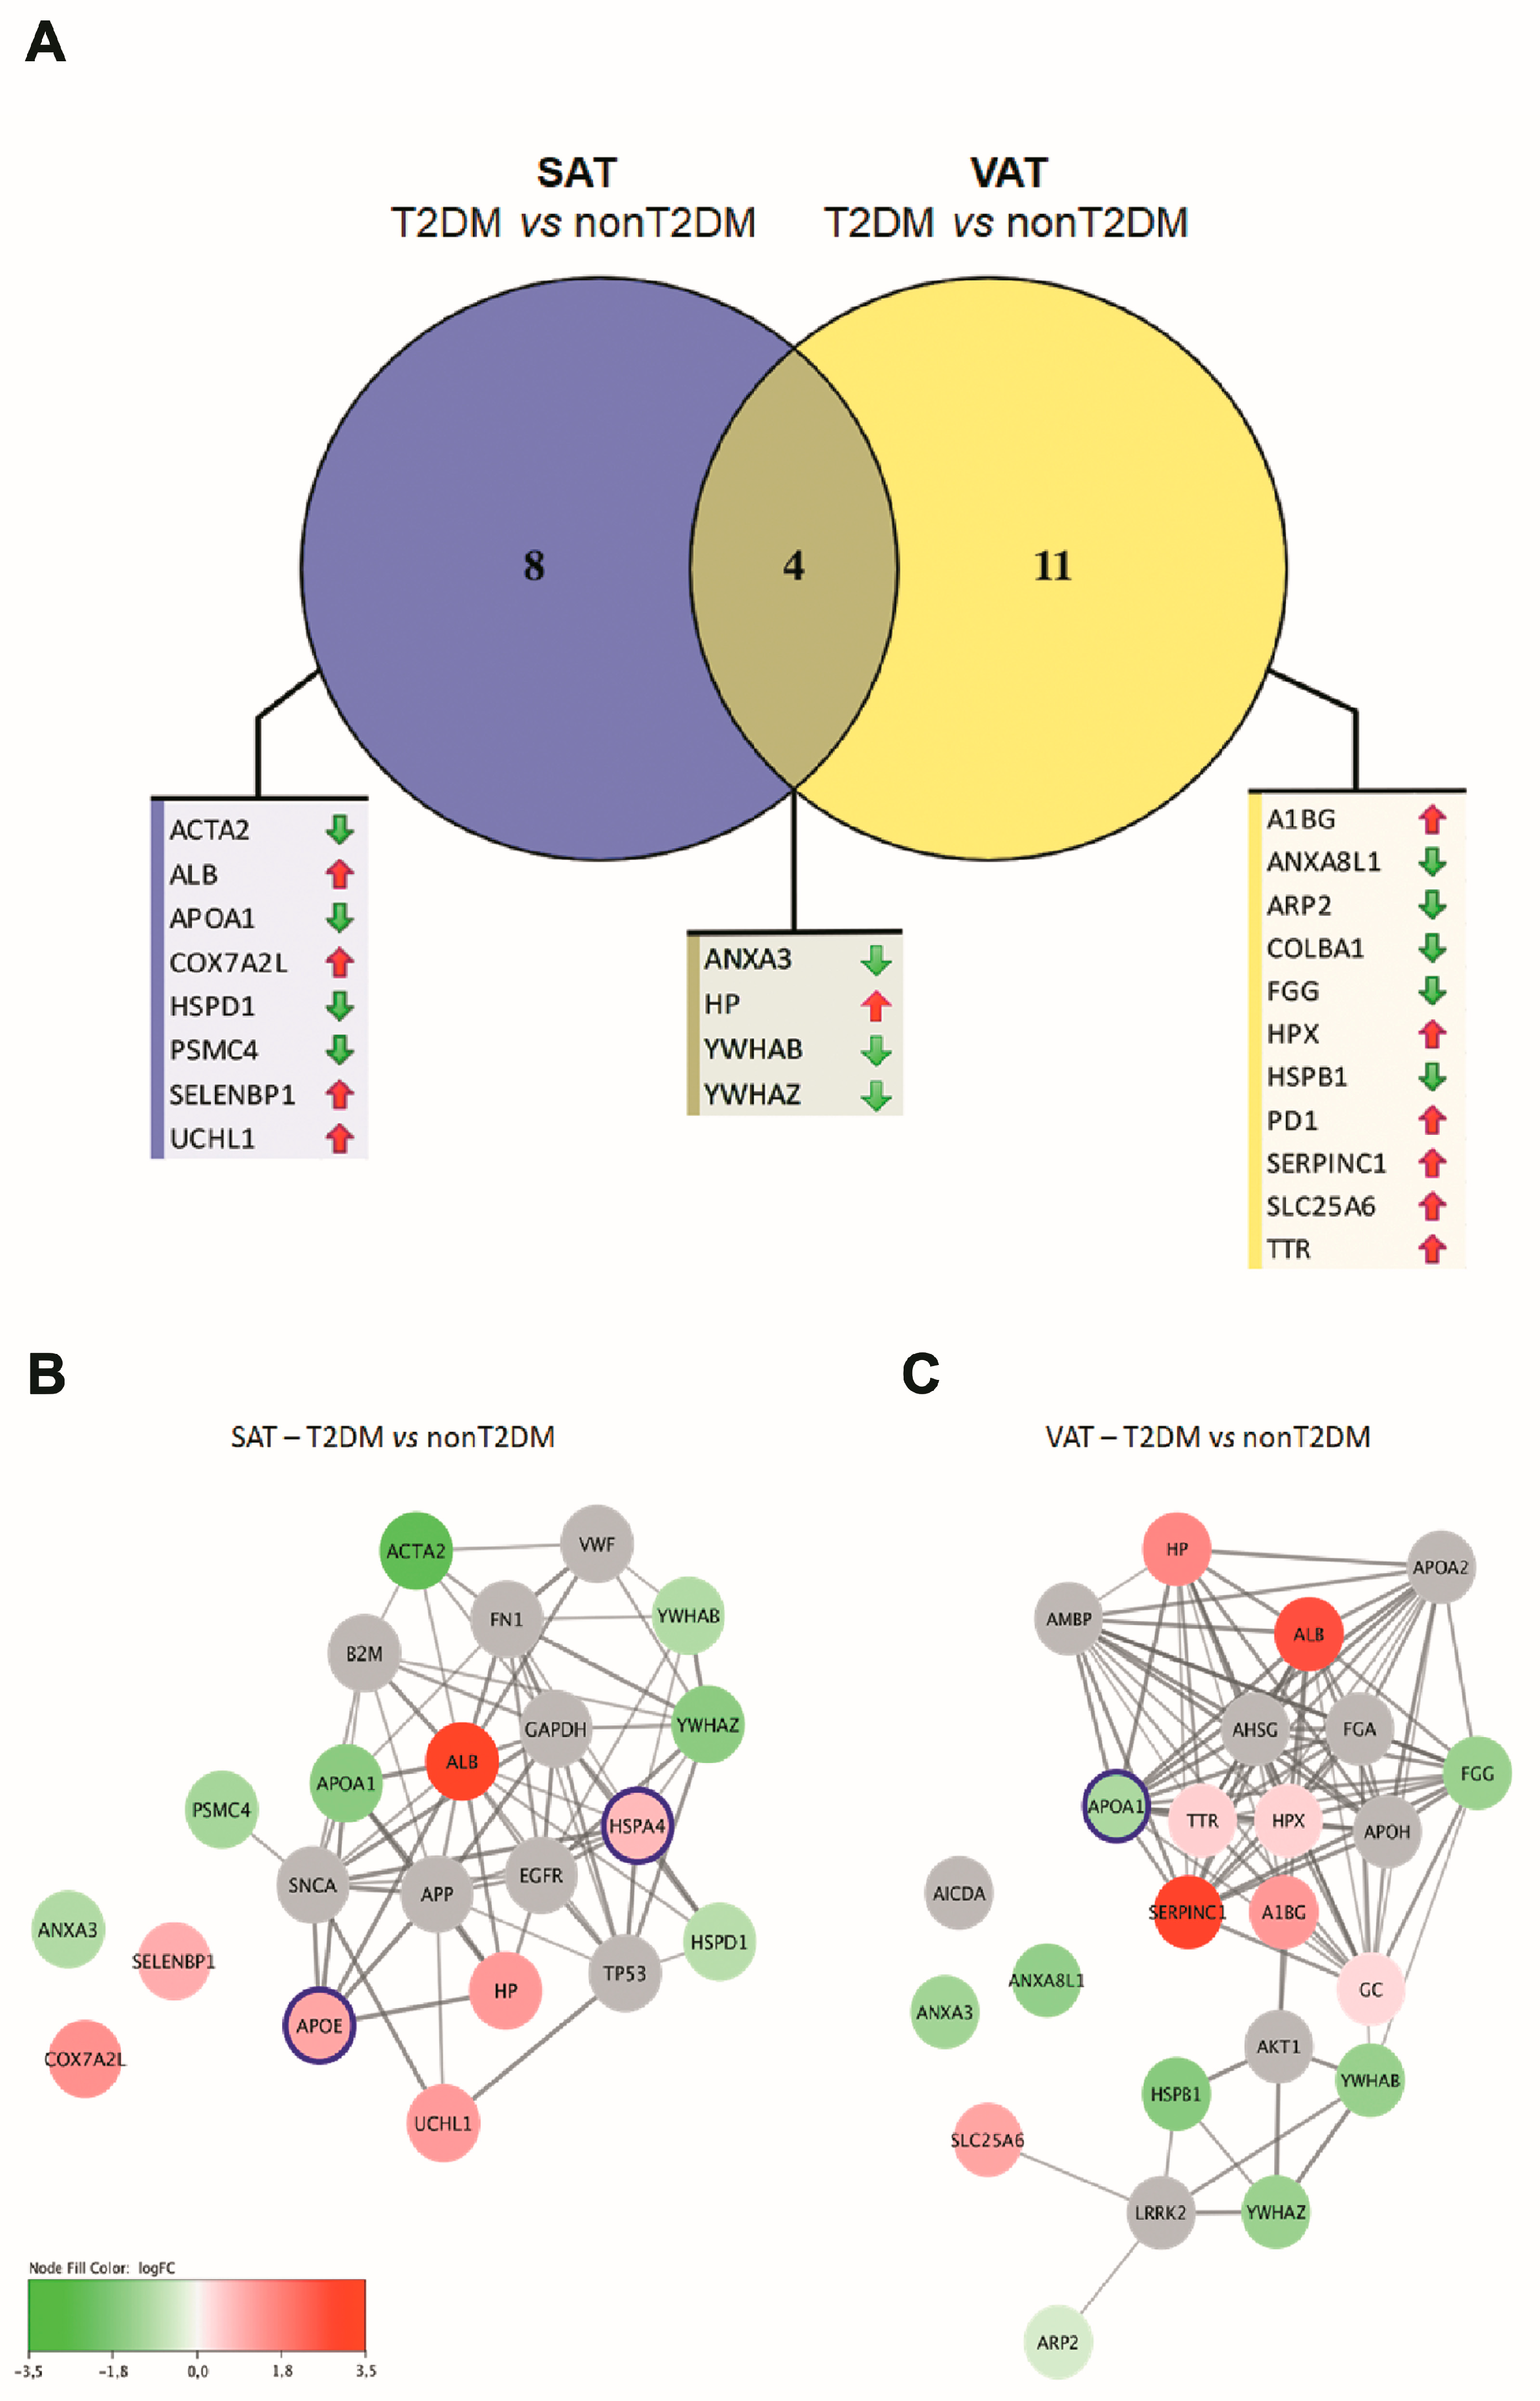
2.3. Type 2 Diabetes and Obesity: Effects on the Proteome of Visceral and Subcutaneous Adipose Tissue
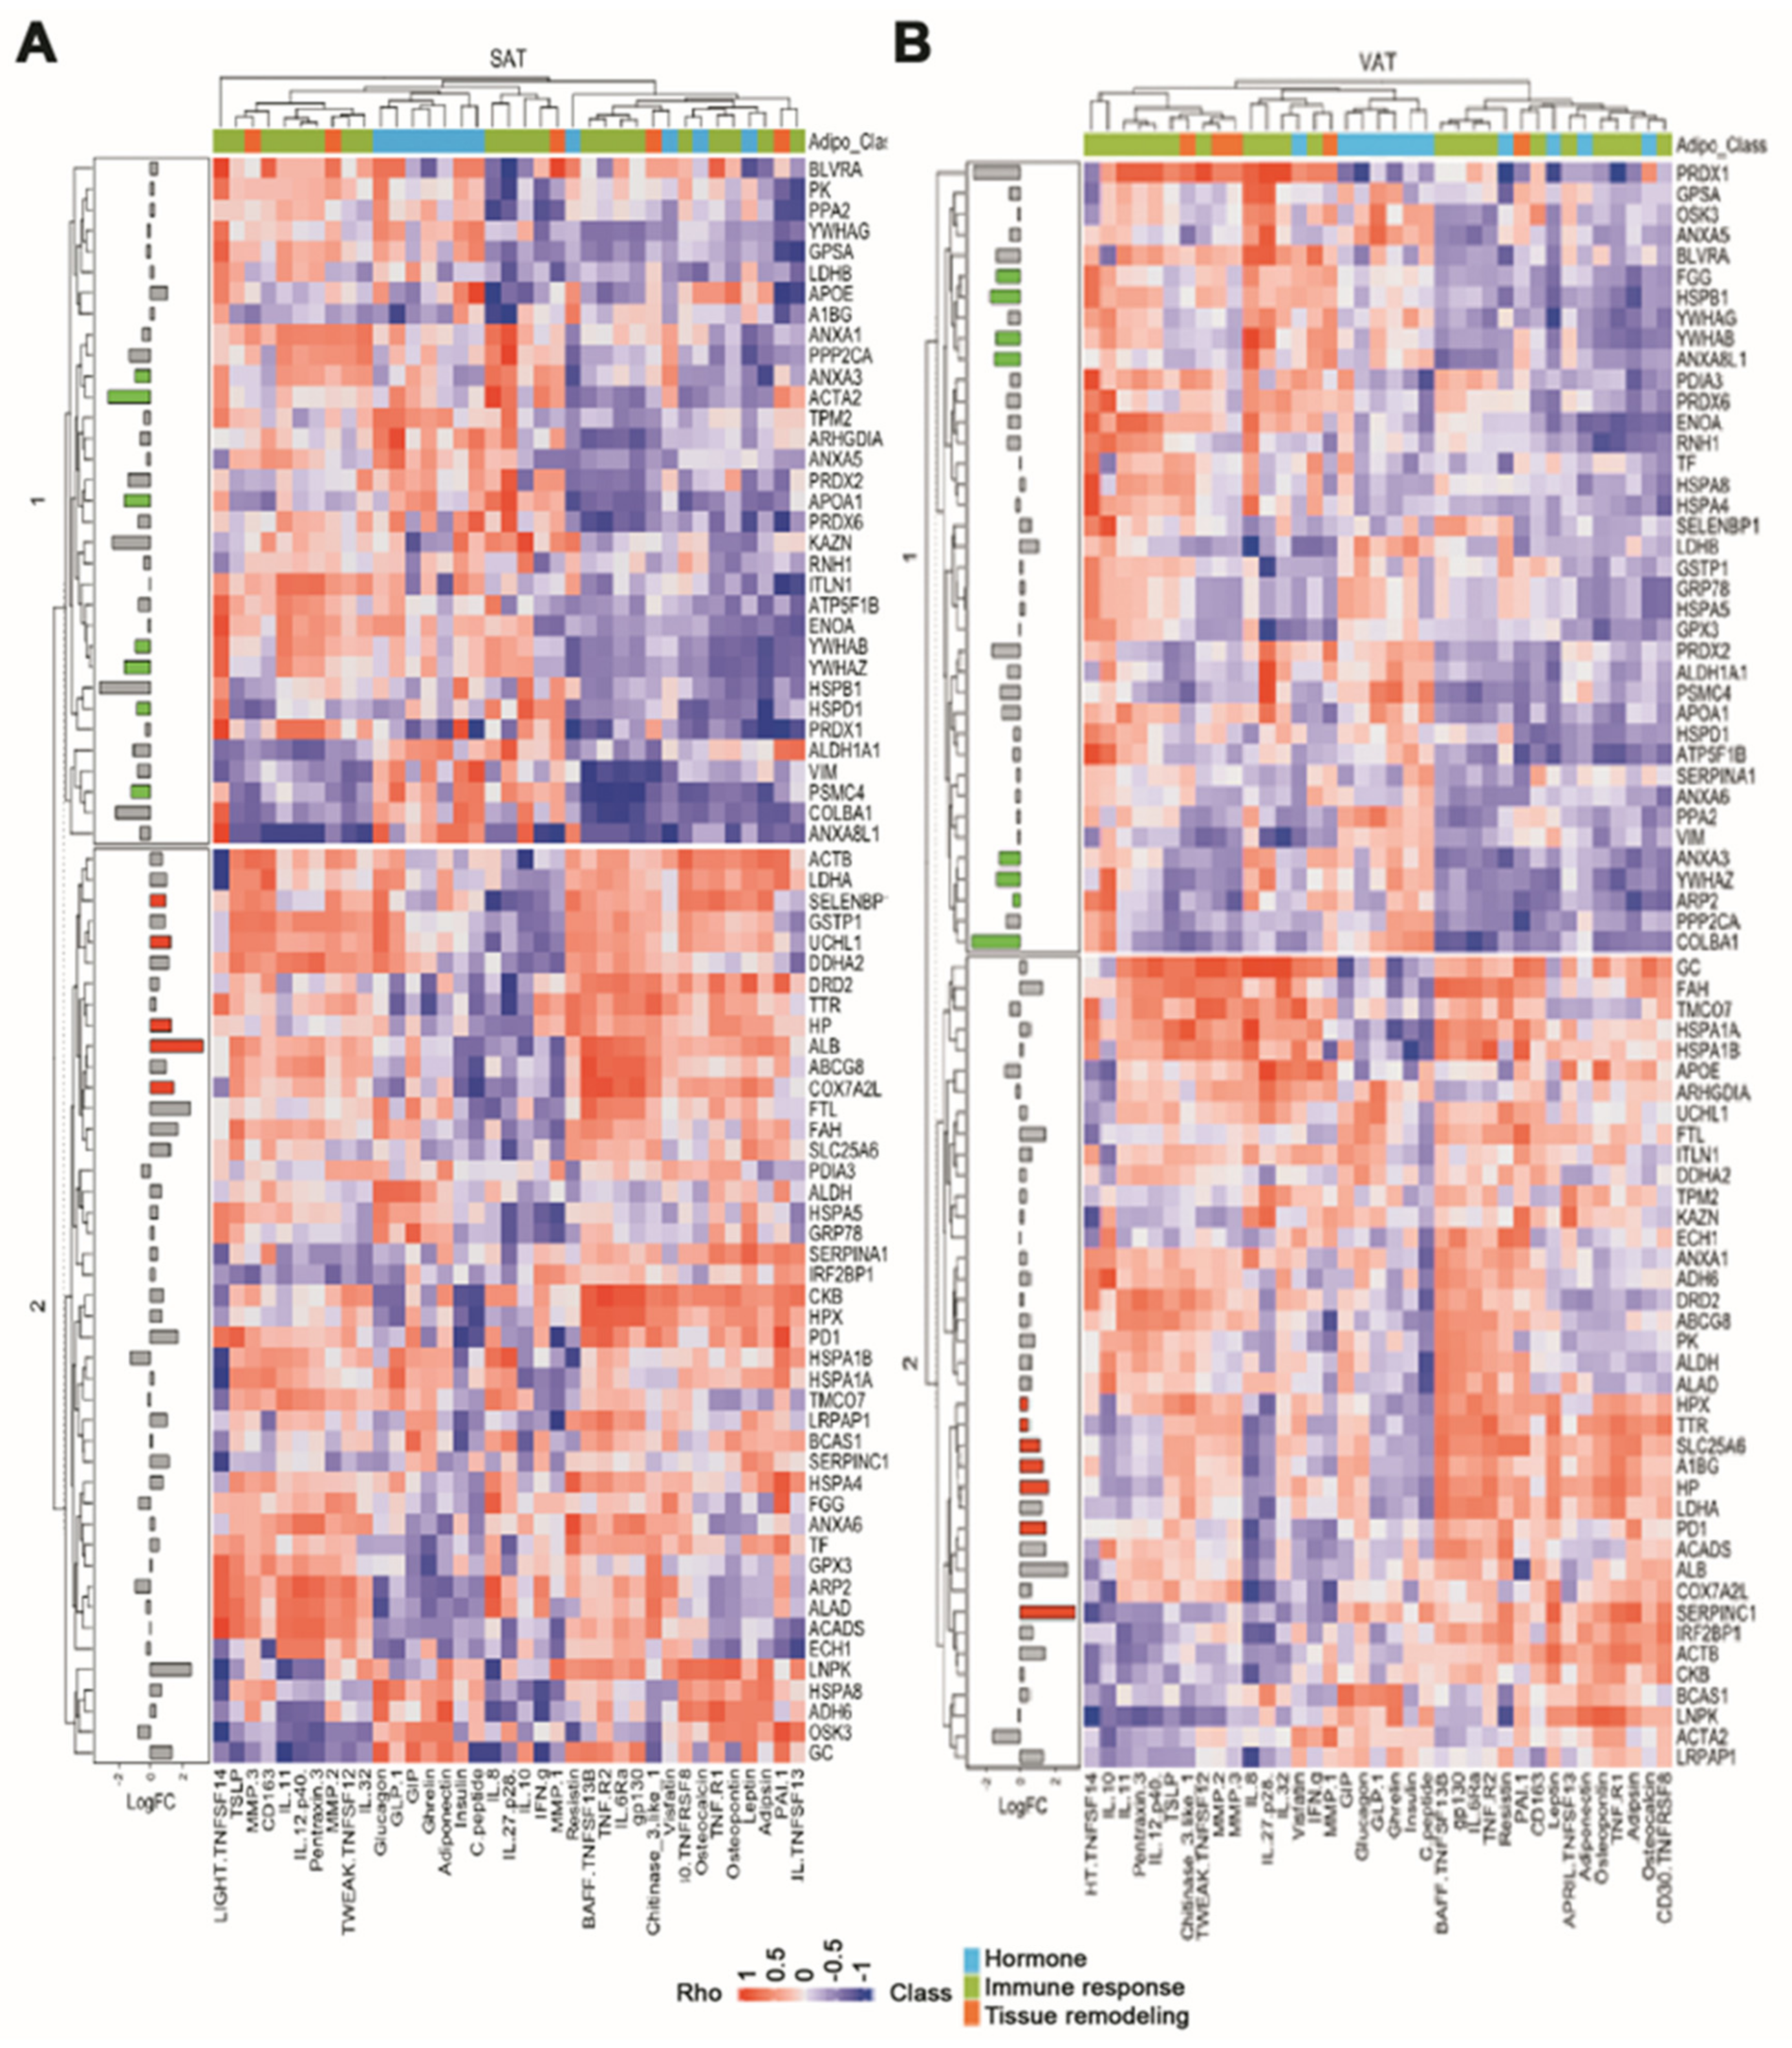
2.4. Effect of White Adipose Tissue Proteome Composition upon Serum Adipokine Signature
3. Discussion
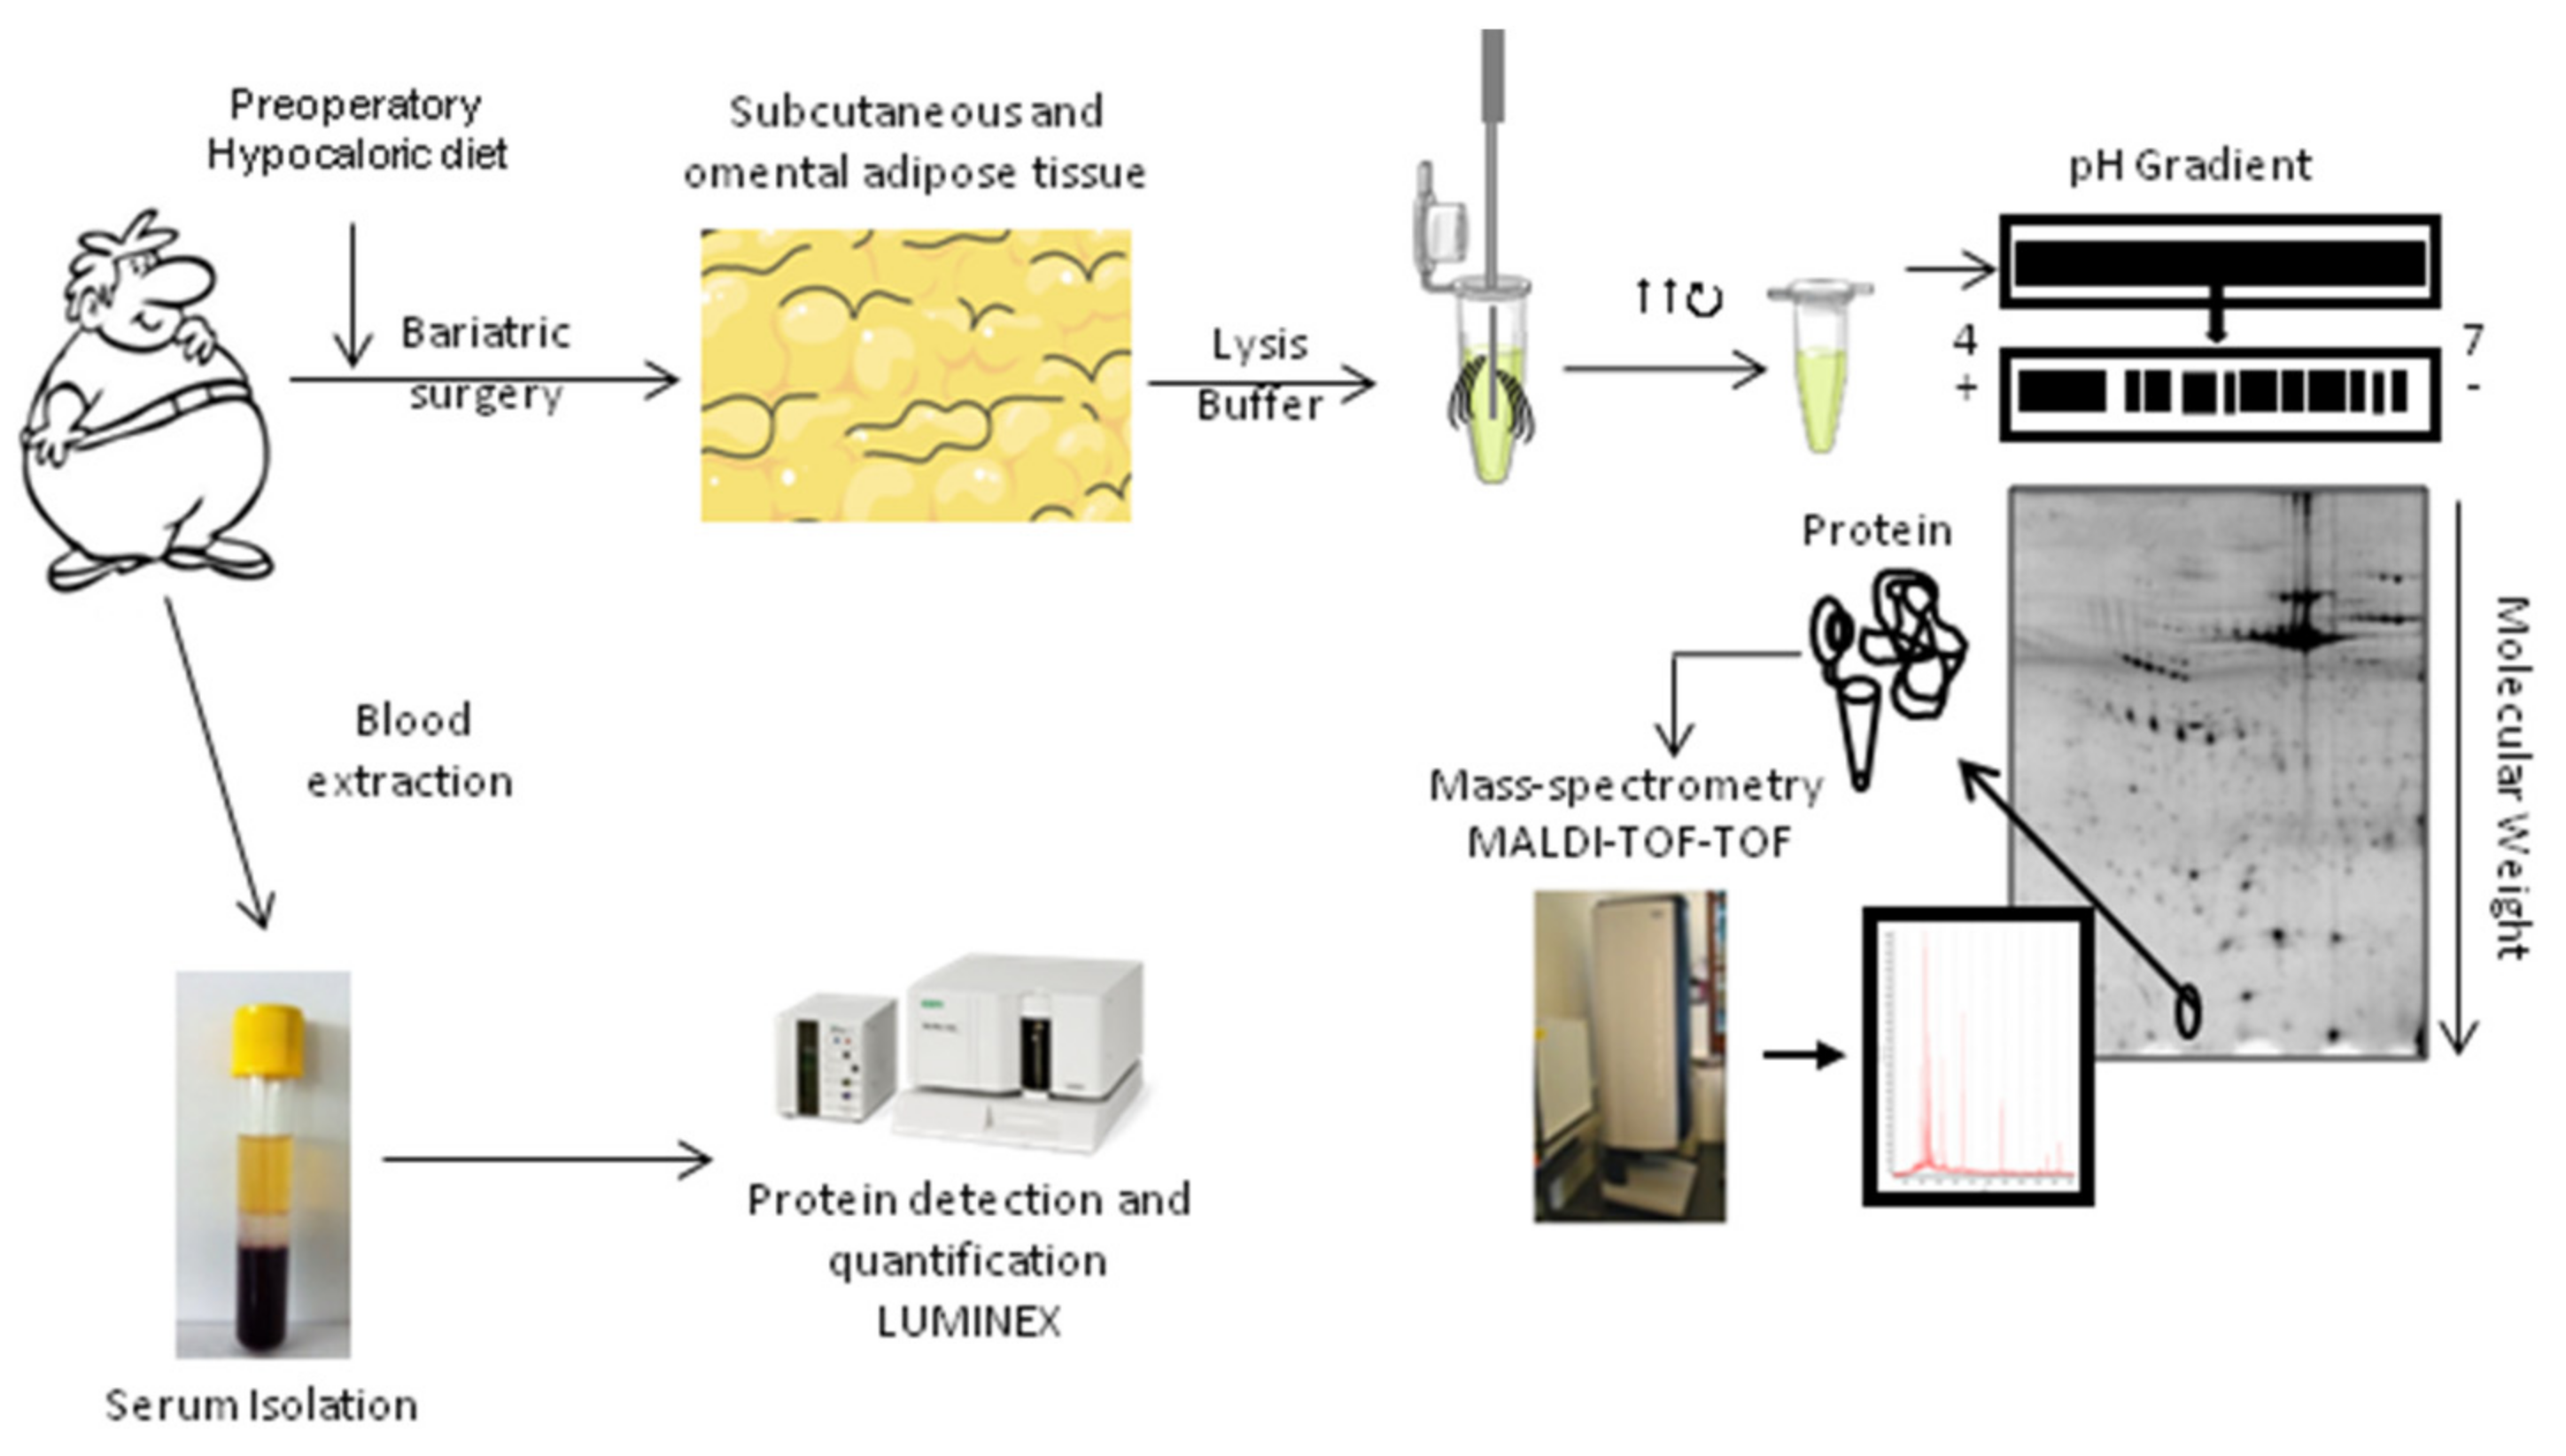
4. Materials and Methods
4.1. Study Population
4.2. Sample Collection
4.3. Biochemical Analysis
4.4. Two-Dimensional Gel Electrophoresis (2-DE)
4.5. Western Blot Analysis
4.6. Mass Spectrometry Analysis
4.7. Quantification of Serum Protein Levels
4.8. In Silico Analysis
4.9. Statistical Analysis
5. Conclusions
Supplementary Materials
Author Contributions
Funding
Institutional Review Board Statement
Informed Consent Statement
Data Availability Statement
Acknowledgments
Conflicts of Interest
Abbreviations
References
- Ray, I.; Bhattacharya, A.; De, R.K. OCDD: An obesity and co-morbid disease database. BioData Min. 2017, 10, 33. [Google Scholar] [CrossRef] [Green Version]
- Badimon, L.; Bugiardini, R.; Cenko, E.; Cubedo, J.; Dorobantu, M.; Duncker, D.J.; Estruch, R.; Milicic, D.; Tousoulis, D.; Vasiljevic, Z.; et al. Position paper of the European Society of Cardiology-working group of coronary pathophysiology and microcirculation: Obesity and heart disease. Eur. Heart J. 2017, 38, 1951–1958. [Google Scholar] [CrossRef] [Green Version]
- Wozniak, S.E.; Gee, L.L.; Wachtel, M.S.; Frezza, E.E. Adipose tissue: The new endocrine organ? A review article. Dig. Dis. Sci. 2009, 54, 1847–1856. [Google Scholar] [CrossRef] [PubMed]
- Shibata, R.; Ouchi, N.; Ohashi, K.; Murohara, T. The role of adipokines in cardiovascular disease. J. Cardiol. 2017, 70, 329–334. [Google Scholar] [CrossRef] [Green Version]
- Badimon, L.; Cubedo, J. Adipose tissue depots and inflammation: Effects on plasticity and resident mesenchymal stem cell function. Cardiovasc. Res. 2017, 113, 1064–1073. [Google Scholar] [CrossRef] [PubMed] [Green Version]
- Peinado, J.R.; Jimenez-Gomez, Y.; Pulido, M.R.; Ortega-Bellido, M.; Diaz-Lopez, C.; Padillo, F.J.; Lopez-Miranda, J.; Vazquez-Martinez, R.; Malagon, M.M. The stromal-vascular fraction of adipose tissue contributes to major differences between subcutaneous and visceral fat depots. Proteomics 2010, 10, 3356–3366. [Google Scholar] [CrossRef] [PubMed]
- Antonopoulos, A.S.; Tousoulis, D. The molecular mechanisms of obesity paradox. Cardiovasc. Res. 2017, 113, 1074–1086. [Google Scholar] [CrossRef]
- Wajchenberg, B.L. Subcutaneous and visceral adipose tissue: Their relation to the metabolic syndrome. Endocr. Rev. 2000, 21, 697–738. [Google Scholar] [CrossRef]
- Onate, B.; Vilahur, G.; Camino-Lopez, S.; Diez-Caballero, A.; Ballesta-Lopez, C.; Ybarra, J.; Moscatiello, F.; Herrero, J.; Badimon, L. Stem cells isolated from adipose tissue of obese patients show changes in their transcriptomic profile that indicate loss in stemcellness and increased commitment to an adipocyte-like phenotype. BMC Genom. 2013, 14, 625. [Google Scholar] [CrossRef] [Green Version]
- Onate, B.; Vilahur, G.; Ferrer-Lorente, R.; Ybarra, J.; Diez-Caballero, A.; Ballesta-Lopez, C.; Moscatiello, F.; Herrero, J.; Badimon, L. The subcutaneous adipose tissue reservoir of functionally active stem cells is reduced in obese patients. FASEB J. Off. Publ. Fed. Am. Soc. Exp. Biol. 2012, 26, 4327–4336. [Google Scholar]
- Bejar, M.T.; Ferrer-Lorente, R.; Pena, E.; Badimon, L. Inhibition of Notch rescues the angiogenic potential impaired by cardiovascular risk factors in epicardial adipose stem cells. FASEB J. Off. Publ. Fed. Am. Soc. Exp. Biol. 2016, 30, 2849–2859. [Google Scholar] [CrossRef] [PubMed]
- Ferrer-Lorente, R.; Bejar, M.T.; Badimon, L. Notch signaling pathway activation in normal and hyperglycemic rats differs in the stem cells of visceral and subcutaneous adipose tissue. Stem Cells Dev. 2014, 23, 3034–3048. [Google Scholar] [CrossRef] [PubMed] [Green Version]
- Tous, M.; Ferrer-Lorente, R.; Badimon, L. Selective inhibition of sphingosine kinase-1 protects adipose tissue against LPS-induced inflammatory response in Zucker diabetic fatty rats. Am. J. Physiol. Endocrinol. Metab. 2014, 307, E437–E446. [Google Scholar] [CrossRef] [PubMed] [Green Version]
- Visseren, F.L.J.; Mach, F.; Smulders, Y.M.; Carballo, D.; Koskinas, K.C.; Back, M.; Benetos, A.; Biffi, A.; Boavida, J.M.; Capodanno, D.; et al. 2021 ESC Guidelines on cardiovascular disease prevention in clinical practice: Developed by the Task Force for cardiovascular disease prevention in clinical practice with representatives of the European Society of Cardiology and 12 medical societies With the special contribution of the European Association of Preventive Cardiology (EAPC). Rev. Esp. Cardiol. 2022, 75, 429. [Google Scholar]
- Amundson, D.E.; Djurkovic, S.; Matwiyoff, G.N. The obesity paradox. Crit. Care Clin. 2010, 26, 583–596. [Google Scholar] [CrossRef]
- Horwich, T.B.; Fonarow, G.C.; Clark, A.L. Obesity and the Obesity Paradox in Heart Failure. Prog. Cardiovasc. Dis. 2018, 61, 151–156. [Google Scholar] [CrossRef]
- Abbott, R.D.; Borowsky, F.E.; Quinn, K.P.; Bernstein, D.L.; Georgakoudi, I.; Kaplan, D.L. Non-invasive Assessments of Adipose Tissue Metabolism In Vitro. Ann. Biomed. Eng. 2016, 44, 725–732. [Google Scholar] [CrossRef] [Green Version]
- Despres, J.P.; Lemieux, I. Abdominal obesity and metabolic syndrome. Nature 2006, 444, 881–887. [Google Scholar] [CrossRef]
- Insenser, M.; Montes-Nieto, R.; Vilarrasa, N.; Lecube, A.; Simo, R.; Vendrell, J.; Escobar-Morreale, H.F. A nontargeted proteomic approach to the study of visceral and subcutaneous adipose tissue in human obesity. Mol. Cell. Endocrinol. 2012, 363, 10–19. [Google Scholar] [CrossRef]
- Oikonomou, E.K.; Antoniades, C. The role of adipose tissue in cardiovascular health and disease. Nat. Rev. Cardiol. 2019, 16, 83–99. [Google Scholar] [CrossRef]
- Peinado, J.R.; Pardo, M.; de la Rosa, O.; Malagon, M.M. Proteomic characterization of adipose tissue constituents, a necessary step for understanding adipose tissue complexity. Proteomics 2012, 12, 607–620. [Google Scholar] [CrossRef] [PubMed]
- Perez-Perez, R.; Ortega-Delgado, F.J.; Garcia-Santos, E.; Lopez, J.A.; Camafeita, E.; Ricart, W.; Fernandez-Real, J.M.; Peral, B. Differential proteomics of omental and subcutaneous adipose tissue reflects their unalike biochemical and metabolic properties. J. Proteome Res. 2009, 8, 1682–1693. [Google Scholar] [CrossRef] [PubMed]
- Kusminski, C.M.; Bickel, P.E.; Scherer, P.E. Targeting adipose tissue in the treatment of obesity-associated diabetes. Nat. Rev. Drug Discov. 2016, 15, 639–660. [Google Scholar] [CrossRef] [PubMed]
- Chang, E.; Varghese, M.; Singer, K. Gender and Sex Differences in Adipose Tissue. Curr. Diabetes Rep. 2019, 18, 69. [Google Scholar] [CrossRef]
- Abildgaard, J.; Ploug, T.; Al-Saoudi, E.; Wagner, T.; Thomsen, C.; Ewertsen, C.; Bzorek, M.; Pedersen, B.K.; Pedersen, A.T.; Lindegaard, B. Changes in abdominal subcutaneous adipose tissue phenotype following menopause is associated with increased visceral fat mass. Sci. Rep. 2021, 11, 1475026. [Google Scholar] [CrossRef] [PubMed]
- Murri, M.; Insenser, M.; Bernal-Lopez, M.R.; Perez-Martinez, P.; Escobar-Morreale, H.F.; Tinahones, F.J. Proteomic analysis of visceral adipose tissue in pre-obese patients with type 2 diabetes. Mol. Cell. Endocrinol. 2013, 376, 99–106. [Google Scholar] [CrossRef] [PubMed]
- Ibrahim, M.M. Subcutaneous and visceral adipose tissue: Structural and functional differences. Obes. Rev. Off. J. Int. Assoc. Study Obes. 2010, 11, 11–18. [Google Scholar] [CrossRef]
- Lawson, H.A.; Zayed, M.; Wayhart, J.P.; Fabbrini, E.; Love-Gregory, L.; Klein, S.; Semenkovich, C.F. Physiologic and genetic evidence links hemopexin to triglycerides in mice and humans. Int. J. Obes. 2017, 41, 631–638. [Google Scholar] [CrossRef] [Green Version]
- Yang, W.; Thein, S.; Lim, C.Y.; Ericksen, R.E.; Sugii, S.; Xu, F.; Robinson, R.C.; Kim, J.B.; Han, W. Arp2/3 complex regulates adipogenesis by controlling cortical actin remodelling. Biochem. J. 2014, 464, 179–192. [Google Scholar] [CrossRef]
- Groot, K.R.; Sevilla, L.M.; Nishi, K.; DiColandrea, T.; Watt, F.M. Kazrin, a novel periplakin-interacting protein associated with desmosomes and the keratinocyte plasma membrane. J. Cell Biol. 2004, 166, 653–659. [Google Scholar] [CrossRef] [Green Version]
- Karashima, T.; Watt, F.M. Interaction of periplakin and envoplakin with intermediate filaments. J. Cell Sci. 2002, 115, 5027–5037. [Google Scholar] [CrossRef] [PubMed] [Green Version]
- Liu, C.; Wang, J.; Hu, Y.; Xie, H.; Liu, M.; Tang, H. Upregulation of kazrin F by miR-186 suppresses apoptosis but promotes epithelial-mesenchymal transition to contribute to malignancy in human cervical cancer cells. Chin. J. Cancer Res. 2017, 29, 45–56. [Google Scholar] [CrossRef] [PubMed]
- Ohno, S. The genetic background of arrhythmogenic right ventricular cardiomyopathy. J. Arrhythmia 2016, 32, 398–403. [Google Scholar] [CrossRef] [Green Version]
- Hasegawa, K.; Wakino, S.; Kimoto, M.; Minakuchi, H.; Fujimura, K.; Hosoya, K.; Komatsu, M.; Kaneko, Y.; Kanda, T.; Tokuyama, H.; et al. The hydrolase DDAH2 enhances pancreatic insulin secretion by transcriptional regulation of secretagogin through a Sirt1-dependent mechanism in mice. FASEB J. Off. Publ. Fed. Am. Soc. Exp. Biol. 2013, 27, 2301–2315. [Google Scholar] [CrossRef] [PubMed]
- Fernandez-Sanchez, A.; Madrigal-Santillan, E.; Bautista, M.; Esquivel-Soto, J.; Morales-Gonzalez, A.; Esquivel-Chirino, C.; Durante-Montiel, I.; Sanchez-Rivera, G.; Valadez-Vega, C.; Morales-Gonzalez, J.A. Inflammation, oxidative stress, and obesity. Int. J. Mol. Sci. 2011, 12, 3117–3132. [Google Scholar] [CrossRef] [Green Version]
- Matsuda, M.; Shimomura, I. Increased oxidative stress in obesity: Implications for metabolic syndrome, diabetes, hypertension, dyslipidemia, atherosclerosis, and cancer. Obes. Res. Clin. Pract. 2013, 7, e330–e341. [Google Scholar] [CrossRef]
- Fisher, A.B. Peroxiredoxin 6 in the repair of peroxidized cell membranes and cell signaling. Arch. Biochem. Biophys. 2017, 617, 68–83. [Google Scholar] [CrossRef] [Green Version]
- Doukali, H.; Ben Salah, G.; Hamdaoui, L.; Hajjaji, M.; Tabebi, M.; Ammar-Keskes, L.; Masmoudi, M.E.; Kamoun, H. Oxidative stress and glutathione S-transferase genetic polymorphisms in medical staff professionally exposed to ionizing radiation. Int. J. Radiat. Biol. 2017, 93, 697–704. [Google Scholar] [CrossRef]
- Okada, K.; Fukui, M.; Zhu, B.T. Protein disulfide isomerase mediates glutathione depletion-induced cytotoxicity. Biochem. Biophys. Res. Commun. 2016, 477, 495–502. [Google Scholar] [CrossRef]
- Bruun, J.M.; Lihn, A.S.; Pedersen, S.B.; Richelsen, B. Monocyte chemoattractant Protein-1 release is higher in visceral than subcutaneous human adipose tissue (AT): Implication of macrophages resident in the AT. J. Clin. Endocrinol. Metab. 2005, 90, 2282–2289. [Google Scholar] [CrossRef]
- Joyner, J.M.; Hutley, L.J.; Cameron, D.P. Glucocorticoid receptors in human preadipocytes: Regional and gender variations. J. Endocrinol. 2000, 166, 145. [Google Scholar] [CrossRef] [PubMed]
- Amer, P. Differences in lipolysis between human subcutaneousand omental adipose tissues. Ann. Med. 1995, 27, 435–438. [Google Scholar]
- Trujillo, M.E.; Scherer, P.E. Adipose tissue-derived factors: Impact on health and disease. Endocr. Rev. 2006, 27, 762–778. [Google Scholar] [CrossRef] [PubMed]
- Vasilenko, M.A.; Kirienkova, E.V.; Skuratovskaia, D.A.; Zatolokin, P.A.; Mironyuk, N.I.; Litvinova, L.S. The role of production of adipsin and leptin in the development of insulin resistance in patients with abdominal obesity. Dokl. Biochem. Biophys. 2017, 475, 271–276. [Google Scholar] [CrossRef]
- Fantuzzi, G. Adipose tissue, adipokines, and inflammation. J. Allergy Clin. Immunol. 2005, 115, 911–919; quiz 920. [Google Scholar] [CrossRef]
- Mizokami, A.; Kawakubo-Yasukochi, T.; Hirata, M. Osteocalcin and its endocrine functions. Biochem. Pharmacol. 2017, 132, 1–8. [Google Scholar] [CrossRef]
- Bruun, J.M.; Lihn, A.S.; Madan, A.K.; Pedersen, S.B.; Schiøtt, K.M.; Fain, -J.N.; Richelse, B. Higher production of IL-8 in visceral vs. subcutaneousadipose tissue. Implication of nonadipose cells in adipose tissue. Am. J. Physiol. Endocrinol. Metab. 2004, 286, 8–13. [Google Scholar] [CrossRef]
- Patel, P.; Abate, N. Body fat distribution and insulin resistance. Nutrients 2013, 5, 2019–2027. [Google Scholar] [CrossRef]
- Lontchi-Yimagou, E.; Sobngwi, E.; Matsha, T.E.; Kengne, A.P. Diabetes mellitus and inflammation. Curr. Diabetes Rep. 2013, 13, 435–444. [Google Scholar] [CrossRef]
- Nauck, M.A.; Meier, J.J. Incretin hormones: Their role in health and disease. Diabetes Obes. Metab. 2018, 20 (Suppl. S1), 5–21. [Google Scholar] [CrossRef]
- Joao, A.L.; Reis, F.; Fernandes, R. The incretin system ABCs in obesity and diabetes—Novel therapeutic strategies for weight loss and beyond. Obes. Rev. Off. J. Int. Assoc. Study Obes. 2016, 17, 553–572. [Google Scholar] [CrossRef] [PubMed]
- Supriya, R.; Tam, B.T.; Yu, A.P.; Lee, P.H.; Lai, C.W.; Cheng, K.K.; Yau, S.Y.; Chan, L.W.; Yung, B.Y.; Sheridan, S.; et al. Adipokines demonstrate the interacting influence of central obesity with other cardiometabolic risk factors of metabolic syndrome in Hong Kong Chinese adults. PLoS ONE 2018, 13, e0201585. [Google Scholar] [CrossRef] [PubMed]
- Lo, J.C.; Ljubicic, S.; Leibiger, B.; Kern, M.; Leibiger, I.B.; Moede, T.; Kelly, M.E.; Chatterjee Bhowmick, D.; Murano, I.; Cohen, P.; et al. Adipsin is an adipokine that improves beta cell function in diabetes. Cell 2014, 158, 41–53. [Google Scholar] [CrossRef] [PubMed]
- Corton, M.; Botella-Carretero, J.I.; Lopez, J.A.; Camafeita, E.; San Millan, J.L.; Escobar-Morreale, H.F.; Peral, B. Proteomic analysis of human omental adipose tissue in the polycystic ovary syndrome using two-dimensional difference gel electrophoresis and mass spectrometry. Hum. Reprod. 2008, 23, 651–661. [Google Scholar] [CrossRef] [Green Version]
- Cubedo, J.; Padro, T.; Garcia-Moll, X.; Pinto, X.; Cinca, J.; Badimon, L. Proteomic signature of Apolipoprotein J in the early phase of new-onset myocardial infarction. J. Proteome Res. 2011, 10, 211–220. [Google Scholar] [CrossRef]
- Gallinat, A.; Vilahur, G.; Padro, T.; Badimon, L. Network-Assisted Systems Biology Analysis of the Mitochondrial Proteome in a Pre-Clinical Model of Ischemia, Revascularization and Post-Conditioning. Int. J. Mol. Sci. 2022, 23, 2087. [Google Scholar] [CrossRef]
- Szklarczyk, D.; Gable, A.L.; Nastou, K.C.; Lyon, D.; Kirsch, R.; Pyysalo, S.; Doncheva, N.T.; Legeay, M.; Fang, T.; Bork, P.; et al. The STRING database in 2021: Customizable protein-protein networks, and functional characterization of user-uploaded gene/measurement sets. Nucleic Acids Res. 2021, 49, D605–D612. [Google Scholar] [CrossRef]
- Shannon, P.; Markiel, A.; Ozier, O.; Baliga, N.S.; Wang, J.T.; Ramage, D.; Amin, N.; Schwikowski, B.; Ideker, T. Cytoscape: A software environment for integrated models of biomolecular interaction networks. Genome Res. 2003, 13, 2498–2504. [Google Scholar] [CrossRef]
- Gu, Z.; Eils, R.; Schlesner, M. Complex heatmaps reveal patterns and correlations in multidimensional genomic data. Bioinformatics 2016, 32, 2847–2849. [Google Scholar] [CrossRef]

| Effect of T2DM | Effect of Obesity | Effect of Obesity and T2DM | |
|---|---|---|---|
| OB-T2DM vs. OB-nonT2DM | OB-nonT2DM vs. nonOB-nonT2DM | OB-T2DM vs. nonOB-nonT2DM | |
| leptin (ng/mL) | 0.713 | <0.01 | <0.01 |
| insulin (pg/mL) | 0.52 | 0.01 | <0.01 |
| chitinase 3-like 1 (ng/mL) | 0.01 | 0.66 | <0.01 |
| C-peptide (ng/mL) | 0.86 | 0.03 | <0.01 |
| TNF-R1 (ng/mL) | <0.01 | 0.03 | <0.01 |
| ghrelin (pg/mL) | 0.82 | <0.01 | <0.01 |
| GLP-1 (pg/mL) | 0.18 | 0.01 | <0.01 |
| glucagon (pg/mL) | 0.08 | 0.03 | <0.01 |
| IL-6Ra (ng/mL) | 0.04 | 0.04 | 0.84 |
| TWEAK/TNFSF12 (pg/mL) | 0.33 | 0.03 | 0.16 |
| adiponectin (μg/mL) | 0.75 | 0.01 | <0.01 |
| osteocalcin (ng/mL) | 0.33 | <0.01 | 0.01 |
| MMP-2 (ng/mL) | 0.59 | <0.01 | <0.01 |
| PAI-1 (ng/mL) | 0.96 | 0.05 | 0.16 |
| GIP (pg/mL) | 0.71 | 0.06 | 0.02 |
| adipsin (μg/mL) | <0.01 | 0.07 | 0.01 |
| TNF-R2 (pg/mL) | 0.03 | 0.41 | 0.10 |
| BAFF/TNFSF13B (ng/mL) | 0.05 | 0.55 | 0.06 |
| OPN (ng/mL) | 0.05 | 0.16 | 0.58 |
| MMP-3 (ng/mL) | 0.03 | 0.24 | 0.26 |
| IL-8 (pg/mL) | 0.05 | 0.43 | 0.08 |
| VAT vs. SAT | |||||||
|---|---|---|---|---|---|---|---|
| ALL (n = 12) | OB-nonT2DM (n = 6) | OB-T2DM (n = 6) | |||||
| Protein Name | Gene | logFC | p Value | logFC | p Value | logFC | p Value |
| ATP-binding cassette sub-family G member 8 | ABCG8 | 0.49 | 0.01 | 0.61 | 0.06 | 0.01 | 0.31 |
| Annexin 1 | ANXA1 | 0.61 | 0.04 | 0.23 | 0.69 | 1.07 | 0.03 |
| Apolipoprotein A1 | APOA1 | −0.23 | 0.47 | −0.16 | 0.44 | 0.41 | 0.03 |
| Apo E | APOE | −0.36 | 0.38 | −0.36 | 0.38 | −2.25 | 0.03 |
| N(G)-dimethylarginine dimethylaminohydrolase 2 | DDHA2 | 0.64 | 0.00 | 0.78 | 0.03 | 0.13 | 0.13 |
| Fumarylacetoacetase | FAH | −0.81 | 0.05 | −1.02 | 0.06 | −0.99 | 0.31 |
| Fibrinogen gamma chain | FGG | 1.63 | 0.00 | 1.79 | 0.03 | 1.15 | 0.03 |
| Ferritin light chain | FTL | 1.23 | 0.05 | 1.26 | 0.03 | 0.13 | 0.63 |
| Glutathione S-transferase P | GSTP1 | 0.56 | 0.02 | 0.88 | 0.03 | 0.19 | 0.81 |
| Hemopexin | HPX | −0.17 | 0.03 | −0.06 | 0.31 | −0.33 | 0.06 |
| Kazrin | KAZN | 2.19 | 0.00 | 1.21 | 0.03 | 3.74 | 0.06 |
| Inorganic pyrophosphatase | PPA2 | 0.37 | 0.20 | 0.58 | 0.03 | 0.20 | 1.00 |
| Transmembrane and coiled-coil domain-containing protein 7 | TMCO7 | 0.56 | 0.00 | 1.03 | 0.13 | 0.40 | 0.03 |
| Top 5 Gene Ontology Biological Process Enrichments | ||
|---|---|---|
| ID | Term | FDR |
| GO.0002576 | Platelet degranulation | 7.10 × 10⁻⁸ |
| GO.0046903 | Secretion | 1.08 × 10⁻⁶ |
| GO.0045055 | Regulated exocytosis | 4.87 × 10⁻⁶ |
| GO.0032940 | Secretion by cell | 4.87 × 10⁻⁶ |
| GO.0009611 | Response to wounding | 9.12 × 10⁻⁶ |
| Biochemical Parameters | Protein | SAT | VAT | ||
|---|---|---|---|---|---|
| R2 | p | R2 | p | ||
| Glucose | alcohol DH [NADP+] | 0.039 | 0.638 | 0.392 | 0.05 |
| apolipoprotein E | 0.139 | 0.53 | 0.635 | 0.03 | |
| protein disulfide isomerase A3 | 0.389 | 0.04 | 0.101 | 0.34 | |
| Tryglicerides | annexin A5 | 0.017 | 0.7 | 0.385 | 0.04 |
| apolipoprotein A1 | 0.291 | 0.08 | 0.331 | 0.03 | |
| breast carcinoma-amplified seq-1 | 0.558 | <0.01 | 0.004 | 0.82 | |
| haptoglobin | 0.08 | 0.39 | 0.371 | 0.04 | |
| hemopexin | 0.477 | 0.01 | 0.216 | 0.15 | |
| retinal DH | 0.412 | 0.03 | 0.113 | 0.31 | |
| protein disulfide isomerase A3 | 0.203 | 0.61 | 0.476 | 0.02 | |
| paroxiredoxin 2 | 0.496 | 0.02 | 0.03 | 0.61 | |
| ribonuclease inhibitor | 0.552 | <0.01 | 0.153 | 0.23 | |
| HDL | alpha-1 antitrypsin | 0.414 | 0.04 | 0.116 | 0.33 |
| annexin A5 | 0.001 | 0.82 | 0.459 | 0.03 | |
| D2 dopamine receptor | 0.495 | 0.02 | 0.066 | 0.47 | |
| L-lactate DH A chain | 0.454 | 0.03 | 0.551 | 0.01 | |
| LDL | actin. Aortic smooth muscle | 0.652 | <0.01 | 0.385 | 0.04 |
| annexin A3 | 0.41 | 0.04 | 0.009 | 0.77 | |
| apolipoprotein E | 0.551 | 0.15 | 0.636 | 0.03 | |
| breast carcinoma-amplified seq-1 | 0.544 | 0.01 | 0.02 | 0.69 | |
| creatine kinase B-type | 0.844 | <0.01 | 0.001 | 0.91 | |
| glycerol-3-phosphate DH [NAD+] | 0.398 | 0.03 | 0.001 | 0.92 | |
| haptoglobin | 0.003 | 0.87 | 0.373 | 0.04 | |
| HSP 60 | 0.396 | 0.03 | 0.042 | 0.54 | |
| intelectin-1 | 0.399 | 0.03 | 0.234 | 0.132 | |
| retinal DH | 0.67 | <0.01 | 0.029 | 0.62 | |
| paroxiredoxin 2 | 0.588 | 0.01 | 0.082 | 0.39 | |
| serine/threonine protein kinase | 0.753 | <0.01 | 0.044 | 0.53 | |
| tropomyosin beta chain | 0.137 | 0.29 | 0.424 | 0.03 | |
| Cholesterol | 14-3-3 Protein alpha/beta | 0.479 | 0.01 | 0.04 | 0.55 |
| 14-3-3 Protein gamma | 0.57 | <0.01 | 0.247 | 0.24 | |
| 14-3-3 Protein zeta/delta | 0.514 | 0.01 | 0.338 | 0.06 | |
| 26S protein regulatory subunit 6B | 0.179 | 0.29 | 0.696 | <0.01 | |
| ADP/ATP Translocase 3 | 0.38 | 0.04 | 0.092 | 0.39 | |
| alpha-1 antitrypsin | 0.582 | <0.01 | 0.003 | 0.87 | |
| annexin A5 | 0.001 | 0.8 | 0.359 | 0.05 | |
| apolipoprotein A1 | 0.022 | 0.66 | 0.44 | 0.02 | |
| collagen alpha-1 (XIII) chain | 0.39 | 0.05 | 0.496 | 0.02 | |
| fibrinogen gamma chain | 0.117 | 0.3 | 0.378 | 0.04 | |
| haptoglobin | 0.535 | 0.01 | 0.213 | 0.15 | |
| hemopexin | 0.196 | 0.17 | 0.446 | 0.02 | |
| HSP 60 | 0.002 | 0.88 | 0.463 | 0.03 | |
| serine/threonine protein kinase | 0.251 | 0.11 | 0.433 | 0.02 | |
| T2DM vs. nonT2DM | |||||
|---|---|---|---|---|---|
| SAT | VAT | ||||
| Protein Name | Gene | logFC | p Value | logFC | p Value |
| Alpha-1B-glycoprotein | A1BG | 0.19 | 0.54 | 1.27 | 0.01 |
| Actin. aortic smooth muscle | ACTA2 | −2.62 | 0.03 | −1.60 | 0.39 |
| Albumin | ALB | 3.26 | 0.02 | 2.69 | 0.06 |
| Annexin A3 | ANXA3 | −0.99 | 0.00 | −1.23 | 0.00 |
| Annexin A8-like protein 2 | ANXA8L1 | −0.69 | 0.80 | −1.48 | 0.00 |
| Apolipoprotein A1 | APOA1 | −1.64 | 0.02 | −1.06 | 0.70 |
| Actin-related protein 2 | ARP2 | −0.98 | 0.48 | −0.43 | 0.02 |
| Collagen alpha-1(XIII) chain | COLBA1 | −2.16 | 0.13 | −2.85 | 0.05 |
| Cytochrome c oxidase subunit 7A-related protein, mitochondrial | COX7A2L | 1.40 | 0.04 | 0.54 | 0.25 |
| Fibrinogen gamma chain | FGG | −0.74 | 0.13 | −1.38 | 0.01 |
| Haptoglobin | HP | 1.25 | 0.04 | 1.60 | 0.04 |
| Hemopexin | HPX | 0.69 | 0.24 | 0.42 | 0.04 |
| HSP 27 | HSPB1 | −3.18 | 0.06 | −1.72 | 0.00 |
| HSP 60 | HSPD1 | −0.88 | 0.00 | −0.39 | 0.82 |
| Protein disulfide isomerase | PD1 | 1.65 | 0.41 | 1.41 | 0.00 |
| Selenium-binding protein 1 | SELENBP1 | 0.95 | 0.00 | 0.54 | 0.70 |
| Antithrombin III | SERPINC1 | 1.13 | 0.48 | 3.14 | 0.01 |
| Solute carrier family 25 member 6 | SLC25A6 | 1.18 | 0.06 | 1.07 | 0.00 |
| 26S protease regulatory subunit 6B | PSMC4 | −1.17 | 0.05 | −1.18 | 0.26 |
| Transthyretin | TTR | 0.31 | 0.25 | 0.44 | 0.03 |
| Ubiquitin carboxyl-terminal hydrolase isozyme 1 | UCHL1 | 1.22 | 0.04 | 0.36 | 0.39 |
| Vimentin | VIM | −0.84 | 0.39 | −0.14 | 0.82 |
| 14-3-3 protein b/a | YWHAB | −0.98 | 0.03 | −1.40 | 0.00 |
| 14-3-3 protein gamma | YWHAG | −0.20 | 0.48 | −0.68 | 0.06 |
| 14-3-3 protein zeta/delta | YWHAZ | −1.63 | 0.03 | −1.37 | 0.04 |
| Top 5 Gene Ontology Biological Process Enrichments | |||||
|---|---|---|---|---|---|
| VAT T2DM vs. nonT2DM | SAT T2DM vs. nonT2DM | ||||
| ID | Term | FDR | ID | Term | FDR |
| GO.0006810 | Transport | 4.62 × 10⁻¹⁰ | GO.0006950 | Response to stress | 8.64 × 10⁻⁸ |
| GO.0045055 | Regulated exocytosis | 8.62 × 10⁻⁸ | GO.0051234 | Establishment of localization | 2.20 × 10⁻⁷ |
| GO.0002576 | Platelet degranulation | 8.62 × 10⁻⁸ | GO.0009894 | Regulation of catabolic process | 3.29 × 10⁻⁷ |
| GO.0046903 | Secretion | 2.88 × 10⁻⁷ | GO.0006810 | Transport | 1.19 × 10⁻⁶ |
| GO.0016192 | Vesicle-mediated transport | 2.88 × 10⁻⁷ | GO.0031329 | Regulation of cellular catabolic process | 1.25 × 10⁻⁶ |
| nonT2DM (N = 6) | T2DM (N = 6) | |
|---|---|---|
| Age | 50 ± 3 | 53 ± 3 |
| BMI (kg/m2) | 43.6 ± 1.0 | 43.3 ± 1.3 |
| Gender (M/W) | 3/3 | 3/3 |
| CV Risk factors | 1 | 3–5 |
| FBG (mg/dL) | 127.6 ± 19.5 | 149.4 ± 13.6 |
| TG (mg/dL) | 173.2 ± 37.8 | 170.8 ± 12.7 |
| Cholesterol (mg/dL) | 168.4 ± 12.2 | 197.8 ± 21.9 |
| HDL (mg/dL) | 33.5 ± 4.0 | 39.5 ± 8.4 |
| LDL (mg/dL) | 226.8 ± 57.1 | 170.2 ± 40.8 |
| Urea (mg/dL) | 28.2 ± 5.1 | 47.3 ± 18.6 |
| Total proteins (g/dL) | 6.9 ± 0.3 | 7.5 ± 0.4 |
| AST UL | 25.0 ± 4.6 | 17.6 ± 2.8 |
| ALT UL | 20.8 ± 4.6 | 15.4 ± 2.8 |
| AST/ALT | 0.9 ± 0.2 | 1.0 ± 0.1 |
| Creatinine | 1.0 ± 0.1 | 1.1 ± 0.2 |
Disclaimer/Publisher’s Note: The statements, opinions and data contained in all publications are solely those of the individual author(s) and contributor(s) and not of MDPI and/or the editor(s). MDPI and/or the editor(s) disclaim responsibility for any injury to people or property resulting from any ideas, methods, instructions or products referred to in the content. |
© 2023 by the authors. Licensee MDPI, Basel, Switzerland. This article is an open access article distributed under the terms and conditions of the Creative Commons Attribution (CC BY) license (https://creativecommons.org/licenses/by/4.0/).
Share and Cite
Arderiu, G.; Mendieta, G.; Gallinat, A.; Lambert, C.; Díez-Caballero, A.; Ballesta, C.; Badimon, L. Type 2 Diabetes in Obesity: A Systems Biology Study on Serum and Adipose Tissue Proteomic Profiles. Int. J. Mol. Sci. 2023, 24, 827. https://doi.org/10.3390/ijms24010827
Arderiu G, Mendieta G, Gallinat A, Lambert C, Díez-Caballero A, Ballesta C, Badimon L. Type 2 Diabetes in Obesity: A Systems Biology Study on Serum and Adipose Tissue Proteomic Profiles. International Journal of Molecular Sciences. 2023; 24(1):827. https://doi.org/10.3390/ijms24010827
Chicago/Turabian StyleArderiu, Gemma, Guiomar Mendieta, Alex Gallinat, Carmen Lambert, Alberto Díez-Caballero, Carlos Ballesta, and Lina Badimon. 2023. "Type 2 Diabetes in Obesity: A Systems Biology Study on Serum and Adipose Tissue Proteomic Profiles" International Journal of Molecular Sciences 24, no. 1: 827. https://doi.org/10.3390/ijms24010827
APA StyleArderiu, G., Mendieta, G., Gallinat, A., Lambert, C., Díez-Caballero, A., Ballesta, C., & Badimon, L. (2023). Type 2 Diabetes in Obesity: A Systems Biology Study on Serum and Adipose Tissue Proteomic Profiles. International Journal of Molecular Sciences, 24(1), 827. https://doi.org/10.3390/ijms24010827