
Extended Exposure Topotecan Significantly Improves Long-Term Drug Sensitivity by Decreasing Malignant Cell Heterogeneity and by Preventing Epithelial–Mesenchymal Transition

 , ,
, , 
Abstract
1. Introduction
2. Overview of Epithelial–Mesenchymal Transition (EMT)
3. Results
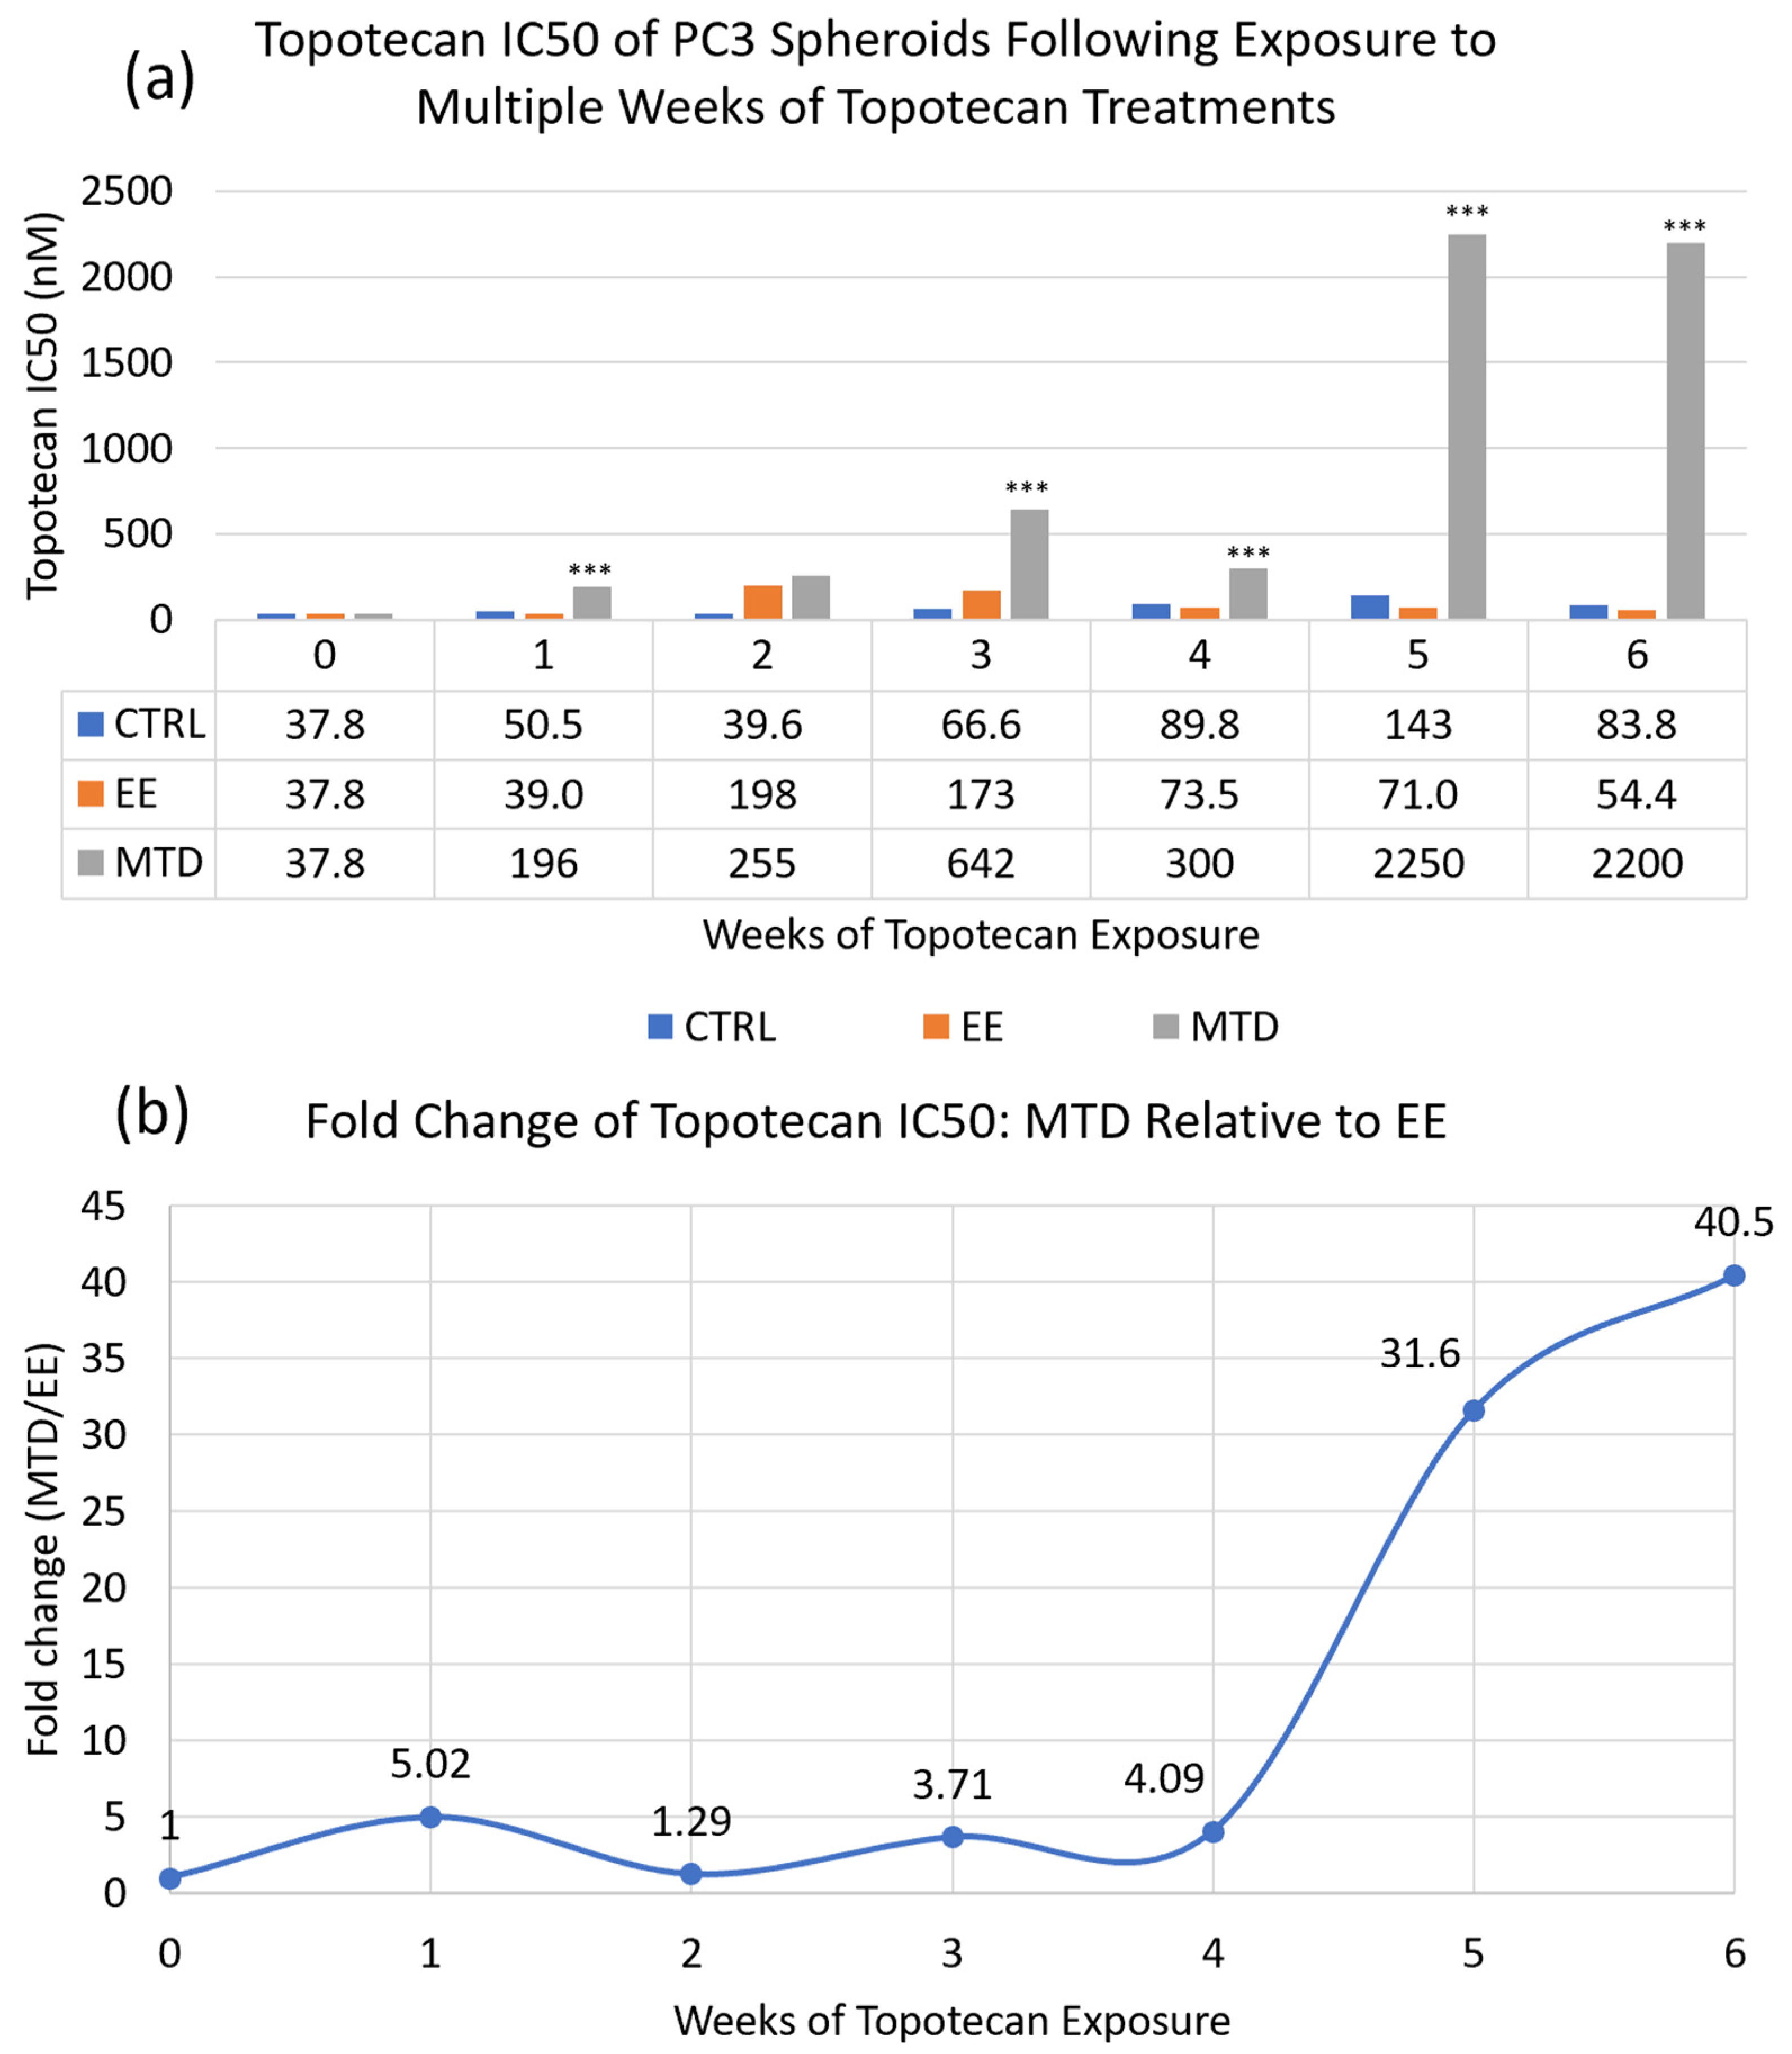
3.1. Comparing the Long-Term Potency of EE and MTD Topotecan
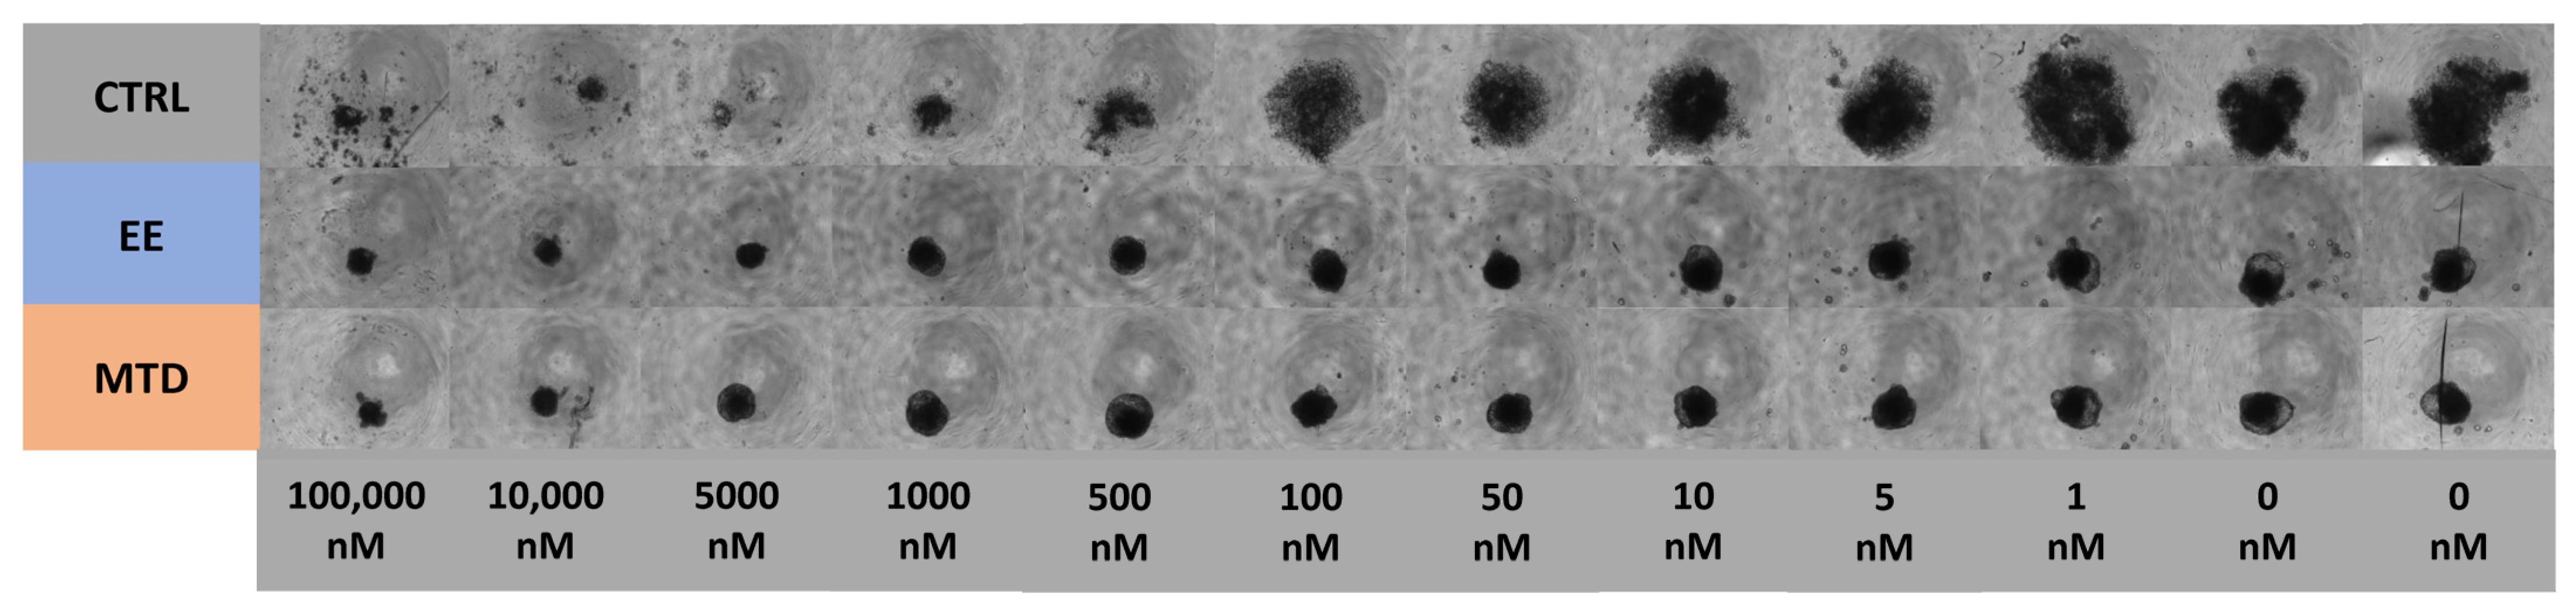
3.2. Determining the Impact of Different Dosing Strategies on Population Heterogeneity
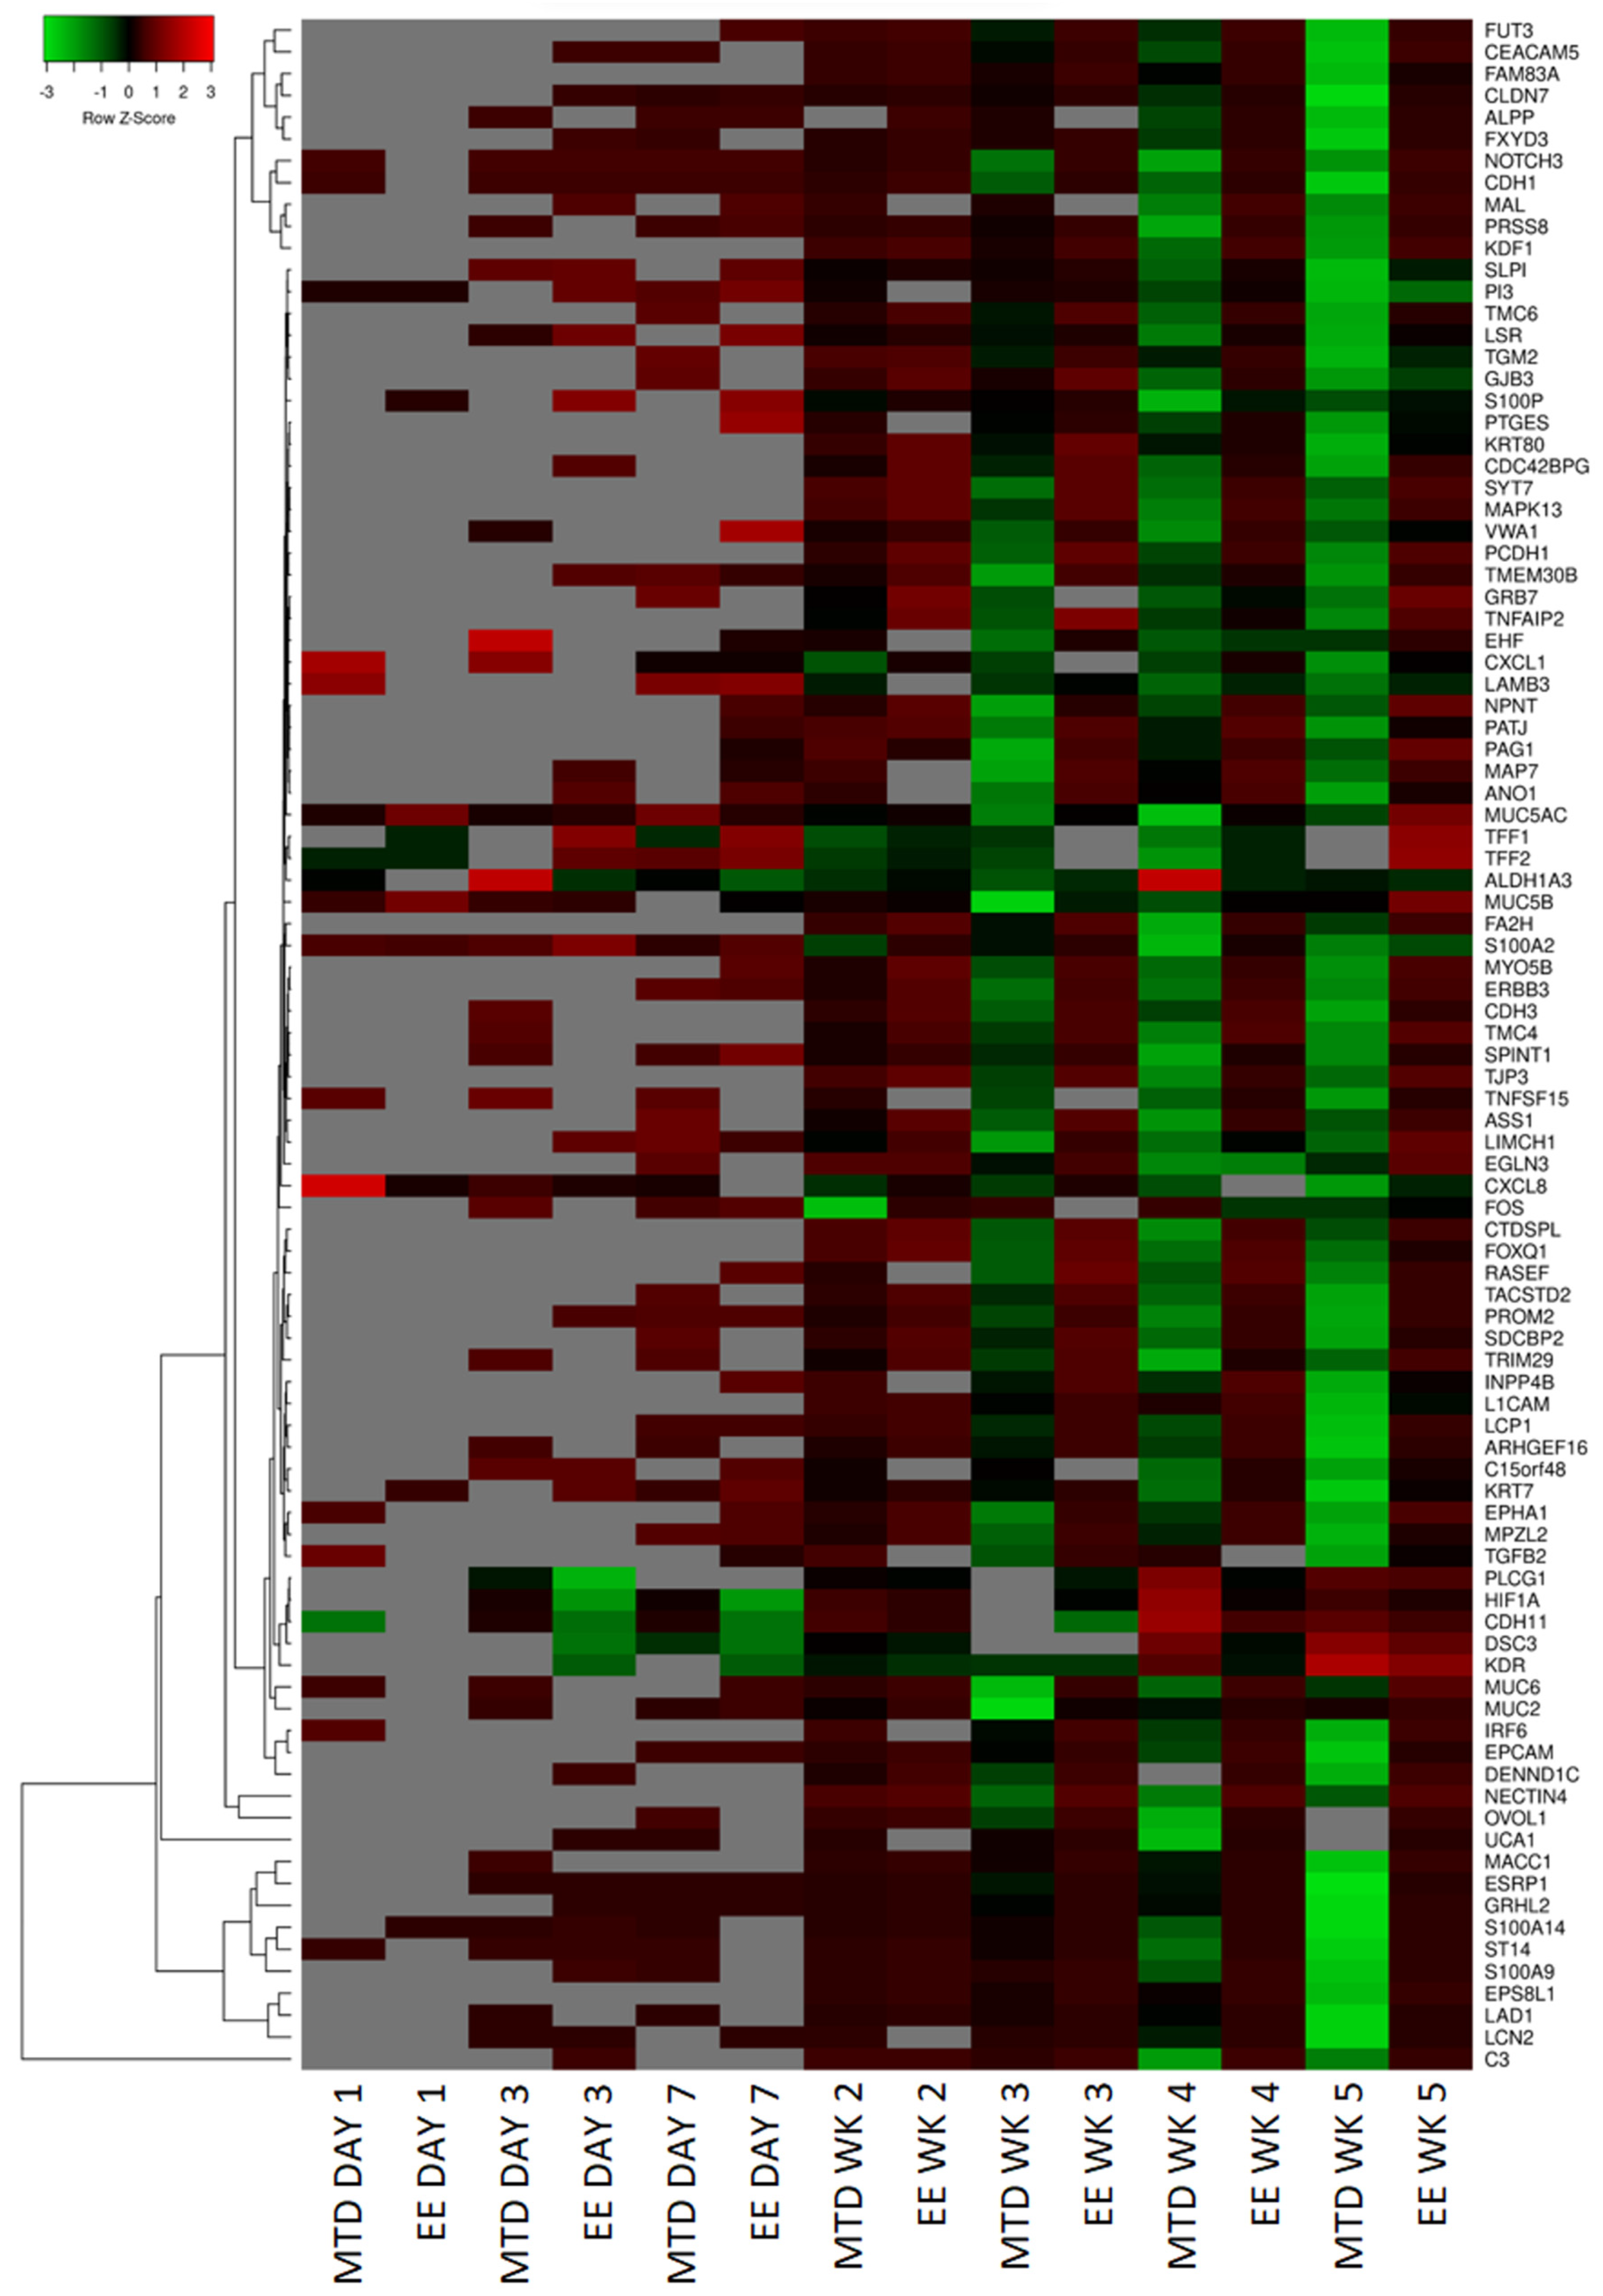
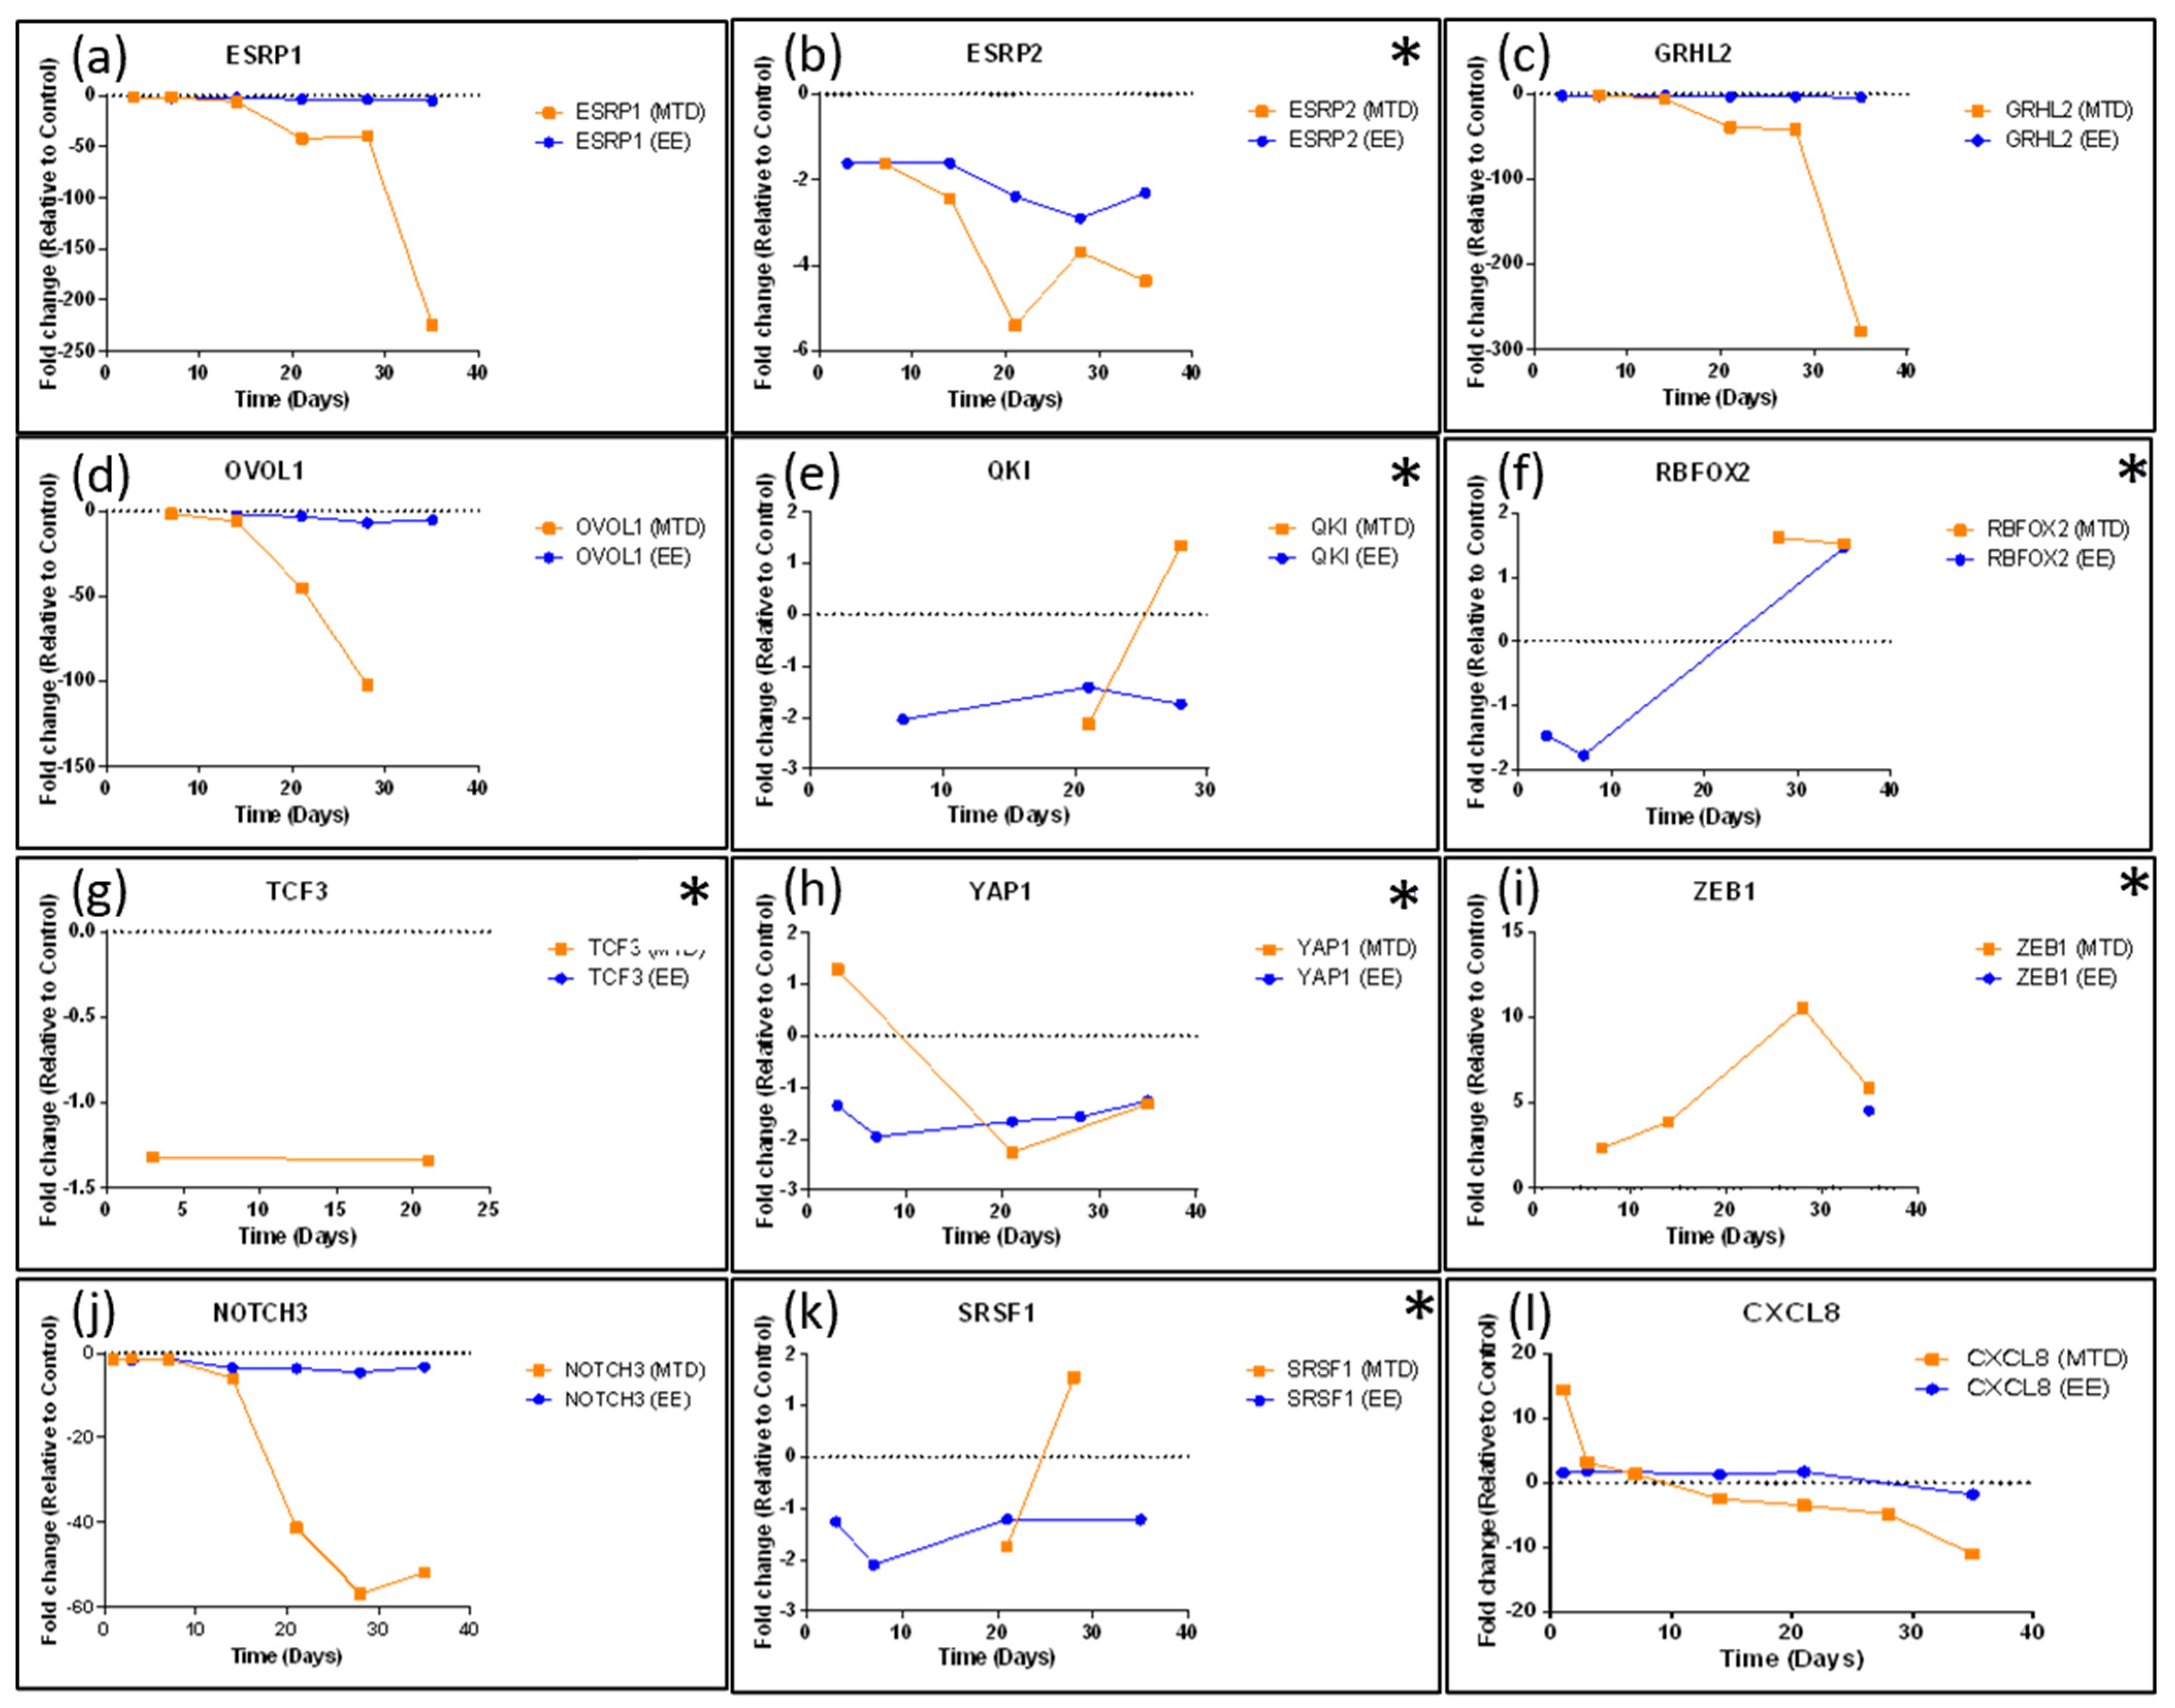
3.3. Evaluating the Underlying Molecular Causes of MTD-Induced Drug Resistance
3.4. Assessing Whether Alternative Administration Schedules Can Alter Efflux Pump and Topoisomerase Expression
4. Discussion
5. Materials and Methods
5.1. Cell Line and Cell Culture
5.2. Spheroid Formation
5.3. Dosing and Spheroid Handling
5.4. Study Protocol
5.5. Resazurin Assay (Cytotoxicity)
5.6. RNA Storage Protocol
5.7. RNA Isolation
5.8. RNAseq
5.9. RNAseq Data Processing
5.10. Bioinformatics Analysis
5.11. Ingenuity Pathway Analysis (IPA)
5.12. scRNAseq
5.13. Statistical Analysis
Supplementary Materials
Author Contributions
Funding
Institutional Review Board Statement
Informed Consent Statement
Data Availability Statement
Acknowledgments
Conflicts of Interest
Appendix A


References
- Browder, T.; Butterfield, C.E.; Kräling, B.M.; Shi, B.; Marshall, B.; O’Reilly, M.S.; Folkman, J. Antiangiogenic Scheduling of Chemotherapy Improves Efficacy against Experimental Drug-Resistant Cancer. Cancer Res. 2000, 60, 1878–1886. [Google Scholar]
- Klement, G.; Baruchel, S.; Rak, J.; Man, S.; Clark, K.; Hicklin, D.J.; Bohlen, P.; Kerbel, R.S. Continuous Low-Dose Therapy with Vinblastine and VEGF Receptor-2 Antibody Induces Sustained Tumor Regression without Overt Toxicity. J. Clin. Investig. 2000, 105, R15–R24. [Google Scholar] [CrossRef]
- Bocci, G.; Francia, G. (Eds.) Metronomic Chemotherapy; Springer: Berlin/Heidelberg, Germany, 2014. [Google Scholar] [CrossRef]
- Mpekris, F.; Baish, J.W.; Stylianopoulos, T.; Jain, R.K. Role of Vascular Normalization in Benefit from Metronomic Chemotherapy. Proc. Natl. Acad. Sci. USA 2017, 114, 1994–1999. [Google Scholar] [CrossRef]
- Cazzaniga, M.E.; Cordani, N.; Capici, S.; Cogliati, V.; Riva, F.; Cerrito, M.G. Metronomic Chemotherapy. Cancers 2021, 13, 2236. [Google Scholar] [CrossRef]
- Kerbel, R.S.; Kamen, B.A. The Anti-Angiogenic Basis of Metronomic Chemotherapy. Nat. Rev. Cancer 2004, 4, 423–436. [Google Scholar] [CrossRef]
- Albertsson, P.; Lennernas, B.; Norby, K. Low-dosage Metronomic Chemotherapy and Angiogenesis: Topoisomerase Inhibitors Irinotecan and Mitoxantrone Stimulate VEGF-A-mediated Angiogenesis. APMIS 2012, 120, 147–156. [Google Scholar] [CrossRef]
- Maiti, R. Metronomic Chemotherapy. J. Pharmacol. Pharmacother. 2014, 5, 186–192. [Google Scholar] [CrossRef]
- Simsek, C.; Esin, E.; Yalcin, S. Metronomic Chemotherapy: A Systematic Review of the Literature and Clinical Experience. J. Oncol. 2019, 2019, 5483791. [Google Scholar] [CrossRef]
- Aljuffali, I.A.; Mock, J.N.; Costyn, L.J.; Nguyen, H.; Nagy, T.; Cummings, B.S.; Arnold, R.D. Enhanced Antitumor Activity of Low-Dose Continuous Administration Schedules of Topotecan in Prostate Cancer. Cancer Biol. Ther. 2011, 12, 407–420. [Google Scholar] [CrossRef]
- Mitra Ghosh, T.; White, J.; Davis, J.; Mazumder, S.; Kansom, T.; Skarupa, E.; Barnett, G.S.; Piazza, G.A.; Bird, R.C.; Mitra, A.K.; et al. Identification and Characterization of Key Differentially Expressed Genes Associated with Metronomic Dosing of Topotecan in Human Prostate Cancer. Front. Pharmacol. 2021, 12, 736951. [Google Scholar] [CrossRef]
- Mitra Ghosh, T.; Kansom, T.; Mazumder, S.; Davis, J.; Alnaim, A.S.; Jasper, S.L.; Zhang, C.; Bird, A.; Opanasopit, P.; Mitra, A.K.; et al. The Andrographolide Analogue 3A.1 Synergizes with Taxane Derivatives in Aggressive Metastatic Prostate Cancers by Upregulation of Heat Shock Proteins and Downregulation of MAT2A-Mediated Cell Migration and Invasion. J. Pharmacol. Exp. Ther. 2022, 380, 180–201. [Google Scholar] [CrossRef]
- Kalluri, R.; Weinberg, R.A. The Basics of Epithelial-Mesenchymal Transition. J. Clin. Investig. 2009, 119, 1420–1428. [Google Scholar] [CrossRef]
- Ribatti, D.; Tamma, R.; Annese, T. Epithelial-Mesenchymal Transition in Cancer: A Historical Overview. Transl. Oncol. 2020, 13, 100773. [Google Scholar] [CrossRef]
- Yang, J.; Antin, P.; Berx, G.; Blanpain, C.; Brabletz, T.; Bronner, M.; Campbell, K.; Cano, A.; Casanova, J.; Christofori, G.; et al. Guidelines and Definitions for Research on Epithelial–Mesenchymal Transition. Nat. Rev. Mol. Cell Biol. 2020, 21, 341–352. [Google Scholar] [CrossRef]
- Levine, H.; Jolly, M. EMT Resistance in Cancer Cells and Two Potential Causes. Oncotarget. 2021. Available online: https://www.oncotarget.org/2021/10/21/emt-resistance-in-cancer-cells-and-two-potential-causes/ (accessed on 5 December 2022).
- Dongre, A.; Weinberg, R.A. New Insights into the Mechanisms of Epithelial–Mesenchymal Transition and Implications for Cancer. Nat. Rev. Mol. Cell Biol. 2019, 20, 69–84. [Google Scholar] [CrossRef]
- Epithelial-Mesenchymal Transition (EMT) Markers. Available online: https://www.novusbio.com/antibody-news/antibodies/antibodies-for-epithelial-mesenchymal-transition-emt-marker (accessed on 20 December 2022).
- Lambert, A.W.; Weinberg, R.A. Linking EMT Programmes to Normal and Neoplastic Epithelial Stem Cells. Nat. Rev. Cancer 2021, 21, 325–338. [Google Scholar] [CrossRef]
- Shih, J.-Y.; Yang, P.-C. The EMT Regulator Slug and Lung Carcinogenesis. Carcinogenesis 2011, 32, 1299–1304. [Google Scholar] [CrossRef]
- Dagogo-Jack, I.; Shaw, A.T. Tumour Heterogeneity and Resistance to Cancer Therapies. Nat. Rev. Clin. Oncol. 2018, 15, 81–94. [Google Scholar] [CrossRef]
- Lim, Z.-F.; Ma, P.C. Emerging Insights of Tumor Heterogeneity and Drug Resistance Mechanisms in Lung Cancer Targeted Therapy. J. Hematol. Oncol. 2019, 12, 134. [Google Scholar] [CrossRef]
- Saunders, N.A.; Simpson, F.; Thompson, E.W.; Hill, M.M.; Endo-Munoz, L.; Leggatt, G.; Minchin, R.F.; Guminski, A. Role of Intratumoural Heterogeneity in Cancer Drug Resistance: Molecular and Clinical Perspectives. EMBO Mol. Med. 2012, 4, 675–684. [Google Scholar] [CrossRef]
- Kobak, D.; Berens, P. The Art of Using T-SNE for Single-Cell Transcriptomics. Nat. Commun. 2019, 10, 5416. [Google Scholar] [CrossRef] [PubMed]
- Shin, K.; Straight, S.; Margolis, B. PATJ Regulates Tight Junction Formation and Polarity in Mammalian Epithelial Cells. J. Cell Biol. 2005, 168, 705–711. [Google Scholar] [CrossRef] [PubMed]
- Bragulla, H.H.; Homberger, D.G. Structure and Functions of Keratin Proteins in Simple, Stratified, Keratinized and Cornified Epithelia. J. Anat. 2009, 214, 516–559. [Google Scholar] [CrossRef] [PubMed]
- Kufe, D.W. Mucins in Cancer: Function, Prognosis and Therapy. Nat. Rev. Cancer 2009, 9, 874–885. [Google Scholar] [CrossRef] [PubMed]
- Hyun, K.-A.; Koo, G.-B.; Han, H.; Sohn, J.; Choi, W.; Kim, S.-I.; Jung, H.-I.; Kim, Y.-S. Epithelial-to-Mesenchymal Transition Leads to Loss of EpCAM and Different Physical Properties in Circulating Tumor Cells from Metastatic Breast Cancer. Oncotarget 2016, 7, 24677–24687. [Google Scholar] [CrossRef]
- Gires, O.; Pan, M.; Schinke, H.; Canis, M.; Baeuerle, P.A. Expression and Function of Epithelial Cell Adhesion Molecule EpCAM: Where Are We after 40 Years? Cancer Metastasis Rev. 2020, 39, 969–987. [Google Scholar] [CrossRef]
- Zhang, X.; Han, X.; Zuo, P.; Zhang, X.; Xu, H. CEACAM5 Stimulates the Progression of Non-Small-Cell Lung Cancer by Promoting Cell Proliferation and Migration. J. Int. Med. Res. 2020, 48, 030006052095947. [Google Scholar] [CrossRef]
- Wu, J.-I.; Wang, L.-H. Emerging Roles of Gap Junction Proteins Connexins in Cancer Metastasis, Chemoresistance and Clinical Application. J. Biomed. Sci. 2019, 26, 8. [Google Scholar] [CrossRef]
- Salt, M.B.; Bandyopadhyay, S.; McCormick, F. Epithelial-to-Mesenchymal Transition Rewires the Molecular Path to PI3K-Dependent Proliferation. Cancer Discov. 2014, 4, 186–199. [Google Scholar] [CrossRef]
- Chung, V.Y.; Tan, T.Z.; Ye, J.; Huang, R.-L.; Lai, H.-C.; Kappei, D.; Wollmann, H.; Guccione, E.; Huang, R.Y.-J. The Role of GRHL2 and Epigenetic Remodeling in Epithelial–Mesenchymal Plasticity in Ovarian Cancer Cells. Commun. Biol. 2019, 2, 272. [Google Scholar] [CrossRef]
- Wesdorp, M.; Murillo-Cuesta, S.; Peters, T.; Celaya, A.M.; Oonk, A.; Schraders, M.; Oostrik, J.; Gomez-Rosas, E.; Beynon, A.J.; Hartel, B.P.; et al. MPZL2, Encoding the Epithelial Junctional Protein Myelin Protein Zero-like 2, Is Essential for Hearing in Man and Mouse. Am. J. Hum. Genet. 2018, 103, 74–88. [Google Scholar] [CrossRef]
- Parsana, P.; Amend, S.R.; Hernandez, J.; Pienta, K.J.; Battle, A. Identifying Global Expression Patterns and Key Regulators in Epithelial to Mesenchymal Transition through Multi-Study Integration. BMC Cancer 2017, 17, 447. [Google Scholar] [CrossRef] [PubMed]
- Pasquale, E.B. Eph Receptors and Ephrins in Cancer: Bidirectional Signalling and Beyond. Nat. Rev. Cancer 2010, 10, 165–180. [Google Scholar] [CrossRef] [PubMed]
- Roland, J.T.; Bryant, D.M.; Datta, A.; Itzen, A.; Mostov, K.E.; Goldenring, J.R. Rab GTPase–Myo5B Complexes Control Membrane Recycling and Epithelial Polarization. Proc. Natl. Acad. Sci. USA 2011, 108, 2789–2794. [Google Scholar] [CrossRef]
- Chen, L.-M.; Verity, N.J.; Chai, K.X. Loss of Prostasin (PRSS8) in Human Bladder Transitional Cell Carcinoma Cell Lines Is Associated with Epithelial-Mesenchymal Transition (EMT). BMC Cancer 2009, 9, 377. [Google Scholar] [CrossRef]
- Zhang, L.; Jia, G.; Shi, B.; Ge, G.; Duan, H.; Yang, Y. PRSS8 Is Downregulated and Suppresses Tumour Growth and Metastases in Hepatocellular Carcinoma. Cell. Physiol. Biochem. 2016, 40, 757–769. [Google Scholar] [CrossRef] [PubMed]
- Kim, S.; Lee, S.T.; Min, I.S.; Park, Y.R.; Lee, J.H.; Kim, D.; Kim, S. Lipocalin 2 Negatively Regulates Cell Proliferation and Epithelial to Mesenchymal Transition through Changing Metabolic Gene Expression in Colorectal Cancer. Cancer Sci. 2017, 108, 2176–2186. [Google Scholar] [CrossRef] [PubMed]
- Xiong, X.; Liao, X.; Qiu, S.; Xu, H.; Zhang, S.; Wang, S.; Ai, J.; Yang, L. CXCL8 in Tumor Biology and Its Implications for Clinical Translation. Front. Mol. Biosci. 2022, 9, 723846. [Google Scholar] [CrossRef] [PubMed]
- Liu, Q.; Li, A.; Tian, Y.; Wu, J.D.; Liu, Y.; Li, T.; Chen, Y.; Han, X.; Wu, K. The CXCL8-CXCR1/2 Pathways in Cancer. Cytokine Growth Factor. 2016, 31, 61–71. [Google Scholar] [CrossRef]
- Masuda, Y.; Takahashi, H.; Hatakeyama, S. TRIM29 Regulates the P63-Mediated Pathway in Cervical Cancer Cells. Biochim. Biophys. Acta Mol. Cell Res. 2015, 1853, 2296–2305. [Google Scholar] [CrossRef]
- Yamamoto, H.; Mukaisho, K.; Sugihara, H.; Hattori, T.; Asano, S. Down-Regulation of FXYD3 Is Induced by Transforming Growth Factor-β. Signaling via ZEB1/δEF1 in Human Mammary Epithelial Cells. Biol. Pharm. Bull. 2011, 34, 324–329. [Google Scholar] [CrossRef] [PubMed]
- Matsuura, N.; Tanaka, K.; Yamasaki, M.; Yamashita, K.; Saito, T.; Makino, T.; Yamamoto, K.; Takahashi, T.; Kurokawa, Y.; Nakajima, K.; et al. NOTCH3 Limits the Epithelial–Mesenchymal Transition and Predicts a Favorable Clinical Outcome in Esophageal Cancer. Cancer Med. 2021, 10, 3986–3996. [Google Scholar] [CrossRef] [PubMed]
- Lin, H.-Y.; Liang, Y.-K.; Dou, X.-W.; Chen, C.-F.; Wei, X.-L.; Zeng, D.; Bai, J.-W.; Guo, Y.-X.; Lin, F.-F.; Huang, W.-H.; et al. Notch3 Inhibits Epithelial–Mesenchymal Transition in Breast Cancer via a Novel Mechanism, Upregulation of GATA-3 Expression. Oncogenesis 2018, 7, 59. [Google Scholar] [CrossRef] [PubMed]
- Ishii, H.; Saitoh, M.; Sakamoto, K.; Kondo, T.; Katoh, R.; Tanaka, S.; Motizuki, M.; Masuyama, K.; Miyazawa, K. Epithelial Splicing Regulatory Proteins 1 (ESRP1) and 2 (ESRP2) Suppress Cancer Cell Motility via Different Mechanisms. J. Biol. Chem. 2014, 289, 27386–27399. [Google Scholar] [CrossRef]
- Roca, H.; Hernandez, J.; Weidner, S.; McEachin, R.C.; Fuller, D.; Sud, S.; Schumann, T.; Wilkinson, J.E.; Zaslavsky, A.; Li, H.; et al. Transcription Factors OVOL1 and OVOL2 Induce the Mesenchymal to Epithelial Transition in Human Cancer. PLoS ONE 2013, 8, e76773. [Google Scholar] [CrossRef]
- Metzger, W.; Sossong, D.; Bächle, A.; Pütz, N.; Wennemuth, G.; Pohlemann, T.; Oberringer, M. The Liquid Overlay Technique Is the Key to Formation of Co-Culture Spheroids Consisting of Primary Osteoblasts, Fibroblasts and Endothelial Cells. Cytotherapy 2011, 13, 1000–1012. [Google Scholar] [CrossRef]
- Reinhardt, J.; Landsberg, J.; Schmid-Burgk, J.L.; Ramis, B.B.; Bald, T.; Glodde, N.; Lopez-Ramos, D.; Young, A.; Ngiow, S.F.; Nettersheim, D.; et al. limma powers differential expression analyses for RNA-sequencing and microarray studies. Nucleic Acids Res. 2015, 43, e47. [Google Scholar] [CrossRef]
- Safran, M.; Rosen, N.; Twik, M.; BarShir, R.; Iny Stein, T.; Dahary, D.; Fishilevich, S.; Lancet, D. The GeneCards Suite Chapter, Practical Guide to Life Science Databases; Springer: Berlin/Heidelberg, Germany, 2022; pp. 27–56. [Google Scholar]
- Babicki, S.; Arndt, D.; Marcu, A.; Liang, Y.; Grant, J.R.; Maciejewski, A.; Wishart, D.S. Heatmapper: Web-Enabled Heat Mapping for All. Nucleic Acids Res. 2016, 44, W147–W153. [Google Scholar] [CrossRef]
- Krämer, A.; Green, J.; Pollard, J., Jr.; Tugendreich, S. Causal analysis approaches in Ingenuity Pathway Analysis. Bioinformatics 2014, 30, 523–530. [Google Scholar] [CrossRef]


Disclaimer/Publisher’s Note: The statements, opinions and data contained in all publications are solely those of the individual author(s) and contributor(s) and not of MDPI and/or the editor(s). MDPI and/or the editor(s) disclaim responsibility for any injury to people or property resulting from any ideas, methods, instructions or products referred to in the content. |
© 2023 by the authors. Licensee MDPI, Basel, Switzerland. This article is an open access article distributed under the terms and conditions of the Creative Commons Attribution (CC BY) license (https://creativecommons.org/licenses/by/4.0/).
Share and Cite
Davis, J.T.; Ghosh, T.M.; Mazumder, S.; Mitra, A.; Bird, R.C.; Arnold, R.D. Extended Exposure Topotecan Significantly Improves Long-Term Drug Sensitivity by Decreasing Malignant Cell Heterogeneity and by Preventing Epithelial–Mesenchymal Transition. Int. J. Mol. Sci. 2023, 24, 8490. https://doi.org/10.3390/ijms24108490
Davis JT, Ghosh TM, Mazumder S, Mitra A, Bird RC, Arnold RD. Extended Exposure Topotecan Significantly Improves Long-Term Drug Sensitivity by Decreasing Malignant Cell Heterogeneity and by Preventing Epithelial–Mesenchymal Transition. International Journal of Molecular Sciences. 2023; 24(10):8490. https://doi.org/10.3390/ijms24108490
Chicago/Turabian StyleDavis, Joshua T., Taraswi Mitra Ghosh, Suman Mazumder, Amit Mitra, Richard Curtis Bird, and Robert D. Arnold. 2023. "Extended Exposure Topotecan Significantly Improves Long-Term Drug Sensitivity by Decreasing Malignant Cell Heterogeneity and by Preventing Epithelial–Mesenchymal Transition" International Journal of Molecular Sciences 24, no. 10: 8490. https://doi.org/10.3390/ijms24108490
APA StyleDavis, J. T., Ghosh, T. M., Mazumder, S., Mitra, A., Bird, R. C., & Arnold, R. D. (2023). Extended Exposure Topotecan Significantly Improves Long-Term Drug Sensitivity by Decreasing Malignant Cell Heterogeneity and by Preventing Epithelial–Mesenchymal Transition. International Journal of Molecular Sciences, 24(10), 8490. https://doi.org/10.3390/ijms24108490