2.1. Single-Particle Model Accounting for Coating Effects
In this section, we present a single-particle model of the LFP composite material coated with an arbitrary layer, with no charge transfer limitations.
Figure 2 shows SEM images of the composite with a conductive binder and the conventional composite. Both samples reveal a noticeable distribution in both the shape and size of the LFP particles. In the case of the composite with carbon black and the conventional, non-conductive binder (
Figure 2b), its surface is coated with large agglomerates of carbon black, while in the composite with the conductive binder (
Figure 2a), the surface is almost free from carbon agglomerates. The LFP material is known to exhibit anisotropic diffusion, with a higher diffusion coefficient in one direction than in the other two directions. Accounting for the particle shape and size distribution, as well as diffusion anisotropy, would considerably complicate the modeling problem, which is beyond the scope of this work that aims to investigate the coating effects. Thus, we follow the widely accepted approach of using the average particle size and shape, and the isotropic diffusion coefficient of the material [
22,
23,
24,
25]. The image shows that a significant number of particles have an elongated shape, resembling a cylinder more than a sphere. Therefore, we adopt the cylindrical geometry of the average particle in our model.
Let us consider the single-particle system of the LFP electrode material. The particle has the shape of a cylinder and not all parts of the particle surface allow ion intercalation due to the patchy coating. We restrict our consideration to coatings that can be described by two parameters (accounting for all possible coating patterns on a cylinder is an endless task). The first parameter is
, which is the inactive surface fraction that does not allow ion intercalation (
). From
, one can express the active surface fraction as
. The second parameter is the number of inactive spots of equal area and shape
. We consider coating patterns that change only within the angular coordinate
(nothing changes within the
-axis),
Figure 3a. Together with the neglect of the edge effects at the bases of the cylinder, we can transform the three-dimensional cylindrical problem into a two-dimensional radial problem, as shown in
Figure 3b.
To develop a single-particle model based on the mentioned assumptions, we analyze the system that consists of one particle of the LFP active material that is immersed in the LiPF
6 solution (1 mol/L) and has the following parameters. The particle radius
nm. Some parts of the particle surface are capable of fast Li-ion intercalation (negligible charge transfer resistance). Other parts of the particle surface do not intercalate Li-ions. Potential 3.2 V corresponds to the initial concentration of Li-ions in the particle
(1% charge of the LFP material). The potential step from 3.2 V to 3.8 V leads to a decrease in the concentration to
(99% charge of the LFP material). The lithium diffusion coefficient in the solid for this system is
. Details of the single-particle potential step simulation can be found in
Appendix A.
The simulated potential step from 3.2 V to 3.8 V results in the current vs. time dependence (current transient). This dependence enables the apparent diffusion coefficient
to be calculated if one knows the particle surface area
and concentration change corresponding to a given potential step
. Calculations of
can be performed using the Cottrell relationship [
26,
27,
28,
29,
30]:
where
is the apparent diffusion coefficient,
is the current, and
is the Faraday’s constant.
measured by the Cottrell relationship characterizes the diffusion at the beginning of the charging process. Another parameter that can be used as a diffusion characteristic is the time
, which tells how long it takes to add 90% of
.
We apply the potential step to a simulated idealized system with a negligible charge transfer resistance and a diffusion coefficient with a constant value for the lithium in the lithium iron phosphate . Hence, one large potential step can be used instead of the usual approach, in which lots of small potential steps are applied.
Dependences of
and
on particle coatings are represented in
Figure 4a,b, respectively.
It is clear from
Figure 4 that in the case of the finely dispersed coating (
), the value of the apparent diffusion coefficient
remains close to the value of the Li
+ diffusion coefficient in the lithium iron phosphate
cm
2/s. However, this is not the case for the coarsely dispersed coating (
). A closer look at
Figure 5 reveals that at high values of
, the
value does not differ much from
. Thus, when
equals 0.75 (75% of surface allows ion intercalation), a change in the particle coating from finely dispersed to coarsely dispersed leads to a decrease in the
value by ~38%. However, if
equals 0.25 (25% of surface allows ion intercalation), there is an order of magnitude decrease in the value of
when the coating changes from finely dispersed to coarsely dispersed. Another interesting observation from the graph is that, in some cases, a finer coating with a smaller
may give better diffusion characteristics than a coarser coating with a bigger
. For example, this is clearly seen for a fine coating (
) with
and a coarse coating (
) with
.
Figure 4b demonstrates the dependence of the diffusion time
t90% on the reciprocal number of inactive spots
for three different values of the active surface fraction
. One can infer that the time
has a nearly linear dependence on the reciprocal number of inactive spots
. Additionally, the active surface fraction
affects the angle of
vs.
dependence. If 75% of the particle surface allows ion intercalation (
, black line in
Figure 4b), no significant change in the diffusion time is observed (
increases ~1.6 times when the coating changes from finely dispersed to coarsely dispersed). However, if only 25% of the particle surface allows ion intercalation (
, blue line in
Figure 4b), a significant change in the diffusion time is observed (
increases almost one order of magnitude when the coating changes from finely dispersed to coarsely dispersed). Hence, the active surface fraction
strongly affects the angle of the
vs.
dependence; the lower the
value, the more dramatic the deterioration of the diffusion characteristics caused by the coarsely dispersed coating is.
By now, we have demonstrated that the finely dispersed coating has an insignificant influence on the diffusion characteristics of the system. However, such a coating still plays a role in the surface resistance of the particle coating
. If the particle has an inactive surface fraction
with the surface resistance
Ohm·m
2 and an active surface fraction
(covered with the film) with the surface resistance
Ohm·m
2, we can apply the summation rule for parallel resistances:
Thus, we get the following expression for
RCOAT:
Therefore, despite a slight effect on the diffusion characteristics, a finely dispersed coating affects the polarization of the system, so, a finely dispersed coating can be taken into account via the resistance .
In this section, we demonstrated the impact of a coating on the measured diffusion characteristics for the case of a single-particle system with no charge transfer and ohmic limitations. We found that a finely dispersed coating leads to a slight dependence of diffusion characteristics on the active surface fraction
, as shown in
Figure 4. However, a coarsely dispersed coating results in a significant deterioration of the diffusion characteristics with a decrease in
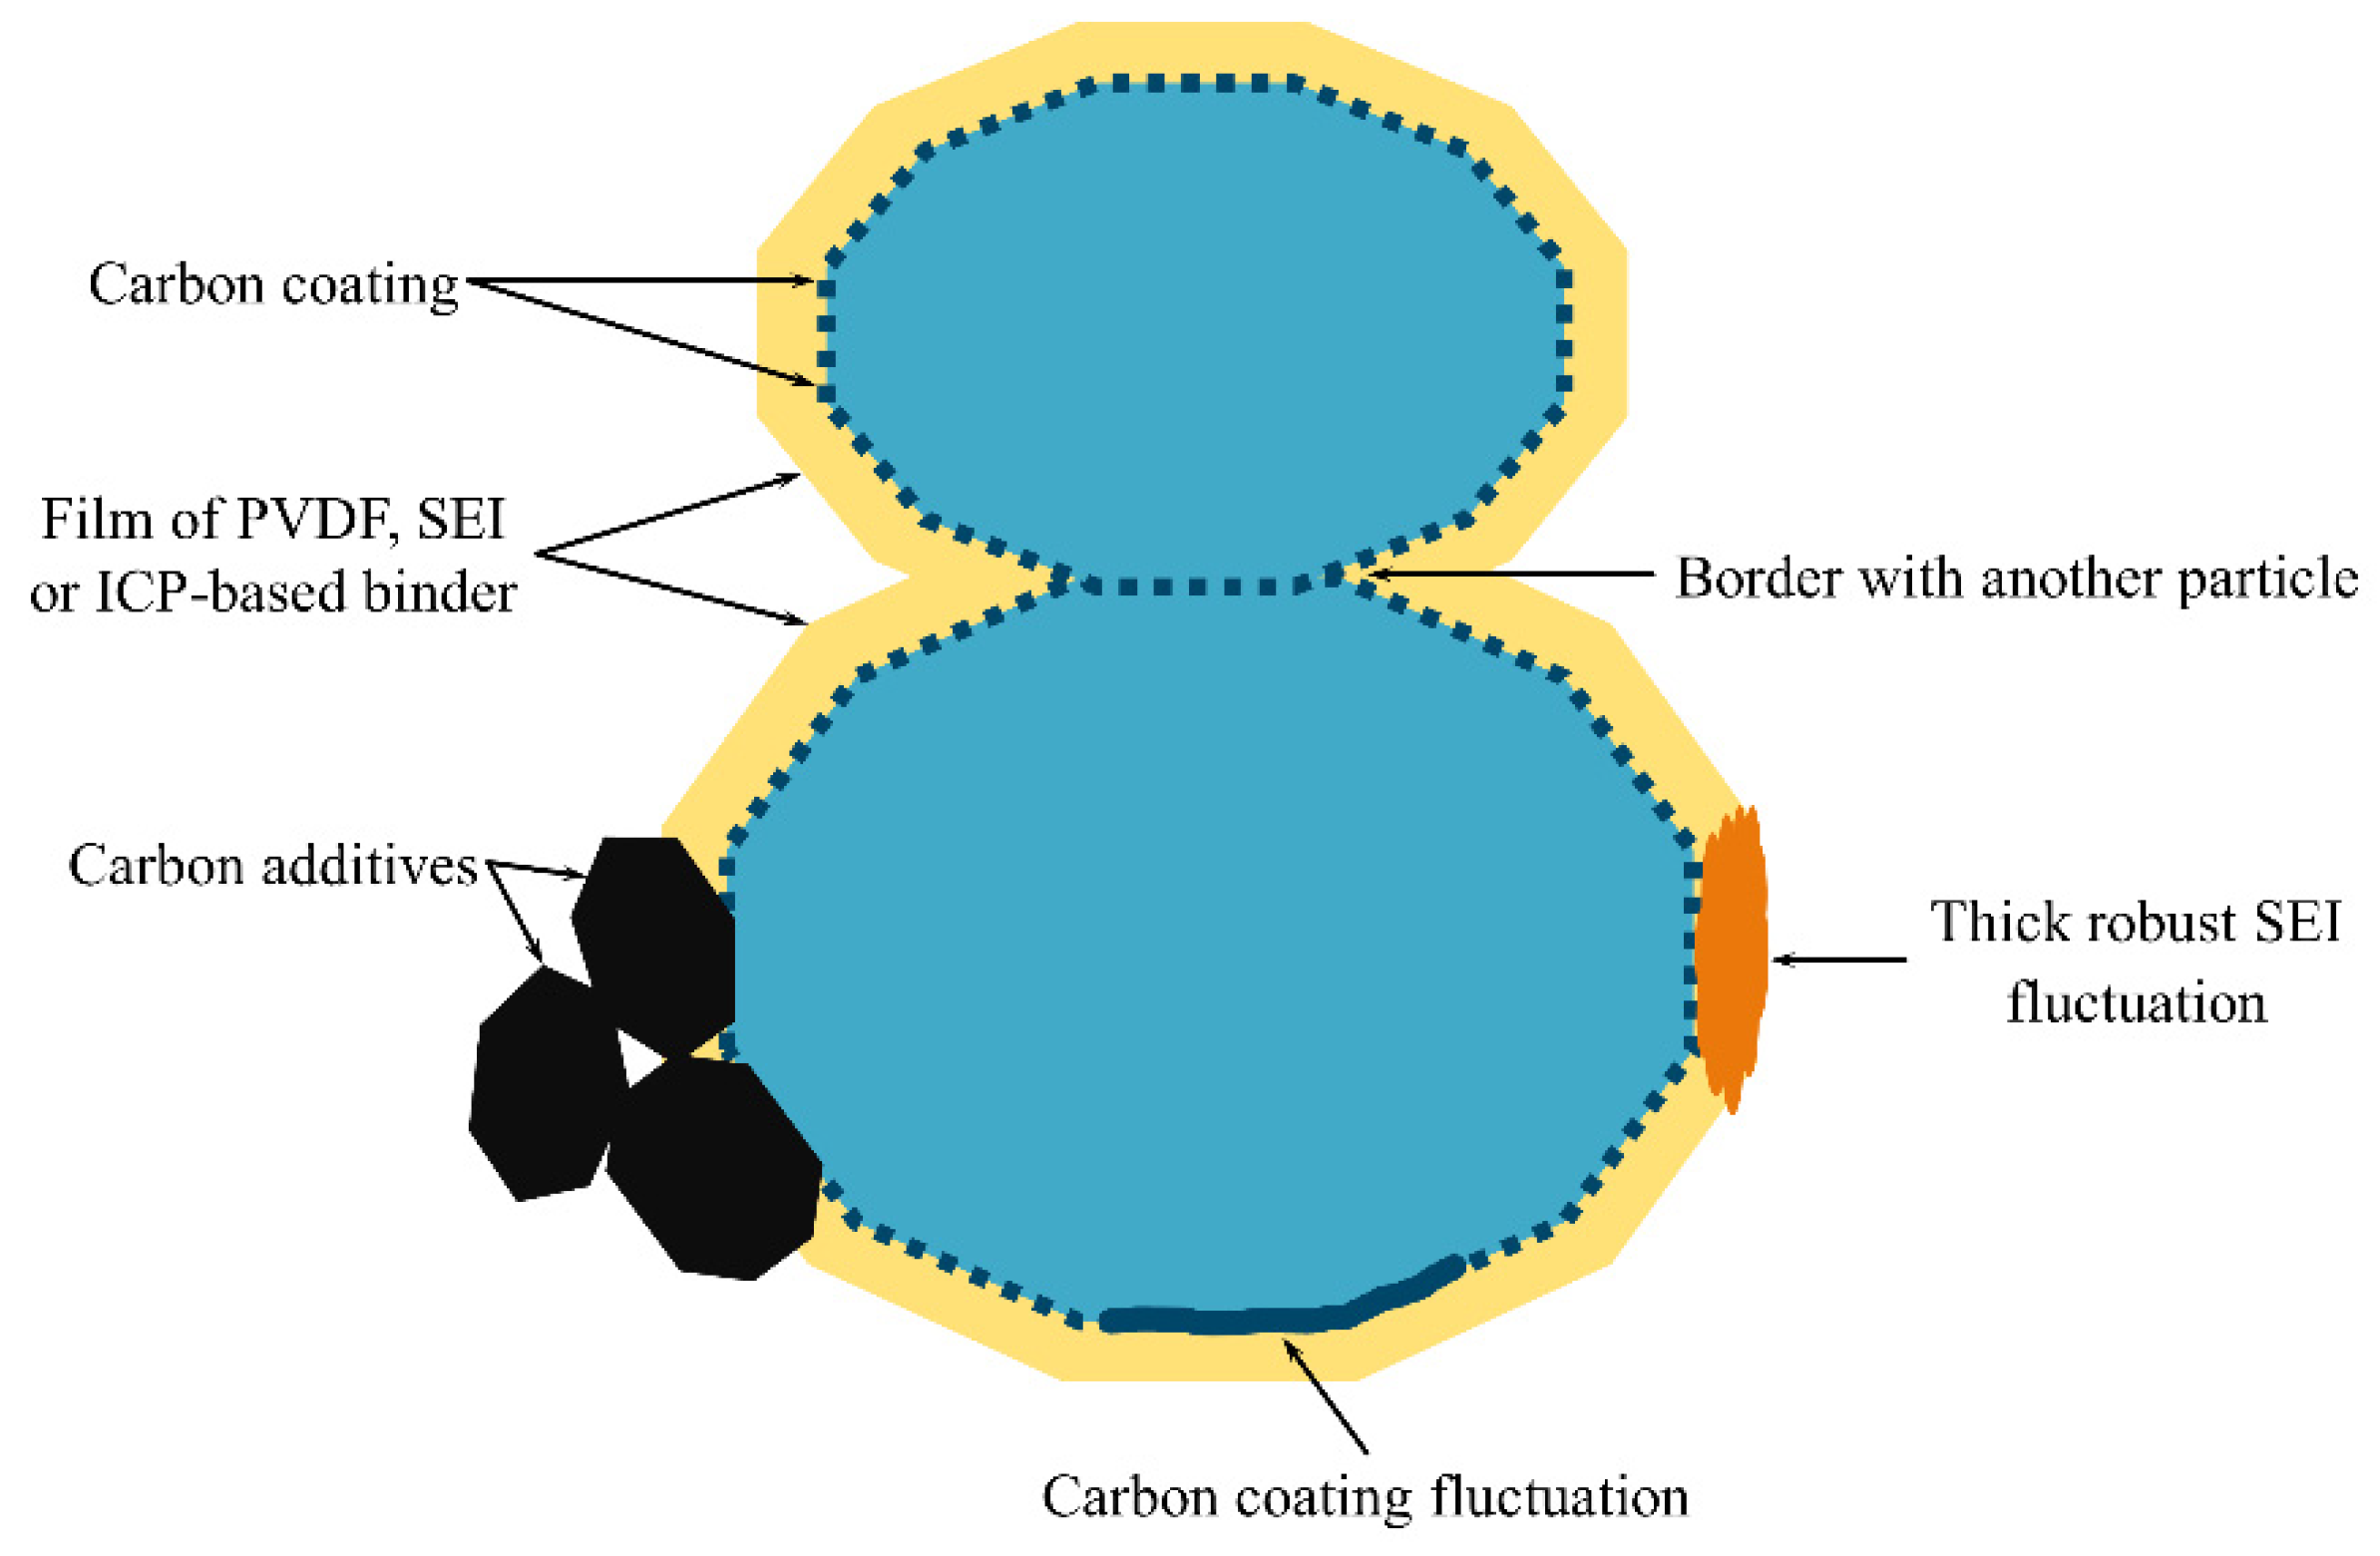
. In real systems, the situation is more complex: some parts of the coating may have a little effect on the diffusion characteristics due to a small average inactive spot size, while other parts may have large inactive surface spots due to fluctuations in the coating fabrication, electrochemical restructuring, etc. (
Figure 1). The parts of the particle surface with a finely dispersed coating can be considered as an active surface by adjusting the value of
; then, the parts covered with large inactive spots should be considered as an inactive surface. This assumption simplifies the problem of the simultaneous presence of big and small inactive spots to the problem of big inactive spots.
2.2. General Model Accounting for Coating Effects
The single-particle model does not take into account the distribution of the potential and the electrolyte distribution in the porous composite electrode. Thus, the development of a full-scale model is more preferable for precise numerical simulations of prolonged multi-particle systems.
In this section, we utilize the widely known Newman approach in order to model the electrochemical behavior of the cell. This approach involves a set of five equations that describe the kinetics and dynamics of the cell, including the concentration of lithium in both the solid and electrolyte phases, as well as the potential distribution in these phases. These equations are bounded by the Butler–Volmer equation, and they provide us with a comprehensive understanding of the internal behavior of the cell [
22]. However, if we want to model the impact of different surface coatings on the electrode particles, we need to extend the Newman model. Specifically, we must add an additional dimension in order to account for the presence of active and inactive surface fractions (
and
, respectively). The concentration profile inside a particle with a patchy coating will depend on the angular coordinate
, which must be included in the model. Therefore, we modify the Newman model by adding the angular coordinate. A schematic representation of the cross-section of the cell modeled and described in this study is shown in
Figure 5.
In this study, we investigate the electrochemical performance of a cell containing a positive LiFePO4 electrode, a negative Li metal electrode and a porous separator. Several coatings of the positive electrode were considered. Although in commercial lithium-ion batteries the negative electrode is typically composed of an intercalation material like the positive electrode, in this article, we consider the negative electrode to be an ideal lithium metal in order to focus mainly on the electrochemical performance of the positive LiFePO4 electrode with different coatings.
Here, we expand the widespread Newman’s approach [
22,
23,
24,
25] in order to model and describe the internal electrochemical behavior of the cell, whose cross section is presented in
Figure 5. In general, the equations will be the same; however, an additional dimension is needed to characterize the size and distribution of the ion-impermeable spots. We used the cylindrical geometry of the particles (neglecting the edge effects at the bases of cylinders) for two reasons. (1) The composite material under consideration has prolonged particles, that look like cylinders. (2) Using an extension of the Newman model to account for the sphere surface coating would demand two additional dimensions, which would excessively complicate the computational problem.
Next, we describe in detail the equations used to model the behavior of the cell. We denote the thickness of the cell by x (distance from the current collector to the ideally reversible lithium counter electrode). Thus,
is the beginning of the cell and
is the overall thickness of the cell, where
and
are the thicknesses of the solid (electrode) and separator, respectively (see
Figure 5).
2.2.1. Mass Conservation in the Solid
The lithium concentration changes in the solid particles in accordance with the diffusion equation for cylindrical coordinates:
where
is the concentration of lithium in the solid phase depending on the radial coordinate r, angular coordinate
θ, distance across the cell
x and time t.
is the diffusion coefficient of lithium in the solid.
The initial concentration of lithium in the solid is equal to the following:
where
is the lithium concentration in the solid at the beginning of the simulation.
The boundary conditions are given by the following equation:
where
is the lithium flux across the active surface fraction
SA.
2.2.2. Charge Conservation in the Solid
The potential distribution in the electrode is represented by the following equation:
where
is the potential in the solid that depends on the distance across the cell
x and time t,
is the effective solid conductivity,
is the volume fraction of the solid phase, brug is the Bruggeman’s coefficient, and
F is Faraday’s constant.
is the specific surface area of the porous electrode material, and
is the
θ-averaged lithium flux through the surface of a particle located at
x position in the electrode coordinate, at the time
t.
The current that flows through the electrode is bounded by the following conditions:
where
I is the applied current density, and
A is the geometric surface area of the electrode.
2.2.3. Mass Conservation in the Electrolyte
A material balance equation in the electrolyte is represented in the following form:
where
is the concentration of lithium in the electrolyte,
is the effective electrolyte diffusivity,
is the volume fraction of the electrolyte,
is the diffusion coefficient of lithium in the electrolyte, and
is the Li
+ transference number.
The initial concentration of lithium in the electrolyte is determined as follows:
where
is the lithium concentration in the electrolyte at the beginning of the simulation.
For the cell under consideration, the ion deposition/dissolution at the ideal lithium metal is represented as follows:
2.2.4. Charge Conservation in the Electrolyte
Charge conservation equation in the electrolyte phase is formulated in Equation (12):
where
is the electrolyte potential,
is the effective electrolyte conductivity,
is the electrolyte conductivity,
is the universal gas constant,
is the cell temperature, and
is the activity coefficient of the electrolyte.
The corresponding boundary conditions are as follows:
2.2.5. Butler–Volmer Equation
The rate of lithium movement between the solid and electrolyte phases is modeled via the Butler–Volmer equation:
where
k is the reaction rate constant, α is the charge transfer coefficient,
is the maximum concentration of lithium in the solid, and
is the surface concentration of lithium in a cylindrical electrode particle and the overpotential that is
equal to the following:
where
is the open-circuit potential of the electrode, and
is the film resistance.
2.3. Study of Coating Effects on Charge/Discharge Characteristics of LFP Material
In this section, we apply the developed model to study the influence of coating parameters on the galvanostatic discharge curves of the LFP material at different C-rates. The parameters used for simulation can be found in
Table 1. The dependence of the
curve of the positive LFP electrode on the lithium solid concentration was taken from reference [
25].
Figure 6 compares the effect of the active surface fraction
on the galvanostatic discharge curves at 0.5C for two different materials with different diffusion coefficients for the constant value of the parameter
.
Figure 6a corresponds to the material with a relatively slow diffusion coefficient (
cm
2/s). As one can see, the capacity decreases from 121 mAh when
to less than 60 mAh when
. Thus, a high fraction of inactive surface leads to a significant deterioration in the material discharge capacity. This can be interpreted in terms of a change in the diffusion length and diffusion geometry (see the insets in
Figure 6a). The more inactive surface fraction the particle has, the greater the distance in a wider range of directions the Li
+ ions must overcome in order to fill the particle. Therefore, the “real” diffusion geometry is no longer cylindrical. For example, the diffusion inside the particle with the coating characteristics of
is more like 1D planar diffusion rather than 2D cylindrical diffusion. This leads to an increase in the diffusion time and, consequently, to a capacity reduction at a given discharge rate. Another effect that can be noticed from
Figure 6a is a significant drop in the discharge voltage plateau with a decrease in the active surface fraction
. This happens because a lower active surface fraction leads to a greater coating resistance
in accordance with Equation (3). Therefore, the active surface fraction has a significant influence on both the voltage and capacity of the considered system.
Figure 6b corresponds to the material with a diffusion coefficient of
cm
2/s. It is clear from the graph that the influence of
on the discharge capacity decreases at a higher diffusion coefficient value. The capacity reduces from 130 mAh to 105 mAh when
SA changes from 1 to 0.25. Concerning the discharge voltage of the samples presented in
Figure 6a,b, it remains nearly the same. This happens because the value of the
resistance remains constant for the systems considered in
Figure 6.
Now, we turn to the study of the coating distribution on the performance of the electrode material at a given C-rate (0.5C).
Figure 7 compares three samples that differ from each other only by the number of inactive spots
. The capacity of the sample with the highest
value (
) reaches 108 mAh/g, while the discharge capacity of the sample with the lowest
value (
) is about 75 mAh/g. Therefore, at moderate values of active surface fraction (
), a significant deterioration in the diffusion characteristics is observed with the decrease in the number of inactive spots
. This agrees with the inference made in the first section of this work. Thus, the agglomeration of additives into big lumps that inactivate the electrode surface leads to a decrease in the value of the discharge capacity at a given C-rate.
Concerning the voltage plateau, it remains the same for all samples in
Figure 7, as it does not depend on
and depends only on
and
. Therefore, the coating distribution influences predominantly the discharge capacity of the electrode material, while having a negligible influence on the voltage characteristics.
Figure 8 demonstrates the influence of the active surface fraction
on the simulated discharge curves at different C-rates. One can see that the sample with a half-inactivated surface (
Figure 8b) has a higher voltage drop at any given C-rate in comparison to the sample with a completely active surface (
Figure 8a). For instance, at the 1C discharge rate, we observe a significant decrease in the discharge voltage plateau down to 2.7 V for the sample with the half-inactivated surface (
), while the sample with a completely active surface (
) demonstrates a smaller decrease in the voltage plateau down to ~3 V.
Regarding the rate capability, it is higher for the sample with a higher active surface fraction. For example, at the 1C discharge rate, the sample presented in
Figure 8a gives a ~124 mAh/g capacity (90% of the theoretical maximum capacity of 138 mAh/g), while the sample presented in
Figure 8b gives a capacity of 107 mAh/g at the 1C discharge rate (77% of the theoretical maximum capacity value of 138 mAh/g). Therefore, a high active surface fraction is of a great importance for both the better rate capability and lower polarization of the electrode material.
It is a well-known fact that the size of active material particles influences the rate capability and voltage of the cell. For that reason, we investigated the interconnection between the particle size and discharge characteristics at different active surface fractions.
Figure 9 demonstrates the influence of the particle radius
on the galvanostatic discharge curves simulated at a 0.5C current.
Figure 9a (
) represents the case of the completely active surface, while
Figure 9b corresponds to the half-active surface (
). As can be seen, an increase in the particle radius leads to poorer voltage and capacity characteristics in both cases. However, the deterioration of the cell characteristics is much more profound in the case of the composite with a half-active surface. Thus, bigger particles have greater portions of their bulk that are poorly accessible by non-permeable coatings, which in turn have a greater effect on the capacity and C-rate dependencies.
The resistance of the film
Ωm
2 covering the active surface of the lithium iron phosphate material has a predictable influence on the discharge potential, as shown in
Figure 10. Thus, a two-fold increase in the
Ωm
2 leads to a decrease in the discharge voltage plateau of the given electrode material from 3.16 V to 3.04 V. We should note here that, in accordance with Equation (3), for the completely active surface (
), the film resistance is equal to the coating resistance
. A change in the
value can be caused by many factors, including, but not limited to, the following: SEI formation (influenced by electrolyte composition, impurities, and coating), coating fabrication conditions, and amount and nature of the additives (conventional additives, conductive polymeric additives). Therefore, we obtained the expected result: the resistance of the film covering the active material affects the polarization of the electrode materials and does not affect the capacity.
In this section, we showed how coating parameters affect the discharge capacity and polarization of the electrode material. The active surface fraction () predominantly influences the polarization of the electrode with a finely dispersed coating (), while with a coarsely dispersed coating, the has a complex effect, influencing both the capacity and the polarization of the electrode. Concerning the number of inactive spots (), it affects the discharge capacity and does not affect the polarization of the electrode. The developed model allows one to calculate the dependencies of the discharge capacity and voltage on the coating characteristics for an arbitrary electrode material. Additionally, the approximation of the experimental data with the model enables the values of the kinetic parameters and coating characteristics to be extracted.
2.4. Approximation of Experimental Galvanostatic Discharge Curves Recorded at Different C-Rates with the Developed Model
In this section, we approximate two sets of experimental data with the developed model. The first set of data contains the discharge curves of the conventional LFP
coated + C + PVDF composite material at different C-rates (0.2C, 0.5C, 1C, 2C). The second set contains the discharge curves of the composite with the addition of the PEDOT:PSS-CMC conductive binder and a reduced amount of PVDF and C additives. The conventional composite has the following composition: 84 wt% LFP
coated; 8 wt% C; 8 wt% PVDF. Additionally, the LFP
coated particles are pre-coated and, thus, 3.6% of their mass is carbon coating. Such a composition has a theoretical capacity of ~138 mAh/g. The composite with the conductive binder has the following characteristics: 92 wt% LFP
coated; 2 wt% PEDOT:PSS; 2 wt% CMC; 2 wt% C; 2 wt% PVDF. The particles of LFP
coated are the same as those in the conventional composite; thus, 3.6% of their mass is also carbon coating. The theoretical gravimetric capacity of such a composite is ~151 mAh/g. The discharge curves of both composites and their approximations by the developed model are illustrated in
Figure 11.
One can see from
Figure 11 that the compared samples differ both in rate capability and polarization. The sample with the conductive binder shows a high rate capability, maintaining approximately 93% of its theoretical capacity (~151 mAh/g) at a 2C discharge rate (
Figure 11a). On the other hand, the conventional composite retains only 77% of its theoretical capacity (~138 mAh/g) at a 2C discharge rate (
Figure 11b). Hence, it can be concluded that a conventional composite has a lower active surface fraction
or/and more coarsely dispersed coating (a lower number of inactive spots
). This is probably due to the higher fraction of ion-impermeable additives in the conventional composite compared to the composite with the conductive binder, as can be seen in the SEM images (
Figure 2). One more reason for the reduced value of
may be the formation of dense SEI layers on parts of the LFP surface in the case of the conventional composite, and the prevention of the formation of dense SEI layers in case of the composite with the conductive binder. The conventional composite has a more coarsely dispersed coating, as carbon additives are known to form agglomerates during electrochemical cycling. A reduced active surface fraction
and coarsely dispersed coating result in a deterioration in the diffusion characteristics and, consequently, in a reduced discharge capacity at high C-rates.
Concerning a drop in the discharge voltage, it is much more profound for the cell with a conventional composite electrode. Thus, increasing the discharge rate from 0.2C to 2C leads to a decrease in the discharge voltage by more than 600 mV for the cell with a conventional composite electrode; meanwhile, for the composite electrode with a conductive binder, the same change in discharge C-rates results only in a ~160 mV decrease in the voltage. The latter implies that the addition of a conductive binder and a reduction in the amount of carbon and PVDF additives in the composite electrode lead to a significant decrease in the coating resistance
. This effect occurs for several reasons. First, as mentioned above, the conventional composite electrode has a lower active surface fraction, which leads to the increase in the coating resistance
, in accordance with Equation (3). Second, the resistance of the conductive binder film
is likely to be lower than the resistance of the PVDF+SEI film covering the conventional composite electrode particles, which influences the coating resistance via Equation (3). Both these factors result in the significant decrease in the discharge voltage of the cell with a conventional composite electrode. Thus, the addition of a conductive binder enables the coating resistance to be reduced by several times. A comparison of the coating resistances measured via Electrochemical Impedance Spectroscopy (EIS) for both the conventional composite and composite with a conductive binder can be found in
Appendix B.
One may argue that solid conductivity is another factor that can influence the discharge voltage plateau of the cell. However, the data in the literature on the effective solid conductivity for such types of electrodes (LFP, different coatings, compositions and sizes) varies in the range of 5 × 10
−4–5 S/m. Thus, such values of effective solid conductivity result in a maximum of a 30 mV shift in the voltage plateau (
Appendix C) and lead to no change in the discharge capacity.
An approximation of the two sets of experimental galvanostatic discharge curves (
Figure 11) was performed using the model described in
Section 2. The approximation steps were as follows. At first, we noted that the composite electrode with a conductive binder demonstrated a good rate capability and low polarization values. This implies that the composite electrode had a high value of active surface fraction
. A high value of
(
) allows one to neglect the impact of the coating on the diffusion characteristics of the electrode (see
Figure 4). In this case, the coating had an influence on the charge transfer characteristics only and, thereby, could be accounted for by parameter
. Such an approach allowed us to estimate the value of the diffusion coefficient of lithium in the solid (
Ds) by approximating the first set of experimental discharge curves (composite electrode with conductive binder) with the model; see
Figure 11a. The obtained value (
cm
2/s) was in accordance with the values used in the works [
23,
31]. Then, we used the same value of
to approximate the set of discharge curves of the conventional composite electrode (because
is a bulk characteristic of the material and does not depend on the coating and additives). The latter approximation allowed us to obtain values of the coating characteristics (
) of the conventional composite electrode. The values of the other parameters used in the simulation are presented in
Table 1.
As one can see, the model satisfactorily describes the experimental curves. The discrepancies that are observed closer to the end of the discharge process are most certainly related to the distribution of the particle shapes and sizes as it was shown in the work [
23]. According to the above approximations, a four-fold reduction in the carbon and PVDF additives (from 8% to 2%) and the simultaneous use of a conductive binder leads to two-fold increase in the active surface fraction of the active material and to a ten-fold decrease in the coating resistance
of the LFP material.


 ,
, 


