Article

Visualization of Cellular Membranes in 2D and 3D Conditions Using a New Fluorescent Dithienothiophene S,S-Dioxide Derivative

by
Aneta Rzewnicka
1,
Jerzy Krysiak
1,
Róża Pawłowska
2,* and
Remigiusz Żurawiński
1,*
1
Division of Organic Chemistry, Centre of Molecular and Macromolecular Studies, Polish Academy of Sciences, Sienkiewicza 112, 90-363 Lodz, Poland
2
Division of Bioorganic Chemistry, Centre of Molecular and Macromolecular Studies, Polish Academy of Sciences, Sienkiewicza 112, 90-363 Lodz, Poland
*
Authors to whom correspondence should be addressed.
Int. J. Mol. Sci. 2023, 24(11), 9620; https://doi.org/10.3390/ijms24119620
Submission received: 29 April 2023 / Revised: 29 May 2023 / Accepted: 30 May 2023 / Published: 1 June 2023
(This article belongs to the Special Issue Research Progress of Bioimaging Materials)

Abstract

:
Cellular membranes play a key role in cell communication with the extracellular environment and neighboring cells. Any changes, including their composition, packing, physicochemical properties and formation of membrane protrusions may affect cells feature. Despite its great importance, tracking membrane changes in living cells is still a challenge. For investigation of processes related to tissue regeneration and cancer metastasis, such as the induction of epithelial-mesenchymal transition, increased cell motility, and blebbing, the possibility to conduct prolonged observation of membrane changes is beneficial, albeit difficult. A particular challenge is conducting this type of research under detachment conditions. In the current manuscript, a new dithienothiophene S,S-dioxide (DTTDO) derivative is presented as an effective dye for staining the membranes of living cells. The synthetic procedures, physicochemical properties, and biological activity of the new compound are presented herein. In addition to the labeling of the membranes in a monolayer culture, its usefulness for visualization of membranes under detachment conditions is also demonstrated. Obtained data have proven that a new DTTDO derivative may be used to stain membranes in various types of experimental procedures, from traditional 2D cell cultures to unanchored conditions. Moreover, due to the specific optical properties, the background signal is reduced and, thus, observation may be performed without washing.

1. Introduction

Cellular membranes are one of the most important cell components, involved in numerous processes required for the proper functioning of cells such as endocytosis, migration, cell division, intracellular communication, and the reception of extracellular signals [1,2]. Development, tissue regeneration, as well as cancer progression and metastasis, are related to membrane rearrangements and changes in its motility and physicochemical properties. Any alterations in membrane composition, structure, morphology, viscosity, and even shape, may be connected with numerous pathological states [3]. The key examples for visualizing the importance of membrane-related changes in cell properties are cancer cells. It was frequently demonstrated that cancerogenesis and, subsequently, cancer progression and metastasis are related to various alterations in membrane structure, composition, and characteristics [4,5]. The quantity and type of transmembrane proteins, including surface receptors, enzymes, and other elements, affect extracellular signaling and may induce critical changes in cell properties. The presence of receptors for extracellular nucleotides [6,7,8] and growth factors [9,10,11] may induce changes related to acquiring an invasive character of cancer cells. This type of cell communication with the surrounding area may provide induction of epithelial-mesenchymal transition, anoikis resistance, and enhancement of cell migration [12,13].
Numerous data have shown that not only constitution, but also membrane fluidity [14] and shape [15], are important factors which may play a key role in various physiological and pathological processes. The formation of membrane protrusions is an important element of cell functioning. These kinds of changes were originally discovered to be associated with cell death [16]; however, further investigations have also shown their importance in other processes related to cell movement [17,18,19,20,21] during chemotaxis [22] and invasion [15,23,24], as well as those related to anoikis resistance [25,26]. Although membrane blebbing was originally discovered as a process related to apoptosis, the newest data indicate that it may be connected with the escape of other types of cell death induced by detachment conditions named anoikis [25,27]. Thus, both amoeboid cell movement and anoikis resistance may depend on the blebs. Due to the rapid and variable nature of blebs’ formation, their tracking is difficult and requires real-time observation [25,28].
The growing interest in research conducted in anchorage-independent, three-dimensional systems revealed the necessity of designing and creating markers for visualization processes conducted in such conditions. This type of study is a great alternative to traditional research based on the cell cultures conducted in monolayer. Furthermore, 3D cultures allow for a decrease in the number of in vivo studies and, therefore, seem to be the future of drug screening [29]. Despite these advantages, the studies of cellular processes under nonattachment conditions remain challenging. Membrane blebbing, cell-to-cell contact, and formation of structures such as spheroids and organoids are still difficult to visualize. In particular, real-time fluorescent visualization of membrane-related changes is a great challenge. Such research needs to use nontoxic compounds. The perfect dye is expected to be useful for real-time observation in prolonged incubation time and exhibits a stable fluorescent signal without residual background fluorescence. Small fluorophores [30,31] seem to be a great option for staining membranous cell compartments. Among others, small dyes based on benzothiadiazole [32,33], nitrobenzodiazole [34], squaraine [35], styrylpyridine [36,37,38,39], oxazolopyridine [40], perylene [41], and fluorene [42] have been proposed as membrane markers. The typical dye designed for this purpose contains a lipophilic fragment, enabling incorporation into the bilayer, and a hydrophilic part which allows for good solubility in biological systems.
Due to some limitations of colocalization experiments, different excitation and emission wavelength ranges are required for various experiments. Certain green-emitting oligoelectrolytes for membrane staining, containing a phenylenevinylene [43,44] or distyrylnaphthalene [45,46] core, blue chromone [47], red-emitting styrylpyridine [37], or dithienothiophene-based [48] dyes, have been proposed previously. In the current research, a new fluorescent dye based on a dithienothiophene S,S-dioxide core is presented as a suitable tool for live cell imaging in 2D and 3D cell culture systems.
Dithienothiophene-based (DTT) compounds have been designed and synthesized mainly as organic electronic materials. They constitute attractive objects for supramolecular chemistry [49,50,51,52]; however, some of them have also been found to be good candidates for biological applications [53,54,55,56]. Among this group of compounds, dithienothiophene (DTT) and its S,S-dioxide (DTTDO) derivatives have been successfully applied in cellular studies [48,57,58,59,60]. In the current manuscript, a new DTTDO derivative, named DTTDO-NMe3+, is proposed as an effective dye for staining cellular membranes. Its synthesis, cellular uptake, intercellular localization, and impact on cell viability are demonstrated herein. Labeling was performed in living cells under different cell culture conditions, proving the usefulness of DTTDO-NMe3+ for membrane staining in various experimental procedures.

2. Results and Discussion

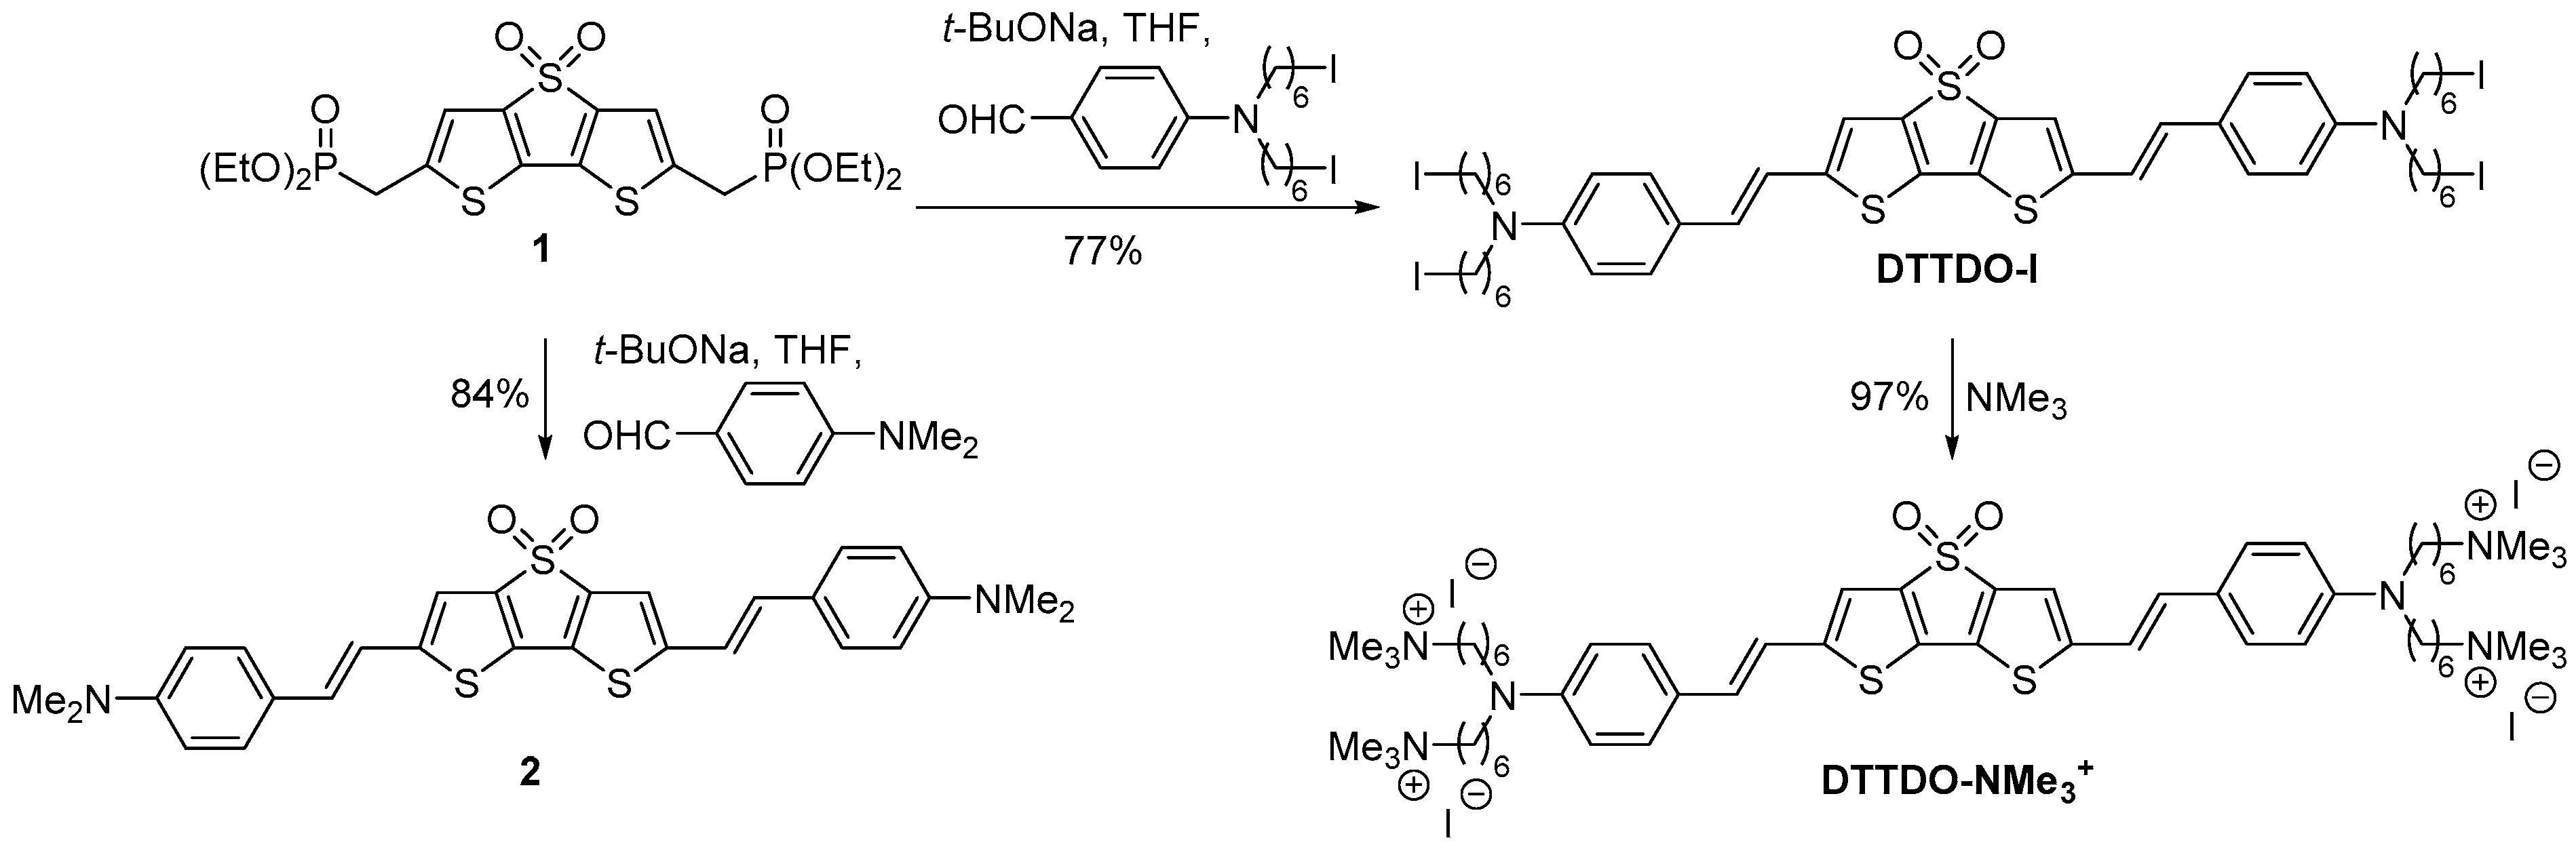
2.1. Synthesis of Dithienothiophene S,S-Dioxide Derivatives

The synthesis of DTTDO-NMe3+ and DTTDO derivative 2 was based on the bisphosphonate 1 used as a common starting material (Scheme 1). DTTDO-NMe3+ was obtained in the reaction sequence encompassing Horner–Wadsworth–Emmons olefination reaction of bisphosphonate 1 with 4-(N,N-bis(6-iodohexyl)amino)benzaldehyde [48] followed by quaternization reaction of formed tetraiodide DTTDO-I with an excess of trimethylamine. On the other hand, compound 2—which can be considered as a simplified derivative of DTTDO-NMe3+ in which the four substituted alkyl chains were replaced with methyl groups—was prepared in the reaction of bisphosphonate 1 with 4-(N,N-dimethylamino)benzaldehyde. DTTDO derivative 2 was used only as a model compound for the comparison of its optical and electronic properties with the results obtained by theoretical calculations.

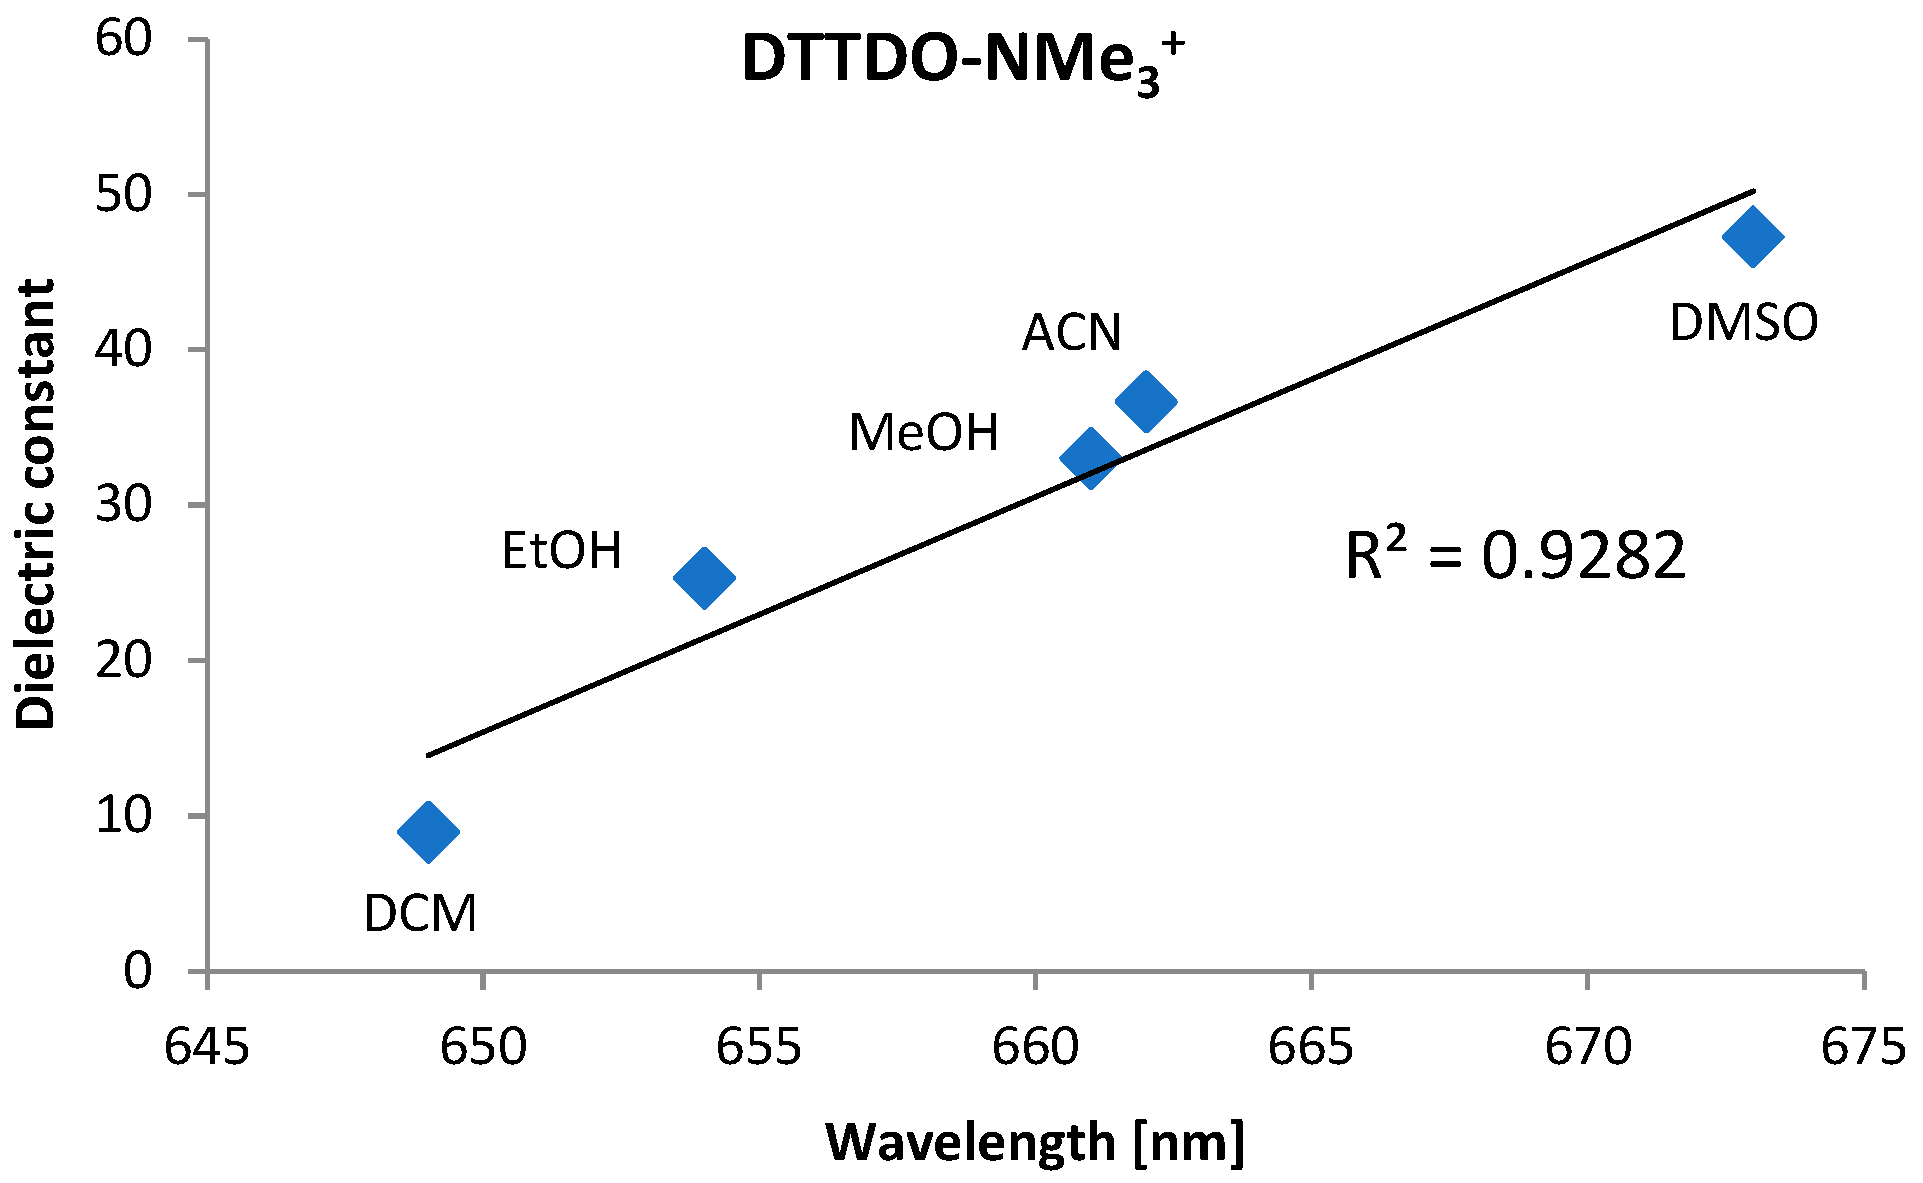
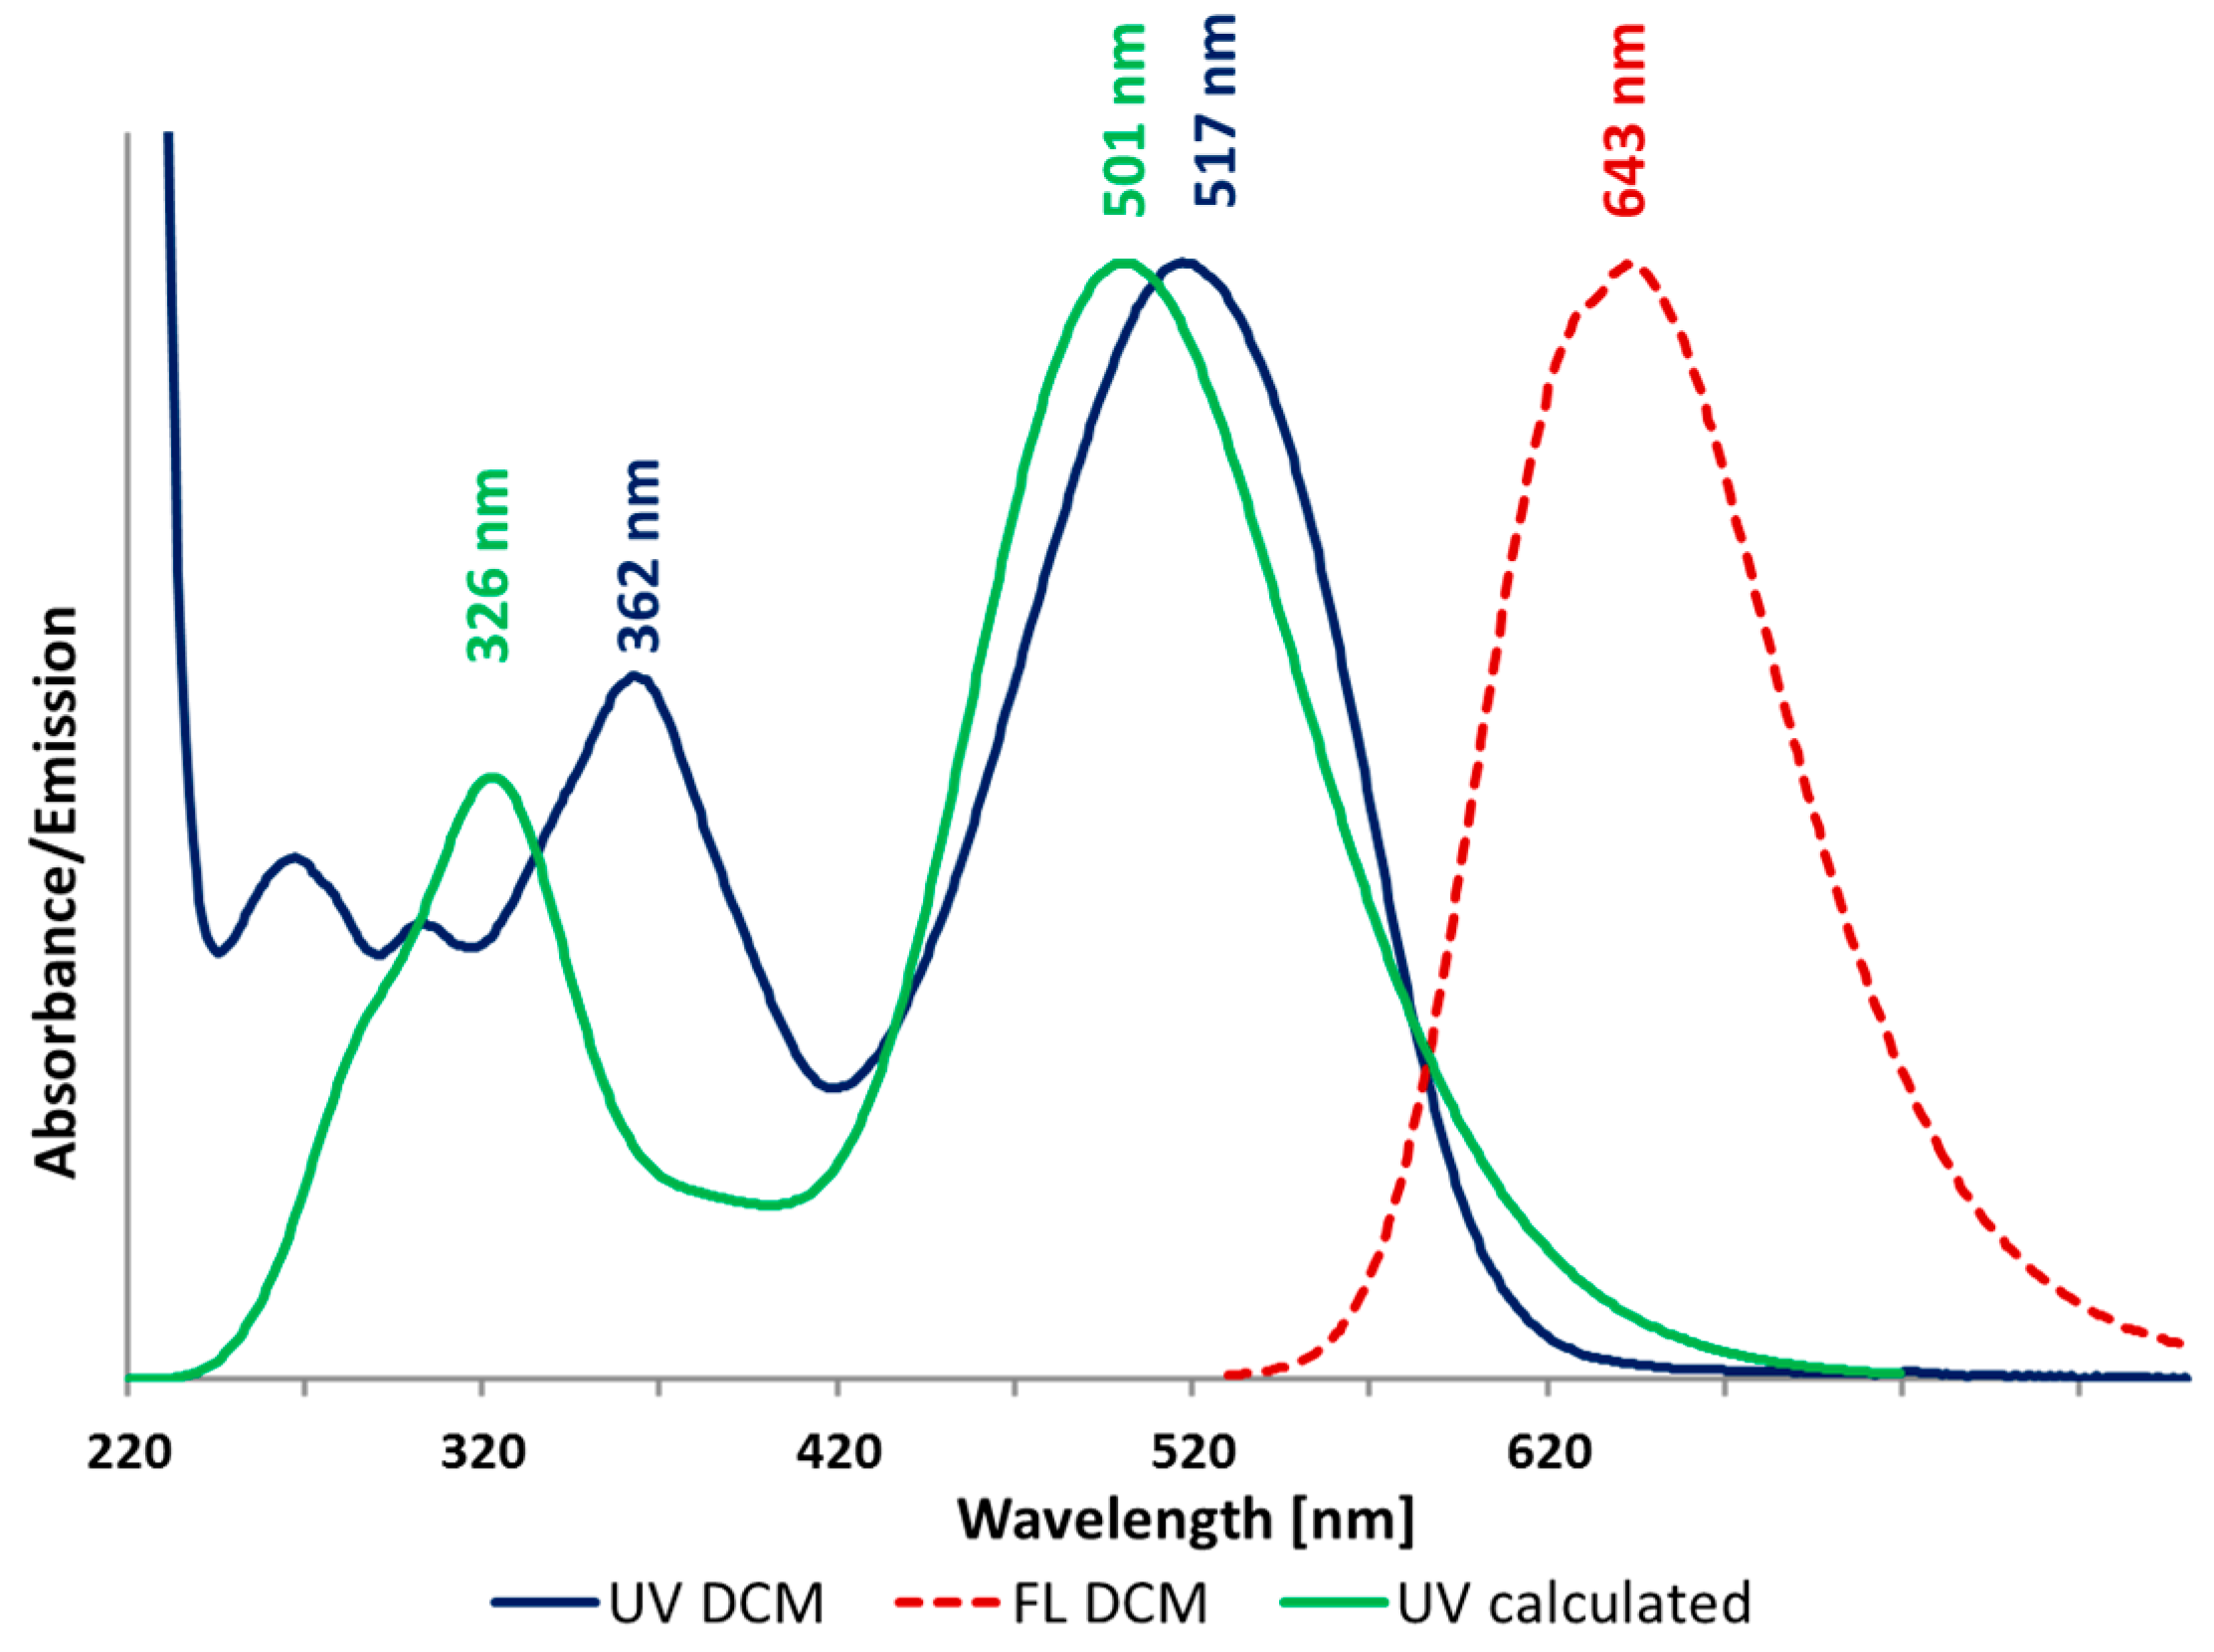
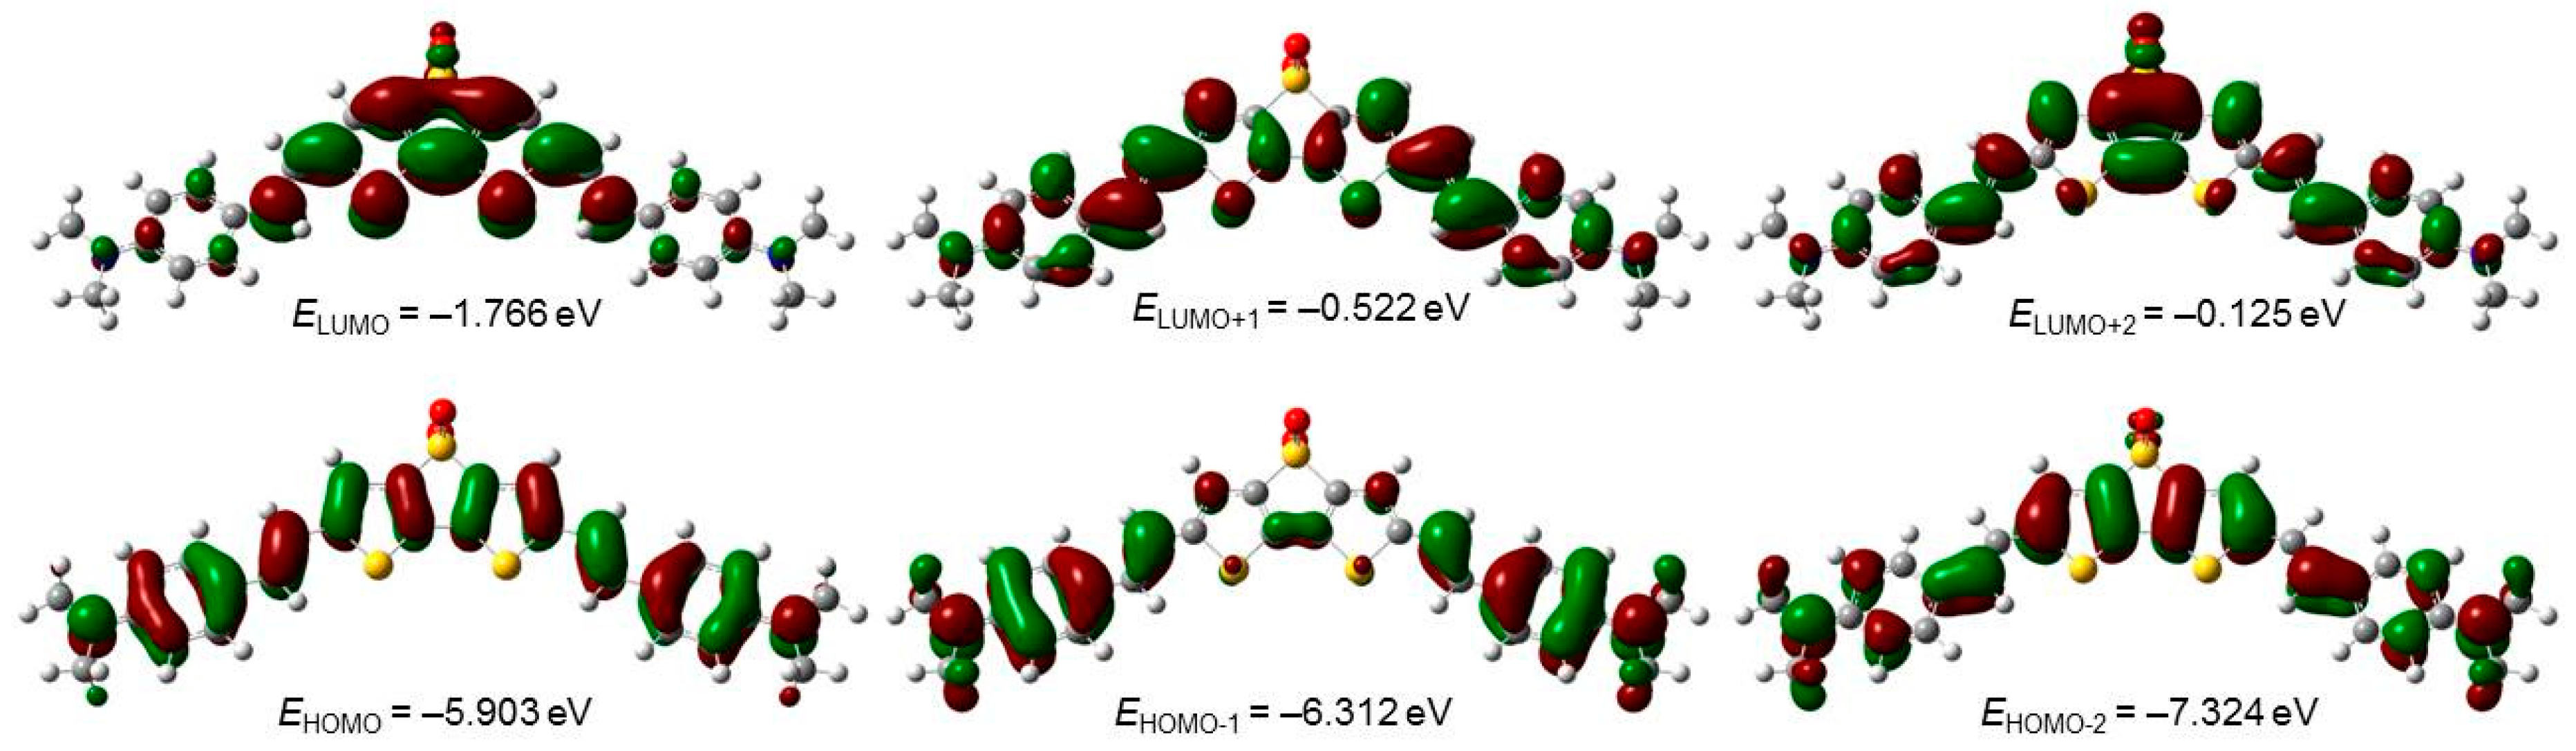
2.2. Photophysical Properties of DTTDO Derivatives

Due to the presence of four ammonium groups, DTTDO-NMe3+ is well soluble in protic and aprotic highly polar solvents, slightly soluble in DCM, and not soluble in solvents of low polarity such as hexane, diethyl ether, or THF. Electronic absorption and emission spectra of DTTDO-NMe3+ in different solvents are presented in Figure 1, while the maxima absorption and emission wavelengths are collected in Table 1. Absorption spectra of DTTDO-NMe3+ in all investigated solvents exhibit 2 distinct signals: a major strong absorption signal at about 518 nm (534 nm in DMSO), and a less intensive higher energy band in the range of 350–372 nm. Emission spectroscopy revealed that DTTDO-NMe3+ does not fluoresce in water but shows fluorescence in other solvents. In contrast to the maximum absorption wavelength, which to a large extent does not depend on the type of solvent, in fluorescence spectra of DTTDO-NMe3+, a strong correlation between the maximum emission wavelength and the solvent polarity was observed (Figure 2). An increase in the solvent dielectric constant resulted in a strong bathochromic shift of maximum λem to a longer wavelength. This observation indicates that the excited state of DTTDO-NMe3+ is more polarized than the ground state and, consequently, it is better stabilized by polar solvents. Solvent solutions of DTTDO-NMe3+ exhibited a significant difference between maximum λem and λabs wavelength, ranging from 132 to 145 nm, which suggests a strong electron reorganization between S0 and S1 state. The highest λem of 673 nm was observed in DMSO. The solvent polarity also strongly affects the fluorescence quantum yield of DTTDO-NMe3+. While in water solution, this compound does not show fluorescence, and in DMSO, the fluorescence quantum yield is only about 4%, it noticeably increases in dichloromethane, reaching a value of 17%.
To provide a deeper insight into the electron excitation process, time-dependent DFT calculations were conducted at the m062x/6-311+G(2d,p)//m062x-D3/6-311G(d,p) level of theory and compared with experimental results for model DTTDO derivative 2. As evidenced by Figure 3, the calculated UV-VIS spectrum correlates well with the experimental result in terms of the shape and band intensities. Excitation bands for 2 main signals are blue-shifted by 16 and 36 nm in comparison with the corresponding experimental values.
TDDFT calculation revealed that the lowest energy excitation in 2 mainly involves the HOMO–>LUMO transition (Table 2). Because the HOMO in 2 is fully delocalized in the whole molecule (except sulfur and oxygen atoms), while the LUMO displays the highest molecular orbital density on the dithienothiophene dioxide fragment, it could be deduced that this excitation has an intramolecular charge transfer (CT) character (Figure 4). A similar conclusion can be drawn from the analysis of S0–>S2 excitation, which involves the LUMO and HOMO-1 (mainly localized on the amino, styryl, and vinyl groups). On the other hand, the excitation to the S3 excited state has a more complex nature and encompasses the HOMO–>LUMO+2, HOMO-2–>LUMO, and HOMO-1–>LUMO+1 transitions. The analysis of TDDFT calculations also revealed that the change in electron distribution during the photoexcitation process is reflected in the change of electric dipole moment between ground and excited states. Thus, while the dipole moment for the ground state is equal to 9.68 D, its value increases by about 3 to 4 D for the first 3 excited states. These results are in full agreement with the experimentally observed bathochromic shift in the emission spectra of DTTDO-NMe3+.

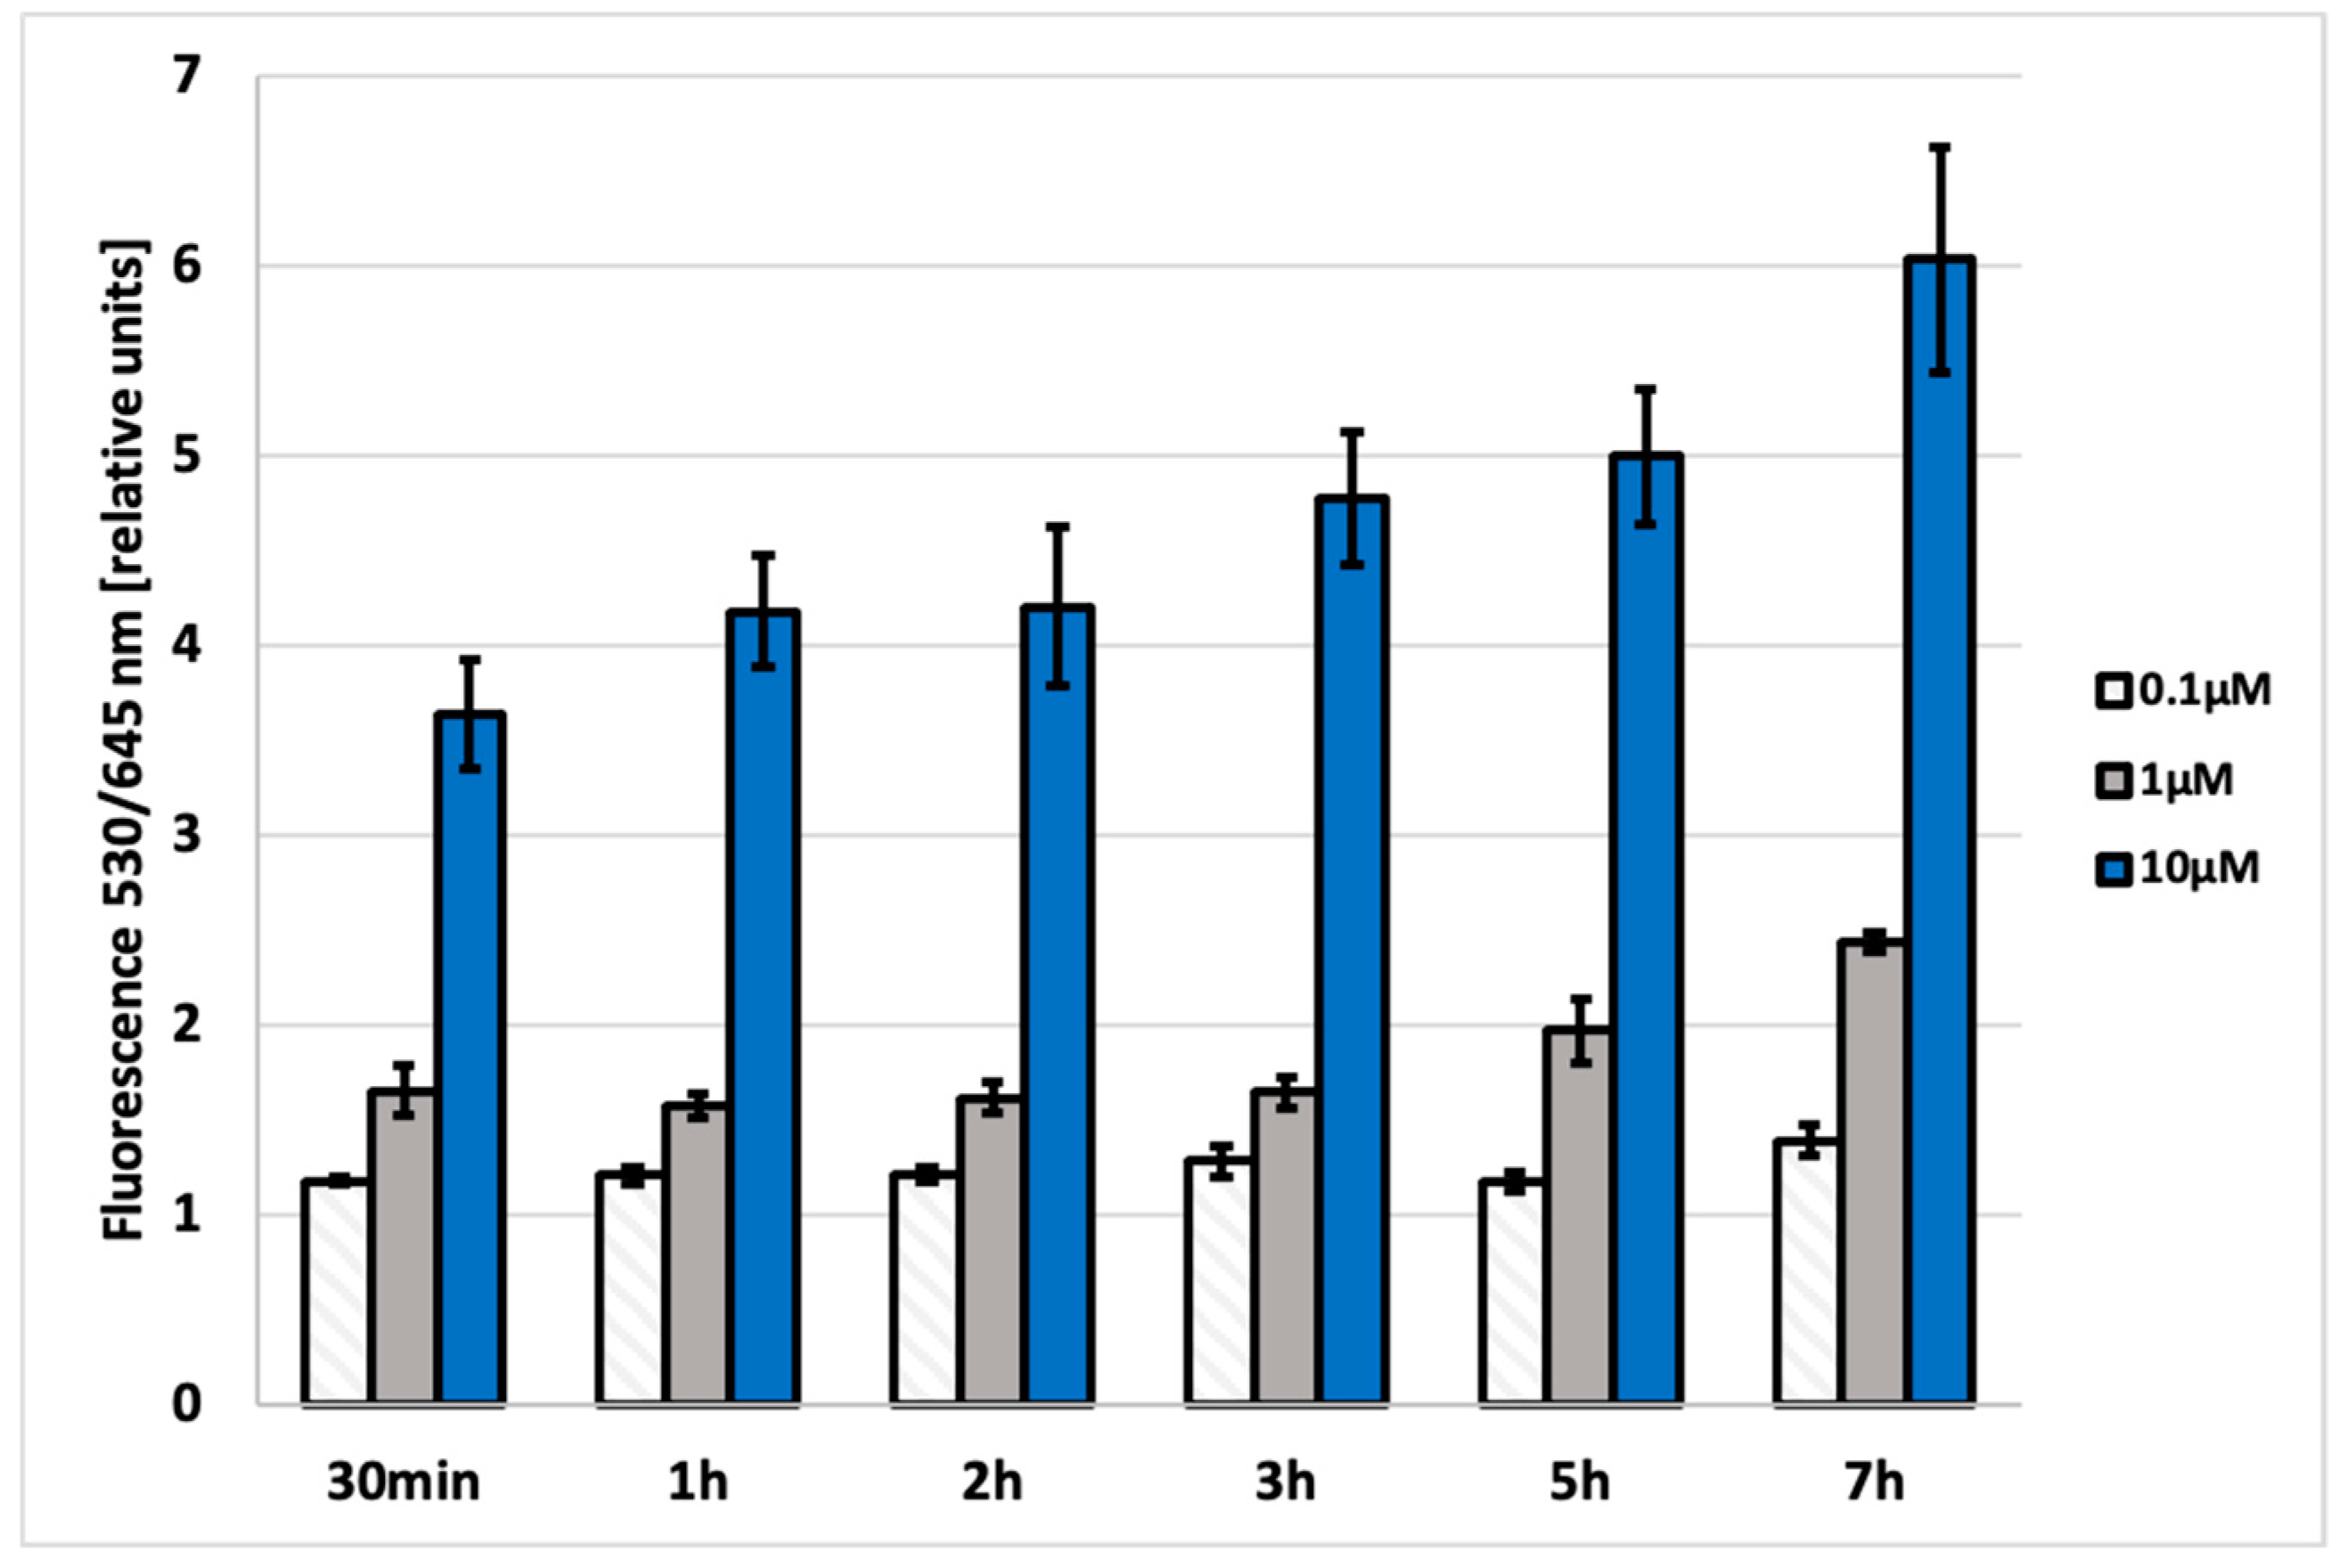
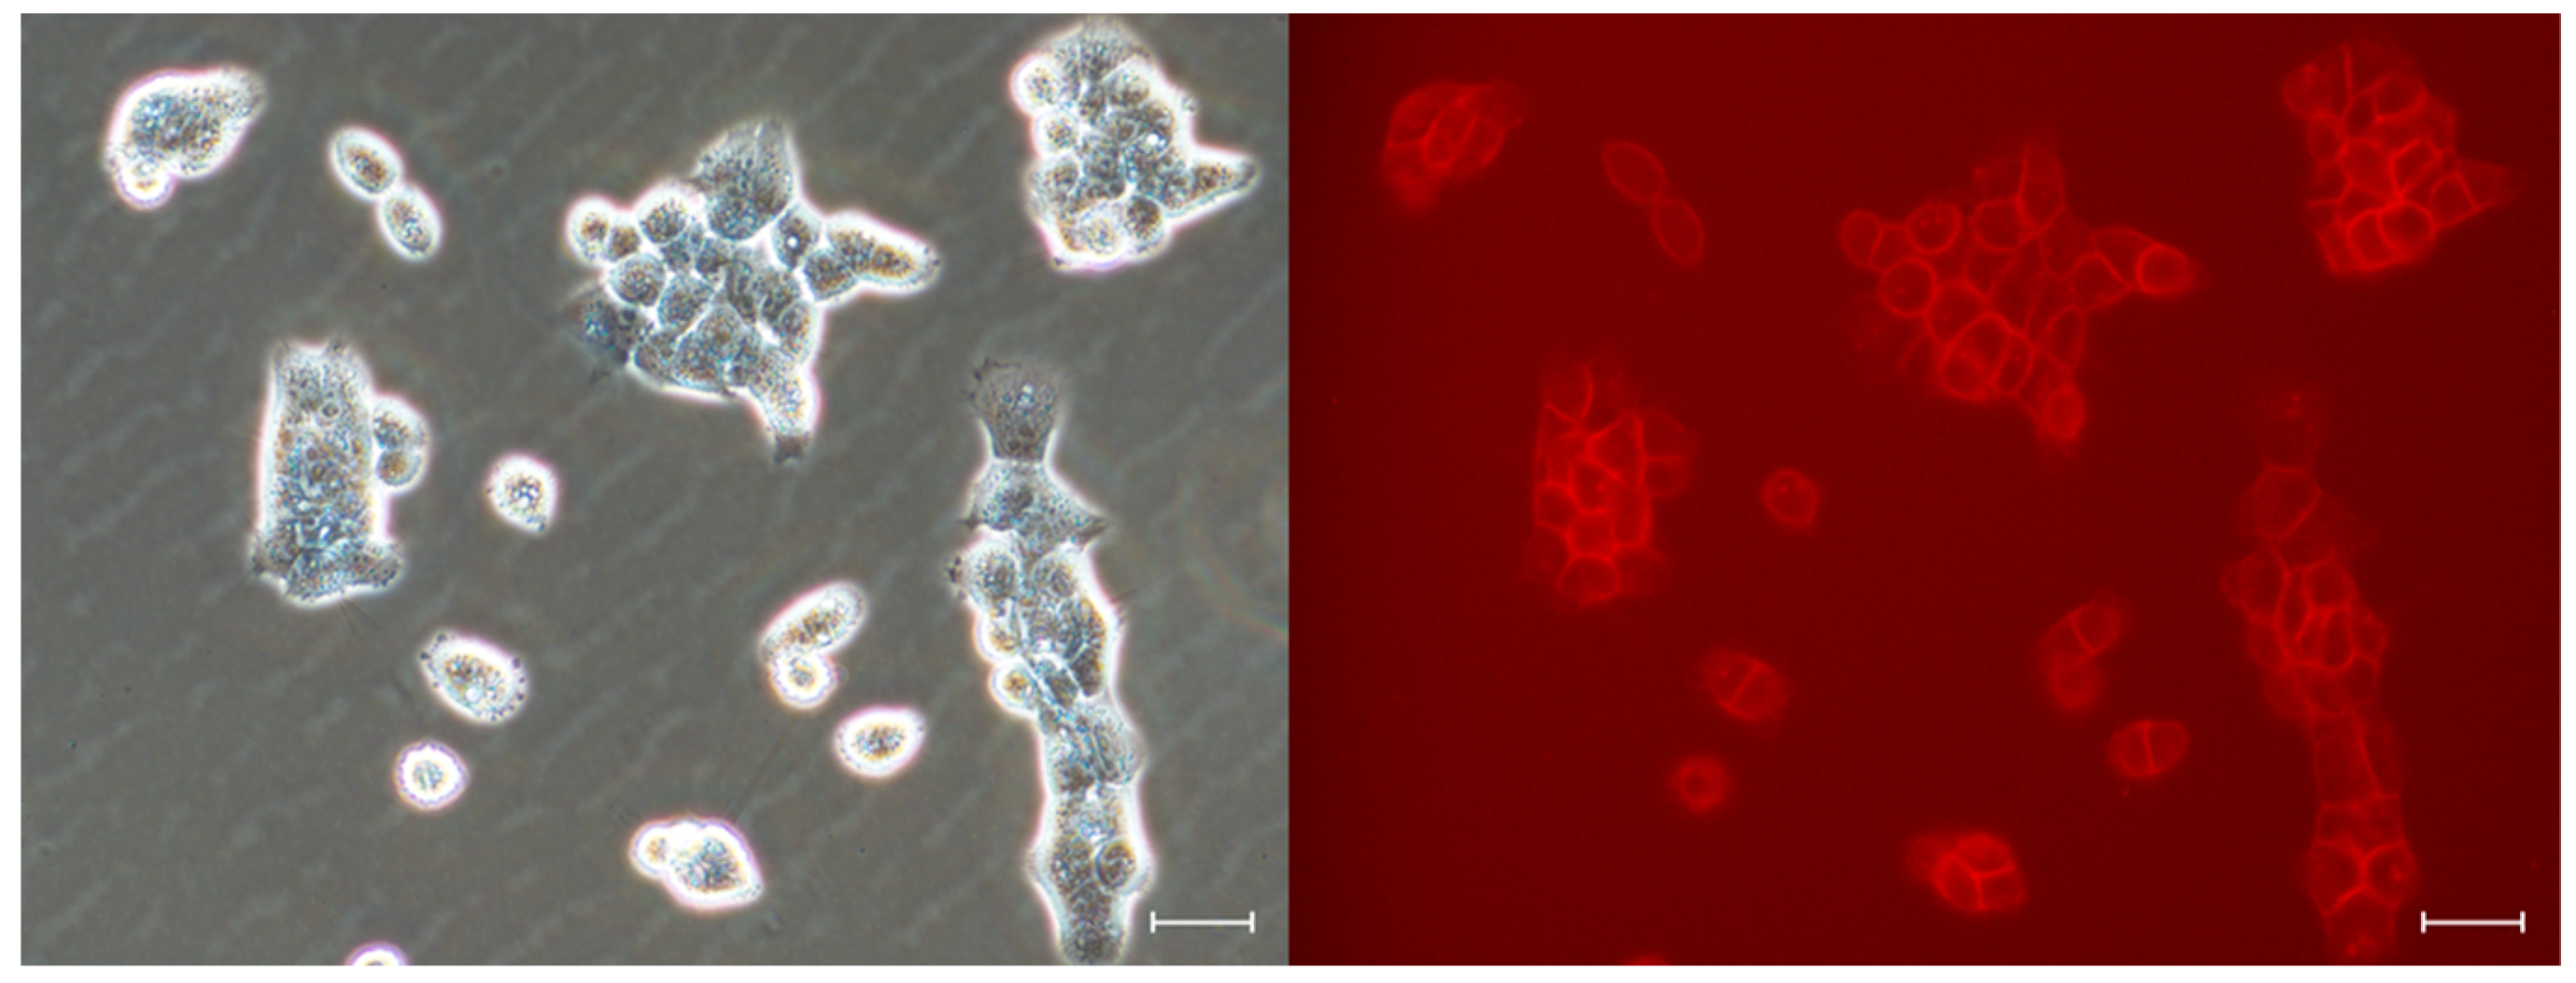
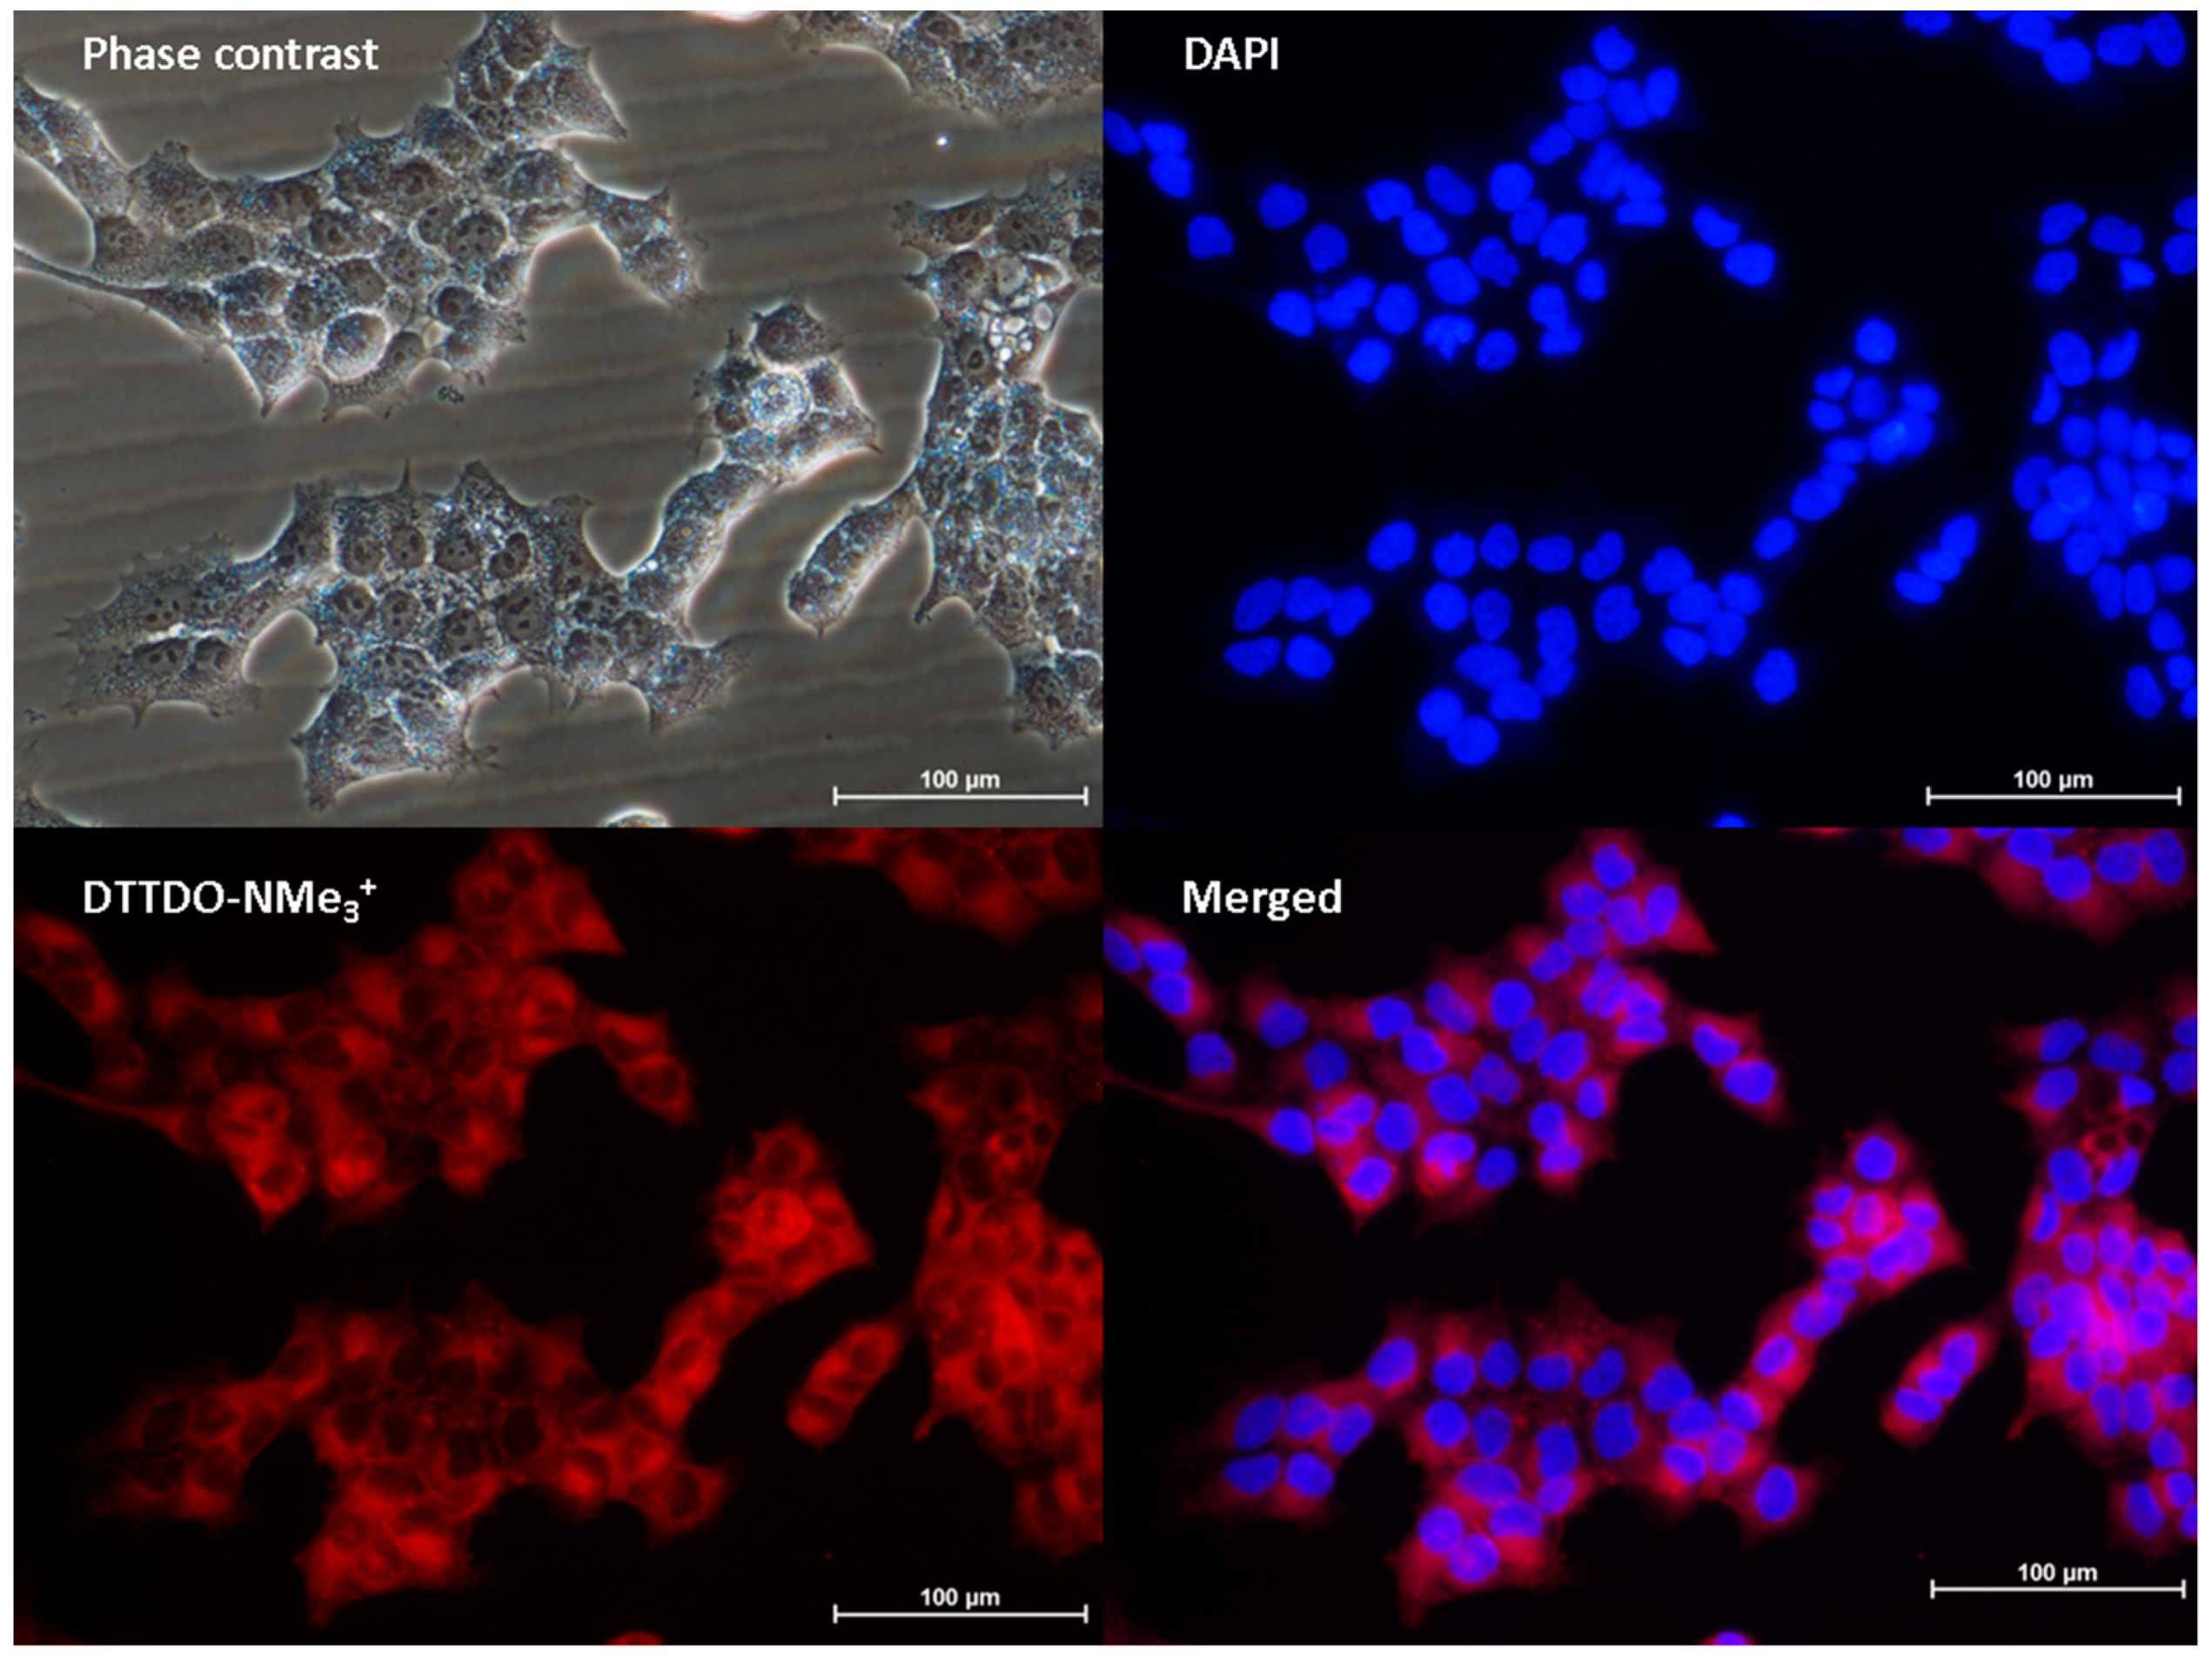
2.3. Verification of Fluorescent Properties inside the Cells

In order to investigate the potential usefulness of DTTDO-NMe3+ for cell staining, fluorescence measurements from the cells and microscopic observation were performed. For the quantification of intracellular fluorescence intensity, A431 cells were treated with the tested compound, washed, and fluorescence in the wavelength range characteristic for this dye (λex = 530/25 nm and λem = 645/40 nm) was measured. To determine the conditions required for effective cell staining, the samples’ fluorescence was measured after 30 min, 1 h, 2 h, 3 h, 5 h, and 7 h upon treatment of cells with DTTDO-NMe3+ at different concentrations (0.1, 1, and 10 μM) (Figure 5).
These time- and concentration-dependent measurements allowed for the determination of optimal conditions for cell staining. It was found that 30 min incubation with 10 μM DTTDO-NMe3+ is sufficient to observe high fluorescence intensity derived from intracellular staining. The tests were performed in a complete culture medium, which proved that staining can be performed under standard culture conditions in the presence of fetal bovine serum (FBS) and antibiotics.
Additional evidence of the ability of DTTDO-NMe3+ to stain cells was provided by fluorescent microscopy observations. Even after 30 min incubation with the tested compound, strong fluorescent labeling was visible (Figure 6), which indicated the possibility of using this marker for rapid cell staining in various types of assays. Because DTTDO-NMe3+ does not exhibit fluorescence in water, washing of the cells turned out to be unnecessary for fluorescent microscopy observations, which extends the application possibilities of the tested dye and enables the real-time observation of stained cells.

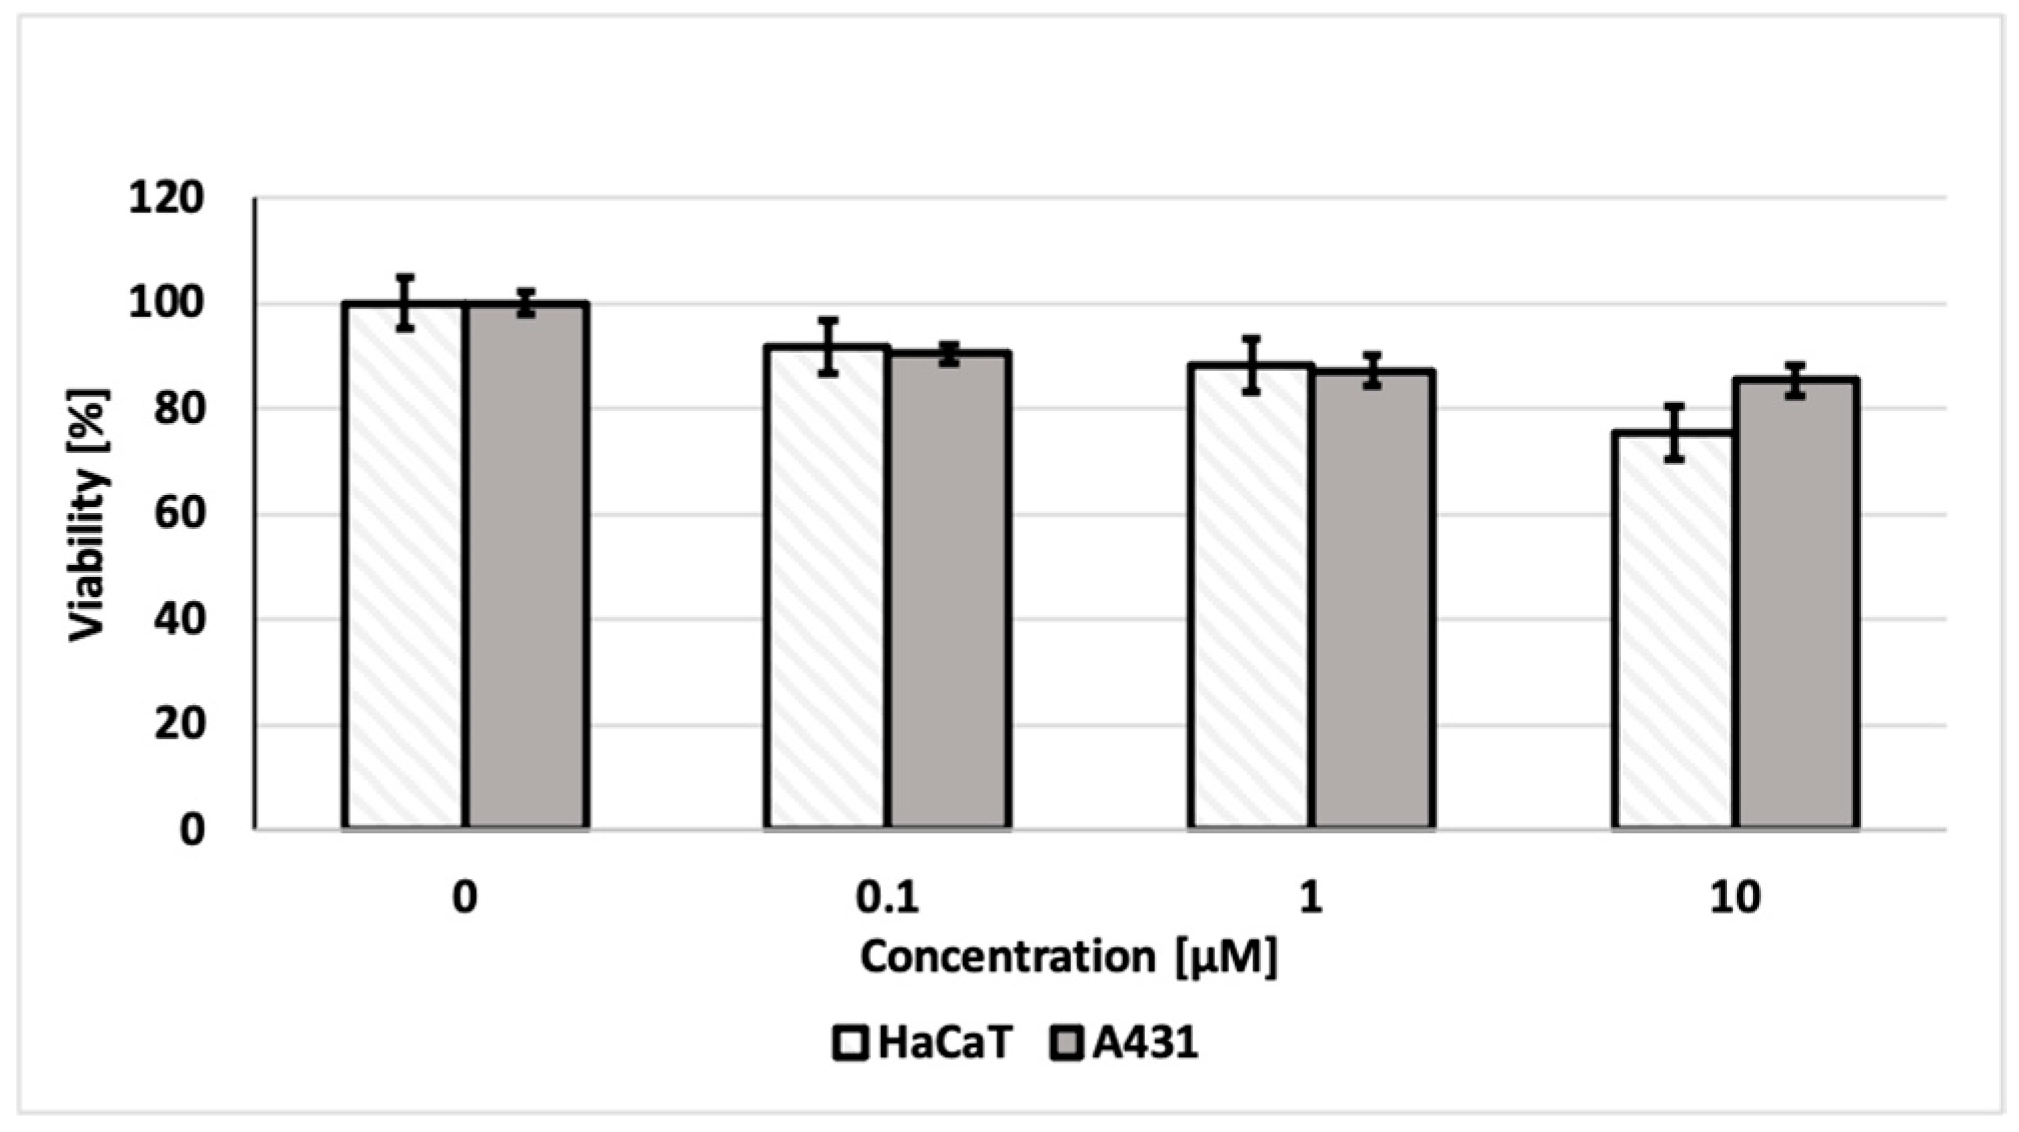
2.4. Impact on Cell Viability

In order to assess the applicability for long-term experiments, the toxicity of the new dye was investigated. Cytotoxicity tests were performed on the epidermoid squamous carcinoma cells (A431) using noncancerous cells—human keratinocytes (HaCaT). In none of these cases did cytotoxicity exceed 25% after 24 h of incubation (Figure 7). These results indicate that DTTDO-NMe3+ can also be safely used in various types of experiments, including procedures that require long-term staining, such as real-time observations of cell properties under various conditions.

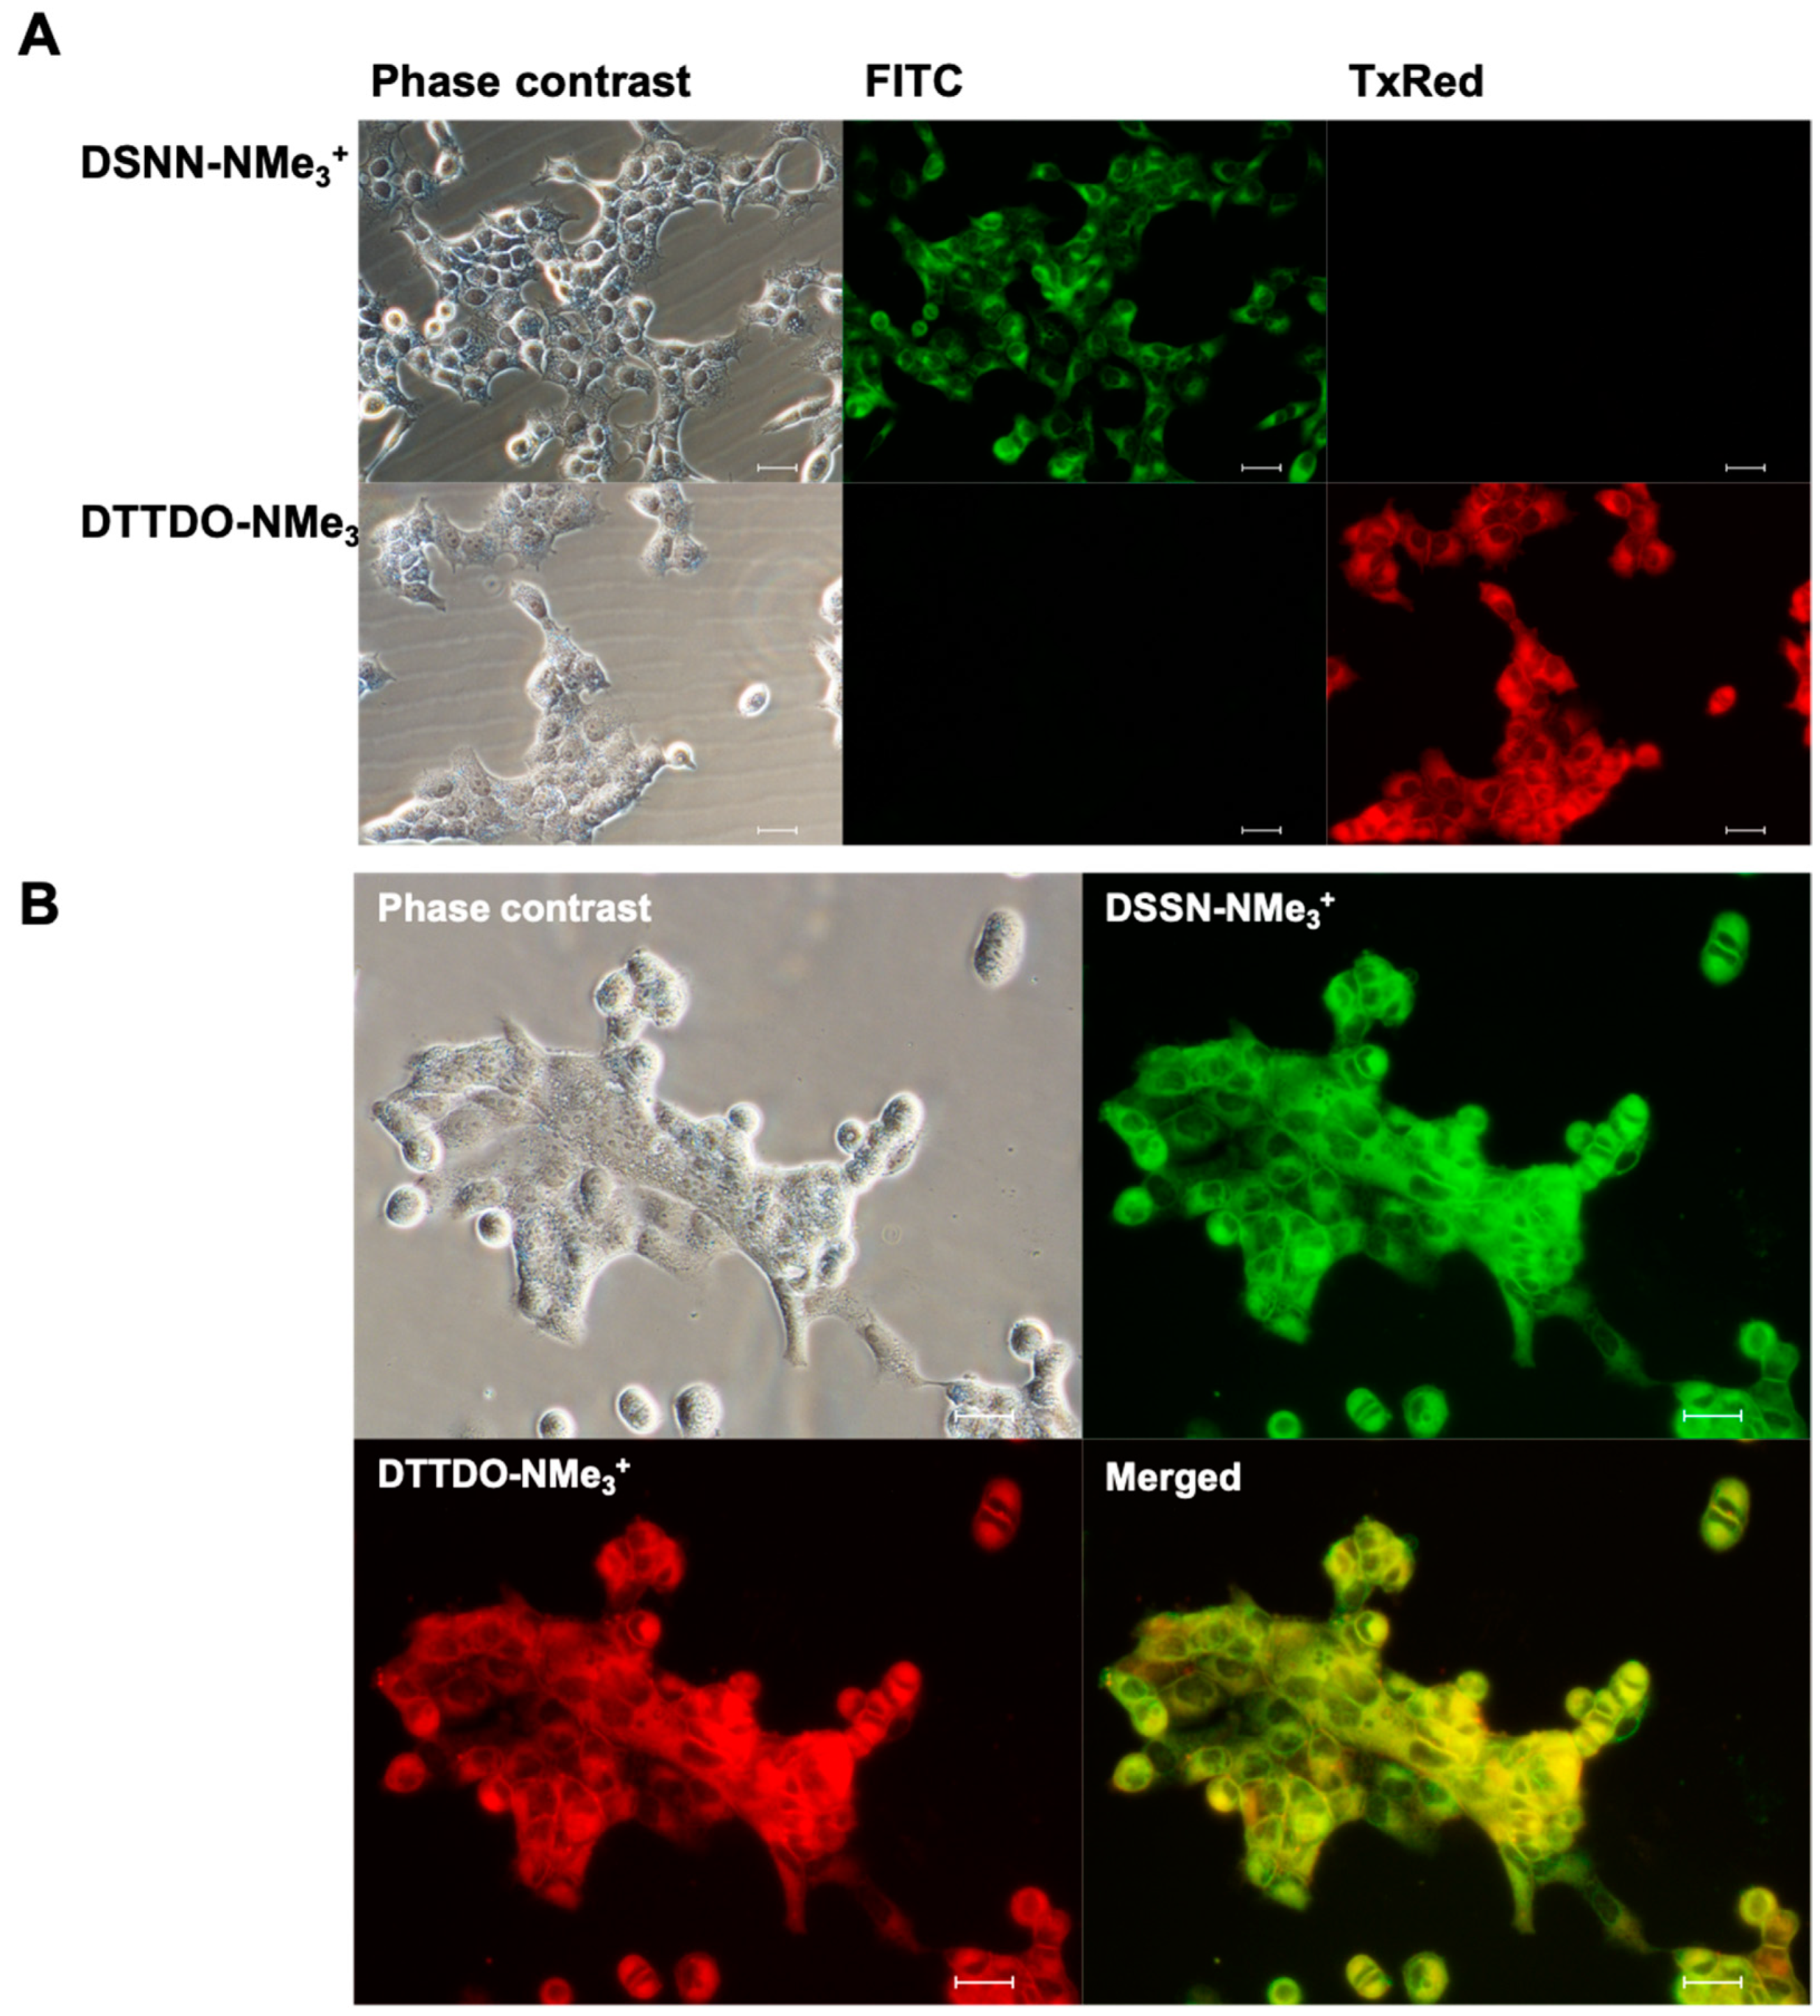
2.5. Intercellular Localization Studies

To confirm the intercellular localization of fluorescent DTTDO-NMe3+ dye, colocalization studies with a membrane marker—DSSN-NMe3+ were conducted. DSSN-NMe3+ is a conjugated oligoelectrolyte whose ability to stain the outer cellular membrane and intercellular membranous structures has been reported previously [43,44]. The large difference in the emission wavelength of these two compounds eliminated possible spectral overlapping and ensured the credibility of colocalization results. The usefulness of both dyes for colocalization studies was confirmed through their observation with appropriate filters (Figure 8A).
The co-staining studies revealed the presence of fluorescent signal in the same cellular compartments after treatment with DTTDO-NMe3+ and DSSN-NMe3+ membrane dye (Figure 8B). Such colocalization of the tested compound with the marker of membranous structures confirmed their localization inside the membranes, which indicated the accuracy of the research hypothesis regarding the intercalation of DTTDO derivative into lipid bilayers and showed the usefulness of the tested compound for staining cellular membranes and membranous structures.
Furthermore, the microscopic analysis indicated the absence of the tested DTTDO derivative inside the nucleus. In order to verify this observation, additional colocalization studies using DAPI—a cell nucleus staining marker—were performed. Obtained results confirmed that, similarly to DSSN-NMe3+, the tested DTTDO-NMe3+ did not penetrate into the nucleus (Figure 9).

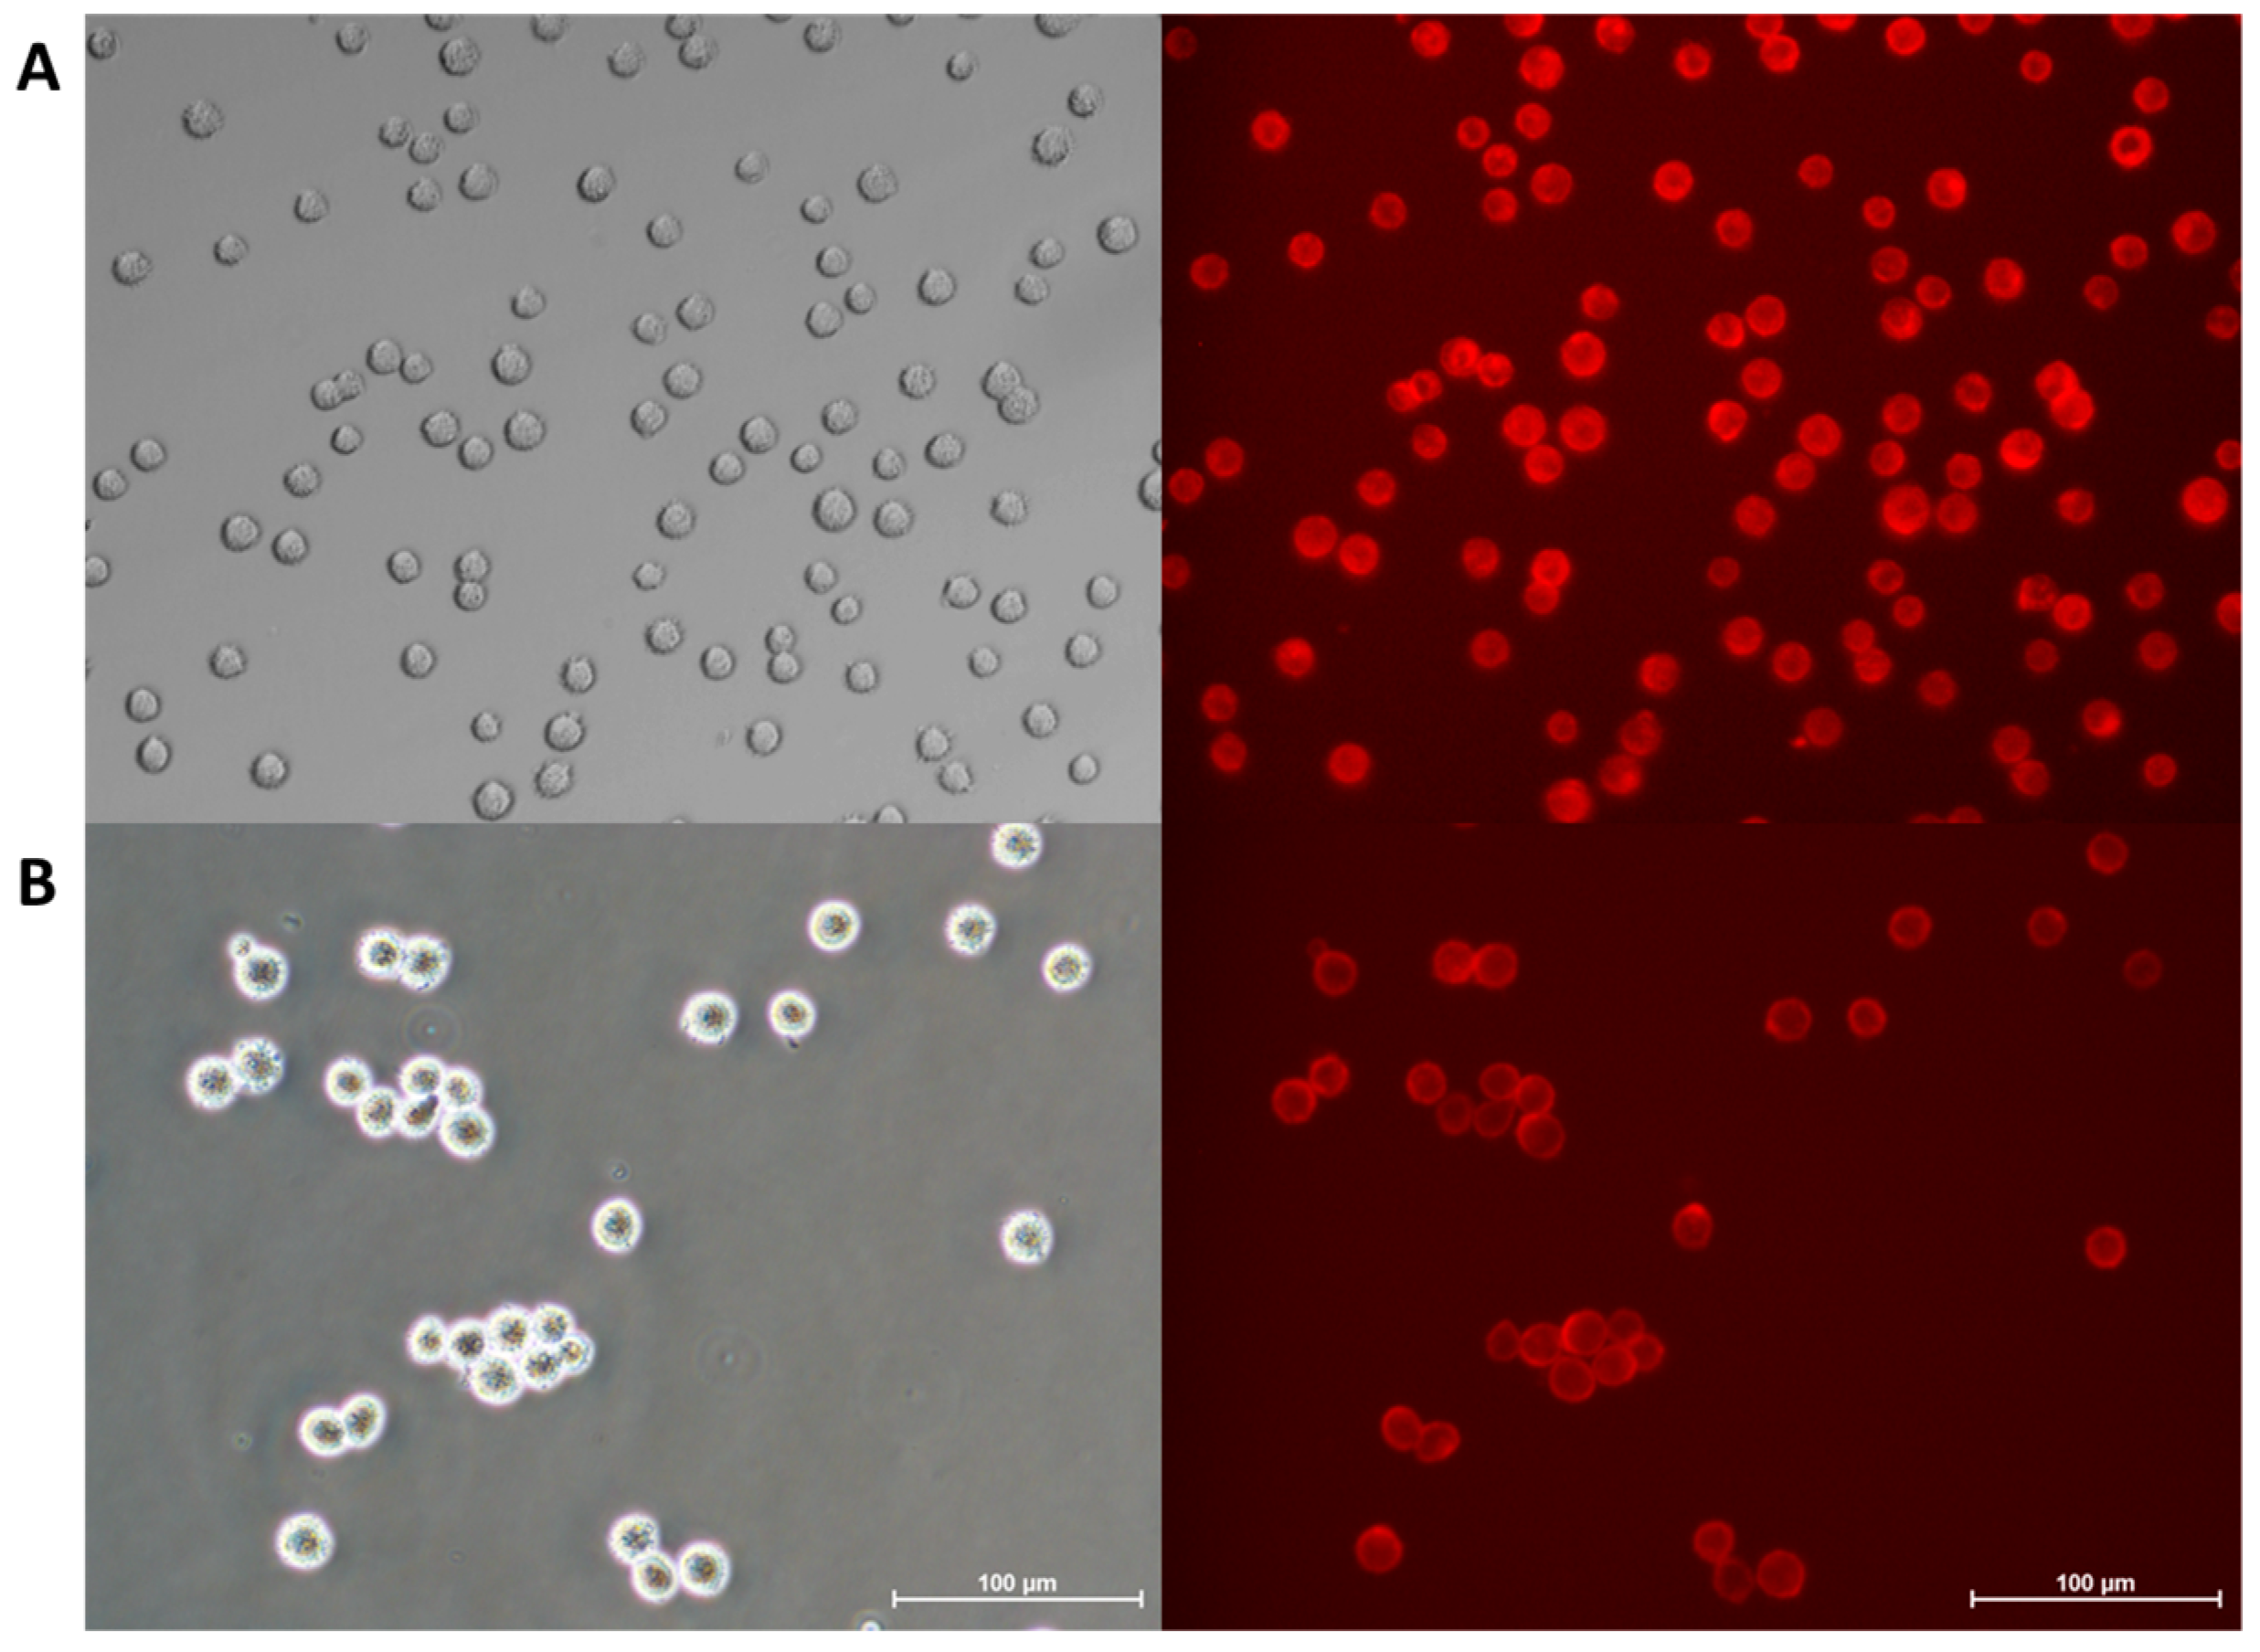
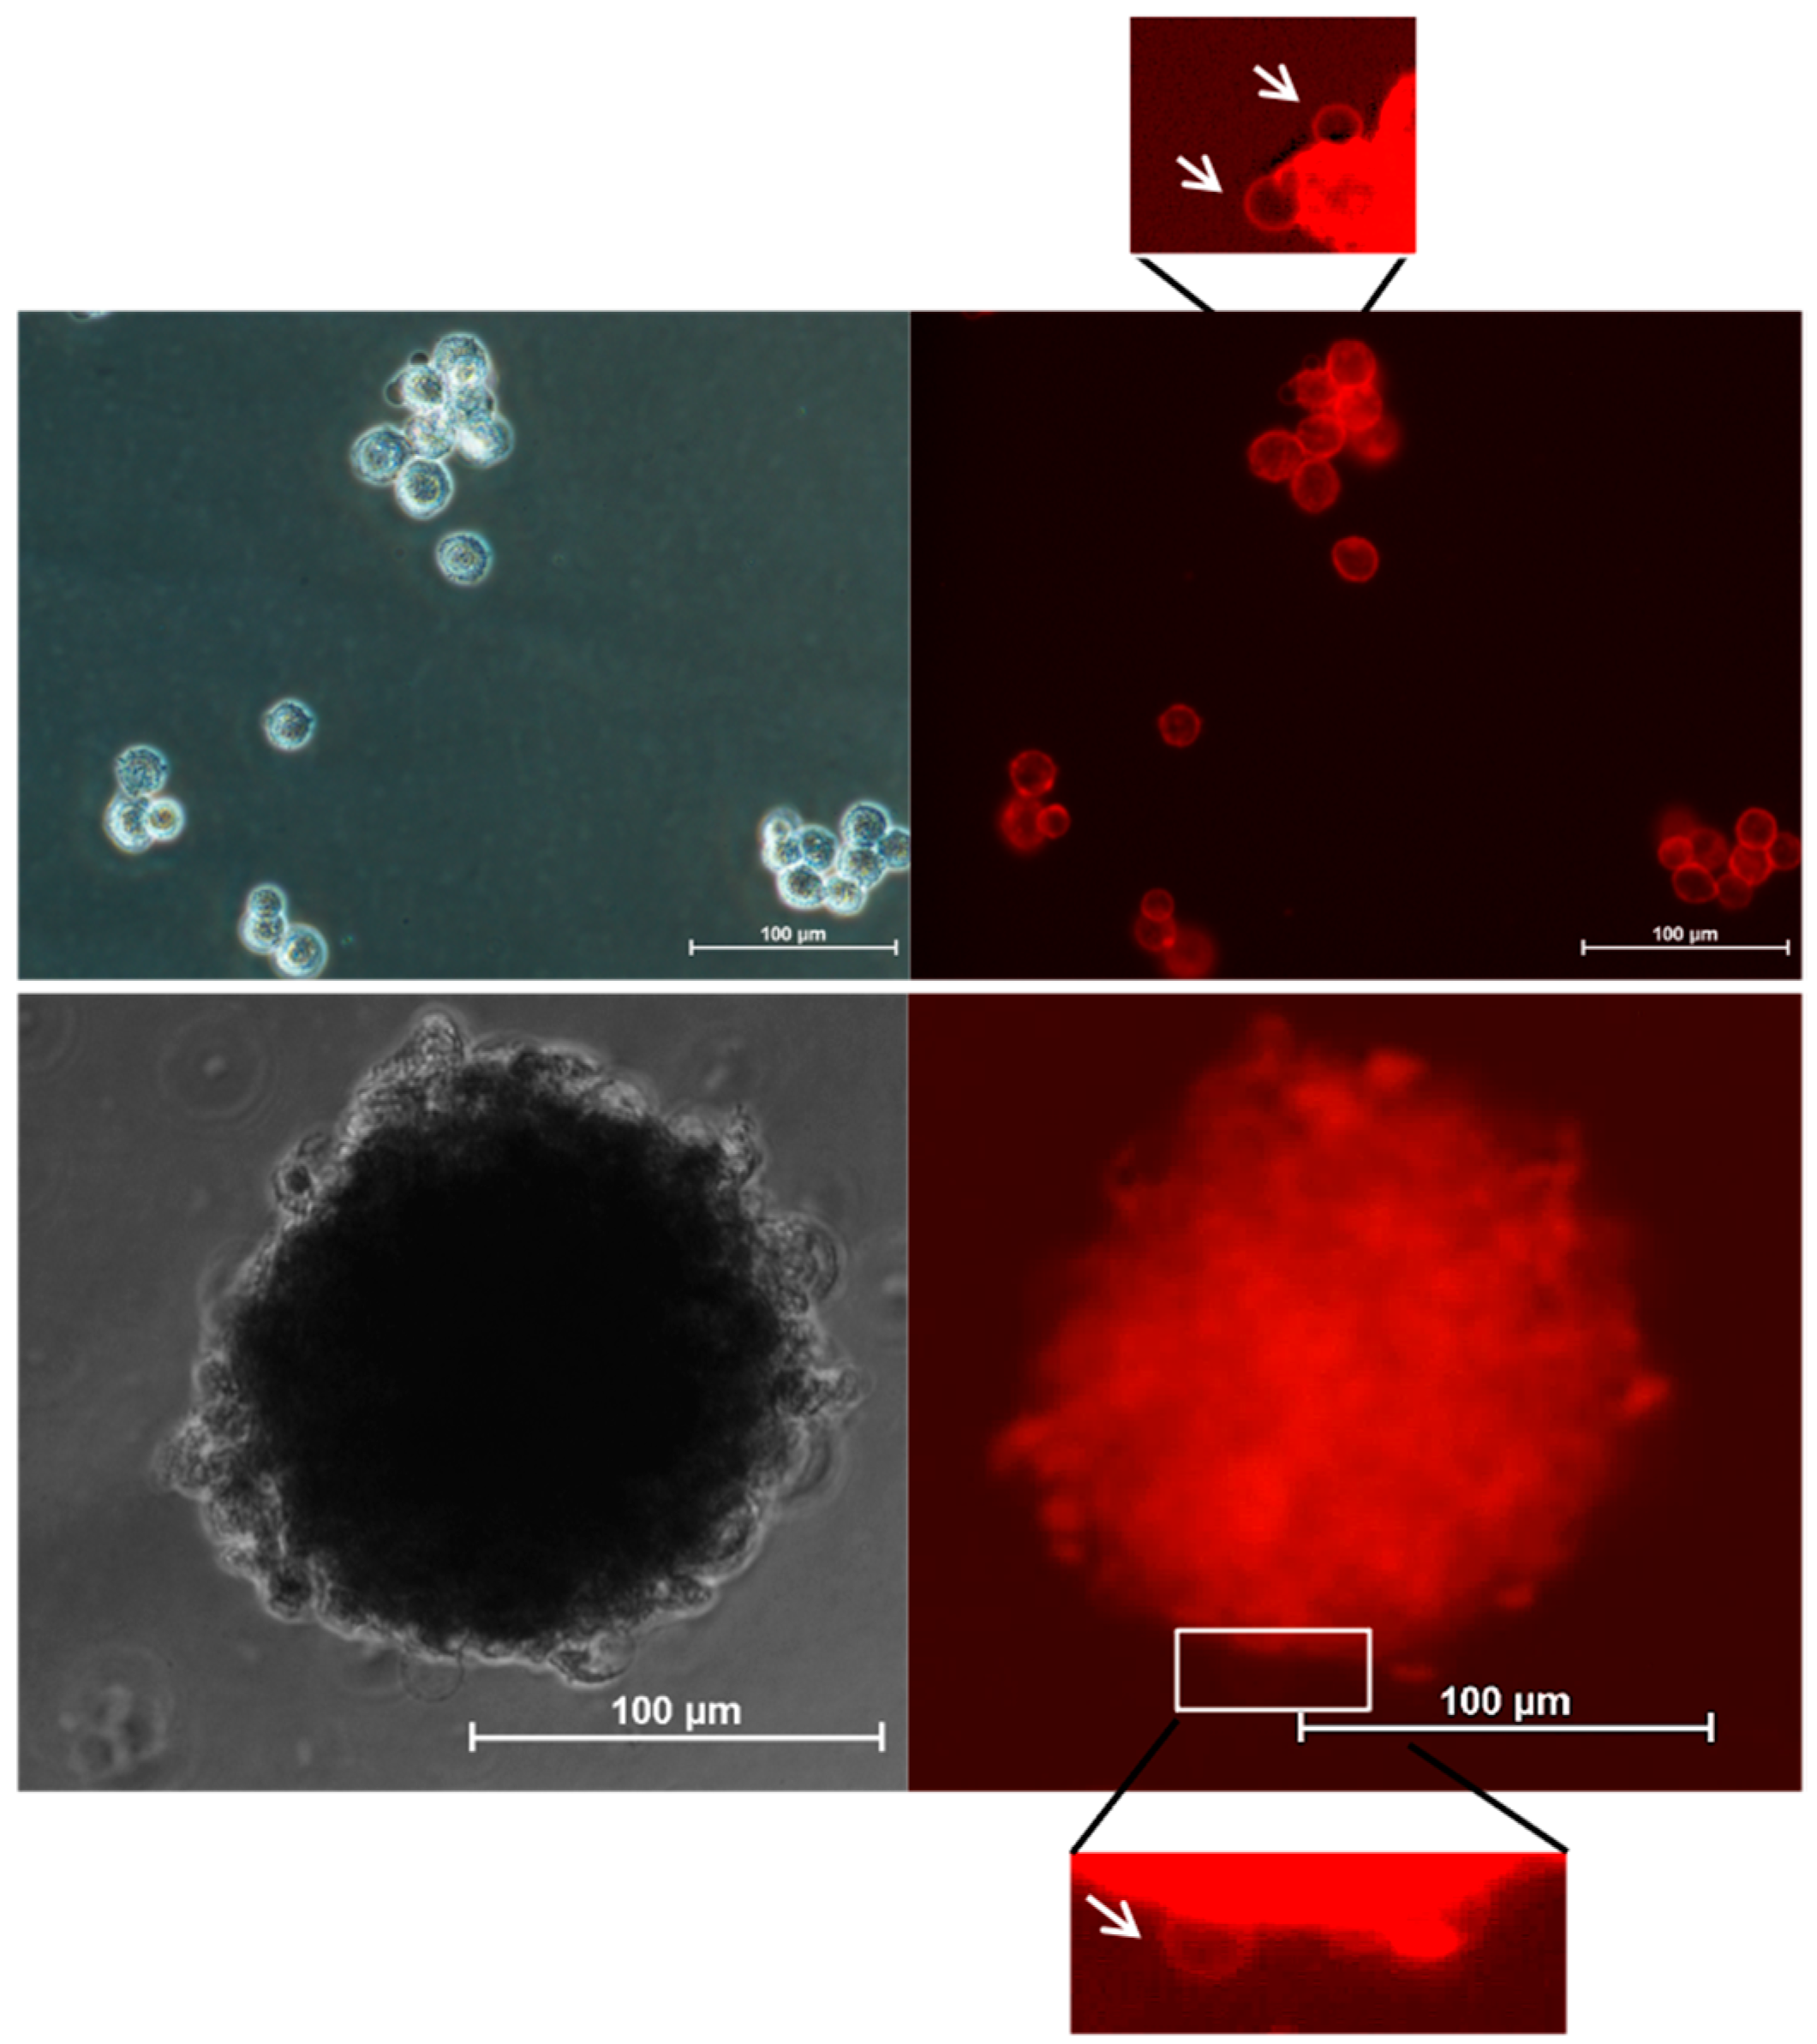
2.6. Cell Staining in 3D Cell Culture Conditions

After confirmation of the applicability of the tested DTTDO derivative for staining living cells in standard conditions, we evaluated the possibility of using this compound for dyeing cells cultured without attachment. The 3D model of cell culture is the most suitable method for in vitro studies of processes related to cancer metastasis and drug resistance. Numerous drugs which exhibited activity in traditional monolayer cell cultures (2D) were found to be inactive in further in vivo research [61,62]. Therefore, studies based on non-flat cell cultures involving spheroids, organoids, or other 3D cell culture models have become more popular recently [63,64,65,66]. Although three-dimensional cell cultures are the most suitable for studying new drugs and processes, which occur inside organisms, their applicability is still a challenge.
The proposed studies showed that, regardless of the differences in the specificity of membranes in the cells, which are placed in 2D and 3D conditions, DTTDO-NMe3+ was able to penetrate and efficiently stain membranes of both attached (Figure 6) and detached (Figure 10) cells. The lack of necessity to remove the dye from the culture medium prior to microscopic observation is a significant advantage of the tested compound, as this step is difficult to perform during real-time experiments in detached conditions. This result also indicates the potential utility of this dye for the visualization of membrane-dependent processes under detachment conditions.
One of the most important changes in membrane structure related to various cellular states is the formation of protrusions. Visualization of membrane blebbing may be an important tool for monitoring a wide range of processes such as apoptosis, anoikis resistance, motility, and metastasis. Similar to the green distyrylnaphthalene (DSNN) derivative [46], the tested DTTDO-NMe3+ was found to be useful for the visualization of membrane blebs (Figure 11), which proved its potential applicability for tracking this type of membrane alteration.
Obtained results indicate that DTTDO-NMe3+ may be used for staining cell membranes in a wide spectrum of different conditions, which makes it an effective dye for labeling membranous-dependent processes for both rapid cell visualization and long-term experiments. Moreover, this dye may be used not only for staining adherent cells in standard cell culture in monolayer but also for three-dimensional cell cultures. The ability to stain cell protrusions also makes it a good candidate to visualize any processes connected with these alterations, such as bleb-associated cell motility or blebs formation associated with anoikis, apoptotic blebbing, epithelial-mesenchymal transition-associated changes or related purposes.

3. Materials and Methods

3.1. Synthesis of DTTDO Derivatives

3.1.1. Experimental Remarks

All reactions were carried out under an argon atmosphere. Commercial-grade reagents and solvents were used without further purification, except for THF, which was dried by distillation over Na/benzophenone before use. NMR spectra were recorded on Bruker AV Neo 400 (Bruker, Billerica, MA, USA) spectrometer. Chemical shifts of 1H and 13C are reported relative to the residual proton resonance in the deuterated solvents. Chemical shifts (δ) are provided in ppm. HRMS measurements were performed on a Finnigan MAT 95 (Thermo Fisher Scientific, Waltham, MA, USA) or Waters Synapt HDMS (Waters Corporation, Milford, MA, USA) mass spectrometer. Melting points are uncorrected. 4-(N,N-bis(6-iodohexyl)amino)benzaldehyde [45], 4-(N,N-dimethylamino)benzaldehyde [67], 2,6-bis[(diethoxyphosphoryl)methyl]dithieno[3,2-b:2′,3′-d]thiophene-4,4-dioxide [48] and 4,4′-bis(4′-{N,N-bis[6”-(trimethylammonium)hexyl]amino}styryl)stilbene (DSSN-NMe3+) [68] were prepared according to procedures outlined in the literature. NMR spectra of DTTDO-NMe3+ and DTTDO derivative 2 are available in Supplementary Materials.

3.1.2. Synthetic Procedures

2,6-Bis(4-{N,N-bis[6-(trimethylammonium)hexyl]amino}styryl)dithieno[3,2-b:2′,3′-d]thiophene-4,4-dioxide (DTTDO-NMe3+): A solution of DTTDO-I (44 mg, 0.034 mmol) in THF (10 mL) was stirred with trimethylamine (1 mL, 33 wt.% solution in ethanol) for 24 h at room temperature. The solvents were evaporated, the residue was dissolved in methanol (10 mL), and another portion of trimethylamine (1 mL, 33 wt.% solution in ethanol) was added. The reaction mixture was stirred for another 24 h. After removal of the solvents under reduced pressure, the crude material was purified by precipitation with diethyl ether from methanol solution, producing DTTDO-NMe3+ (50 mg, 97%) as a dark purple solid. Mp 173–5 °C; 1H NMR (400 MHz, DMSO-d6) δ 7.47 (s, 2H, HCDTTDO), 7.39 (d, J = 8.4 Hz, 4H, HCPh), 7.15 (d, J = 16.1 Hz, 2H, CH=CH), 7.00 (d, J = 16.0 Hz, 2H, CH=CH), 6.66 (d, J = 8.6 Hz, 4H, HCPh), 3.28 (br s, 16H, CH2N and CH2N+), 3.06 (s, 36H, CH3N+), 1.84–1.20 (m, 32H, CH2); 13C NMR (101 MHz, DMSO-d6) δ 149.47 (2C, CDTTDO), 148.03 (2C, NCPh), 142.02 (2C, CDTTDO), 131.34 (2C, CDTTDO), 130.85 (2C, CH=CH), 128.38 (4C, HCPh), 122.58 (2C, CHCPh), 115.84 (2C, HCDTTDO), 115.33 (2C, CH=CH), 111.50 (4C, HCPh), 65.21 (4C, CH2N+), 52.17 (12C, CH3N+), 49.90 (4C, NCH2), 26.67 (4C, CH2), 25.91 (4C, CH2), 25.75 (4C, CH2), 22.09 (4C, CH2); HRMS (ES+) m/z: [M-I]+ calcd for C60H98I3N6O2S3 1411.4067; found 1411.4047; Anal. calcd. for C60H98I4N6O2S3 (1539.28): C, 46.82; H, 6.42; S, 6.25. Found: C, 46.92; H, 6.30; S, 5.99.
2,6-,Bis[4-(N,N-dimethyloamino)styryl]dithieno[3,2-b:2′,3′-d]thiophene-4,4-dioxide (2): Sodium t-butoxide (0.15 mL 2M solution in THF, 0.3 mmol) was added to a solution of bisphosphonate 1 (52 mg, 0.1 mmol) and 4-(N,N-dimethylamino)benzaldehyde (32 mg, 0.21 mmol) in THF (10 mL). The reaction mixture was stirred at room temperature for 4 h, neutralized with a 5% aqueous solution of HCl, and extracted with CHCl3 (4 × 10 mL). Combined organic layers were washed with water and dried over MgSO4. After solvent evaporation, the crude material was purified by column chromatography (petroleum ether/diethyl ether 3:1) to afford 2 (43 mg, 84%) as a dark red solid. Mp 217–9 °C; Rf = 0.32 (diethyl ether); 1H NMR (400 MHz, CDCl3) δ 7.36 (d, J = 8.3 Hz, 4H, HCPh), 7.02 (s, 2H, HCDTTDO), 6.93 (d, J = 16.2 Hz, 2H, CH=CH), 6.87 (d, J = 16.0 Hz, 2H, CH=CH), 6.70 (d, J = 8.3 Hz, 4H, HCPh), 3.01 (s, 12H, NCH3); 13C NMR (101 MHz, CDCl3) δ 150.78 (2C, NCPh), 149.23 (2C, CDTTDO), 142.54, 132.48 (2C, CDTTDO), 131.13 (2C, CH=CH), 128.15 (4C, HCPh), 124.05, 116.15 (2C, CH=CH and 2C, HCDTTDO), 112.40 (4C, HCPh), 40.46 (4C, NCH3); HRMS (ES+) m/z: [M+1]+ calcd for C28H27N2O2S3 519.1235; found 519.1235; Anal. calcd. for C28H26N2O2S3 (518.71): C, 64.84; H, 5.05; S, 18.54. Found: C, 64.94; H, 5.10; S, 18.42.

3.2. Computational Methods

Quantum-mechanical calculations were conducted using the Gaussian 09 D1 (Gaussian, Inc.: Wallingford, UK, 2009) software [69]. Geometry optimization and frequency calculation were performed with the D3 dispersion [70] corrected m062x [71] functional and Pople 6-311G(d,p) basis set [72], applying a charge density-based solvation model (SMD) [73] for dichloromethane (DCM). Vertical electronic excitation energies of the twelve lowest singlet excited states were obtained at the m062x/6-311+G(2d,p)//m062x-D3/6-311G(d,p) level of theory using the time-dependent DFT (TDDFT) method [74]. Ultrafine integration grid and tight convergence criteria for the self-consistent method were used during all calculations which were conducted without any symmetry restrictions. Atomic coordinates of DTTDO derivative 2 and partial output from TDDFT calculations are included in Supplementary Materials.

3.3. Optical Characterization

Electronic absorption and emission spectra were recorded on Shimadzu UV-VIS spectrophotometer UV 2700 and Horriba Scientific FluoroMax+ spectrofluorimeter, respectively. Spectrophotometric grade solvents were used in all measurements. The fluorescence quantum yield (Φ) of DTTDO-NMe3+ was determined using Rhodamine 101 in EtOH (Φ = 1) as a reference.

3.4. Cell Cultures

Squamous cell carcinoma cells (A431) and human osteosarcoma cells (MG-63) were purchased from the American Type Culture Collection (ATCC, Manassas, VA, USA), while the human keratinocytes (HaCaT) were purchased from the Leibniz Institute DSMZ-German Collection of Microorganisms and Cell Cultures (Braunschweig, Germany). The A431 and HaCaT cells were cultured in Dulbecco’s Modified Eagle’s Medium (DMEM) (Biological Industries, Haemek, Israel), and human osteosarcoma (MG-63) cells were cultured in Eagle’s Minimum Essential Medium (MEM) (Sigma-Aldrich, St. Louis, MO, USA). All cell cultures were supplemented with 10% fetal bovine serum (FBS) (Sigma-Aldrich, St. Louis, MO, USA), 100 U/mL penicillin and 100 μg/mL streptomycin (Invitrogen, New York, NY, USA). Cells were cultured under standard conditions (37 °C and an atmosphere of 5% CO2) and passaged twice a week. Cultures were tested for mycoplasma contamination using EZ-PCR Mycoplasma Test Kit (Biological Industries, Haemek, Israel). Prior to the experiments, cells were counted using ScepterTM 2.0 Cell Counter (Merck, Darmstadt, Germany).

3.5. Fluorescence Measurements

For time- and concentration-dependent intercellular fluorescence measurements, A431 cells were seeded into 96-well black plates (ThermoFisher Scientific, MA, USA) at a concentration of 10,000 cells per well and maintained under standard conditions (37 °C and 5% CO2) for 24 h in the cell culture incubator. Then, the tested compound was added to the cells at the following timepoints before the measurement: 30 min, 1 h, 2 h, 3 h, 5 h, and 7 h. The final concentrations of dye were: 0.1 μM, 1 μM, and 10 μM for each timepoint. Cells were incubated with tested dyes under standard cell culture conditions (37 °C and 5% CO2). After treatment, the medium containing DTTDO-NMe3+ was removed and cells were washed twice with PBS buffer to prevent an eventual background signal. Then, the fluorescence intensity was measured at an excitation and emission wavelength range of λex = 530/25 and λem = 645/40 nm using Synergy HT microplate reader (Bio-Tek, Winooski, VT, USA). The mean fluorescence of cells after treatment with the tested compound was calculated compared to the control cells (cells treated only with DMSO).

3.6. Cytotoxicity

The viability of cells after treatment with the tested compound was assessed using the MTT test. The test was performed based on the previously described procedure [75]. For each experiment, cells were counted, seeded into 96-well plates at a concentration of 10,000 cells/well, and left to adhere at 37 °C and 5% CO2. After 24 h, the culture medium was removed and fresh medium containing DTTDO-NMe3+ at final concentrations of 0.1, 1, and 10 µM was added. Simultaneously, negative control (cells treated only with DMSO and positive control (cells treated with SDS) were prepared. Each variant was repeated at least three times. Cells were then cultured for 24 h under standard conditions (37 °C and 5% CO2). After that time, the MTT reagent was added to the culture medium and cells were incubated for an additional 2 h. Then, culture medium was removed and 100 µL of isopropanol was added to each well. Plates were shaken for an hour at room temperature, and the absorbance at 570 nm and 630 nm was subsequently measured using a Synergy HT plate reader with KC4 3.2 Rev 2 software (Bio-Tek, Winooski, VT, USA). The cytotoxicity of DTTDO-NMe3+ was estimated as a percent of living cells compared to the negative control (DMSO-treated cells) taken as 100%.

3.7. Detection of Fluorescence inside the Living Cell

Fluorescence microscopy observations of living cells were performed on 24-, 48- and 96-well plates. The tested compound was used at the final concentration of 10 μM. Incubation was performed for 30 min, 1 h, or 24 h, respectively. At the appropriate timepoint, the intercellular fluorescence was immediately analyzed using Nikon Eclipse microscope with TxRed filter (λex = 540–580, λDM = 595, λBA = 600–660) without washing step. Images were captured using NisElement BR 4.30.00 software (Nikon, Tokyo, Japan).

3.8. Colocalization Studies

A431 cells for colocalization experiments were prepared in a similar manner to that described above. In the first stage, cells were seeded into 24-well plates at a density of 50,000 cells per well and incubated in standard conditions (37 °C, 5% CO2) for 24 h. After that time, medium was removed and a new medium containing only DTTDO-NMe3+ (control sample) or DTTDO-NMe3+ with DSSN-NMe3+ was added to the wells. After 24 h, cells were washed with PBS buffer (Biowest, Nuaillé, France) and fixed with a 3.8% paraformaldehyde solution for 10 min at room temperature. The cells were then washed three times with PBS and intercellular fluorescence was observed using Nikon Eclipse microscope with appropriate optical filters. The distyrylstilbene derivative DSSN-NMe3+, which specifically stains membranous cell compartments, was visualized using FITC filter (λex = 465–495, λDM = 505, λBA = 515–555), whereas DTTDO-NMe3+ was observed using TxRed filter (λex = 540–580, λDM = 595, λBA = 600–660). Data recording and image merging were performed using NisElement BR 4.30.00 software (Nikon, Tokyo, Japan).

3.9. Cell Staining in 3D Conditions

Three-dimensional cell cultures were conducted using Ultra-Low Attachment 96-well plates (Corning, NY, USA). Cells were washed with Dulbecco′s Phosphate Buffered Saline (DPBS) without Mg2+ and Ca2+ ions (Biowest, Nuaillé, France), detached using Trypsin-EDTA solution (Biowest, Nuaillé, France), washed, and resuspended in appropriate cell culture medium supplemented with 10% FBS (Sigma-Aldrich, St. Louis, MO, USA) and antibiotics (100 U/mL penicillin and 100 μg/mL streptomycin (Invitrogen, New York, NY, USA)). MEM (Sigma-Aldrich, St. Louis, MO, USA) or DMEM (Biological Industries, Haemek, Izrael) medium was used for MG-63 and HaCaT cells, respectively. For the preparation of spheroids, MG-63 cells were seeded into Ultra-Low Attachment 96-well plate at a concentration of 10,000 cells per well in MEM medium supplemented with 10% FBS and antibiotics. The cells were then cultured for 7 days under standard conditions (37 °C, 5% CO2) to form a spheroid. Then, 10 μM DTTDO-NMe3+ was added directly to the culture medium. After 30 min of incubation, cells were placed in the standard 96-well plates (Thermo Fisher Scientific, MA, USA) and microscopy observation was performed. Both staining and microscopy observation were conducted in full medium without a washing step. Images were captured using Nikon Eclipse microscope with TxRed filter (λex = 540–580, λDM = 595, λBA = 600–660). Data recording was performed using NisElement (Nikon, Tokyo, Japan) software.

4. Conclusions

In the current manuscript, the synthesis, optical properties, and biological activity of a new dithienothiophene S,S-dioxide derivative, named DTTDO-NMe3+, was presented. DTTDO-NMe3+ was designed to penetrate and stain the cellular lipid bilayer with minimal background fluorescence. Studies of the fluorescence properties of DTTDO-NMe3+ in different solvents confirmed its potential applicability for cell staining with different fluorescence coefficient inside the cell membranes and in the culture medium. The synthesized compound enabled efficient cell staining in whole cell medium containing serum and antibiotics under standard cell culture conditions (2D), as well as in three-dimensional cell cultures. Furthermore, due to the reduced background signal, cellular staining was possible without the need to change the medium, which allows for a variety of applications including real-time observation of membrane transformations. Colocalization studies confirmed intramembranous localization of this compound and its suitability for use in multicolor experiments with fluorescent markers which exhibit green or blue fluorescence.
Since the newly synthesized compound was planned to be used in living cells, its impact on cells’ viability was also determined. The obtained data confirmed that due to its low cytotoxicity, tested DTTDO derivative may be used for long-term incubation studies. Thus, DTTDO-NMe3+ was found to be an effective dye which may be used for both rapid and long-term membrane staining in traditional and three-dimensional cell culture conditions.

Supplementary Materials

The following supporting information can be downloaded at: https://www.mdpi.com/article/10.3390/ijms24119620/s1: atomic coordinates of DTTDO derivative 2 optimized at the m062x-D3/6-311G(d,p) level of theory in DCM; partial output from TDDFT calculations; NMR spectra of DTTDO-NMe3+ and DTTDO derivative 2.

Author Contributions

Conceptualization, R.P. and R.Ż.; methodology, A.R., J.K., R.P. and R.Ż.; validation, R.P. and R.Ż.; formal analysis, A.R., R.P. and R.Ż.; investigation, A.R., J.K., R.P. and R.Ż.; resources, A.R., J.K., R.P. and R.Ż.; data curation, A.R., J.K., R.P. and R.Ż.; writing—original draft preparation, R.P. and R.Ż.; writing—review and editing, A.R., J.K., R.P. and R.Ż.; visualization, A.R., R.P. and R.Ż.; supervision, R.P. and R.Ż.; project administration, A.R., R.P. and R.Ż.; funding acquisition, A.R., R.P. and R.Ż. All authors have read and agreed to the published version of the manuscript.

Funding

This project was financially supported by the state funds of The Centre of Molecular and Macromolecular Studies of the Polish Academy of Sciences and grant 2017/26/D/ST5/01046 from National Science Centre in Poland.

Institutional Review Board Statement

Not applicable.

Informed Consent Statement

Not applicable.

Data Availability Statement

Not applicable.

Conflicts of Interest

The authors declare no conflict of interest.

References

  1. Casares, D.; Escribá, P.V.; Rosselló, C.A. Membrane Lipid Composition: Effect on Membrane and Organelle Structure, Function and Compartmentalization and Therapeutic Avenues. Int. J. Mol. Sci. 2019, 20, 2167. [Google Scholar] [CrossRef] [PubMed]
  2. Cheng, X.; Smith, J.C. Biological Membrane Organization and Cellular Signaling. Chem. Rev. 2019, 119, 5849–5880. [Google Scholar] [CrossRef] [PubMed]
  3. Sezgin, E.; Levental, I.; Mayor, S.; Eggeling, C. The mystery of membrane organization: Composition, regulation and roles of lipid rafts. Nat. Rev. Mol. Cell Biol. 2017, 18, 361–374. [Google Scholar] [CrossRef] [PubMed]
  4. Bernardes, N.; Fialho, A.M. Perturbing the Dynamics and Organization of Cell Membrane Components: A New Paradigm for Cancer-Targeted Therapies. Int. J. Mol. Sci. 2018, 19, 3871. [Google Scholar] [CrossRef] [PubMed]
  5. Durán-Saenz, N.Z.; Serrano-Puente, A.; Gallegos-Flores, P.I.; Mendoza-Almanza, B.D.; Esparza-Ibarra, E.L.; Godina-González, S.; González-Curiel, I.E.; Ayala-Luján, J.L.; Hernández-Barrales, M.; Cueto-Villalobos, C.F.; et al. Platelet Membrane: An Outstanding Factor in Cancer Metastasis. Membranes 2022, 12, 182. [Google Scholar] [CrossRef]
  6. Campos-Contreras, A.D.R.; Díaz-Muñoz, M.; Vázquez-Cuevas, F.G. Purinergic Signaling in the Hallmarks of Cancer. Cells 2020, 9, 1612. [Google Scholar] [CrossRef]
  7. Vultaggio-Poma, V.; Falzoni, S.; Salvi, G.; Giuliani, A.L.; Di Virgilio, F. Signalling by extracellular nucleotides in health and disease. Biochim. Biophys. Acta Mol. Cell Res. 2022, 1869, 119237. [Google Scholar] [CrossRef]
  8. Suwara, J.; Radzikowska-Cieciura, E.; Chworos, A.; Pawlowska, R. The ATP-dependent Pathways and Human Diseases. Curr. Med. Chem. 2023, 30, 1232–1255. [Google Scholar] [CrossRef]
  9. Massagué, J. TGFβ signalling in context. Nat. Rev. Mol. Cell Biol. 2012, 13, 616–630. [Google Scholar] [CrossRef]
  10. Stec, W.J.; Rosiak, K.; Siejka, P.; Peciak, J.; Popeda, M.; Banaszczyk, M.; Pawlowska, R.; Treda, C.; Hulas-Bigoszewska, K.; Piaskowski, S.; et al. Cell line with endogenous EGFRvIII expression is a suitable model for research and drug development purposes. Oncotarget 2016, 7, 31907–31925. [Google Scholar] [CrossRef]
  11. Sigismund, S.; Avanzato, D.; Lanzetti, L. Emerging functions of the EGFR in cancer. Mol. Oncol. 2018, 12, 3–20. [Google Scholar] [CrossRef] [PubMed]
  12. Paoli, P.; Giannoni, E.; Chiarugi, P. Anoikis molecular pathways and its role in cancer progression. Biochim. Biophys. Acta 2013, 1833, 3481–3498. [Google Scholar] [CrossRef] [PubMed]
  13. Gadkar, S.; Nair, S.; Patil, S.; Kalamani, S.; Bandivdekar, A.; Patel, V.; Chaudhari, U.; Sachdeva, G. Membrane-initiated estrogen signaling in prostate cancer: A route to epithelial-to-mesenchymal transition. Mol. Carcinog. 2019, 58, 2077–2090. [Google Scholar] [CrossRef] [PubMed]
  14. Noutsi, P.; Gratton, E.; Chaieb, S. Assessment of Membrane Fluidity Fluctuations during Cellular Development Reveals Time and Cell Type Specificity. PLoS ONE 2016, 11, e0158313. [Google Scholar] [CrossRef] [PubMed]
  15. Cail, R.C.; Drubin, D.G. Membrane curvature as a signal to ensure robustness of diverse cellular processes. Trends Cell Biol. 2023, 33, 427–441. [Google Scholar] [CrossRef]
  16. Laster, S.M.; Mackenzie, J.M. Bleb Formation and F-Actin Distribution during Mitosis and Tumor Necrosis Factor-Induced Apoptosis. Microsc. Res. Tech. 1996, 34, 272–280. [Google Scholar] [CrossRef]
  17. Tournaviti, S.; Hannemann, S.; Terjung, S.; Kitzing, T.M.; Stegmayer, C.; Ritzerfeld, J.; Walther, P.; Grosse, R.; Nickel, W.; Fackler, O.T. SH4-domain-induced Plasma Membrane Dynamization Promotes Bleb-Associated Cell Motility. J. Cell Sci. 2007, 120, 3820–3829. [Google Scholar] [CrossRef]
  18. Charras, G.; Paluch, E. Blebs Lead the Way: How to Migrate without Lamellipodia. Nat. Rev. Mol. Cell Biol. 2008, 9, 730–736. [Google Scholar] [CrossRef]
  19. Bergert, M.; Chandradoss, S.D.; Desai, R.A.; Paluch, E. Cell Mechanics Control Rapid Transitions between Blebs and Lamellipodia during Migration. Proc. Natl. Acad. Sci. USA 2012, 109, 14434–14439. [Google Scholar] [CrossRef]
  20. Paluch, E.K.; Raz, E. The Role and Regulation of Blebs in Cell Migration. Curr. Opin. Cell Biol. 2013, 25, 582–590. [Google Scholar] [CrossRef]
  21. Schick, J.; Raz, E. Blebs-Formation, Regulation, Positioning, and Role in Amoeboid Cell Migration. Front. Cell Dev. Biol. 2022, 10, 926394. [Google Scholar] [CrossRef] [PubMed]
  22. Tyson, R.A.; Zatulovskiy, E.; Kay, R.R.; Bretschneider, T. How Blebs and Pseudopods Cooperate during Chemotaxis. Proc. Natl. Acad. Sci. USA 2014, 111, 11703–11708. [Google Scholar] [CrossRef] [PubMed]
  23. Laser-Azogui, A.; Diamant-Levi, T.; Israeli, S.; Roytman, Y.; Tsarfaty, I. Met-induced Membrane Blebbing Leads to Amoeboid Cell Motility and Invasion. Oncogene 2014, 33, 1788–1798. [Google Scholar] [CrossRef] [PubMed]
  24. Bridges, A.A.; Jentzsch, M.S.; Oakes, P.W.; Occhipinti, P.; Gladfelter, A.S. Micron-scale plasma membrane curvature is recognized by the septin cytoskeleton. J. Cell Biol. 2016, 213, 23–32. [Google Scholar] [CrossRef] [PubMed]
  25. Weems, A.D.; Welf, E.S.; Driscoll, M.K.; Zhou, F.Y.; Mazloom-Farsibaf, H.; Chang, B.J.; Murali, V.S.; Gihana, G.M.; Weiss, B.G.; Chi, J.; et al. Blebs promote cell survival by assembling oncogenic signalling hubs. Nature 2023, 615, 517–525. [Google Scholar] [CrossRef] [PubMed]
  26. Senft, D. Blebs signal survival. Nat. Rev. Cancer 2023, 23, 273. [Google Scholar] [CrossRef]
  27. Reichman-Fried, M.; Raz, E. Bleb protrusions help cancer cells to cheat death. Nature 2023, 615, 402–403. [Google Scholar] [CrossRef]
  28. Charras, G.T.; Coughlin, M.; Mitchison, T.J.; Mahadevan, L. Life and times of a cellular bleb. Biophys. J. 2008, 94, 1836–1853. [Google Scholar] [CrossRef]
  29. Mysior, M.M.; Simpson, J.C. Cell3: A new vision for study of the endomembrane system in mammalian cells. Biosci. Rep. 2021, 41, BSR20210850C. [Google Scholar] [CrossRef]
  30. Zhang, Y.; Yan, Y.; Xia, S.; Wan, S.; Steenwinkel, T.E.; Medford, J.; Durocher, E.; Luck, R.L.; Werner, T.; Liu, H. Cell Membrane- Specific Fluorescent Probe Featuring Dual and Aggregation-Induced Emissions. ACS Appl. Mater. Interfaces 2020, 12, 20172–20179. [Google Scholar] [CrossRef]
  31. Yang, L.; Chen, Q.; Wang, Z.; Zhang, H.; Sun, H. Small-molecule fluorescent probes for plasma membrane staining: Design, mechanisms and biological applications. Coord. Chem. Rev. 2023, 474, 214862. [Google Scholar] [CrossRef]
  32. Passos, S.T.A.; Souza, G.C.; Brandão, D.C.; Machado, D.F.S.; Grisolia, C.K.; Correa, J.R.; da Silva, W.A.; Neto, B.A.D. Plasma membrane staining with fluorescent hybrid benzothiadiazole and coumarin derivatives: Tuning the cellular selection by molecular design. Dye. Pigment. 2021, 186, 109005. [Google Scholar] [CrossRef]
  33. Carvalho, P.H.P.R.; Correa, J.R.; Paiva, K.L.R.; Machado, D.F.S.; Scholten, J.D.; Neto, B.A.D. Plasma membrane imaging with a fluorescent benzothiadiazole derivative. Beilstein J. Org. Chem. 2019, 15, 2644–2654. [Google Scholar] [CrossRef]
  34. Concilio, S.; Ferrentino, I.; Sessa, L.; Massa, A.; Iannelli, P.; Diana, R.; Panunzi, B.; Rella, A.; Piotto, S. A Novel Fluorescent Solvatochromic Probe for Lipid Bilayers. Supramol. Chem. 2017, 29, 887–895. [Google Scholar] [CrossRef]
  35. Collot, M.; Kreder, R.; Tatarets, A.L.; Patsenker, L.D.; Mély, Y.; Klymchenko, A.S. Bright fluorogenic squaraines with tuned cell entry for selective imaging of plasma membrane vs. endoplasmic reticulum. Chem. Commun. 2015, 51, 17136–17139. [Google Scholar] [CrossRef] [PubMed]
  36. Kwiatek, J.M.; Owen, D.M.; Abu-Siniyeh, A.; Yan, P.; Loew, L.M.; Gaus, K. Characterization of a New Series of Fluorescent Probes for Imaging Membrane Order. PLoS ONE 2013, 8, e52960. [Google Scholar] [CrossRef]
  37. Guo, L.; Zhang, R.; Sun, Y.; Tian, M.; Zhang, G.; Feng, R.; Li, X.; Yu, X.; He, X. Styrylpyridine Salts-Based Red Emissive Two-Photon Turn-on Probe for Imaging the Plasma Membrane in Living Cells and Tissues. Analyst 2016, 141, 3228–3232. [Google Scholar] [CrossRef]
  38. Tian, M.; Liu, Y.; Sun, Y.; Zhang, R.; Feng, R.; Zhang, G.; Guo, L.; Li, X.; Yu, X.; Sun, J.Z.; et al. A Single Fluorescent Probe Enables Clearly Discriminating and Simultaneously Imaging Liquid-Ordered and Liquid-Disordered Microdomains in Plasma Membrane of Living Cells. Biomaterials 2017, 120, 46–56. [Google Scholar] [CrossRef]
  39. Hu, L.; Xu, B.; Chen, H.; Wang, H. A water-soluble AIEgen for ultrafast and wash-free imaging of plasma membranes in Biosystems. Sens. Actuators B Chem. 2021, 340, 129950. [Google Scholar] [CrossRef]
  40. Wang, Y.-N.; Xu, B.; Qiu, L.-H.; Xu, Y.-J.; Sun, R.; Ge, J.-F. A series of novel cell membrane fluorescent probes based on oxazolopyridine unit. Dye. Pigment. 2021, 185, 108883. [Google Scholar] [CrossRef]
  41. Heek, T.; Nikolaus, J.; Schwarzer, R.; Fasting, C.; Welker, P.; Licha, K.; Herrmann, A.; Haag, R. An Amphiphilic Perylene Imido Diester for Selective Cellular Imaging. Bioconjug. Chem. 2013, 24, 153–158. [Google Scholar] [CrossRef]
  42. Shaya, J.; Collot, M.; Benailly, F.; Mahmoud, N.; Mély, Y.; Michel, B.Y.; Klymchenko, A.S.; Burger, A. Turn-On Fluorene Push-Pull Probes with High Brightness and Photostability for Visualizing Lipid Order in Biomembranes. ACS Chem. Biol. 2017, 12, 3022–3030. [Google Scholar] [CrossRef] [PubMed]
  43. Gwozdzinska, P.; Pawlowska, R.; Milczarek, J.; Garner, L.E.; Thomas, A.W.; Bazan, G.C.; Chworos, A. Phenylenevinylene conjugated oligoelectrolytes as fluorescent dyes for mammalian cell imaging. Chem. Commun. 2014, 50, 14859–14861. [Google Scholar] [CrossRef] [PubMed]
  44. Milczarek, J.; Pawlowska, R.; Zurawinski, R.; Lukasik, B.; Garner, L.E.; Chworos, A. Fluorescence and confocal imaging of mammalian cells using conjugated oligoelectrolytes with phenylenevinylene core. J. Photochem. Photobiol. B 2017, 170, 40–48. [Google Scholar] [CrossRef]
  45. Łukasik, B.; Milczarek, J.; Pawlowska, R.; Żurawiński, R.; Chworos, A. Facile synthesis of fluorescent distyrylnaphthalene derivatives for bioapplications. New J. Chem. 2017, 41, 6977–6980. [Google Scholar] [CrossRef]
  46. Suwara, J.; Lukasik, B.; Zurawinski, R.; Pawlowska, R.; Chworos, A. Highly Fluorescent Distyrylnaphthalene Derivatives as a Tool for Visualization of Cellular Membranes. Materials 2020, 13, 951. [Google Scholar] [CrossRef] [PubMed]
  47. Kreder, R.; Oncul, S.; Kucherak, O.A.; Pyrshev, K.A.; Real, E.; Mély, Y.; Klymchenko, A.S. Blue fluorogenic probes for cell plasma membranes fill the gap in multicolour imaging. RSC Adv. 2015, 5, 22899–22905. [Google Scholar] [CrossRef]
  48. Rzewnicka, A.; Krysiak, J.; Pawłowska, R.; Żurawiński, R. Red-Emitting Dithienothiophene S,S-Dioxide Dyes for Cellular Membrane Staining. Materials 2023, 16, 1806. [Google Scholar] [CrossRef]
  49. Osken, I.; Gundogan, A.S.; Tekin, E.; Eroglu, M.S.; Ozturk, T. Fluorene–Dithienothiophene-S,S-dioxide Copolymers. Fine-Tuning for OLED Applications. Macromolecules 2013, 46, 9202–9210. [Google Scholar] [CrossRef]
  50. Lin, C.C.; Afraj, S.N.; Velusamy, A.; Yu, P.C.; Cho, C.H.; Chen, J.; Li, Y.H.; Lee, G.H.; Tung, S.H.; Liu, C.L.; et al. A Solution Processable Dithioalkyl Dithienothiophene (DSDTT) Based Small Molecule and Its Blends for High Performance Organic Field Effect Transistors. ACS Nano 2021, 15, 727–738. [Google Scholar] [CrossRef]
  51. Ali, R.; Siddiqui, R. Dithieno [3,2-b:2’,3’-d]thiophene (DTT): An emerging heterocyclic building block for future organic electronic materials & functional supramolecular chemistry. RSC Adv. 2022, 12, 36073–36102. [Google Scholar] [CrossRef] [PubMed]
  52. Fell, V.H.K.; Cameron, J.; Kanibolotsky, A.L.; Hussien, E.J.; Skabara, P.J. Introducing a new 7-ring fused diindenone-dithieno[3,2-b:2’,3’-d]thiophene unit as a promising component for organic semiconductor materials. Beilstein J. Org. Chem. 2022, 18, 944–955. [Google Scholar] [CrossRef]
  53. Colom, A.; Derivery, E.; Soleimanpour, S.; Tomba, C.; Molin, M.D.; Sakai, N.; González-Gaitán, M.; Matile, S.; Roux, A. A fluorescent membrane tension probe. Nat. Chem. 2018, 10, 1118–1125. [Google Scholar] [CrossRef] [PubMed]
  54. Strakova, K.; Assies, L.; Goujon, A.; Piazzolla, F.; Humeniuk, H.V.; Matile, S. Dithienothiophenes at Work: Access to Mechanosensitive Fluorescent Probes, Chalcogen-Bonding Catalysis, and Beyond. Chem. Rev. 2019, 119, 10977–11005. [Google Scholar] [CrossRef] [PubMed]
  55. García-Calvo, J.; López-Andarias, J.; Maillard, J.; Mercier, V.; Roffay, C.; Roux, A.; Fürstenberg, A.; Sakai, N.; Matile, S. HydroFlipper membrane tension probes: Imaging membrane hydration and mechanical compression simultaneously in living cells. Chem. Sci. 2022, 13, 2086–2093. [Google Scholar] [CrossRef] [PubMed]
  56. Chen, X.X.; Bayard, F.; Gonzalez-Sanchis, N.; Pamungkas, K.K.P.; Sakai, N.; Matile, S. Fluorescent Flippers: Small-Molecule Probes to Image Membrane Tension in Living Systems. Angew. Chem. 2023, 135, e202217868. [Google Scholar] [CrossRef]
  57. Dal Molin, M.; Verolet, Q.; Colom, A.; Letrun, R.; Derivery, E.; Gonzalez-Gaitan, M.; Vauthey, E.; Roux, A.; Sakai, N.; Matile, S. Fluorescent flippers for mechanosensitive membrane probes. J. Am. Chem. Soc. 2015, 137, 568–571. [Google Scholar] [CrossRef]
  58. Verolet, Q.; Soleimanpour, S.; Fujisawa, K.; Dal Molin, M.; Sakai, N.; Matile, S. Design and Synthesis of Mixed Oligomers with Thiophenes, Dithienothiophene S,S-Dioxides, Thieno[3,4]pyrazines and 2,1,3-Benzothiadiazoles: Flipper Screening for Mechanosensitive Systems. ChemistryOpen 2015, 4, 264–267. [Google Scholar] [CrossRef]
  59. Palamà, I.; Di Maria, F.; Viola, I.; Fabiano, E.; Gigli, G.; Bettini, C.; Barbarella, G. Live-cell-permeant thiophene fluorophores and cell-mediated formation of fluorescent fibrils. J. Am. Chem. Soc. 2011, 133, 17777–17785. [Google Scholar] [CrossRef]
  60. Vallan, L.; Istif, E.; Gómez, I.J.; Alegret, N.; Mantione, D. Thiophene-Based Trimers and Their Bioapplications: An Overview. Polymers 2021, 13, 1977. [Google Scholar] [CrossRef]
  61. Xu, X.; Farach-Carson, M.C.; Jia, X. Three-dimensional in vitro tumor models for cancer research and drug evaluation. Biotechnol. Adv. 2014, 32, 1256–1268. [Google Scholar] [CrossRef] [PubMed]
  62. Riedl, A.; Schlederer, M.; Pudelko, K.; Stadler, M.; Walter, S.; Unterleuthner, D.; Unger, C.; Kramer, N.; Hengstschläger, M.; Kenner, L.; et al. Comparison of cancer cells in 2D vs 3D culture reveals differences in AKT-mTOR-S6K signaling and drug responses. J. Cell Sci. 2017, 130, 203–218. [Google Scholar] [CrossRef] [PubMed]
  63. Martin, M.; Gähwiler, E.K.N.; Generali, M.; Hoerstrup, S.P.; Emmert, M.Y. Advances in 3D Organoid Models for Stem Cell-Based Cardiac Regeneration. Int. J. Mol. Sci. 2023, 24, 5188. [Google Scholar] [CrossRef]
  64. Boucherit, N.; Gorvel, L.; Olive, D. 3D Tumor Models and Their Use for the Testing of Immunotherapies. Front. Immunol. 2020, 11, 603640. [Google Scholar] [CrossRef] [PubMed]
  65. Booij, T.H.; Price, L.S.; Danen, E.H.J. 3D Cell-Based Assays for Drug Screens: Challenges in Imaging, Image Analysis, and High-Content Analysis. SLAS Discov. 2019, 24, 615–627. [Google Scholar] [CrossRef] [PubMed]
  66. Mu, P.; Zhou, S.; Lv, T.; Xia, F.; Shen, L.; Wan, J.; Wang, Y.; Zhang, H.; Cai, S.; Peng, J.; et al. Newly developed 3D in vitro models to study tumor-immune interaction. J. Exp. Clin. Cancer Res. 2023, 42, 81. [Google Scholar] [CrossRef] [PubMed]
  67. Kimura, Y.; Matsuura, D.; Hanawa, T.; Kobayashi, Y. New preparation method for Vilsmeier reagent and related imidoyl chlorides. Tetrahedron Lett. 2012, 53, 1116–1118. [Google Scholar] [CrossRef]
  68. Garner, L.E.; Park, J.; Dyar, S.M.; Chworos, A.; Sumner, J.J.; Bazan, G.C. Modification of the Optoelectronic Properties of Membranes via Insertion of Amphiphilic Phenylenevinylene Oligoelectrolytes. J. Am. Chem. Soc. 2010, 132, 10042–10052. [Google Scholar] [CrossRef]
  69. Frisch, M.J.; Trucks, G.W.; Schlegel, H.B.; Scuseria, G.E.; Robb, M.A.; Cheeseman, J.R.; Scalmani, G.; Barone, V.; Mennucci, B.; Petersson, G.A.; et al. Gaussian 09, Revision D.01; Gaussian, Inc.: Wallingford, UK, 2009. [Google Scholar]
  70. Grimme, S.; Antony, J.; Ehrlich, S.; Krieg, H. A consistnt and accurate ab initio parameterization of density functional dispersion correction (DFT-D) for the 94 elements H-Pu. J. Chem. Phys. 2010, 132, 154104. [Google Scholar] [CrossRef]
  71. Zhao, Y.; Truhlar, D.G. The M06 suite of density functionals for main group thermochemistry, thermochemical kinetics, noncovalent interactions, excited states, and transition elements: Two new functionals and systematic testing of four M06-class functionals and 12 other functionals. Theor. Chem. Acc. 2008, 120, 215–241. [Google Scholar] [CrossRef]
  72. Krishnan, R.; Binkley, J.S.; Seeger, R.; Pople, J.A. Selfconsistent molecular orbital methods. XX. A basis set for correlated wave functions. J. Chem. Phys. 1980, 72, 650–654. [Google Scholar] [CrossRef]
  73. Marenich, A.V.; Cramer, C.J.; Truhlar, D.G. Universal solvation model based on solute electron density and a continuum model of the solvent defined by the bulk dielectric constant and atomic surface tensions. J. Phys. Chem. B 2009, 113, 6378–6396. [Google Scholar] [CrossRef] [PubMed]
  74. Stratmann, R.E.; Scuseria, G.E.; Frisch, M.J. An efficient implementation of time-dependent density-functional theory for the calculation of excitation energies of large molecules. J. Chem. Phys. 1998, 109, 8218–8224. [Google Scholar] [CrossRef]
  75. Łukasik, B.; Mikina, M.; Mikołajczyk, M.; Pawłowska, R.; Żurawiński, R. A novel route to a chiral building block for the preparation of cyclopentenyl carbocyclic nucleosides. Synthesis and anticancer activity of enantiomeric neplanocins A. RSC Adv. 2020, 10, 31838–31847. [Google Scholar] [CrossRef] [PubMed]
Scheme 1. Synthetic pathway to DTTDO-NMe3+ and DTTDO derivative 2.
Ijms 24 09620 sch001
Figure 1. Normalized fluorescence (dotted line) and absorption (solid line) spectra of DTTDO-NMe3+ in different solvents.
Ijms 24 09620 g001
Figure 2. Correlation between maximum emission wavelength of DTTDO-NMe3+ and solvent dielectric constant.
Ijms 24 09620 g002
Figure 3. Normalized simulated absorption spectrum (green), and experimental absorption (purple) and emission (red) spectra of compound 2 in DCM.
Ijms 24 09620 g003
Figure 4. Contours (isovalue = 0.023) and energies of selected molecular orbitals of DTTDO-NMe3+ obtained at the TDDFT m062x/6-311+G(2d,p)//m062x-D3/6-311G(d,p) level of theory in dichloromethane (SMD solvation model).
Ijms 24 09620 g004
Figure 5. The intracellular fluorescence intensity measured at emission wavelength λem = 645/40 nm (λex = 530/25 nm) in A431 cells incubated with DTTDO-NMe3+ derivative for 30 min, 1 h, 2 h, 3 h, 5 h and 7 h, respectively. Concentration range: 0.1–10 µM. The bars represent the mean fluorescence value calculated with reference to the control sample (cells untreated with DTTDO-NMe3+).
Ijms 24 09620 g005
Figure 6. Fluorescent microscopy observation of living human A431 after 30 min incubation with 10 μM DTTDO-NMe3+ in a complete medium containing FBS and antibiotics. Imaging was performed without washing the cells. Left panel, phase contrast; right panel, fluorescent images with TxRed filter (λex = 540–580, λDM = 595, λBA = 600–660). Magnification, 20×; scale bars, 30 μm.
Ijms 24 09620 g006
Figure 7. Cytotoxicity of DTTDO-NMe3+ after 24 h treatment of A431 and HaCaT cells assessed by MTT assay. The values obtained for cells treated only with DMSO (without the addition of DTTDO-NMe3+) were taken as 100% viability.
Ijms 24 09620 g007
Figure 8. Microscopy observation of A431 cells treated with DTTDO-NMe3+ derivatives and membranous dye—DSSN-NMe3+—at concentration of 10 μM after 24 h incubation. The DTTDO derivative was visualized with TxRed filter (λex = 540–580, λDM = 595, λBA = 600–660), whereas DSSN-NMe3+ was visualized with FITC filter (λex = 465–495, λDM = 505, λBA = 515–555). (A) The assessment of the usefulness of both dyes for colocalization studies, (B) colocalization experiment. The scale bars represent 30 μm.
Ijms 24 09620 g008
Figure 9. Colocalization studies of DTTDO-NMe3+ and DAPI in A431 cells. DTTDO-NMe3+ concentration, 10 μM; incubation time, 24 h. The DTTDO derivative was observed using TxRed filter (λex = 540–580, λDM = 595, λBA = 600–660), whereas DAPI was observed using DAPI filter (λex = 340–380, λDM = 400, λBA = 435–485). Scale bars, 100 μm.
Ijms 24 09620 g009
Figure 10. Visualization of cellular membranes in living (A) A431 and (B) MG63 cells in detached conditions. Images were captured after 30 min incubation of cells with 10 μM DTTDO-NMe3+ derivative using TxRed filter (λex = 540–580, λDM = 595, λBA = 600–660). Incubation was performed in full medium without a washing step. Scale bars, 100 μm.
Ijms 24 09620 g010
Figure 11. Visualization of membrane blebs (white arrows) in MG63 cells cultured in 3D conditions. Images were captured after 30 min incubation of cells with 10 μM DTTDO-NMe3+ using TxRed filter (λex = 540–580, λDM = 595, λBA = 600–660). Incubation was performed in full medium without a washing step. Scale bars, 100 μm.
Ijms 24 09620 g011
Table 1. Maximum absorption (λabs), emission (λem), and Stokes shift (∆λ) of DTTDO-NMe3+ in different solvents. λabs, λem, ∆λ values are provided in nm.
Solventλabsλem∆λ
Water519--
DCM518650132
ACN519662143
MeOH516661145
DMSO534673139
EtOH517654137
Table 2. Electronic excitation energies, oscillator strength, dipole moments, and type of major transitions for the three lowest excited states of model compound 2 obtained at the TDDFT m062x/6-311+G(2d,p)//m062x-D3/6-311G(d,p) level of theory in dichloromethane dielectric medium. a Eex—excitation energy; b λex—excitation wavelength; c μ—electric dipole moment.
Excited StateEex [eV] aOscilator
Strenght
λex [nm] bμ [D] cMajor
Transitions (%)
S12.47661.6745500.612.58HOMO–>LUMO (88)
S23.20380.2357387.014.78HOMO-1–>LUMO (81)
HOMO–>LUMO+1 (13)
S33.80450.7521325.913.69HOMO–>LUMO+2 (41)
HOMO-2–>LUMO (30)
HOMO-1–>LUMO+1 (20)
Disclaimer/Publisher’s Note: The statements, opinions and data contained in all publications are solely those of the individual author(s) and contributor(s) and not of MDPI and/or the editor(s). MDPI and/or the editor(s) disclaim responsibility for any injury to people or property resulting from any ideas, methods, instructions or products referred to in the content.

