Article

Sequencing and Analysis of Complete Chloroplast Genomes Provide Insight into the Evolution and Phylogeny of Chinese Kale (Brassica oleracea var. alboglabra)

1
College of Horticulture, Sichuan Agricultural University, Chengdu 611130, China
2
Department of Horticulture, Zhejiang University, Hangzhou 310058, China
*
Authors to whom correspondence should be addressed.
These authors contributed equally to this work.
Int. J. Mol. Sci. 2023, 24(12), 10287; https://doi.org/10.3390/ijms241210287
Submission received: 31 May 2023 / Revised: 15 June 2023 / Accepted: 16 June 2023 / Published: 17 June 2023

Abstract

:
Chinese kale is a widely cultivated plant in the genus Brassica in the family Brassicaceae. The origin of Brassica has been studied extensively, but the origin of Chinese kale remains unclear. In contrast to Brassica oleracea, which originated in the Mediterranean region, Chinese kale originated in southern China. The chloroplast genome is often used for phylogenetic analysis because of its high conservatism. Fifteen pairs of universal primers were used to amplify the chloroplast genomes of white-flower Chinese kale (Brassica oleracea var. alboglabra cv. Sijicutiao (SJCT)) and yellow-flower Chinese kale (Brassica oleracea var. alboglabra cv. Fuzhouhuanghua (FZHH)) via PCR. The lengths of the chloroplast genomes were 153,365 bp (SJCT) and 153,420 bp (FZHH) and both contained 87 protein-coding genes and eight rRNA genes. There were 36 tRNA genes in SJCT and 35 tRNA genes in FZHH. The chloroplast genomes of both Chinese kale varieties, along with eight other Brassicaceae, were analyzed. Simple sequence repeats, long repeats, and variable regions of DNA barcodes were identified. An analysis of inverted repeat boundaries, relative synonymous codon usage, and synteny revealed high similarity among the ten species, albeit the slight differences that were observed. The Ka/Ks ratios and phylogenetic analysis suggest that Chinese kale is a variant of B. oleracea. The phylogenetic tree shows that both Chinese kale varieties and B. oleracea var. oleracea were clustered in a single group. The results of this study suggest that white and yellow flower Chinese kale comprise a monophyletic group and that their differences in flower color arose late in the process of artificial cultivation. Our results also provide data that will aid future research on genetics, evolution, and germplasm resources of Brassicaceae.

1. Introduction

Chloroplasts are intracellular organelles in plants that contain all the elements required for photosynthesis, as well as the biosynthesis of amino acids, nucleotides, lipids, and starch [1]. The chloroplast genome is one of the three major genetic systems of plants; it exists in a single copy and is maternally inherited. Recombination of the chloroplast genome is rare; the chloroplast genome is also not affected by gene deletion, overlap, or pseudogenes. Therefore, chloroplast genomes have been used as DNA barcodes for the identification of plants and in phylogenetic analyses [2]. The chloroplast genome in most terrestrial plants and some algae has a highly conserved tetrad structure. It comprises one large single-copy (LSC) region of approximately 81–90 kb, one small single-copy (SSC) region of approximately 18–20 kb, and two inverted repeat (IR) sequences of approximately 20–30 kb [3]. The chloroplast genome is usually 120–160 kb and contains 100–131 genes [4,5]; genes in the chloroplast genome play roles in photosynthesis, transcription, translation, and biosynthesis [6]. The abundance of chloroplast genes with different functions varies among plants, and this is associated with the adaptation of plants to environmental changes. Owing to the small size of the chloroplast genome, as well as its conserved structure and gene content, chloroplast genomes have often been used in genetic and evolutionary studies of plants [7].
Chinese kale (Brassica. oleracea var. alboglabra) is an annual or biennial herb native to south China. B. oleracea usually has yellow flowers. Bailey was the first to investigate the taxonomy of Chinese kale, and he designated white-flower Chinese kale as a species named B. alboglabra [8]. Sinskaia found that Chinese kale can easily hybridize with heading B. oleracea, and he believed that Chinese kale is a variant of B. oleracea [9]. The chromosome structure and pollen morphology of Chinese kale and B. oleracea var. oleracea are similar [10], which suggests that Chinese kale is a variant of B. oleracea [11,12,13].
B. oleracea is thought to have originated from the Mediterranean coast [14]; it is one of the six cultivated Brassica species in the Triangle of U [15]. There are several variants of B. oleracea, such as B. oleracea var. capitata, B. oleracea var. botrytis, B. oleracea var. italica, B. oleracea var. gemmifera, B. oleracea var. acephala, B. oleracea var. caularapa, and B. oleracea var. sabauda; Chinese kale (B. oleracea var. alboglabra) is also among these, and the relationship between them is complex due to their low reproductive isolation. Sinapis alba, also known as B. hirta, is a white-flowered or yellow-flowered annual plant in the family Brassicaceae [16].
Chinese kale with white flowers is the main cultivated species and it has a wide distribution. Chinese kale can also have yellow flowers, and this variant has been cultivated in China, mainly in Fujian and Taiwan. Therefore, we obtained the complete chloroplast genomes of Chinese kale and explored its taxonomic status.
In this study, the chloroplast genomes of Chinese kale with white and yellow flowers were sequenced using the Illumina HiSeq platform, and then assembled, annotated, and analyzed. We described the basic characteristics of these two chloroplast genomes, obtained candidate chloroplast molecular markers for identification, and examined the phylogenetic relationships among Chinese kale and their related species.

2. Results

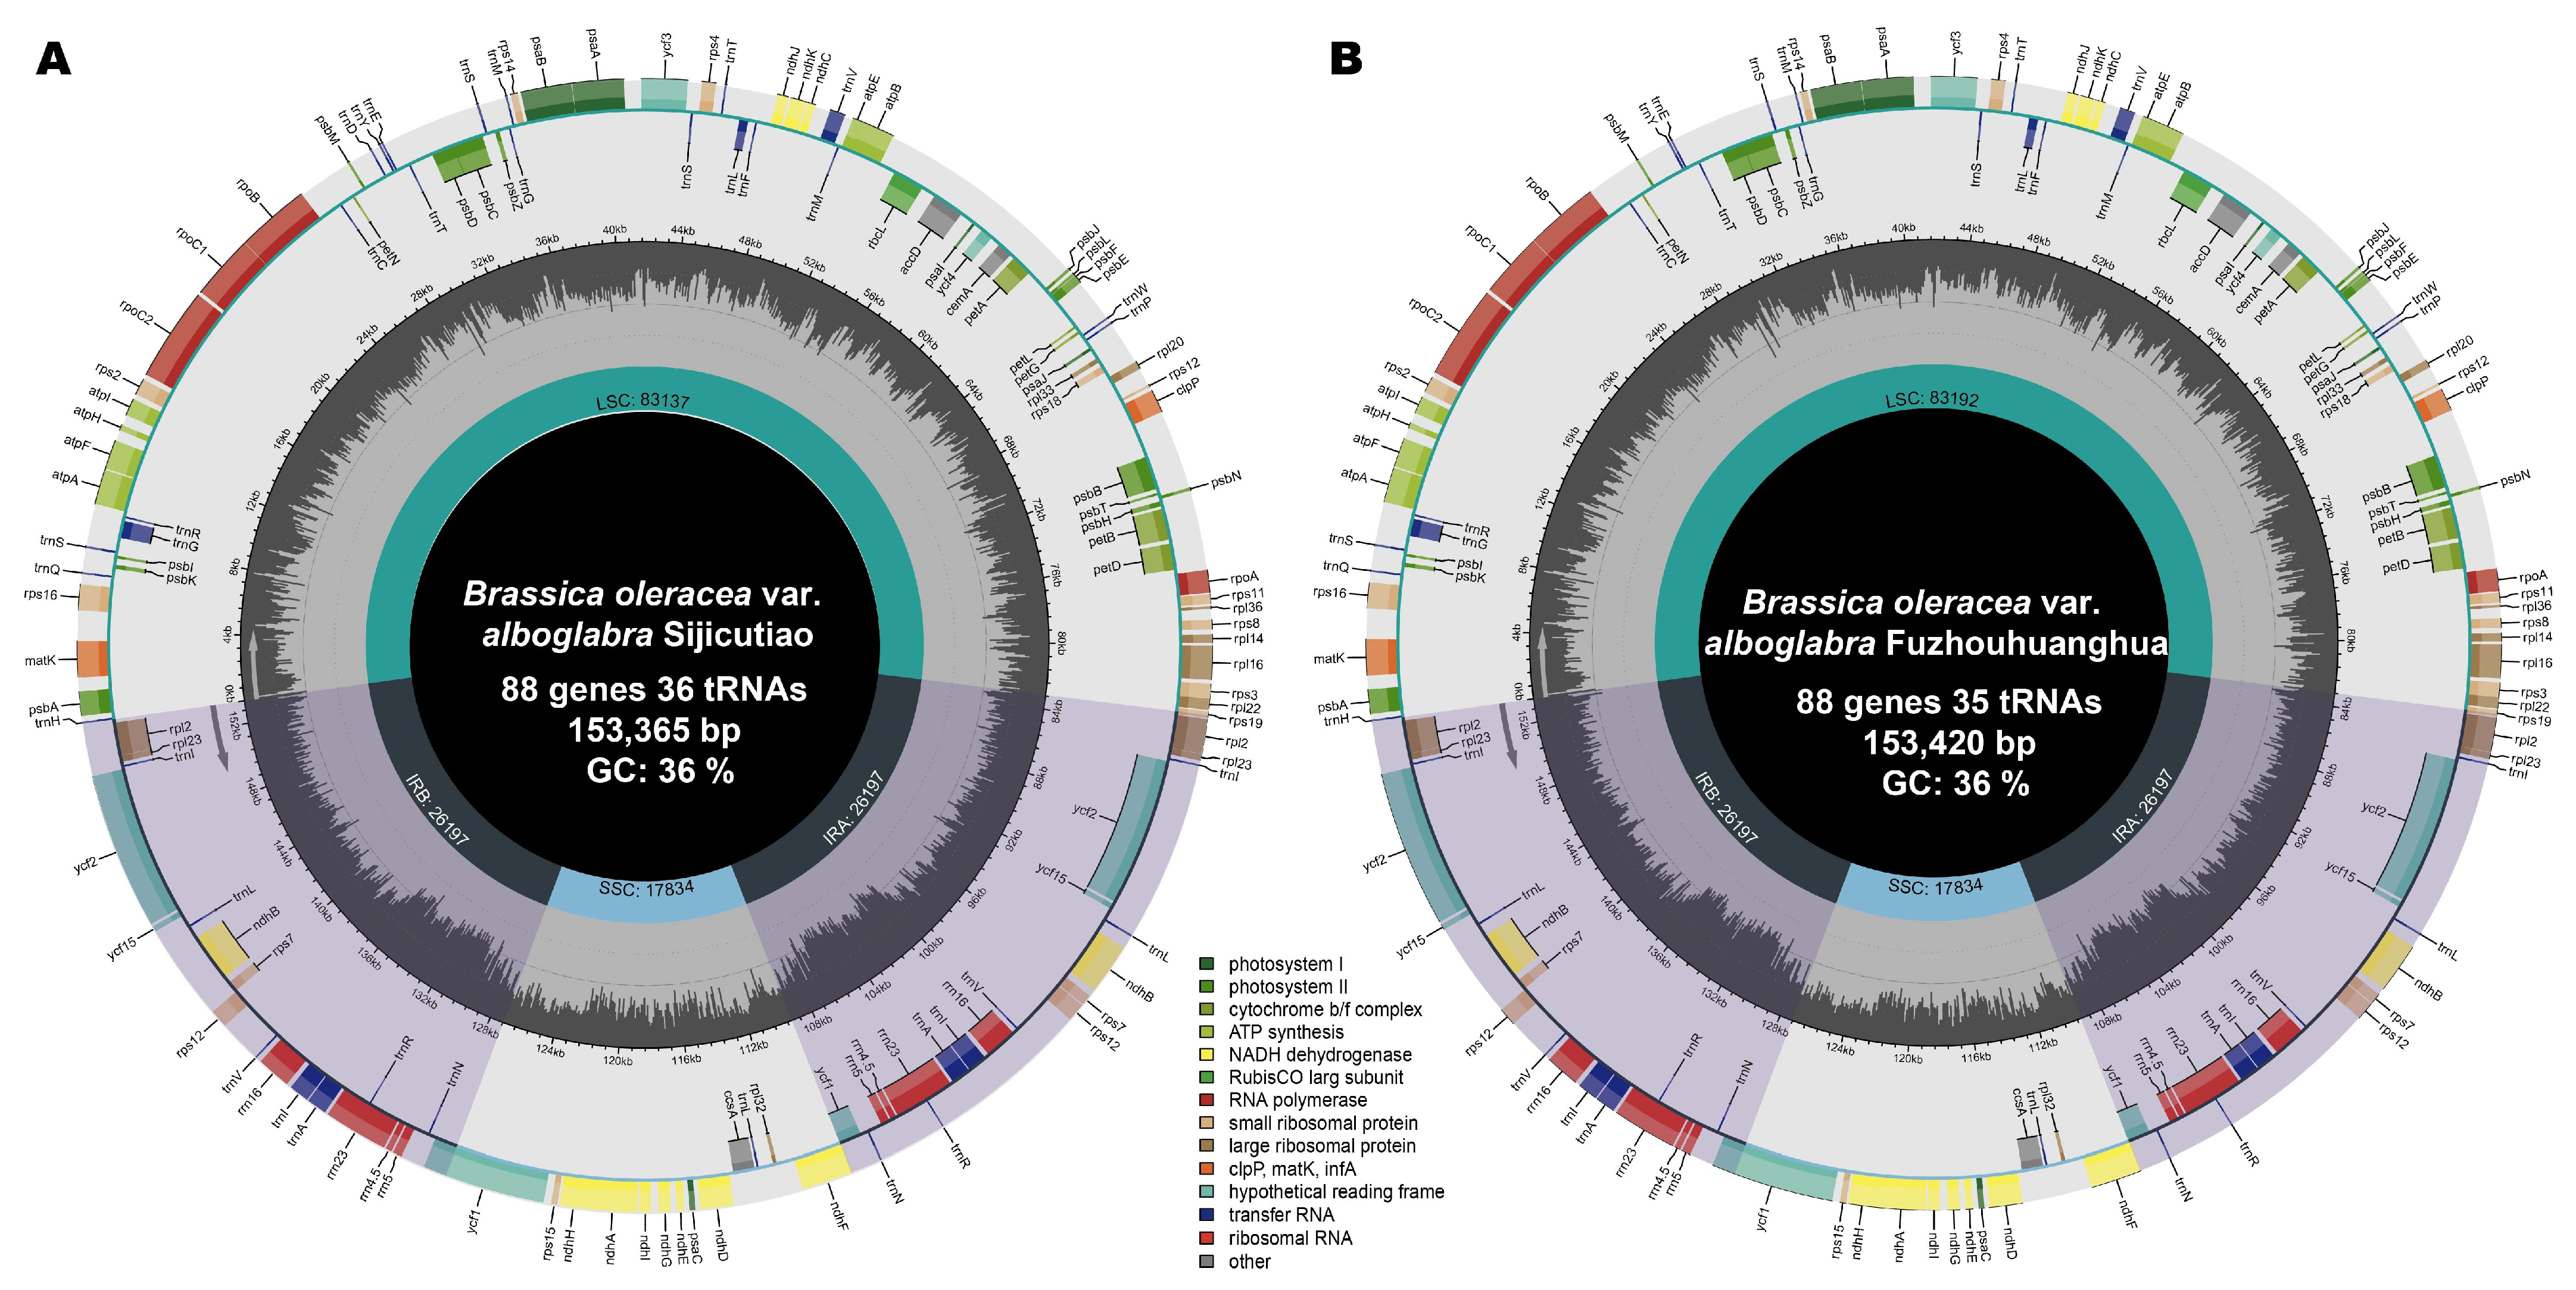
2.1. Chloroplast Genome Characterization

We sequenced the chloroplast genomes of SJCT (Brassica oleracea var. alboglabra cv. Sijicutiao (SJCT)) and FZHH (Brassica oleracea var. alboglabra cv. Fuzhouhuanghua (FZHH)). Both of them possessed the typical quadripartite structure, with complete lengths of 153,365 bp and 153,420 bp, respectively. Both chloroplast genomes contain a pair of IRs (26,197 bp) and an SSC region (17,834 bp). SJCT contains an LSC region with a length of 83,137 bp; the LSC region in FZHH has a length of 83,192 bp. The GC content of the two chloroplast genomes was 35.44%.
There were 88 protein-coding genes and eight rRNA genes in both Chinese kale varieties; there were 36 tRNA genes in SJCT and 35 tRNA genes in FZHH. In SJCT, the protein-coding genes were divided into four groups according to their functions, with 45 genes related to photosynthesis, 74 genes related to self-replication, eight genes with unknown functions, and five other genes (Supplemental Tables S1 and S2). The chloroplast genome of FZHH was found to lack the trnD gene, which was caused by a fragment insertion in the middle of the trnD gene sequence in FZHH (Figure 1).

2.2. SSRs and Repeat Sequence Analysis

An analysis of the long repeats showed that both Chinese kale varieties contained 12 forward repeats, 19 reverse complement repeats, and two reverse repeats. In the chloroplast genomes of the two Chinese kale varieties, six Brassica and two Sinapis, there were 11–20 forward repeats and 6–22 reverse complement repeats. All the species had 2–3 reverse repeats, with the exception of B. rapa, which had the maximum number of reverse repeats (up to 11); most of these reverse repeats were caused by single-base duplications of A (Figure 2A). Among the forward repeats, there were eight repeats in both Chinese kale varieties with a size of 30–35 bp; one repeat was 37 bp, one repeat was 43 bp, and two repeats were 46 bp and 47 bp, respectively (Supplemental Table S3). In the ten chloroplast genomes, there were 7–15 forward repeats of 30–35 bp, 1–2 forward repeats of 36–40 bp, 1–4 forward repeats of 41–45 bp, and 1–2 forward repeats of 46–50 bp. (Figure 2B). In addition, B. napus has one repeat of 51–55 bp. B. rapa has an identical continuous 58-bp repeat located in the non-coding region between atpH and atpI. S. arvensis also has one repeat of 56–58 bp. In the chloroplast genome of SJCT, an analysis of SSRs revealed 66 mononucleotides, 18 dinucleotides, 62 trinucleotides, five tetranucleotides, and no pentanucleotides or hexanucleotides. FZHH contained one less mononucleotide than SJCT. In the 10 chloroplast genomes, 46–69 mononucleotides, 17–25 dinucleotides, 62–67 trinucleotides, 5–6 tetranucleotides, 0–2 pentanucleotides, and 0–3 hexanucleotides were identified (Figure 2C). In the genome of SJCT, there were 30, 88, and 33 SSRs identified in the IR, LSC, and SSC regions, respectively. In FZHH, 30, 87, and 33 SSRs were identified in the IR, LSC, and SSC regions, respectively (Figure 2D). Most of the SSRs located in the protein-coding genes were trinucleotides (Supplemental Table S3).

2.3. RSCU Analysis

A total of 23,063 (SJCT), 23,063 (FZHH), 23,102 (B. nigra), 23,233 (B. carinata), 23,100 (B. rapa), 23,636 (B. napus), 23,143 (B. oleracea var. oleracea), 21,383 (B. juncea), 26,658 (S. arvensis), and 26,081 (S. alba) protein-coding sequences were identified in each of the 10 species. The results of the RSCU analysis were similar (Supplemental Table S4). If RSCU > 1, this codon is considered an optimal codon with high preference. In Chinese kale, there were 32 optimal codons, and most of them ended with A/T. According to the results, the most frequent amino acid was UUA, which encodes leucine, and the least frequent amino acids were CUG and AGC (Figure 3).

2.4. Chloroplast Genome Comparison

A comparison of the variation in the 10 chloroplast genomes using SJCT as a reference revealed a high degree of sequence similarity (Figure 4). This is consistent with the results of the mVISTA analysis, wherein the divergent hotspot regions indicated that the five mutational hotspots exhibited markedly higher π values. The matK-rps16 showed the highest average sequence divergence among the 10 chloroplast genomes, followed by rpl32-trnL and psbA (Figure 5). These genes could be used for DNA barcoding research in the future. According to the chloroplast genome structure analysis, no genome rearrangements were detected across all 10 chloroplast genomes (Supplemental Figure S1).
The IR boundaries of SJCT and FZHH were similar to those of B. oleracea var. oleracea (Figure 6). All 10 chloroplast genomes were highly conserved. The gene rps19 was detected at the LSC/IRb boundary, and there was only one base pair difference at this location across all the chloroplast genomes. Some differences were observed. First, in B. juncea, ycf1 was lost at the SSC/IRa boundary, which was caused by the lack of an initiation codon. Second, in S. arvensis, the premature transcription termination of ndhF was observed at the IRb/SSC boundary. In S. arvensis, trnN and trnH were replaced by BOP3, and the sequences near this location were virtually identical; this might be explained by the different annotations. With the exception of S. arvensis and S. alba, there was one more copy of ycf1 at the LSC/IRb boundary (Figure 6).

2.5. Evolution of the Protein-Coding Genes

Using the SJCT genome as a reference, the Ka/Ks ratio of the FZHH genome was invalid because their Ks values were 0. Genes were considered in the Ka/Ks analysis only when the Ka/Ks ratio was valid. The differences were the lowest between Chinese kale and B. oleracea var. oleracea. Overall, 13 genes in B. juncea, 10 genes in B. rapa, 12 genes in B. napus, 4 genes in B. oleracea var. oleracea, 46 genes in S. alba, and 41 genes in B. nigra, B. carinata, and S. arvensis had valid Ka/Ks ratios. Some of these genes had Ka/Ks ratios above 1: ndhF, petB, petD, and rpl16 in B. juncea; ndhF in B. rapa and B. napus; and ndhB in S. alba (Figure 7).

2.6. Phylogenetic Analysis

The topologies of the phylogenies constructed based on nucleotide and protein sequences were similar. Brassica was divided into two monophyletic clades. One clade was most closely related to S. alba. S. arvensis was most closely related to B. carinata rather than to S. alba. Another clade was closely related to Raphanus, and the two Chinese kale varieties were closely related to B. oleracea var. oleracea. B. napus, B. rapa, and B. juncea were most closely related in both trees (Figure 8).

3. Discussion

The height and blade profile of B. oleracea var. alboglabra are affected by both environmental stimuli and genetic background. SJCT can be easily distinguished from FZHH by its white flower. Although there are some differences among the varieties aside from flower color, these differences can be easily masked by the effect of the environment during the breeding process. Whether white-flower and yellow-flower Chinese kale share the same origin has not yet been established. In other words, the flower color is the standard used to identify variants, but differences in flower color do not necessarily reflect distant relationships.
The complete chloroplast genomes of both Chinese kale variants, six Brassica, and two Sinapis were included in the comparative analysis. The Triangle of U describes a theory of the evolutionary relationships among six globally important Brassica species [17]. This theory posits that the combination of the Brassica genomes of three diploid plants formed three modern tetraploid vegetable and rape cultivars. According to the Triangle of U, B. nigra, B. oleracea, and B. rapa were diploid, and B. carinata, B. juncea, and B. napus were tetraploid. The tetraploid species were cultivated from two diploid species. The relationships between these species have been elucidated using various tools. B. carinata has been shown to be derived from interspecific hybridization between the diploid progenitors B. nigra and B. oleracea [18,19]. S. alba, also known as Brassica hirta, is a white-flowered or yellow-flowered annual plant in the family Brassicaceae [20]. Therefore, we included two Sinapis species in our comparative analysis in addition to the eight Brassica species.
We completed the sequencing, assembly, and annotation of two chloroplast genomes and identified 88 protein-coding genes and eight rRNA genes in the SJCT and FZHH chloroplast genomes. There were 36 tRNA genes in SJCT and 35 tRNA genes in FZHH, and this difference stemmed from the loss of trnD. SSRs are an excellent tool for phylogenetic research [21]. They are especially valuable for studies of intraspecific population genetic variation, evolutionary studies at the interspecific level, and species identification [22]. We identified 148–162 SSRs in the 10 chloroplast genomes; the highest number was observed in B. napus, and the lowest number was observed in S. alba. The number of SSRs in Chinese kale were 151 (SJCT) and 150 (FZHH). In all the chloroplast genomes, there were 11–14 forward repeats (except B. rapa, with the maximum number of 20), 1–3 reverse repeats (except B. rapa, with the maximum number of 11), and 6–22 reverse complement repeats. Most studies suggest that the chloroplast SSRs were mainly distributed in the non-coding regions; we observed the same in the chloroplast genomes of both SJCT and FZHH.
DNA barcoding can be a useful tool for species identification [23], as it permits the rapid and accurate identification of species via short standard DNA fragments. The DNA barcode of matK and rbcL was adequate in terms of sequence quality, but these sequences are finite at the species level [24]. Five candidate DNA barcodes for identification (psbA, matk-rps16, rpl32, rpl32-trnL, and ycf1) were obtained by a comparison of the nucleotide variability (Pi) between 10 species of Brassicaceae, which is consistent with the results of the mVISTA analysis.
The expansion of IR and the variable SSC regions is considered the main mechanism underlying the length variation in angiosperm chloroplast genomes [25,26]. Generally, the genes at the LSC/IRb and SSC/IRa boundaries were rps19 and ycf1, respectively. The ycf1 gene of B. juncea was lost. These results are consistent with the findings in Brassica oleracea var. italic [27] and S. alba [28].
Synonymous (Ks) and non-synonymous (Ka) nucleotide substitution patterns are important for inferring the evolution of genes, as these metrics are used for assessing selective pressures on protein-coding genes [29]. A Ka/Ks analysis suggested that selection for rpl2 and rps12 in both Chinese kale varieties was weak, and this was consistent with the analysis of ycf1, ycf2, and rps12. Protein-coding genes generally experience purifying selection [30,31]. A Ka/Ks analysis of the 10 chloroplast genomes using SJCT as a reference showed that the Ka/Ks ratio of petB in B. juncea was greater than 1, indicating positive selection. The gene petB is a photosynthetic system gene that encodes the protein cytochrome b6, which forms a part of the cytochrome b6f complex (Cytb6f). In the electron transport chain, Cytb6f functions as an electron hub between photosystem II (PSII) and photosystem I (PSI) [32] and plays an important role in photosynthesis. In B. rapa and B. napus, the Ka/Ks values of ndhF were both greater than 1, indicating positive selection. The gene ndhF is associated with NADH dehydrogenase [30].
Phylogenetic trees are generally built to determine the genetic relationships between species. A phylogenetic tree based on nucleotide and amino acid sequences revealed that B. napus, B. rapa, B. juncea, and B. oleracea var. oleracea were clustered into one subgroup and B. carinata and B. nigra were clustered into another subgroup. These findings are consistent with the results of a previous study showing that Brassica coenospecies could be divided into the Brassica and Sinapis lineages [33]. The results also show that the species most closely related to B. oleracea var. oleracea is B. napus, and this is inconsistent with the results of previous research suggesting that B. rapa is the species most closely related to B. oleracea var. oleracea [34]. This difference might stem from the different genetic modes of the plastid genome and nuclear genome. The same gene in different populations might be subject to convergent selection; in light of the genetic conservatism of the chloroplast genome, B. nigra might be the maternal parent of B. carinata rather than B. oleracea var. oleracea, according to the phylogenetic tree of 45 chloroplast genomes, including the chloroplast genomes of the two Chinese kale varieties.

4. Materials and Methods

4.1. Plant Material and DNA Extraction and Sequencing

Fresh leaves of white flower Chinese kale, Brassica oleracea var. alboglabra cv. Sijicutiao (SJCT) and yellow flower Chinese kale, Brassica oleracea var. alboglabra cv. Fuzhouhuanghua (FZHH) were collected from the College of Horticulture, Sichuan Agricultural University. The total genomic DNA was extracted from the leaves according to a modified CTAB method [35]. Fifteen pairs of universal primer were used for PCR amplifications (Supplemental Table S5) [36]. The paired reads with 300 bp insert size sequencing were performed with an Illumina Hiseq X Ten platform by Shenzhen BGI Genomics Co., Ltd. (Shenzhen, China) [37]. Raw data filtering was used to obtain clean reads (2 GB) by Trimmomatic v0.22 [38].

4.2. Gene Assembly and Annotation

Pilon (https://github.com/broadinstitute/pilon/releases (accessed on 25 May 2022)) was utilized to correct the spliced sequence [39]. The chloroplast genomes were assembled by SPAdes v.3.11.0 [40] using the chloroplast genome of B. oleracea var. oleracea (NC_041167.1) as a reference. The complete chloroplast genome sequences were annotated using Chloroplast Genome Annotation, Visualization, Analysis, and GenBank Submission (CPGAVAS) (http://47.96.249.172:16019/analyzer/home (accessed on 15 January 2023)) [41]. The organisms were named Brassica oleracea var. alboglabra cv. Sijicutiao and Brassica oleracea var. alboglabra cv. Fuzhouhuanghua, and the sequences were submitted to GenBank (Accession number OR063915 and OR063916). The circular genome map was drawn using Chloroplot (https://irscope.shinyapps.io/Chloroplot/ (accessed on 15 January 2023)) [42].

4.3. Sequence Analysis and Statistics

The relative synonymous codon usage (RSCU) analysis was produced using CodonW (http://codonw.sourceforge.net/ (accessed on 18 February 2023)). REPuter (https://bibiserv.cebitec.uni-bielefeld.de/reputer/ (accessed on 19 February 2023)) was used to analyze the repeat sequences from 30 bp to 100 bp, and the hamming distance was set to 3. A simple sequence repeat (SSR) analysis was conducted using MIcroSAtellite (MISA) [43], and the minimum number of repeats was set to 8, 5, 3, 3, and 3 for mononucleotides, dinucleotides, trinucleotides, tetranucleotides, pentanucleotides, and hexanucleotides, respectively [44].

4.4. Genome Comparison

Two Chinese kale varieties, six species of the Triangle of U (B. oleracea, B. rapa, B. napus, B. juncea, B. nigra, and B. carinata), and two species of Sinapis (Sinapis alba and S. arvensis), which is considered the genus most closely related to Brassica, were included in the comparative genome analysis.
The annotations were compared by mVISTA in the Shuffle-LAGAN mode using SJCT as a reference [45]. The whole chloroplast genome sequences were aligned in Geneious 9.0.2 (https://www.geneious.com (accessed on 24 March 2023)) with Mauve 2.3.1. The contraction and expansion of the IR boundaries were detected and visualized between four main regions (LSC/IRb/SSC/IRa) of 10 chloroplast genome sequences using IRSCOPE (https://irscope.shinyapps.io/irapp/ (accessed on 24 March 2023)). The nucleotide variability was calculated using DnaSP v5.10 [46]. The Ka/Ks values were calculated with KaKs_calculator 2.0, using SJCT as a reference [47].

4.5. Phylogenetic Analysis

The protein-coding sequences and the nucleotide sequences of 45 chloroplast genomes, including SJCT and FZHH, were used to conduct the phylogenetic analysis. Chloroplast genomes of 43 other species were downloaded from NCBI, including three chloroplast genome sequences used as outgroup species (Supplemental Table S6). The chloroplast genome sequences were aligned using MAFFT v7 [48], and conserved sequences were extracted using HomBlocks [49] with the G-blocks. The phylogenetic trees were constructed using IQ-tree [50], and a maximum likelihood (ML) analysis was performed with the best-fit model JTT+F+R3 for the protein-coding sequences (TVM+F+R3 for the nucleotide sequences).

5. Conclusions

In this study, the complete chloroplast genomes of two Chinese kale varieties were sequenced and analyzed for the first time. They both contained 88 protein-coding genes and eight rRNA genes; there were 36 and 35 tRNA genes in SJCT and FZHH, respectively. The analysis of the 10 chloroplast genomes of Brassicaceae revealed that their RSCU values were similar. Five highly variable regions of DNA barcodes were detected. The structures of the chloroplast genomes were conserved. Using Chinese kale as a reference, we found that the lowest number of differential genes was observed in B. oleracea var. oleracea and natural selection has shaped the evolution of these genes. These results suggest that both white-flower and yellow-flower Chinese kale are derived from one common monophyletic origin, and these two Chinese kale varieties likely possessed different colors late in the artificial selection process.

Supplementary Materials

The supporting information can be downloaded at: https://www.mdpi.com/article/10.3390/ijms241210287/s1.

Author Contributions

Conceptualization, Q.C., Q.W. and B.S.; investigation, Y.W., Q.L., H.H. (Hao He), Z.H. and Y.T.; data curation, C.Z., H.H. (Huanhuan Huang), M.W., M.L., Q.C., H.M. and H.L.; writing—original draft preparation, Y.W., Q.L. and C.Z.; writing—review and editing, F.Z., Q.W. and B.S.; funding acquisition, H.M., H.L., F.Z., Q.W. and B.S. All authors have read and agreed to the published version of the manuscript.

Funding

This research was funded by the National Natural Science Foundation of China (32072586, 31500247, 32172593), the Natural Science Foundation of Sichuan Province (2022NSFSC1689), the Project of New Varieties Breeding of Sichuan Vegetable Innovation Team (sccxtd-2022-05), the Natural Science Foundation of Zhejiang Province (LY21C020002), and the Science and Technology Plan Project of Ningbo City (2021Z132).

Institutional Review Board Statement

Not applicable.

Informed Consent Statement

Not applicable.

Data Availability Statement

All data supporting the findings of this study are available within the paper and within its Supplementary Materials published online.

Conflicts of Interest

The authors declare no conflict of interest.

References

  1. Sugiura, M. The chloroplast genome. Plant Mol. Biol. 1992, 19, 149–168. [Google Scholar] [CrossRef] [PubMed]
  2. de Vere, N.; Rich, T.C.; Trinder, S.A.; Long, C. DNA barcoding for plants. Methods Mol. Biol. 2015, 1245, 101–118. [Google Scholar] [PubMed]
  3. Wickett, N.J.; Forrest, L.L.; Budke, J.M.; Shaw, B.; Goffinet, B. Frequent pseudogenization and loss of the plastid-encoded sulfate-transport gene cysA throughout the evolution of liverworts. Am. J. Bot. 2011, 98, 1263–1275. [Google Scholar] [CrossRef] [PubMed]
  4. Gu, X.; Zhu, M.; Su, Y.; Wang, T. A Large Intergenic Spacer Leads to the Increase in Genome Size and Sequential Gene Movement around IR/SC Boundaries in the Chloroplast Genome of Adiantum malesianum (Pteridaceae). Int. J. Mol. Sci. 2022, 23, 15616. [Google Scholar] [CrossRef]
  5. Bock, R. Structure, function, and inheritance of plastid genomes. Top. Curr. Genet. 2007, 19, 29–63. [Google Scholar]
  6. Sassenrath-Cole, G.F. Photosynthesis, a comprehensive treatise. Crop Sci. 1998, 39, 282–283. [Google Scholar] [CrossRef]
  7. Yu, Z.; Yan, L.I.; Bo, S.; Yu, S.; Wang, Q.; Bingliang, A.W. Taxonomic relationship between Chinese kale and other varieties in Brassica oleracea L. Acta Hortic. Sin. 2010, 37, 1161–1168. [Google Scholar]
  8. Liu, H.; Guan, P. Taxonomic relation between yellow-flower Chinese kale and white-flower Chinese kale. South China Agr. Univ. 1997, 2, 16–19. [Google Scholar]
  9. Sinskaia, E.N. Geno-systematical investigation of cultivated Brassica. Bull. Appl. Bot. Plant-Breed. 1927, 17, 1–166. [Google Scholar]
  10. Wang, X.; Luo, P. Studies on the karyotypes and C-banding patterns of Chinese kale (Brassica alboglabra) and cabbage (B. oleracea var. capitata). Acta Bot. Sin. 1987, 26, 362–366. [Google Scholar]
  11. Wei, Z. Comparison of pollen morphology of Brassica alboglabra and some other species of the genus Brassica. Acta Bot. Yunnanica 1991, 13, 290–292. [Google Scholar]
  12. Masa, I. Pollen Grahts of Japan Tokyo; Hirokawa Pubilishing: Hilo, HI, USA, 1956. [Google Scholar]
  13. Lan, Y.; Gheo, T.; Qian, W. Studies on the Pollen Morphology of the Genus Brassica (Cruciferae) in China. J. Univ. Chin. Acad. Sci. 1989, 27, 386–394. [Google Scholar]
  14. Treccarichi, S.; Ben Ammar, H.; Amari, M.; Cali, R.; Tribulato, A.; Branca, F. Molecular Markers for Detecting Inflorescence Size of Brassica oleracea L. Crops and B. oleracea Complex Species (n = 9) Useful for Breeding of Broccoli (B. oleracea var. italica) and Cauliflower (B. oleracea var. botrytis). Plants 2023, 12, 407. [Google Scholar] [CrossRef]
  15. Nagaharu, U. Genome analysis in Brassica with special reference to the experimental formation of B. napus and peculiar mode of fertilization. Jpn. J. Bot. 1935, 7, 389–452. [Google Scholar]
  16. Katepa-Mupondwa, F.; Gugel, R.K.; Raney, J.P. Genetic diversity for agronomic, morphological and seed quality traits in Sinapis alba L. (yellow mustard). Can. J. Plant Sci. 2005, 86, 1015–1025. [Google Scholar] [CrossRef] [Green Version]
  17. Xue, J.Y.; Wang, Y.; Chen, M.; Dong, S.; Shao, Z.Q.; Liu, Y. Maternal Inheritance of U’s Triangle and Evolutionary Process of Brassica Mitochondrial Genomes. Front. Plant Sci. 2020, 11, 805. [Google Scholar] [CrossRef]
  18. Song, X.; Wei, Y.; Xiao, D.; Gong, K.; Sun, P.; Ren, Y.; Yuan, J.; Wu, T.; Yang, Q.; Li, X.; et al. Brassica carinata genome characterization clarifies U’s triangle model of evolution and polyploidy in Brassica. Plant Physiol. 2021, 186, 388–406. [Google Scholar] [CrossRef]
  19. Yamagishi, H.; Tanaka, Y.; Terachi, T. Complete mitochondrial genome sequence of black mustard (Brassica nigra; BB) and comparison with Brassica oleracea (CC) and Brassica carinata (BBCC). Genome 2014, 57, 577–582. [Google Scholar] [CrossRef]
  20. Yang, T.; Cai, B.; Jia, Z.; Wang, Y.; Wang, J.; King, G.J.; Ge, X.; Li, Z. Sinapis genomes provide insights into whole-genome triplication and divergence patterns within tribe Brassiceae. Plant J. 2023, 113, 246–261. [Google Scholar] [CrossRef]
  21. Ebert, D.; Peakall, R. Chloroplast simple sequence repeats (cpSSRs): Technical resources and recommendations for expanding cpSSR discovery and applications to a wide array of plant species. Mol. Ecol. Resour. 2009, 9, 673–690. [Google Scholar] [CrossRef]
  22. Provan, J.; Powell, W.; Hollingsworth, P.M. Chloroplast microsatellites: New tools for studies in plant ecology and evolution. Trends Ecol. Evol. 2011, 16, 142–147. [Google Scholar] [CrossRef] [PubMed]
  23. Hebert, P.D.N.; Cywinska, A.; Ball, S.L.; DeWaard, J.R. Biological identifications through DNA barcodes. Proc. Biol. Sci. 2003, 270, 313–321. [Google Scholar] [CrossRef] [PubMed] [Green Version]
  24. Mahima, K.; Sunil Kumar, K.N.; Rakhesh, K.V.; Rajeswaran, P.S.; Sharma, A.; Sathishkumar, R. Advancements and future prospective of DNA barcodes in the herbal drug industry. Front. Pharmacol. 2022, 13, 947512. [Google Scholar] [CrossRef] [PubMed]
  25. Kim, K.J.; Lee, H.L. Complete chloroplast genome sequences from Korean ginseng (Panax schinseng Nees) and comparative analysis of sequence evolution among 17 vascular plants. DNA Res. 2004, 11, 247–261. [Google Scholar] [CrossRef] [PubMed]
  26. Dugas, D.V.; Hernandez, D.; Koenen, E.J.; Schwarz, E.; Straub, S.; Hughes, C.E.; Jansen, R.K.; Nageswara-Rao, M.; Staats, M.; Trujillo, J.T.; et al. Mimosoid legume plastome evolution: IR expansion, tandem repeat expansions, and accelerated rate of evolution in clpP. Sci. Rep. 2015, 5, 16958. [Google Scholar] [CrossRef] [Green Version]
  27. Zhang, Z.; Tao, M.; Shan, X.; Pan, Y.; Sun, C.; Song, L.; Pei, X.; Jing, Z.; Dai, Z. Characterization of the complete chloroplast genome of Brassica oleracea var. italica and phylogenetic relationships in Brassicaceae. PLoS ONE 2022, 17, e0263310. [Google Scholar] [CrossRef]
  28. Du, X.; Zeng, T.; Feng, Q.; Hu, L.; Luo, X.; Weng, Q.; He, J.; Zhu, B. The complete chloroplast genome sequence of yellow mustard (Sinapis alba L.) and its phylogenetic relationship to other Brassicaceae species. Gene 2020, 731, 144340. [Google Scholar] [CrossRef]
  29. Yang, Z.; Nielsen, R. Estimating synonymous and nonsynonymous substitution rates under realistic evolutionary models. Mol. Biol. Evol. 2000, 17, 32–43. [Google Scholar] [CrossRef] [Green Version]
  30. Wang, H.; Gan, C.; Luo, X.; Dong, C.; Zhou, S.; Xiong, Q.; Weng, Q.; Hu, X.; Du, X.; Zhu, B. Complete chloroplast genome features of the model heavy metal hyperaccumulator Arabis paniculata Franch and its phylogenetic relationships with other Brassicaceae species. Physiol. Mol. Biol. Plants 2022, 28, 775–789. [Google Scholar] [CrossRef]
  31. Wu, Z.; Liao, R.; Yang, T.; Dong, X.; Lan, D.; Qin, R.; Liu, H. Analysis of six chloroplast genomes provides insight into the evolution of Chrysosplenium (Saxifragaceae). BMC Genom. 2020, 21, 621. [Google Scholar] [CrossRef]
  32. Heyno, E.; Ermakova, M.; Lopez-Calcagno, P.E.; Woodford, R.; Brown, K.L.; Matthews, J.S.A.; Osmond, B.; Raines, C.A.; von Caemmerer, S. Rieske FeS overexpression in tobacco provides increased abundance and activity of cytochrome b6 f. Physiol. Plant. 2022, 174, e13803. [Google Scholar] [CrossRef]
  33. Pradhan, A.K.; Prakash, S.; Mukhopadhyay, A.; Pental, D. Phytogeny of Brassica and allied genera based on variation in chloroplast and mitochondrial DNA patterns: Molecular and taxonomic classifications are incongruous. Theor. Appl. Genet. 1992, 85, 331–340. [Google Scholar] [CrossRef]
  34. Yim, W.C.; Swain, M.L.; Ma, D.; An, H.; Bird, K.A.; Curdie, D.D.; Wang, S.; Ham, H.D.; Luzuriaga-Neira, A.; Kirkwood, J.S.; et al. The final piece of the Triangle of U: Evolution of the tetraploid Brassica carinata genome. Plant Cell 2022, 34, 4143–4172. [Google Scholar] [CrossRef]
  35. Gawel, N.J.; Jarret, R.L. A modified CTAB DNA extraction procedure for Musa and Ipomoea. Plant Mol. Biol. Rep. 1991, 9, 262–266. [Google Scholar] [CrossRef]
  36. Zhang, T.; Zeng, C.X.; Yang, J.B.; Li, H.T.; Li, D.Z. Fifteen novel universal primer pairs for sequencing whole chloroplast genomes and a primer pair for nuclear ribosomal DNAs. J. Syst. Evol. 2016, 54, 219–227. [Google Scholar] [CrossRef]
  37. Chen, Q.; Wang, Y.; Wang, X.R.; Tang, H.R. The complete chloroplast genome sequence of Rubus lambertianus var. glaber: Sequence divergence and phylogenetic application. Mitochondrial DNA B Resour. 2020, 5, 1261–1262. [Google Scholar] [CrossRef] [Green Version]
  38. Bolger, A.M.; Lohse, M.; Usadel, B. Trimmomatic: A flexible trimmer for Illumina sequence data. Bioinformatics 2014, 30, 2114–2120. [Google Scholar] [CrossRef] [Green Version]
  39. Walker, B.J.; Abeel, T.; Shea, T.; Priest, M.; Abouelliel, A.; Sakthikumar, S.; Cuomo, C.A.; Zeng, Q.; Wortman, J.; Young, S.K.; et al. Pilon: An integrated tool for comprehensive microbial variant detection and genome assembly improvement. PLoS ONE 2014, 9, e112963. [Google Scholar] [CrossRef]
  40. Bankevich, A.; Nurk, S.; Antipov, D.; Gurevich, A.A.; Dvorkin, M.; Kulikov, A.S.; Lesin, V.M.; Nikolenko, S.I.; Pham, S.; Prjibelski, A.D.; et al. SPAdes: A new genome assembly algorithm and its applications to single-cell sequencing. J. Comput. Biol. 2012, 19, 455–477. [Google Scholar] [CrossRef] [Green Version]
  41. Shi, L.; Chen, H.; Jiang, M.; Wang, L.; Wu, X.; Huang, L.; Liu, C. CPGAVAS2, an integrated plastome sequence annotator and analyzer. Nucleic Acids Res. 2019, 47, W65–W73. [Google Scholar] [CrossRef]
  42. Zheng, S.; Poczai, P.; Hyvönen, J.; Tang, J.; Amiryousefi, A. Chloroplot: An Online Program for the Versatile Plotting of Organelle Genomes. Front. Genet. 2020, 11, 576124. [Google Scholar] [CrossRef] [PubMed]
  43. Beier, S.; Thiel, T.; Münch, T.; Scholz, U.; Mascher, M. MISA-web: A web server for microsatellite prediction. Bioinformatics 2017, 33, 2583–2585. [Google Scholar] [CrossRef] [PubMed] [Green Version]
  44. Li, M.; Zhang, R.; Li, J.; Zheng, K.; Xiao, J.; Zheng, Y. Analyses of chloroplast genome of Eutrema japonicum provide new insights into the evolution of Eutrema species. Agronomy 2021, 11, 2546. [Google Scholar] [CrossRef]
  45. Frazer, K.A.; Pachter, L.; Poliakov, A.; Rubin, E.M.; Dubchak, I. VISTA: Computational tools for comparative genomics. Nucleic Acids Res. 2004, 32, W273–W279. [Google Scholar] [CrossRef] [Green Version]
  46. Librado, P.; Rozas, J. DnaSP v5: A software for comprehensive analysis of DNA polymorphism data. Bioinformatics 2009, 25, 1451–1452. [Google Scholar] [CrossRef] [PubMed] [Green Version]
  47. Wang, D.; Zhang, Y.; Zhang, Z.; Zhu, J.; Yu, J. KaKs_Calculator 2.0: A toolkit incorporating gamma-series methods and sliding window strategies. Genom. Proteom. Bioinform. 2010, 8, 77–80. [Google Scholar] [CrossRef] [Green Version]
  48. Katoh, K.; Misawa, K.; Kuma, K.I.; Miyata, T. MAFFT: A novel method for rapid multiple sequence alignment based on fast Fourier transform. Nucleic Acids Res. 2002, 30, 3059–3066. [Google Scholar] [CrossRef] [Green Version]
  49. Bi, G.; Mao, Y.; Xing, Q.; Cao, M. HomBlocks: A multiple-alignment construction pipeline for organelle phylogenomics based on locally collinear block searching. Genomics 2018, 110, 18–22. [Google Scholar] [CrossRef]
  50. Nguyen, L.T.; Schmidt, H.A.; von Haeseler, A.; Minh, B.Q. IQ-TREE: A fast and effective stochastic algorithm for estimating maximum-likelihood phylogenies. Mol. Biol. Evol. 2015, 32, 268–274. [Google Scholar] [CrossRef]
Figure 1. The complete chloroplast genome maps of (A) B. oleracea var. alboglabra cv. Sijicutiao (SJCT) and (B) B. oleracea var. alboglabra cv. Fuzhouhuanghua (FZHH). The genes in the circle are transcribed clockwise, and the genes outside are transcribed counterclockwise. Genes are color-coded according to their roles. The G/C content of each gene is shown in the deep grey in the central circle and the A/T content is shown in lighter grey.
Ijms 24 10287 g001
Figure 2. Dispersed repeated sequence analyses in 10 chloroplast genomes. (A) Number of three types of repeated sequences in 10 chloroplast genomes; (B) Number of dispersed repeated sequences with different period sizes; (C) Number of SSRs with different sizes; (D) Statistics of different SSR locations in SJCT and FZHH.
Ijms 24 10287 g002
Figure 3. Amino acids and stop codons of RSCU for the protein-coding regions in Chinese kale.
Ijms 24 10287 g003
Figure 4. mVISTA-based visual representation of the aligned genomes of the ten chloroplast genomes using annotation of SJCT chloroplast genome as the reference.
Ijms 24 10287 g004
Figure 5. The nucleotide variability (Pi) values were compared among ten chloroplast genomes. Position of the window midpoint on the X-axis and the nucleotide diversity within each window on the Y-axis (window length: 600 bp, step size: 200 bp).
Ijms 24 10287 g005
Figure 6. Comparison of LSC, IR, and SSC junction positions among ten chloroplast genomes.
Ijms 24 10287 g006
Figure 7. The Ka/Ks ratio of protein-coding genes of ten chloroplast genomes.
Ijms 24 10287 g007
Figure 8. The ML (maximum likelihood) based on 45 complete chloroplast genomes nucleotide sequences (left) and protein sequences (right).
Ijms 24 10287 g008
Disclaimer/Publisher’s Note: The statements, opinions and data contained in all publications are solely those of the individual author(s) and contributor(s) and not of MDPI and/or the editor(s). MDPI and/or the editor(s) disclaim responsibility for any injury to people or property resulting from any ideas, methods, instructions or products referred to in the content.

