Article

RCD1 Promotes Salt Stress Tolerance in Arabidopsis by Repressing ANAC017 Activity

1
Guangdong Provincial Key Laboratory for Plant Epigenetics, Longhua Bioindustry and Innovation Research Institute, College of Life Sciences and Oceanography, Shenzhen University, Shenzhen 518060, China
2
Key Laboratory of Optoelectronic Devices and Systems of Ministry of Education and Guangdong Province, College of Optoelectronic Engineering, Shenzhen University, Shenzhen 518060, China
3
Institute of Advanced Agricultural Science, Peking University, Weifang 261000, China
4
Department of Botany and Plant Sciences, Institute for Integrative Genome Biology, University of California, Riverside, CA 92521, USA
*
Authors to whom correspondence should be addressed.
Int. J. Mol. Sci. 2023, 24(12), 9793; https://doi.org/10.3390/ijms24129793
Submission received: 19 April 2023 / Revised: 2 June 2023 / Accepted: 4 June 2023 / Published: 6 June 2023
(This article belongs to the Special Issue Molecular Regulatory Mechanisms of Salinity Tolerance in Plants)

Abstract

:
Plants have evolved diverse strategies to accommodate saline environments. More insights into the knowledge of salt stress regulatory pathways will benefit crop breeding. RADICAL-INDUCED CELL DEATH 1 (RCD1) was previously identified as an essential player in salt stress response. However, the underlying mechanism remains elusive. Here, we unraveled that Arabidopsis NAC domain-containing protein 17 (ANAC017) acts downstream of RCD1 in salt stress response, and its ER-to-nucleus transport is triggered by high salinity. Genetic and biochemical evidence showed that RCD1 interacts with transmembrane motif-truncated ANAC017 in the nucleus and represses its transcriptional activity. Transcriptome analysis revealed that genes associated with oxidation reduction process and response to salt stress are similarly dysregulated in loss-of-function rcd1 and gain-of-function anac017-2 mutants. In addition, we found that ANAC017 plays a negative role in salt stress response by impairing the superoxide dismutase (SOD) enzyme activity. Taken together, our study uncovered that RCD1 promotes salt stress response and maintains ROS homeostasis by inhibiting ANAC017 activity.

1. Introduction

High salinity stress severely impacts the growth and development of plants throughout the life cycle, leading to yield loss for major food crops [1,2,3]. As sessile organisms, plants have evolved various strategies to cope with high salinity stress. In the past decades, numerous studies have gradually illustrated the complex regulatory network of salinity stress responses in plants, as well as the interplay of salt stress response and other signaling pathways, such as phytohormones signaling [2,4,5].
In Arabidopsis, the RADICAL-INDUCED CELL DEATH 1 (RCD1) protein was characterized as an important cellular hub for different stress responses, phytohormone signaling pathways, and plant growth and development. A mutant of RCD1 was first isolated based on its sensitivity to apoplastic reactive oxygen species (ROS), particularly superoxide [6], and loss-of-function rcd1 mutants exhibit developmental defects, including dwarfed stature, altered leaf and rosette morphology, increased branching, early flowering, and early senescence [6,7]. Subsequent studies reported the functions of RCD1 in response to various stresses and several phytohormones, including salinity, UV-B, heat, high light, ethylene, abscisic acid (ABA), and methyl jasmonate [7,8,9,10]. These pleiotropic effects of RCD1 have been attributed to its diverse interacting partners, including many transcription factors (TFs) involved in different regulatory pathways, via the C-terminal RCD1-SRO1-TAF4 (RST) domain [11,12]. Intriguingly, the RCD1 protein is predominantly localized in the nucleus under unstressed conditions, and the nuclear localization is conferred by three N-terminal nuclear localization signals (NLSs) with the assistance of the WWE and poly ADP-ribose polymerase (PARP) domains. Under salt stress conditions, RCD1 is also present in the cytoplasm, where it interacts with the plasma membrane-localized Na+/H+ antiporter SALT OVERLY SENSITIVE 1 (SOS1) to respond to salt stress [9,13,14]. Moreover, Aribidopsis plants overexpressing the full-length RCD1 exhibit more resistance to salt stress [12].
Recently, RCD1 was identified as a hub to integrate retrograde signaling from chloroplast and mitochondria through two TFs, Arabidopsis NAC domain-containing proteins 13 and 17 (ANAC013 and ANAC017) [15]. ANAC017 is a master positive effector in the retrograde signaling network and is anchored on the endoplasmic reticulum (ER) membrane through its C-terminal transmembrane™ domain under normal conditions. When retrograde signaling is triggered, such as when electron transfer in chloroplasts and mitochondria is compromised by methyl viologen (MV) and antimycin A (AA) treatment, respectively, ANAC017 is cleaved at the TM, and its N-terminal fragment enters the nucleus to directly activate the expression of numerous mitochondrial dysfunction stimulon (MDS) genes, including its homolog ANAC013 and an indicator gene of mitochondrial retrograde signaling ALTERNATIVE OXIDASE 1a (AOX1a) [16,17,18,19]. Notably, overexpression of ANAC017 resulted in retarded growth similar to the rcd1 mutant, and this was attributed to the abnormal expression of MDS genes activated by ANAC017 [19], as loss-of-function of ANAC017 in rcd1 could rescue the plant phenotype [15]. These findings suggest that ANAC017 may act as a major downstream factor of RCD1 to modulate plant growth and development through retrograde signaling. However, it remains unknown whether ANAC017 participates in RCD1-mediated salt stress response.
ROS are byproducts of various metabolic processes, including superoxide anion (O2•−), hydrogen peroxide (H2O2), singlet oxygen (1O2), and hydroxyl radical (OH) [20,21,22]. ROS are distributed widely in plant cells at low levels and act as signaling molecules to participate in many developmental processes. In retrograde signaling from both chloroplasts and mitochondria, ROS are thought to be intracellular signals and induce the expression of nuclear genes in an ANAC017-dependent manner [17,23,24]. On the other hand, a ROS burst serves as an indicator of salt stress-induced early response [3,4,25]. The production of ROS is greatly induced by high salinity, and over-accumulated ROS result in damage to cell structure and functions and activation of the antioxidant scavenging system [26,27]. Superoxide dismutase (SOD), catalase (CAT), and peroxidase (POD) are major enzymes in the enzymatic antioxidant system to maintain ROS homeostasis. After exposure to salt stress, chloroplast- and/or mitochondria-produced O2•− is quickly converted into H2O2 by SOD, followed by the reduction of H2O2 to water through CAT, POD, and other reductases [28,29].
In this study, we demonstrated a novel role of ANAC017 in salt stress response. Similar to AA treatment, high salinity triggered the translocation of ANAC017 from the ER membrane to the nucleus, where it negatively regulates salt stress tolerance by affecting ROS scavenging enzyme activities to disrupt ROS homeostasis. In the nucleus, RCD1 interacted with ANAC017 to repress its transcriptional activity, thus maintaining ROS homeostasis and enabling salt stress responses.

2. Results

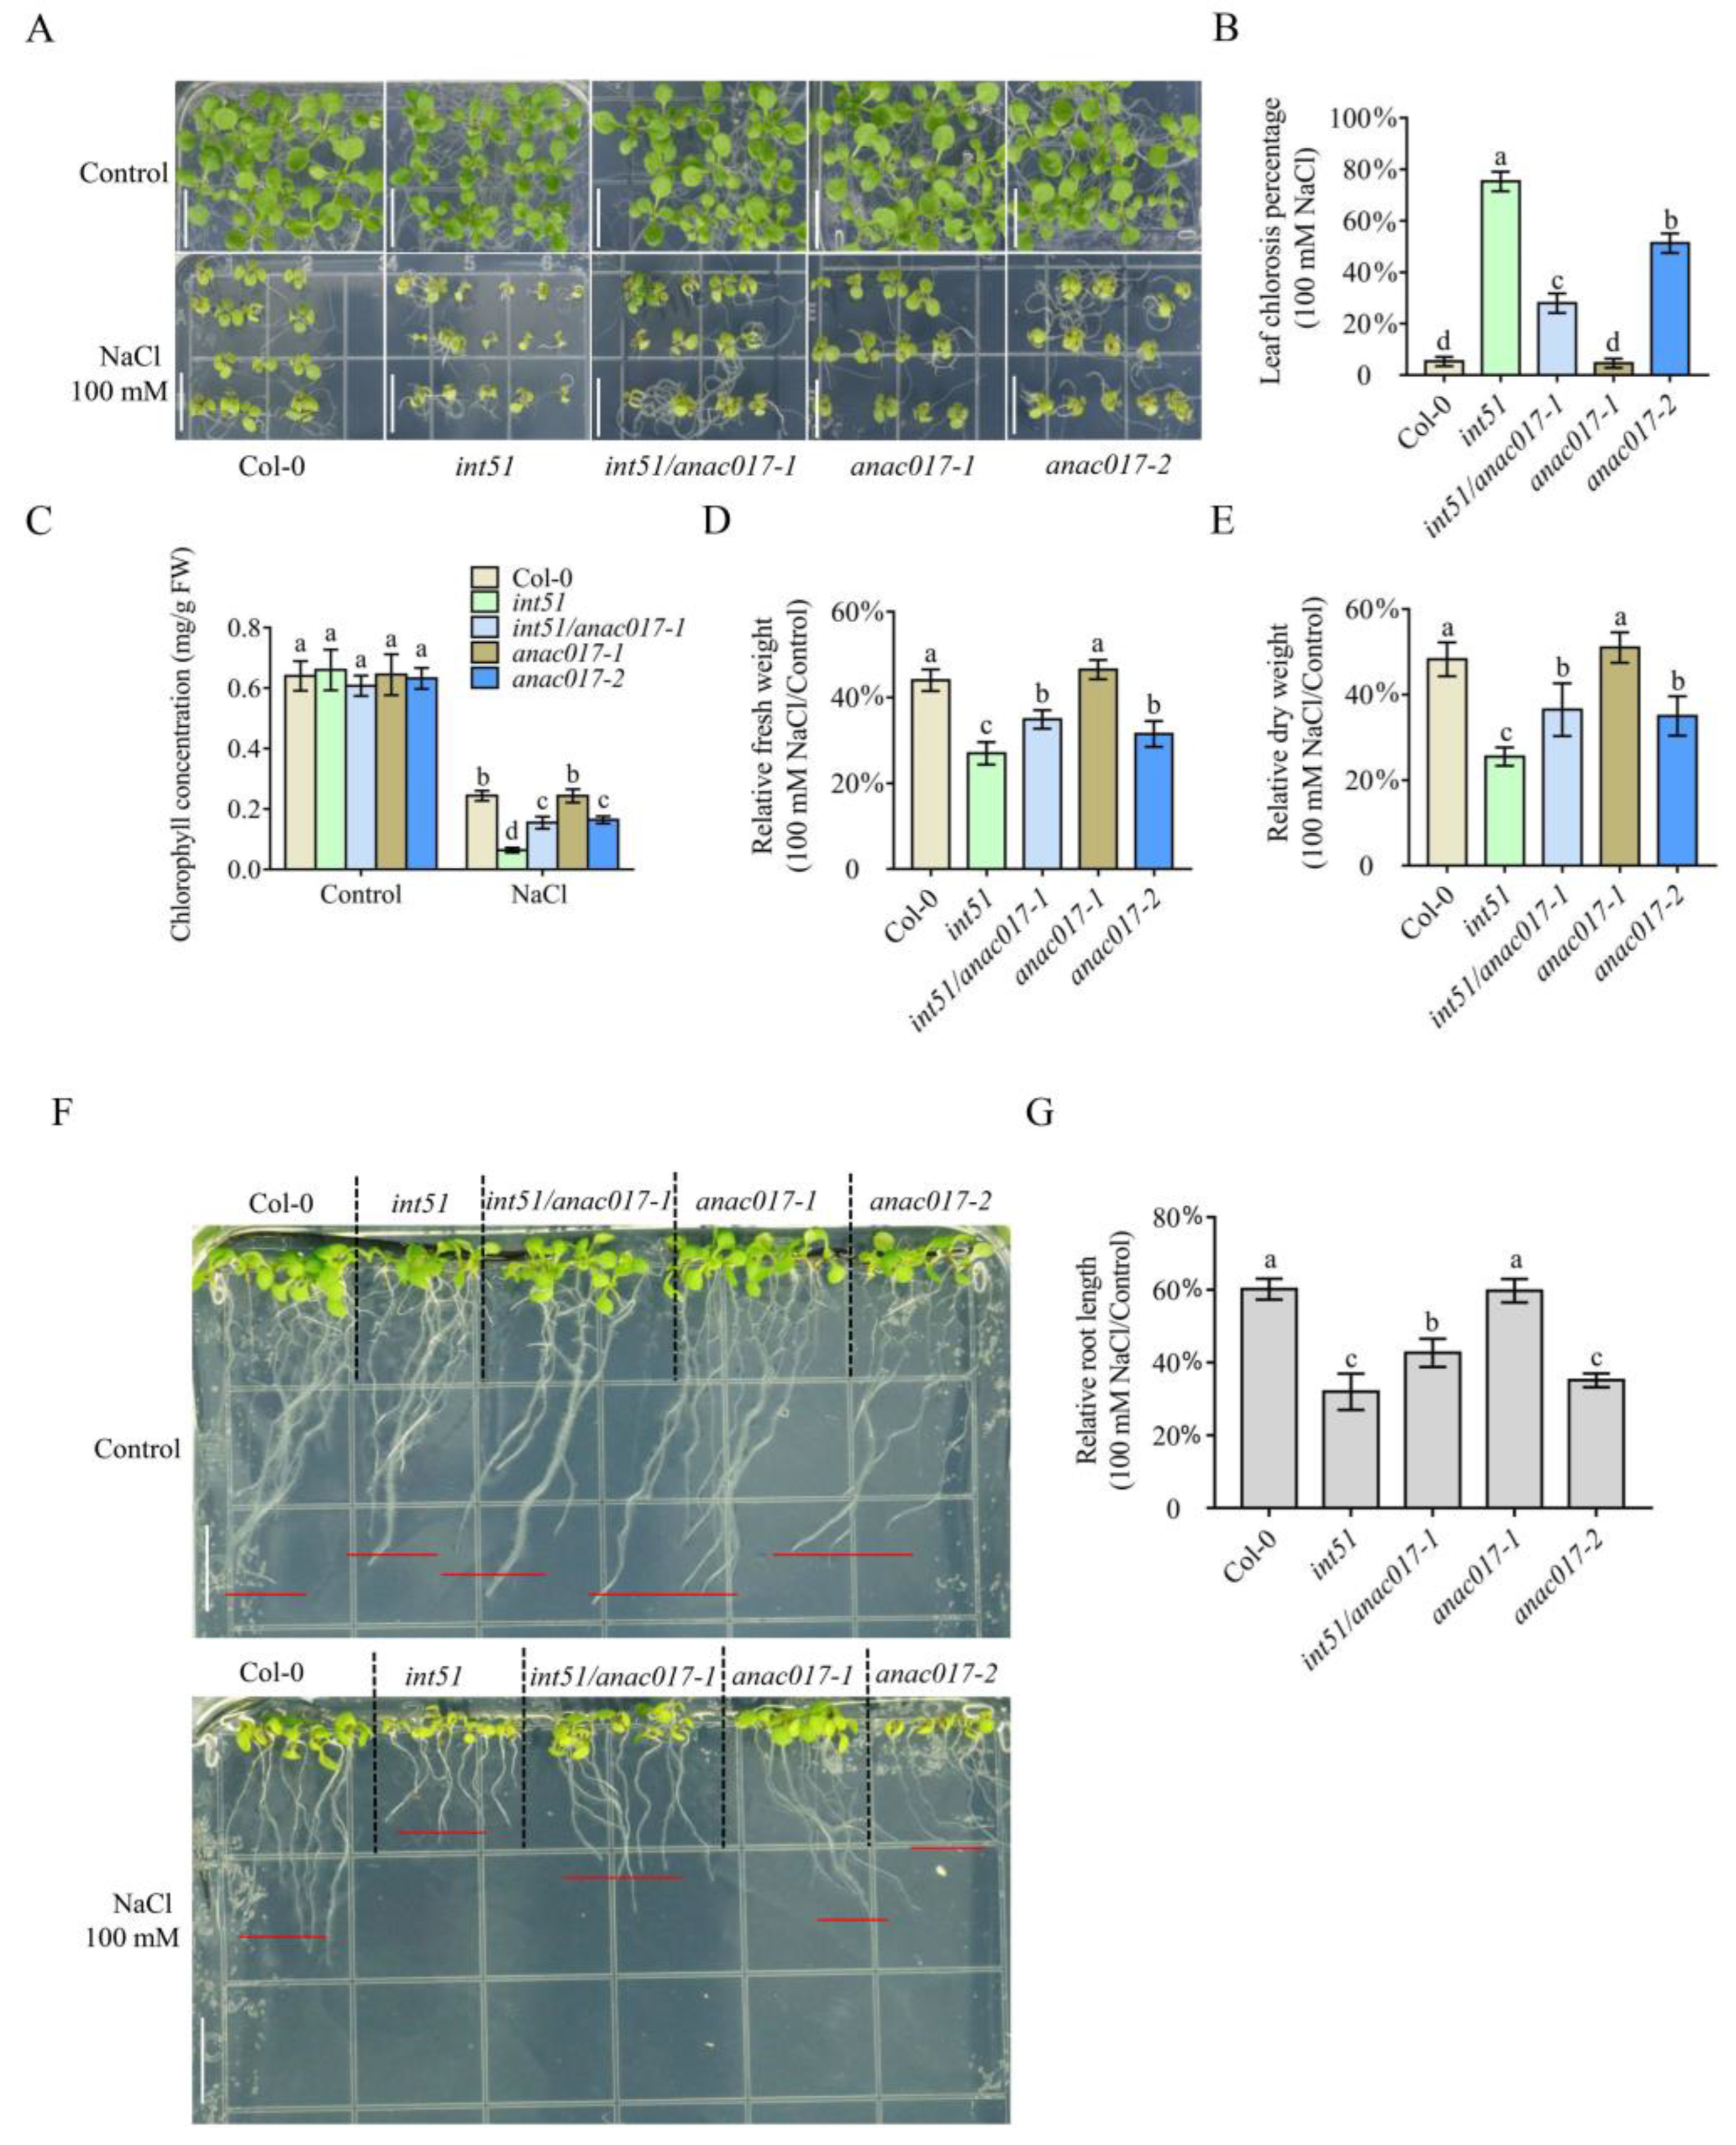
2.1. ANAC017 Participates in RCD1-Mediated Salt Stress Response

A previous study revealed that RCD1 coordinates chloroplast and mitochondrial retrograde signaling through ANAC017, and the leaf phenotypes of rcd1 were mostly rescued in the rcd1/anac017 double mutant [15], suggesting that ANAC017 integrates RCD1-regulated retrograde signaling and plant growth and development pathways. To determine whether ANAC017 also plays a pivotal role in RCD1-mediated salt stress response, wild type (WT) Col-0 and four mutants, including int51 (a mutant in RCD1), anac017-1 (a loss-of-function mutant), int51/anac017-1, and anac017-2 (a gain-of-function mutant lacking the TM motif), were treated with high salinity. As compared with the corresponding plants grown under normal conditions, the fresh weights of Col-0 and anac017-1 did not change under 80 mM salt, but the fresh weight and dry weight of int51 were significantly decreased under 80 mM salt (Figure S1), which was consistent with the previous report that an rcd1 mutant was more sensitive to salt treatment than WT [9]. Similarly, the fresh weight and dry weight of anac017-2 were also greatly reduced (Figure S1). Notably, the fresh weights and dry weights of the int51/anac017-1 double mutant were comparable between normal conditions and 80 mM salt stress (Figure S1), indicating that ANAC017 may act downstream of RCD1 in salt stress response. Next, we performed treatments with 100 mM salt. The int51 mutant exhibited significantly increased leaf chlorosis percentage, meanwhile substantially reduced plant size and chlorophyll content, as well as relatively decreased fresh weight and dry weight, and short root length, under salt treatment as compared to WT (Figure 1), suggesting its higher sensitivity to salt than WT. Consistently, anac017-2 also showed higher sensitivity to salt stress in comparison to WT, as indicated by the remarkably increased leaf chlorosis percentage and reduced plant size, chlorophyll content, decreased fresh weight and dry weight, and short root length (Figure 1). Both the anac017-1 single mutant and the int51/anac017-1 double mutant displayed comparable plant size to WT under the salt condition, but the increased leaf chlorosis percentage and the reduced chlorophyll content, decreased fresh weight and dry weight, and short root length in int51 were only partially rescued in the int51/anac017-1 double mutant (Figure 1B–E,G). These genetic observations implied that ANAC017 acted downstream of RCD1 to play a negative role in regulating salt stress response.

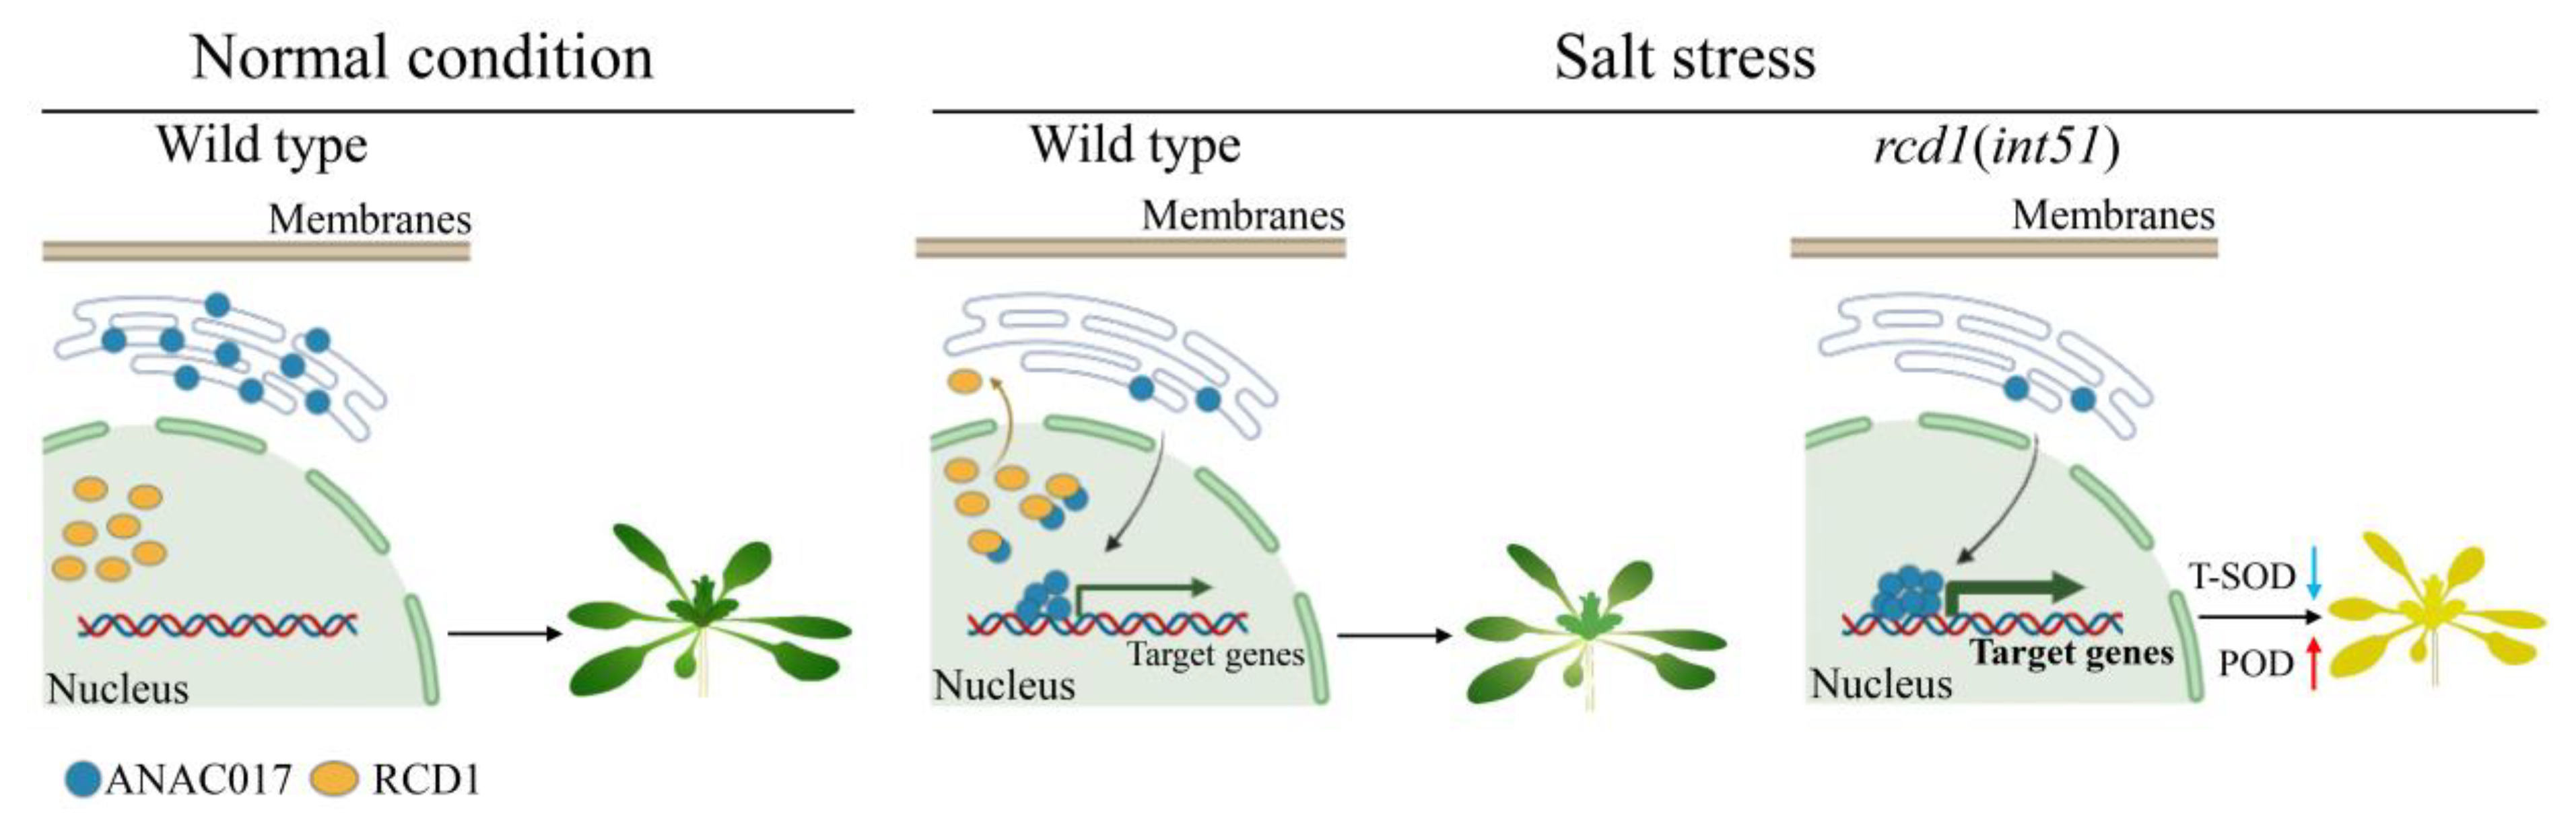
2.2. ANAC017 Translocates from the ER to the Nucleus in Response to Salt Stress

ANAC017 translocates from the ER to the nucleus to activate the expression of MDS genes in retrograde signaling, as evidenced by AA treatment of onion cells [17]. To examine whether high salinity triggers the translocation of ANAC017, we fused the green fluorescent protein (GFP) to the N-terminus of ANAC017 and observed the subcellular localization of GFP-ANAC017 with or without salt treatment. The C-terminal GFP-fused RCD1 (RCD1-GFP) served as a control for nuclear localization. The results showed that transiently expressed GFP-ANAC017 and RCD1-GFP in Arabidopsis protoplasts without treatment were colocalized with the ER marker and the nuclear marker, respectively (Figure 2, Supplemental Figure S2A,B). To better observe the subcellular locations of ANAC017, we next transiently expressed GFP-ANAC017 in Nicotiana benthamiana leaves. As expected, GFP-ANAC017 originally localized to the ER and encircled the nucleus and subsequently relocated to the nucleus when leaves were subjected to AA treatment (Figure 2A), which was consistent with observations in onion epidermal cells [17]. Similar results were observed upon salt stress treatment—a portion of GFP-ANAC017 signals was enriched in the nucleus and colocalized with the nucleus marker (Figure 2A). Likewise, we generated and obtained several stable transgenic plants harboring fused GFP-ANAC017 protein and found GFP-ANAC017 signal was enriched substantially in the nuclei of root cells under salt stress treatment (Figure 2B). These results demonstrated that ANAC017 was released from the ER to enter the nucleus in response to salt stress.

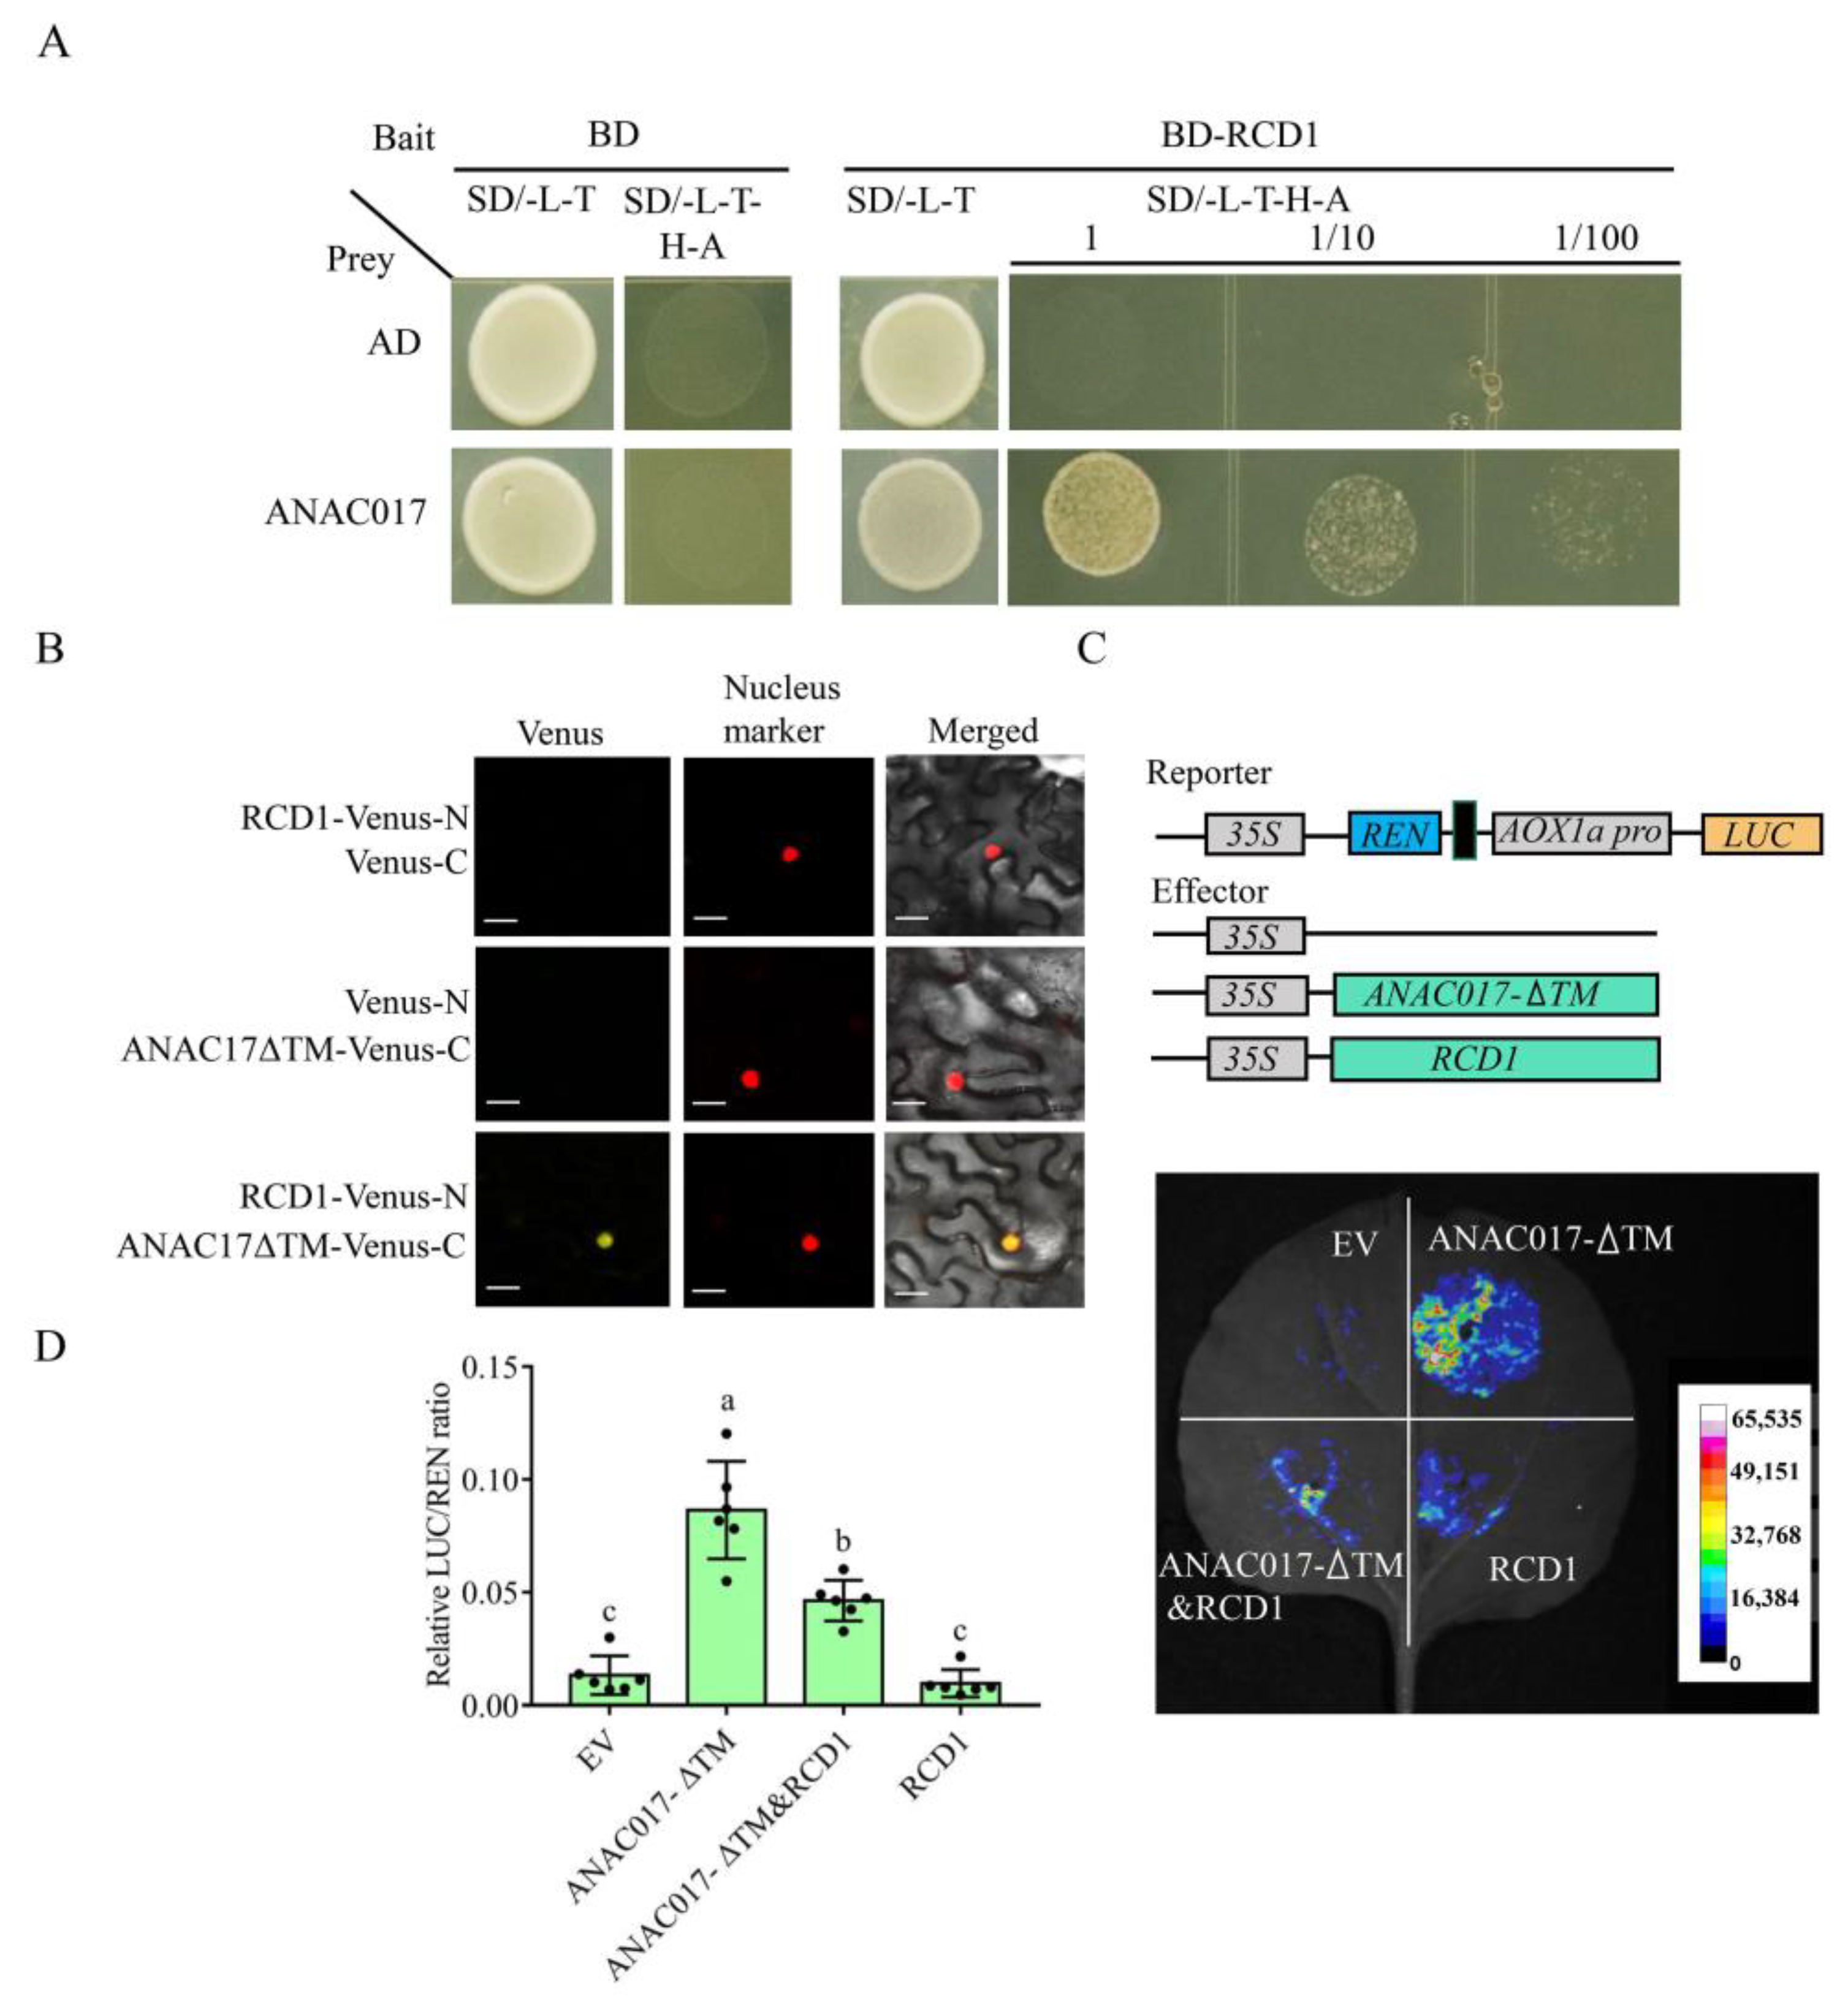
2.3. Transcriptional Activity of ANAC017 Is Inhibited by RCD1 in the Nucleus

ANAC017 and RCD1 were reported to interact with each other. However, these two proteins existed in different subcellular locations unless some stresses were imposed. Since ANAC017 is a TF, we speculate that the interaction between RCD1 and ANAC017 takes place in the nucleus. To test this, we first performed the yeast two-hybrid assay, the result showed that RCD1 could interact with ANAC017 in the yeast system (Figure 3A). We also conducted the bimolecular fluorescence complementation (BiFC) experiment with a truncated ANAC017 protein lacking the TM (mimicking anac017-2, referred to as ANAC017-ΔTM) fused with the C-terminus of the Venus fluorescent protein and RCD1 tagged with the N-terminus of Venus. When these two proteins were co-expressed in N. benthamiana leaves, the Venus signal was present and colocalized with the nuclear marker (Figure 3B). These results indicated that the two proteins interacted in the nucleus. Next, we investigated the effect of RCD1 on the transcriptional activity of ANAC017 using the Luciferase (LUC) reporter system and transient expression in N. benthamiana leaves. The effectors were 35S::ANAC017-ΔTM and 35S::RCD1, and the reporter was LUC driven by the AOX1a promoter (Figure 3B). The results showed that ANAC017-ΔTM was capable of activating LUC driven by the AOX1a promoter, whereas the activity of ANAC017-ΔTM was markedly reduced when RCD1 was present (Figure 3C,D). These results demonstrated that RCD1 interacted with ANAC017 and inhibited its activity.
To examine the genome-wide repression of ANAC017 activity by RCD1, we performed RNA-seq analysis with 14-day-old seedlings of WT and the int51, int51/anac017-1, and anac017-2 mutants. Differentially expressed genes (DEG) in each mutant were determined with the criteria |log2(fold-change)| > 1 and p-value < 0.05 when compared with Col-0. In the int51 mutant, 743 genes were up-regulated, and 649 genes were down-regulated (Figure 4A), while in the int51/anac017-1 double mutant, 327 up-regulated and 346 down-regulated genes were identified (Figure 4B). Further analysis revealed that 282 of the 743 genes showed significantly decreased expression with the criteria |log2(fold-change)| > 1 and p-value < 0.05 in int51/anac017-1 vs. int51, indicating that ANAC017 was responsible for the upregulation of the 282 genes in the rcd1 mutant (Figure 4C, Supplemental Data Set S1). To explore the potential direct targets of ANAC017, we searched for the mitochondrial dysfunction motif (MDM) (CTTGNNNNNCA[A/C]G), which was reported to be the ANAC017 binding site [17,30], within the promoters (2 kb upstream of transcription start site) and 5′ untranslated regions of the 282 genes, and identified 82 candidate genes that could be regulated by RCD1-ANAC017 directly, including the retrograde signaling reporter genes AOX1a and UGT74E2 (Supplemental Figure S3, Supplemental Data Set S2) [17]. In the gain-of-function anac017-2 mutant, there were 479 up-regulated and 721 down-regulated genes (Figure 4D). Overlap analysis revealed that 95 up-regulated genes and 69 down-regulated genes were affected in both int51 and anac017-2 (Figure 4E,F). The expression levels of the 69 genes in int51 and anac017-2 were comparable, whereas the expression levels of the 95 genes in anac017-2 were a little bit lower than those in int51 (Figure 4G,H), presumably due to the presence of RCD1, which still repressed ANAC017 activity in anac017-2. Taken together, these results suggested that RCD1 interacted with ANAC017 in the nucleus and repressed the transcriptional activity of ANAC017.

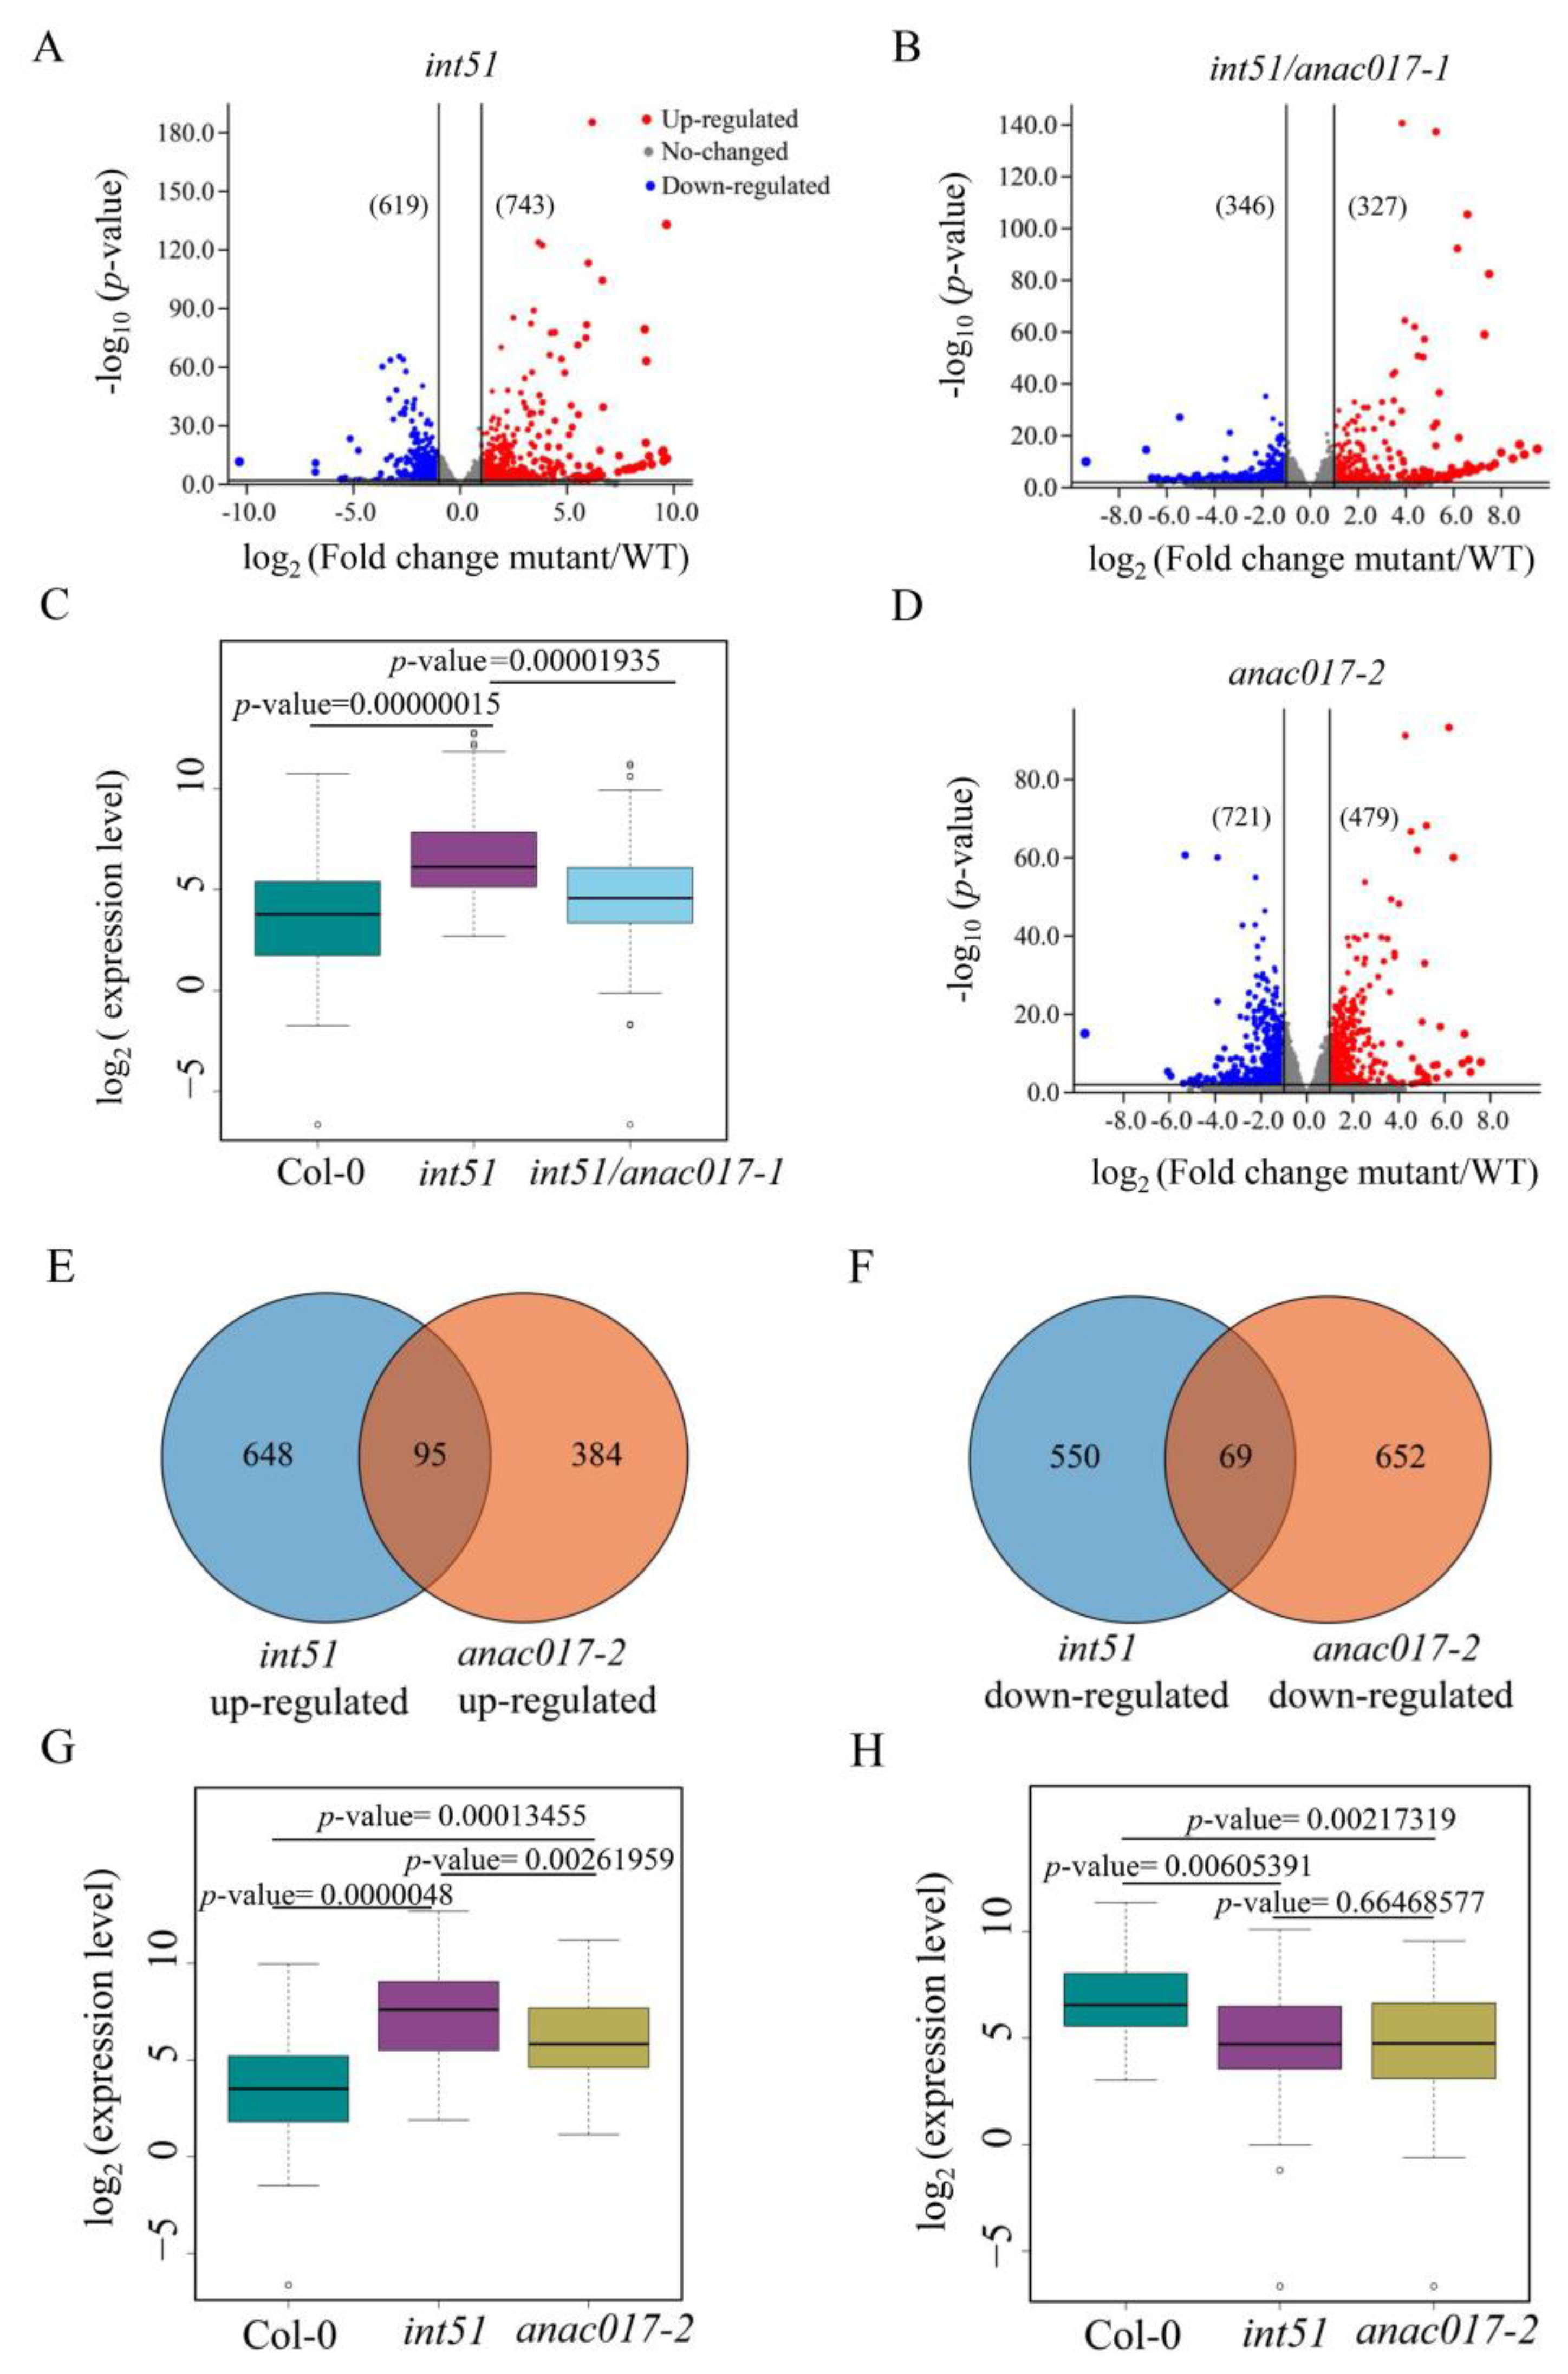
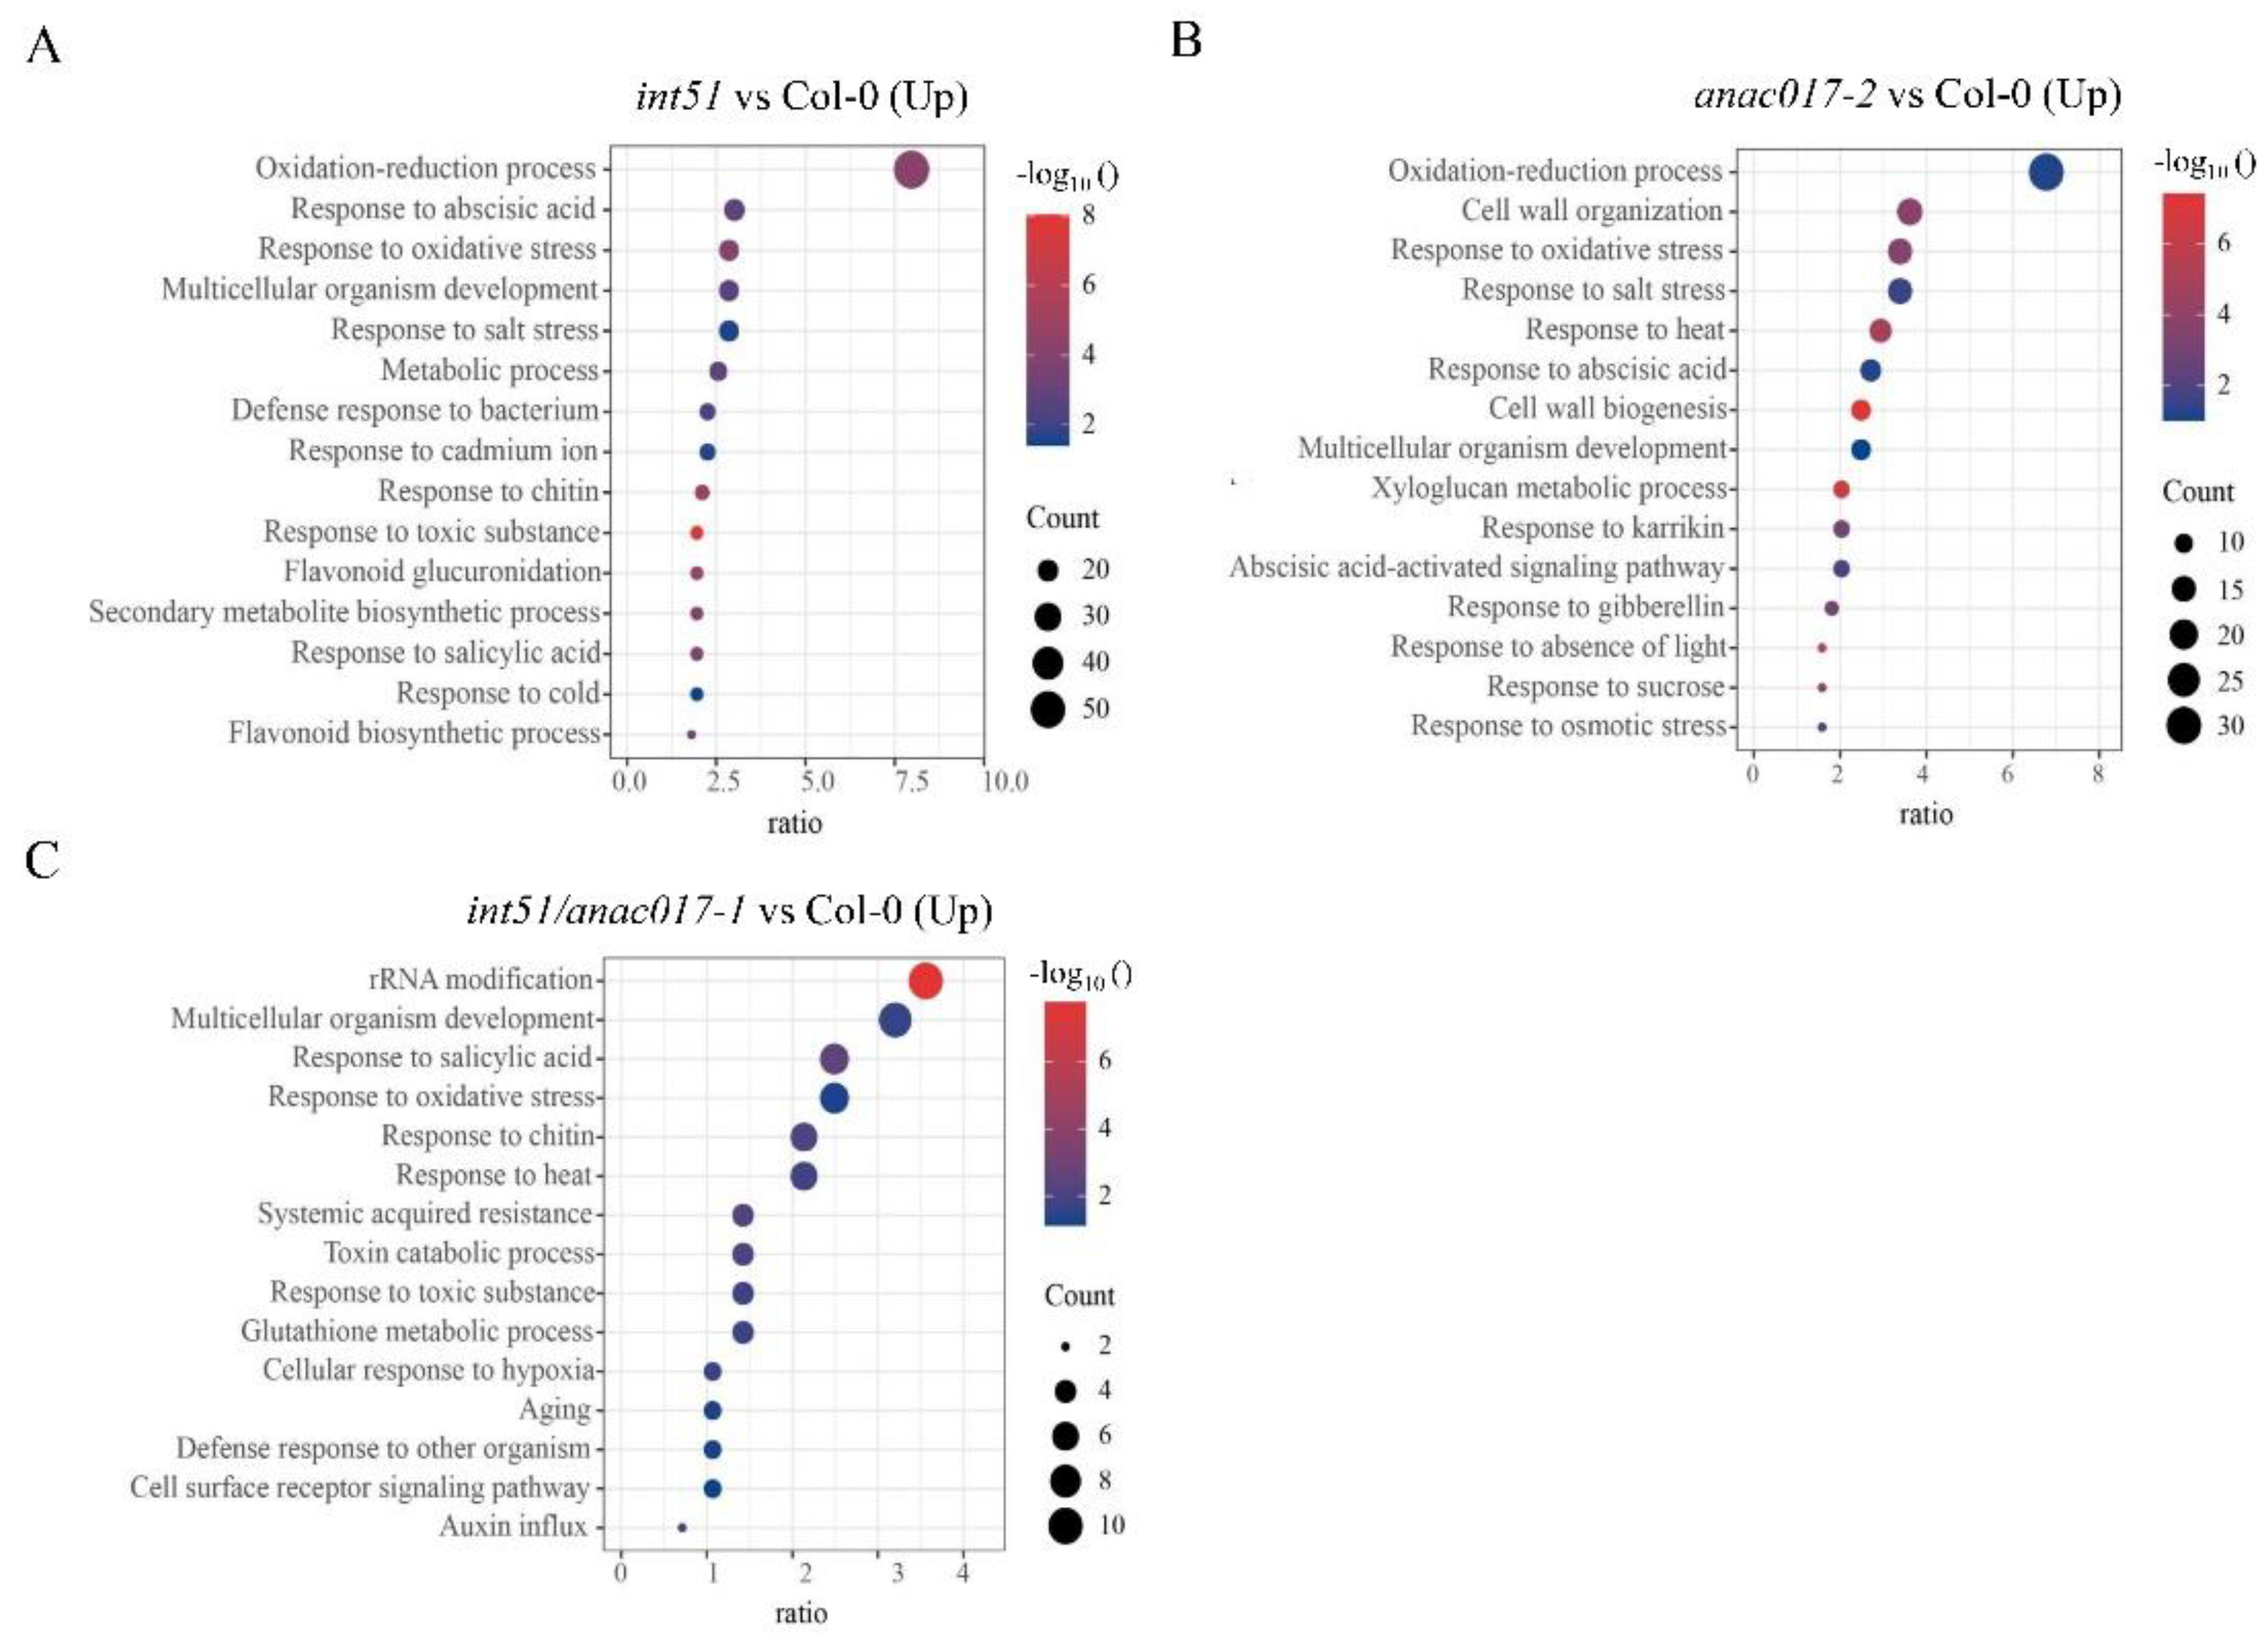
2.4. Targets of ANAC017-RCD1 Are Involved in the Oxidation-Reduction Process and Salt Stress Response

To investigate the downstream genes associated with salt stress response, we performed Gene Ontology (GO) enrichment analysis, with a focus on int51 and anac017-2 mutants. For up-regulated DEGs in int51 and anac017-2, we found GO terms associated with the oxidation-reduction process and response to salt stress (Figure 5A,B). Notably, both the “oxidation-reduction process” and “response to salt stress” GO terms disappeared in the up-regulated DEGs in the int51/anac017-1 double mutant (Figure 5C). Similarly, GO terms associated with either oxidation-reduction process or response to salt stress were not enriched in the up-regulated DEGs in anac017-1 (Supplemental Figure S4A). These results suggested that ANAC017 promoted the expression of genes involved in salt stress responses and was responsible for the up-regulation of salt-stress-responsive genes in the int51 mutant.
Among the up-regulated genes in int51, we noticed 13 genes belonging to the ANAC family. ANAC013 was reported as a functional homolog of ANAC017 [16]. The normalized transcript level of ANAC013 was elevated by more than 10-fold in int51 compared to Col-0 and was markedly reduced in the int51/anac017-1 double mutant when compared with int51 (Supplemental Figure S4B), indicating that the up-regulation of ANAC013 in int51 was mostly dependent on ANAC017. In addition, other ANAC genes, such as ANAC03, ANAC010, ANAC042, ANAC044, ANAC047, ANAC048, ANAC074, ANAC083, ANAC085, ANAC087, and ANAC103 were also up-regulated in int51 compared to Col-0, while the extent of the up-regulation was reduced in int51/anac017-1 except for ANAC016, ANAC044, and ANAC103 (Supplemental Figure S4B). However, no significant difference was found for the transcript abundance of ANAC017 between int51 and Col-0, suggesting that RCD1 regulated the expression of ANAC017 post-transcriptionally or the activity of ANAC017 at the protein level. These results indicated that ANAC017 possibly regulates salt stress response by triggering the expression of other ANAC genes, which further strengthened the function of ANAC017 as a master regulator.

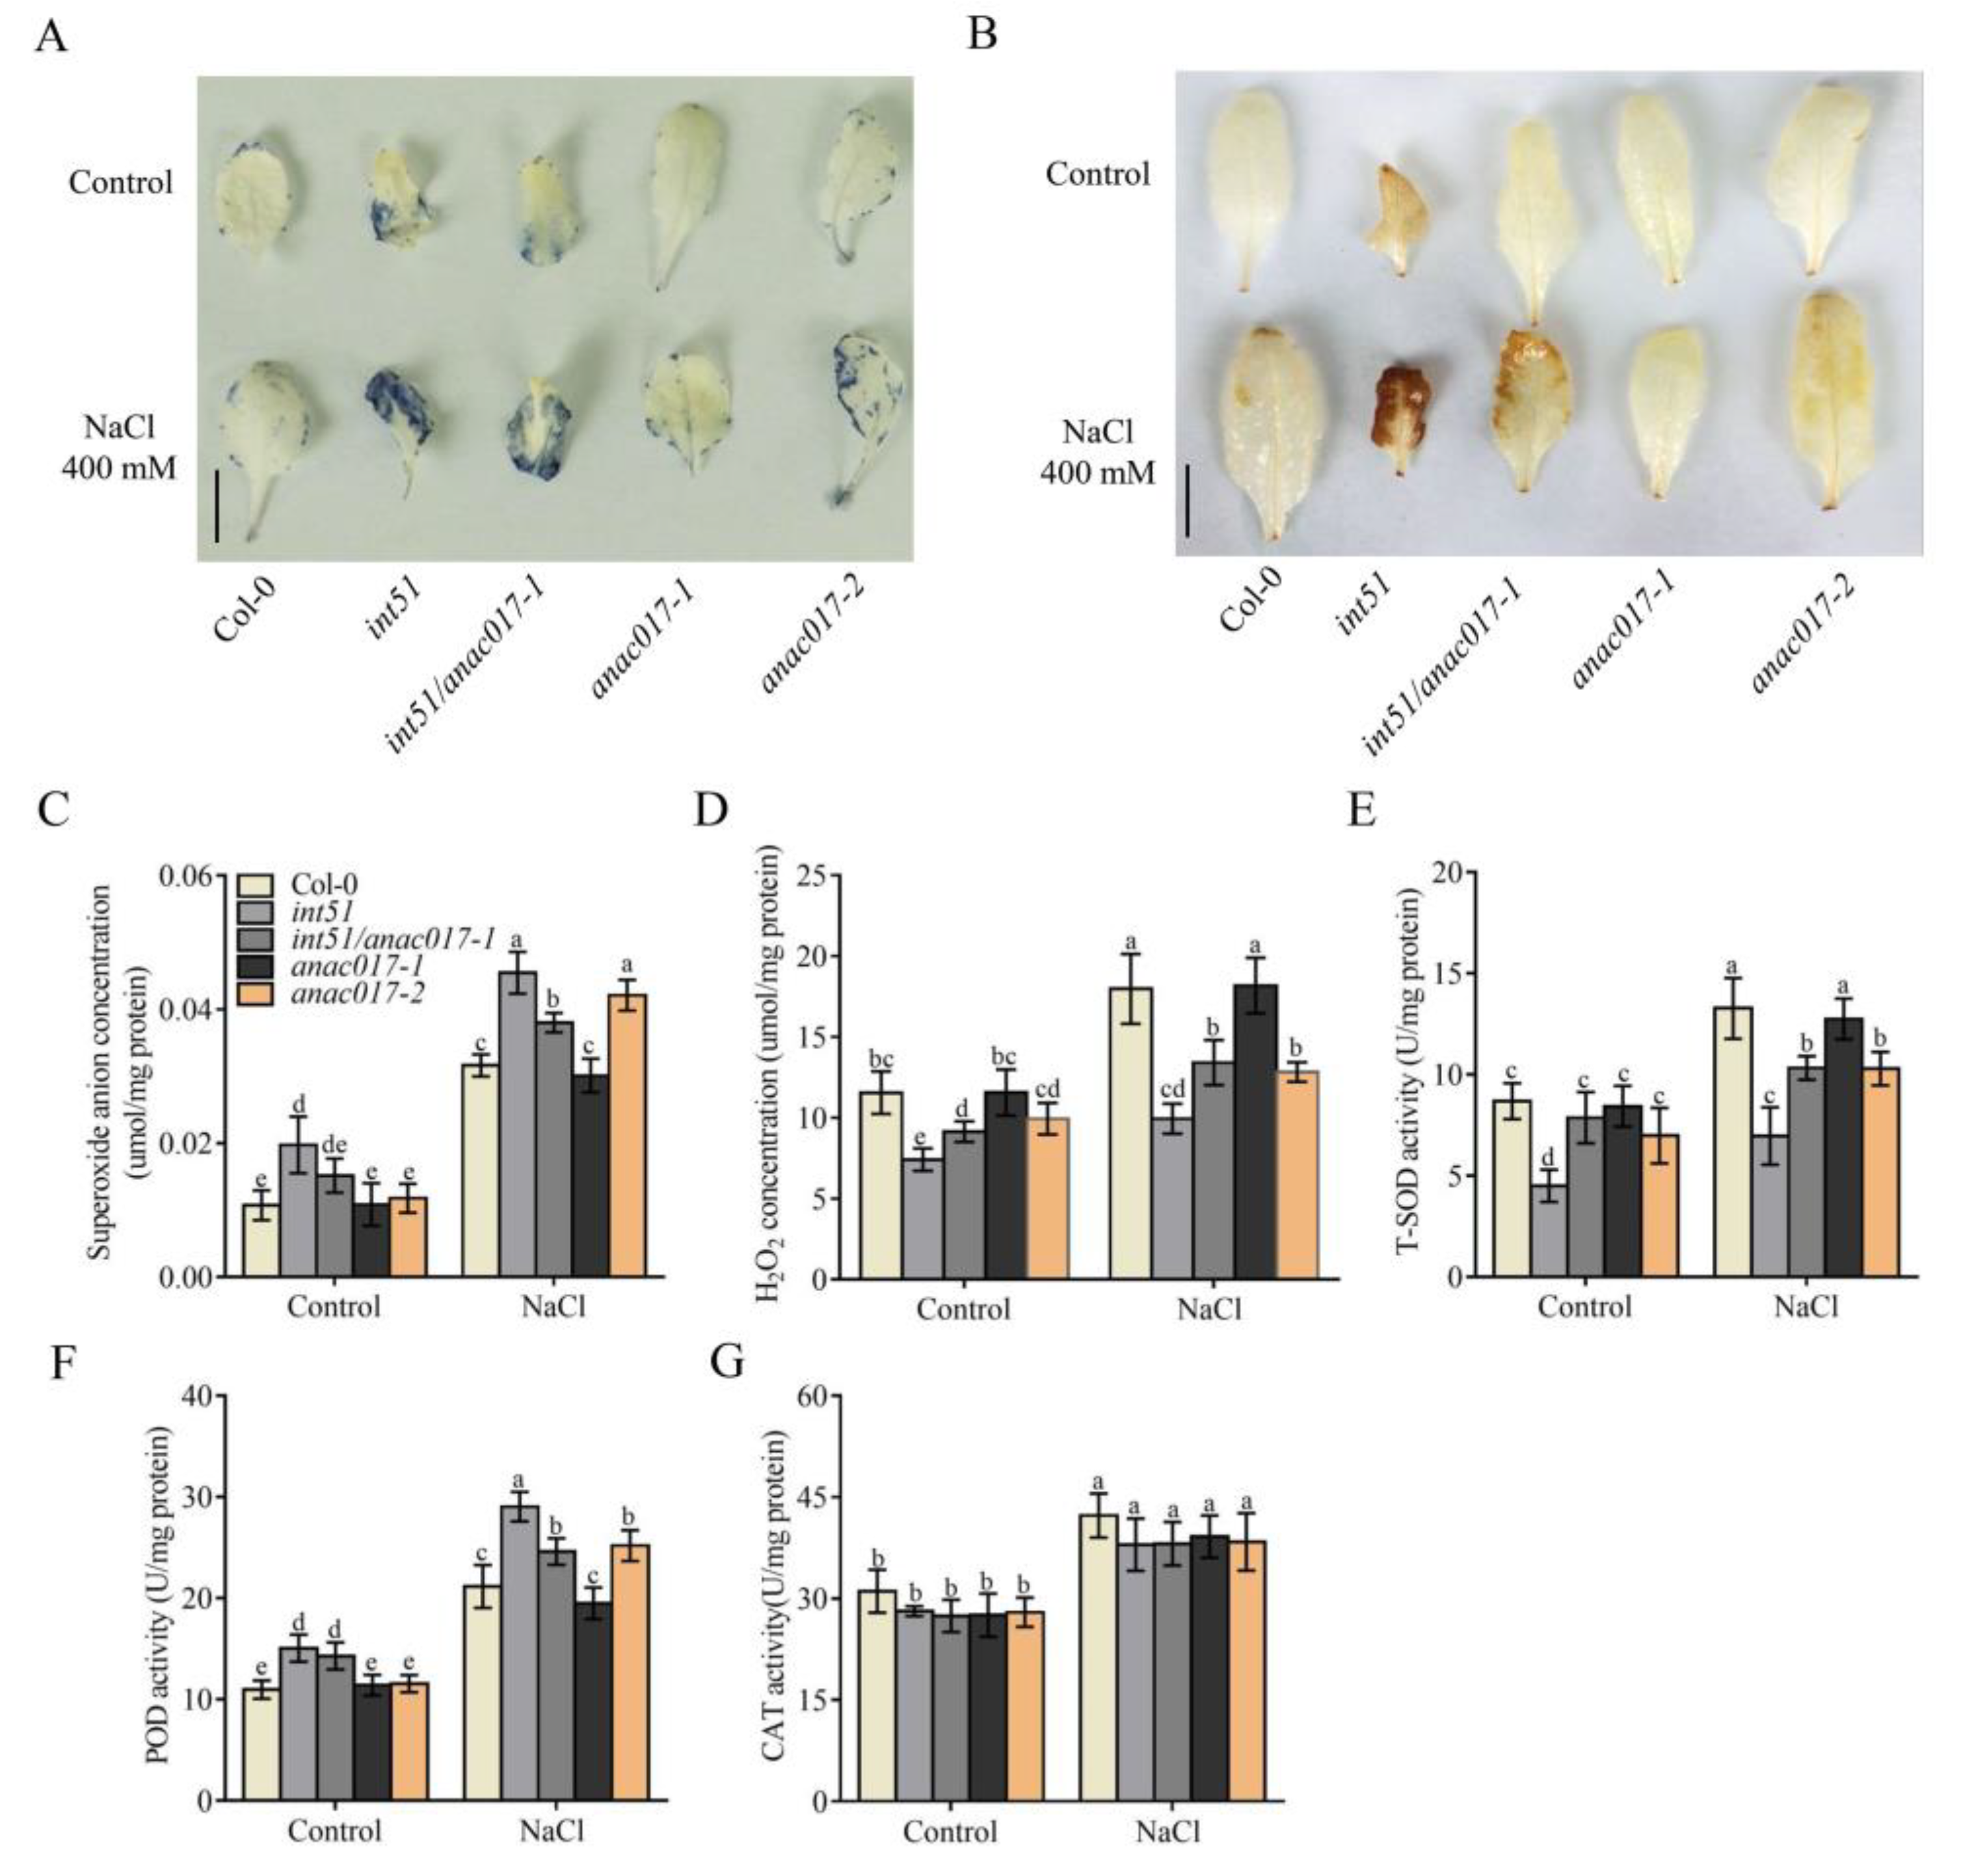
2.5. ANAC017 Acts Downstream of RCD1 to Disrupt ROS Homeostasis through Affecting ROS Scavenging Enzyme Activities

High salinity triggers the production of ROS, resulting in oxidative stress in plants [31,32]. According to the GO enrichment analysis, we speculated that ROS homeostasis was disrupted in int51 and anac017-2 mutants. To understand the hypersensitivity of int51 and anac017-2 to salt stress, we detected the accumulation of ROS (O2•− and H2O2) and the activities of ROS-related enzymes (total SOD dismutase, POD, and CAT) in each genotype with or without salt stress treatment. Nitro blue tetrazolium (NBT) staining showed that O2•− accumulated at a higher level in the leaves of int51 than that of Col-0 under both normal and salt stress conditions (Figure 6A), which was in agreement with previous reports [33,34]. Under salt stress, the accumulation of O2•− in the leaves of int51/anac017-1 was also higher than that of Col-0 but lower than that of int51 (Figure 6A). Notably, the production of O2•− in the leaves of anac017-2 was substantially increased as compared to Col-0, although there was no change under normal conditions (Figure 6A). The O2•− level in the leaves of anac017-1 was similar to that of Col-0 under both conditions. These results were further confirmed by quantitative measurements of O2•− (Figure 6C).
DAB (3,3′-Diaminobenzidine) staining was performed to measure the accumulation of H2O2. The results were similar to those of NBT staining in that the int51 mutant leaves showed more stains than wild type under both normal and salt stress conditions, and stronger stains were partially rescued by the anac017-1 mutation (Figure 6B). However, quantitative measurements of H2O2 in these mutants gave results contradictory to those of DAB staining (Figure 6D). H2O2 accumulation in the leaves of int51, int51/anac017-1, and anac017-2 was significantly reduced compared to Col-0 under both conditions, except for anac017-2 under normal conditions. Although the H2O2 levels in leaves of anac017-1 were comparable to Col-0 with or without salt stress, those of int51/anac017-1 were higher than int51 under both conditions. In DAB staining, the brown color represents the oxidized form of DAB, which is attributed to two factors: H2O2 and peroxidase. In our RNA-seq, several genes of the peroxidase superfamily showed increased expression levels in these mutants compared to Col-0. Specifically, the transcript levels of 6 genes, including PRXCB (PEROXIDASE CB), DOX1 (DIOXYGENASE 1), PRX52 (PEROXIDASE 52), AT5G58400, AT5G58390, and AT2G43480, were increased in int51. In int51/anac017-1, DOX1, AT5G58400, and AT2G43480 showed elevated expression levels. In anac017-2, the transcript levels of AT4G37530 and AT5G39580 were increased (Supplemental Figure S5A). These results were in line with quantitative measurements of POD activity under the normal condition except for anac017-2 (Figure 6G). After salt stress treatment, POD activity was significantly enhanced in int51, int51/anac017-1, and anac017-2 in comparison to Col-0. Thus, the POD activities of the various genotypes matched the DAB staining well under the salt stress condition.
Because of the inverse accumulation of O2•− and H2O2 in the mutants, we examined the enzymatic activity of SOD, which converts O2•− into H2O2 [27,35]. As expected, total SOD (T-SOD) activity in leaves decreased in int51 under the normal condition and markedly decreased in int51, int51/anac017-1, and anac017-2 under salt stress as compared to Col-0 (Figure 6E). However, the transcript levels of all eight SOD genes were not significantly different in the mutants and Col-0 (Supplemental Figure S5B), implying that ANAC017 regulated SOD enzyme activity at the post-transcriptional level. In contrast, CAT activity, which converts H2O2 to H2O, did not show any difference between the mutants and Col-0 under both conditions (Figure 6F). Collectively, these results indicated that ANAC017 acted downstream of RCD1 to mediate ROS homeostasis, mainly by affecting the activities of T-SOD and POD.

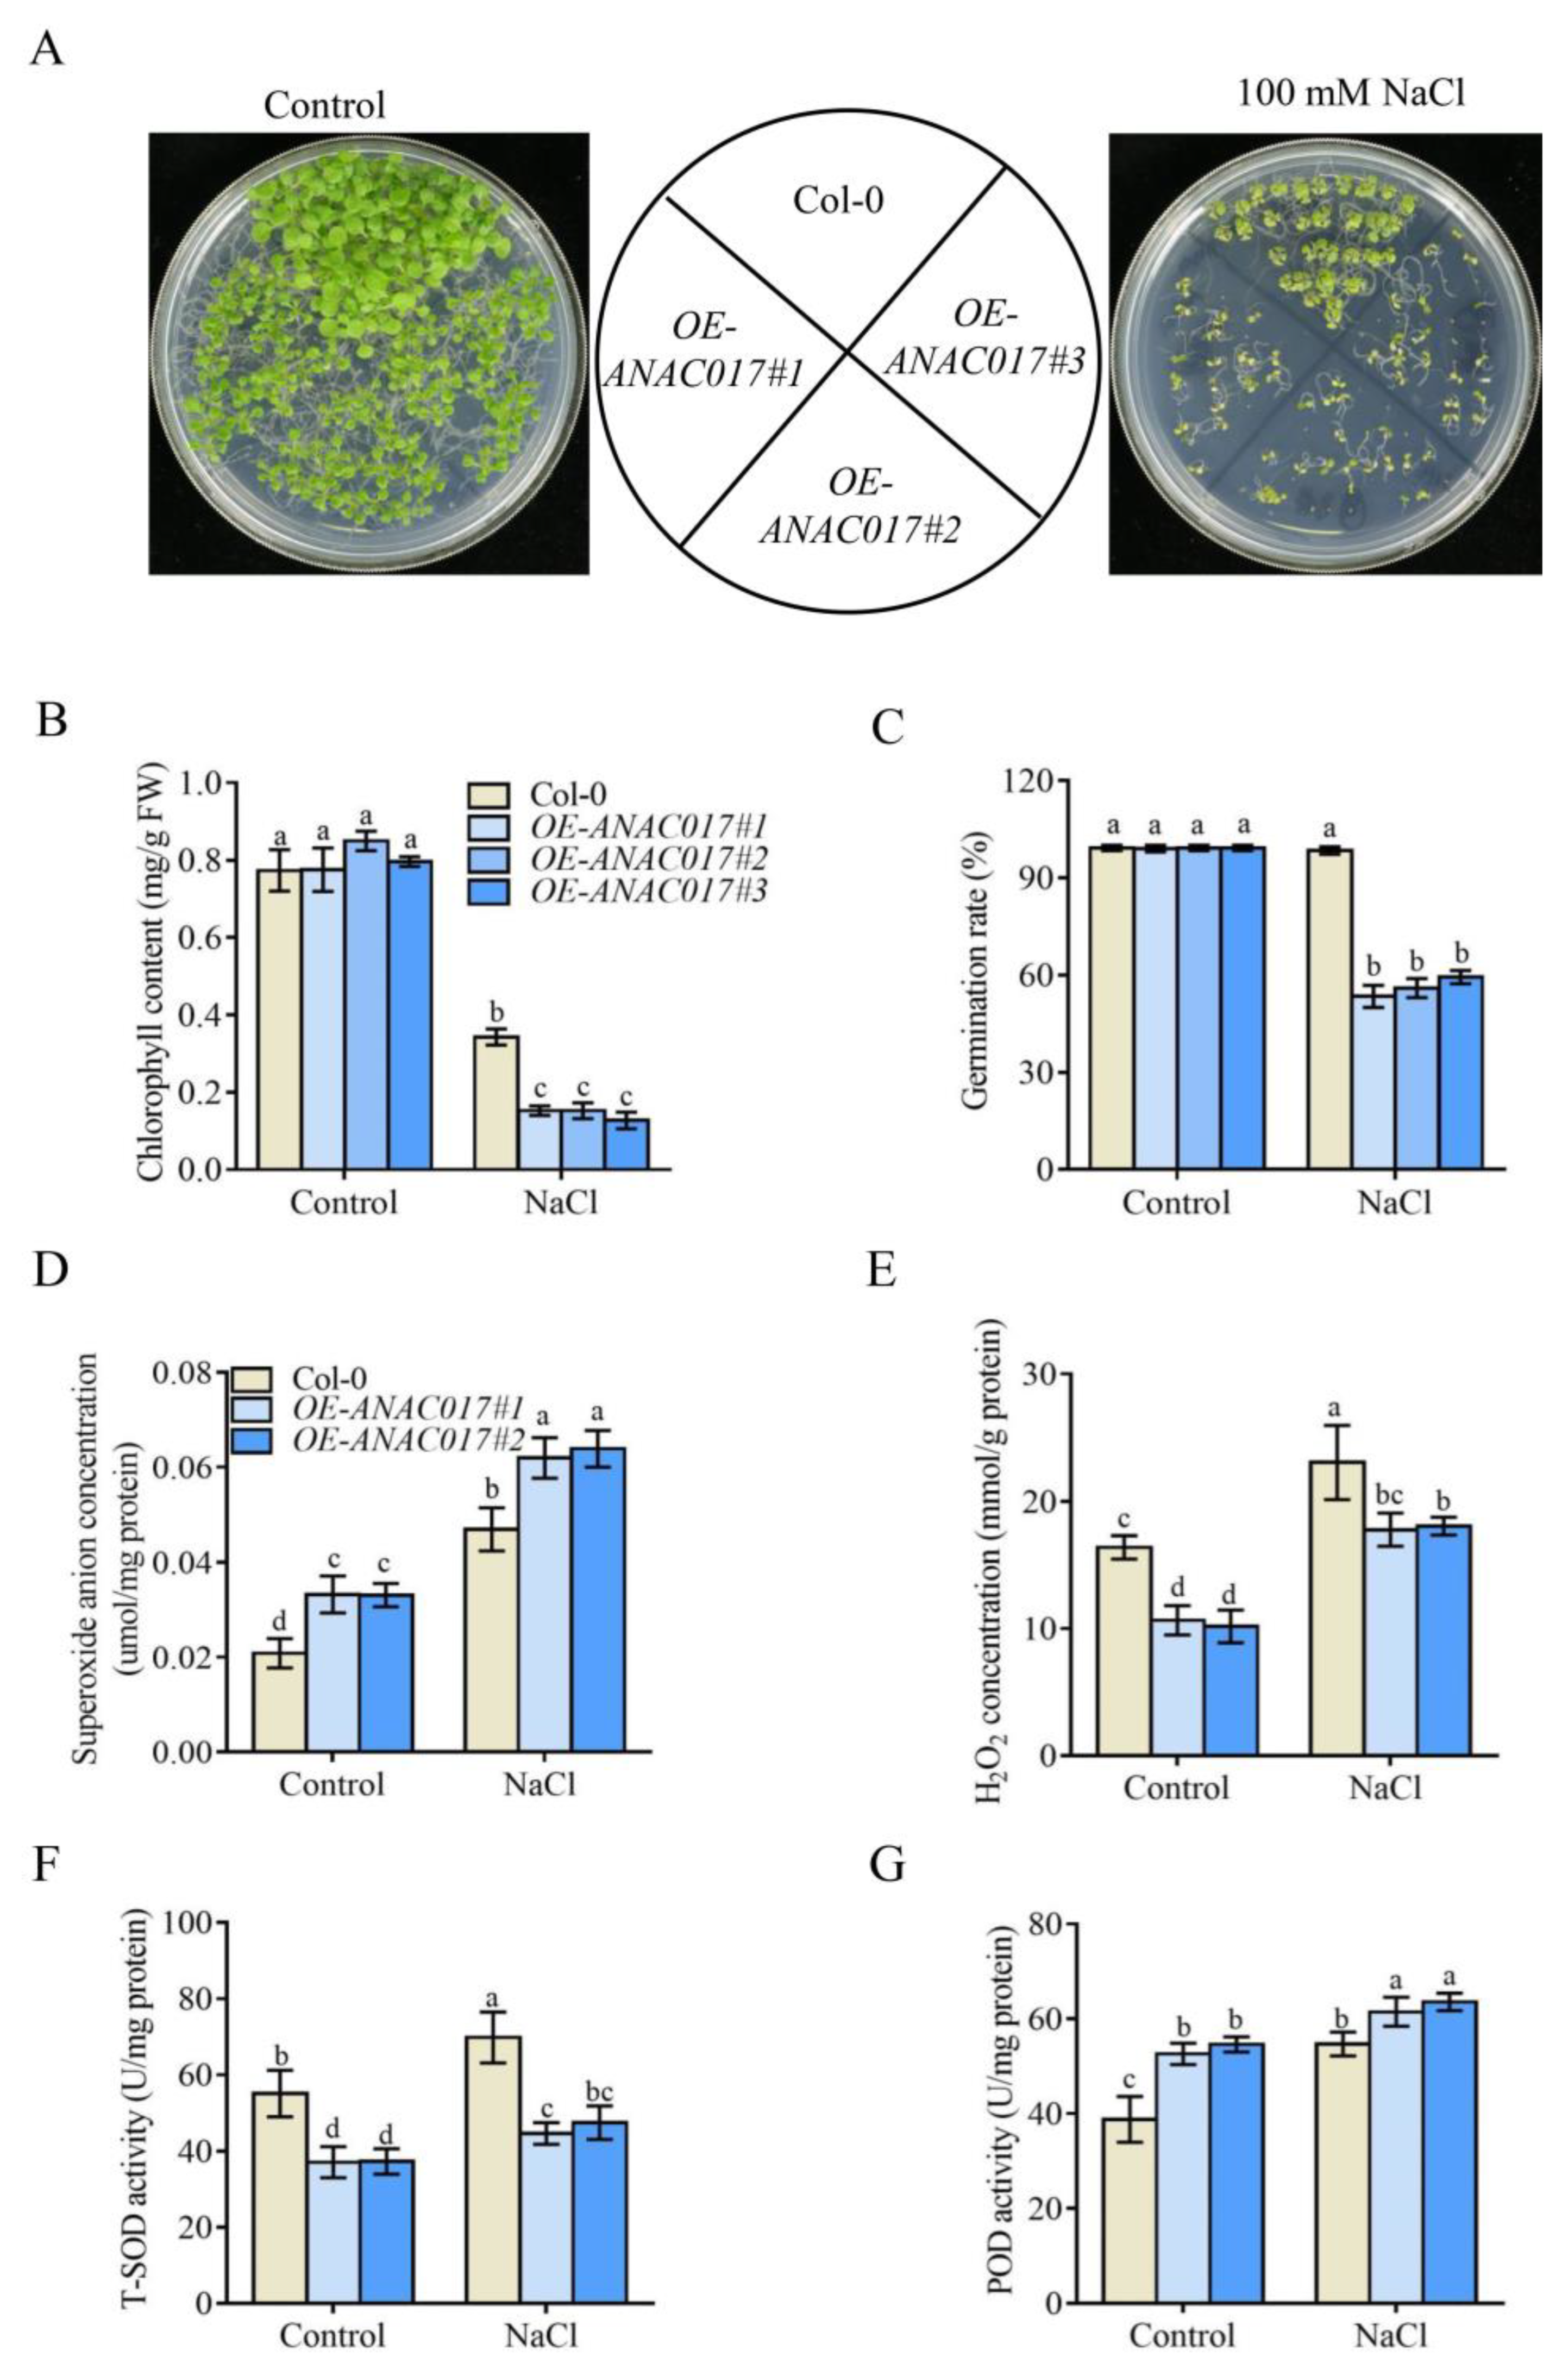
2.6. ANAC017 Overexpression Transgenic Plants Are Hypersensitive to Salt Stress

To further confirm the role of ANAC017 in salt stress response, we generated three independent transgenic lines overexpressing ANAC017 (OE-ANAC017) in Col-0. The small, curled leaf and retarded growth phenotypes of these lines were consistent with previous reports (Figure 7A) [19,36]. The seed germination rate and chlorophyll content in OE-ANAC017 lines were severely reduced compared to Col-0 under salt stress (Figure 7A–C). Similar to the int51 mutant, the levels of O2•− were increased, and those of H2O2 were reduced in two OE-ANAC017 lines compared to Col-0 under both normal and salt stress conditions (Figure 7D,E). In contrast to T-SOD activity, which decreased in both OE-ANAC017 lines, POD activity was increased (Figure 7F,G). Therefore, we conclude that ANAC017 plays a negative role in salt stress response by impairing the activities of antioxidant enzymes.

3. Discussion

3.1. RCD1 Positively Regulates Salt Stress Response by Repressing ANAC017 Transcriptional Activity

ANAC017 is an ER membrane-bound TF that is released by a rhomboid protease upon AA treatment to act in retrograde signaling in the nucleus [17]. In our study, a previously unknown function of ANAC017 in regulating salt stress response is uncovered (Figure 8). The loss-of-function anac017-1 allele suppresses the salt hypersensitivity of an rcd1 mutant, while the gain-of-function anac017-2 mutant and ANAC017 overexpression lines exhibit hypersensitivity to salt stress (Figure 1 and Figure 7A–C, Supplemental Figure S1), indicating that ANAC017 acts downstream of RCD1 and plays a negative role in salt tolerance.
RCD1 associates with multiple TFs, which may account for its pleiotropic functions in plants, and the interaction between RCD1 and ANAC017 was established by pull-down assays [10,11,15], although these two proteins are located in the nucleus and ER membrane, respectively, under unstressed condition. Similar to AA treatment, salt stress induces the cytoplasm-to-nucleus translocation of ANAC017 (Figure 2A,B), which is mimicked by the truncated ANAC017-ΔTM, and the interaction between RCD1 and ANAC017-ΔTM is observed in BiFC assays (Figure 3B). In Chrysanthemum, CmRCD1 is reported to physically interact with B-BOX DOMAIN PROTEIN 8 (CmBBX8) and reduce CmBBX8′s ability to bind the promoter of FLOWERING LOCUS T-LIKE 1 (CmFTL1) [37]. Likewise, ANAC017-ΔTM activates the expression of AOX1a, while RCD1 markedly reduces the transcriptional activity via its interaction with ANAC017-ΔTM in the nucleus (Figure 3C,D). Consistently, our RNA-seq analysis reveals that 282 out of the 743 up-regulated genes in int51 show substantially decreased expression levels in int51/anac017-1 (Figure 4C, Supplemental Data Set S1). Besides, 95 up-regulated and 69 down-regulated genes are shared by int51 and anac017-2. These results indicate that ANAC017 is active in the absence of RCD1. In addition, 82 candidate genes containing the ANAC017-binding motif are likely direct targets of the RCD1-ANAC017 module, including the previously reported genes AOX1a and UGT74E2 (Supplemental Figure S3, Supplemental Data Set S2), supporting the notion that anac17-1 is epistatic to int51 in both retrograde signaling and salt stress response.

3.2. ANAC017 Confers Salt Hypersensitivity through Affecting ROS Homeostasis

Overaccumulation of ROS causes oxidative stress that can lead to damage to organelles and even cell death in plants [26,38,39]. The fact that many DEGs in int51 and anac017-2 are involved in oxidation-reduction processes (Figure 5A,B) suggests that the RCD1-ANAC017 module may impact ROS homeostasis. Indeed, under salt stress treatment, int51, anac017-2, and OE-ANAC017 transgenic lines produce more O2•−, but less H2O2, compared to Col-0, while anac017-1 suppresses the abnormal levels of O2•− and H2O2 in int51 (Figure 6C,D and Figure 7D,E), indicating that RCD1 maintains ROS homeostasis under salt stress through repressing ANAC017. In addition, salt-induced T-SOD enzyme activity is severely impaired in int51, anac017-2, and OE-ANAC017 (Figure 6E and Figure 7F). O2•− is usually the first product generated from O2 consumption in plant organelles and further triggers the formation of other ROS, such as OH and 1O2. The metalloenzyme SOD is the most effective dismutase reducing O2•− to H2O2. Extensive genetic evidence in different species has demonstrated that reduction or disruption of SOD enzymatic activities leads to severe developmental defects, and overexpression of SOD genes results in enhanced tolerance when plants are subjected to abiotic stresses [40,41,42,43,44]. In Arabidopsis, eight SODs are classified into three groups, including three copper/zinc (Cu/Zn)-SODs, two manganese (Mn)-SODs, and three iron (Fe)-SODs, according to their metal cofactors [28,45,46]. The transcript levels of these SOD genes are not significantly different in the mutants and Col-0 (Supplemental Figure S5B), implying that RCD1 and ANAC017 regulate SOD enzyme activity at the post-transcriptional level. Collectively, our data support the hypothesis that RCD1 interacts with ANAC017 and inhibits its transcriptional activation activity. Constitutive or excessive function of ANAC017 disrupts ROS homeostasis by reducing T-SOD activity, perhaps indirectly and especially under salt stress (Figure 8).
Figure 8. The proposed role of the RCD1-ANAC017 module in response to salt stress. Under normal growth conditions, the ANAC017 protein (blue solid dots) is predominantly located on the ER membrane, and the RCD1 protein (orange solid ovals) is located in the nucleus. When exposed to salt stress, in wild type, some RCD1 protein is exported from the nucleus to the cytoplasm, and a large amount of ANAC017 is released from the ER to the nucleus, where RCD1 interacts with ANAC017 and represses its transcriptional activity, resulting the expression of a few downstream target genes. In the absence of RCD1 (int51 mutant) under salt stress, ANAC017 protein is released from the ER to the nucleus to activate numerous target genes, then reducing and enhancing the enzyme activities of T-SOD and POD, respectively, leading to developmental abnormalities and hypersensitivity to salt stress.
Ijms 24 09793 g008

4. Materials and Methods

4.1. Plant Materials and Growth Conditions

The Arabidopsis thaliana mutants and transgenic plants used in this study were all in the Col-0 background. anac017-1 (SALK_022174), anac017-2 (SALK_044777), and int51 (rcd1-5) were described before [17,33], and the int51 anac017-1 double mutant was obtained by crosses. 35S::GFP-ANAC017(OE-ANAC017) transgenic plants were generated by cloning the full-length coding sequence of ANAC017 into the pEG101 overexpression vector containing N-terminal GFP tag and transforming Col-0 plants with the plasmid via Agrobacterium-mediated floral dipping. Individual transgenic lines of OE-ANAC017 were selected by Basta resistance. Seeds were plated on the 1/2 MS (Murashige and Skoog Basal Medium) containing 1% sucrose and 0.8% agar, incubated for 3 days at 4 °C and then transferred to 22 °C climate-controlled chambers under 16 h light/8 h dark cycles. For the seed germination assays, the emergence of green cotyledons was used as the indicator of germination. Seven-day-old seedlings were transferred to soil for other experiments. For the treatments of AA (antimycin A) and NaCl on N. benthamiana, the leaves of N. benthamiana were sprayed with or without 50 µM AA solution, and the plants growing soil were supplied with or without 200 mM NaCl solution. For NaCl induction assays, transgenic plants harboring the fused GFP-ANAC017 protein grown on the 1/2 MS plates for seven days and were transferred to 1/2 MS medium with or without 100 mM NaCl. The primers used in this study are listed in Supplemental Data Set S3.

4.2. Chlorophyll Content Assay

Total chlorophyll was extracted from 14-day-old seedlings of Col-0, int51, int51 anac017-1, anac017-1, anac017-2, and OE-ANAC017, respectively, and was measured according to procedures described before [47].

4.3. Subcellular Localization of RCD1 and ANAC017 in Arabidopsis protoplasts and N. benthamiana Leaves

The full-length coding sequences of RCD1 and ANAC017 from Col-0 were cloned into the pGD-eGFP vector [48] to generate pGD-RCD1-eGFP and pGD-eGFP-ANAC017, respectively. The plasmids were transformed into the Agrobacterium strain GV3101 and the Agrobacteria in medium (10 mM MES, 200 μM AS, 10 mM MgCl2) were transfected into the Arabidopsis protoplasts using polyethylene glycol (PEG)-mediated transformation [49] or introduced into 4-5-week-old N. benthamiana leaves via syringe with infiltration medium (10 mM MES, 200 μM AS, 10 mM MgCl2). Arabidopsis protoplasts were incubated in the dark for 16 h at 23 °C and N. benthamiana were grown for 48–72h before GFP and RFP signals were observed using confocal laser scanning microscopy with the excitation wavelengths of 488 and 532 nm, respectively. The ER marker ER-rk CD3-959 [50] and the nuclear marker H2B-mCherry were used for colocalization analysis.

4.4. Yeast Two-Hybrid Assay

The full-length coding sequences of RCD1 and ANAC017 were cloned into the pGBKT7 and pGADT7 vectors (Clontech, Mountain View, CA, USA), respectively, and these constructs were transformed to the yeast strain Y2HGold (Clontech, Mountain View, CA, USA) using the LiAc/TE method. The yeast cells were grown on the medium supplemented with SD-Leu-Trp-His or SD-Ade-Leu-Trp-His.

4.5. Bimolecular Fluorescence Complementation Assays (BiFC) in N. benthamiana Leaves

The coding sequences of RCD1 and ANAC017ΔTM from Col-0 were cloned into pPVYNE and pPVYCE vectors, respectively, to generate p35S::RCD1-N-VENUS and p35S:: ANAC017ΔTM-C-VENUS. The plasmids were transformed into the Agrobacterium strain GV3101 and the Agrobacteria in medium (10 mM MES, 200 μM AS, 10 mM MgCl2) were introduced into 4-5-week-old N. benthamiana leaves via syringe infiltration. After plants were grown for another 48–72 h, the VENUS and mCherry signals were observed using confocal laser scanning microscopy with excitation wavelengths of 515 and 543 nm, respectively.

4.6. Dual Luciferase Transient Activation Experiment in N. benthamiana

The coding sequences of RCD1 and ANAC017ΔTM from Col-0 were cloned into the pGreen II 62-SK vector [51]. A 2 kb promoter of the AOX1a gene containing two ANAC017 binding sites was amplified and introduced into the reporter vector pGreen II 0800-LUC [51] to generate pGreen II 0800-AOX1a-LUC. The Renilla LUC gene driven by the 35S promoter (pGreen II 0800-LUC) was used as the internal control. The reporter construct, together with pSK-ANAC017ΔTM and/or pSK-RCD1, was transformed into the Agrobacterium strain GV3101 and the Agrobacteria in medium (10 mM MES, 200 μM AS, 10 mM MgCl2) were co-transformed into N. benthamiana leaves. Firefly and Renilla luciferase activity was measured using the dual luciferase reporter assay system (Promega, Madison, WI, USA) according to the manufacturer’s instructions.

4.7. Transcriptome Sequencing and Data Analysis

Total RNA was extracted from each genotype using the TRIzol® Reagent (Invitrogen, Waltham, MA, USA). RNA-seq libraries were constructed and sequenced on an Illumina Hiseq ×10 platform to generate pair-end reads of 150 bp in length by Berry Genomics Co., Ltd. (Beijing, China). The raw RNA-seq data were analyzed using pRNASeqTools (https://github.com/grubbybio, accessed on 4 October 2022). Differentially expressed genes (DEGs) among different samples were identified with the cut-off of fold-change > 2 (for hyper-DEGs) or fold-change < 0.5 (for hypo-DEGs) and p < 0.05. Gene Ontology (GO) enrichment analysis and box plot diagrams were performed using the R package ‘clusterProfiler’. The volcano plots, Venn diagrams, and heatmaps were generated with TBtools software [52].

4.8. Staining and Measurement of H2O2 and O2•−

The accumulation of H2O2 and O2•− in leaves of each genotype was visualized by staining with DAB and NBT, respectively. The removal of chlorophyll was done by incubating the leaves in absolute ethanol in a boiling water bath, as described by [53]. The quantitative measurements of H2O2 and O2•− contents in plant leaves were performed with a commercial hydrogen peroxide assay kit (Beijing Solarbio Science and Technology Co., Ltd., Beijing, China) and a superoxide anion assay kit (Beijing Solarbio Science and Technology Co., Ltd., Beijing, China), respectively.

4.9. Measurement of the Activities of Antioxidant Enzymes

Plant tissues were ground in liquid nitrogen and mixed with 0.9 mL solution containing 10 mM phosphate buffer (pH 7.4). The suspension was centrifuged at 3500 rpm for 10 min at 4 °C, and the supernatant was collected for activity assays for T-SOD, POD, and CAT with commercial assay kits (Nanjing Jiancheng Bioengineering Institute, Nanjing, China).

Supplementary Materials

The following supporting information can be downloaded at: https://www.mdpi.com/article/10.3390/ijms24129793/s1.

Author Contributions

Y.Y. and J.T. conceived the research. J.T., F.W., H.W., X.L. and W.L. performed the experiments. J.T., W.K., Y.Y., L.G., Z.J. and B.M. analyzed the data. J.T., W.K., Y.Y. and X.C. wrote the manuscript. All authors have read and agreed to the published version of the manuscript.

Funding

This work was supported by National Natural Science Foundation of China (31801078, 32070614), National Key Research and Development Program of China (2019YFA0903900), Guangdong Basic and Applied Basic Research Foundation (2020A1515011567), and Guangdong Innovation Team Project (2014ZT05S078).

Institutional Review Board Statement

Not applicable.

Informed Consent Statement

Not applicable.

Data Availability Statement

The data reported in this paper have been deposited in NCBI Sequence Read Archive (SRA) database (https://submit.ncbi.nlm.nih.gov/subs/sra/) with the accession no. PRJNA883985 and accessed on 4 October 2022.

Acknowledgments

We thank the Central Research Facilities of College of Life Sciences and Oceanography of Shenzhen University for the use of laser scanning confocal microscope (LSM710, ZEISS, Germany).

Conflicts of Interest

The authors declare no conflict of interest.

References

  1. Zhu, J.K. Abiotic stress signaling and sesponses in slants. Cell 2016, 167, 313–324. [Google Scholar] [CrossRef] [PubMed] [Green Version]
  2. Zhao, S.; Zhang, Q.; Liu, M.; Zhou, H.; Ma, C.; Wang, P. Regulation of plant responses to salt stress. Int. J. Mol. Sci. 2021, 22, 4609. [Google Scholar] [CrossRef] [PubMed]
  3. Zhang, H.; Zhu, J.; Gong, Z.; Zhu, J.K. Abiotic stress responses in plants. Nat. Rev. Genet. 2022, 23, 104–119. [Google Scholar] [CrossRef] [PubMed]
  4. van Zelm, E.; Zhang, Y.; Testerink, C. Salt tolerance mechanisms of plants. Annu. Rev. Plant. Biol. 2020, 71, 403–433. [Google Scholar] [CrossRef] [Green Version]
  5. Yu, Z.; Duan, X.; Luo, L.; Dai, S.; Ding, Z.; Xia, G. How plant hormones mediate salt stress responses. Trends Plant Sci. 2020, 25, 1117–1130. [Google Scholar] [CrossRef]
  6. Overmyer, K.; Tuominen, H.; Kettunen, R.; Betz, C.; Langebartels, C.; Sandermann, H., Jr.; Kangasjärvi, J. Ozone-sensitive arabidopsis rcd1 mutant reveals opposite roles for ethylene and jasmonate signaling pathways in regulating superoxide-dependent cell death. Plant Cell 2000, 12, 1849–1862. [Google Scholar] [CrossRef] [Green Version]
  7. Fujibe, T.; Saji, H.; Arakawa, K.; Yabe, N.; Takeuchi, Y.; Yamamoto, K.T. A methyl viologen-resistant mutant of Arabidopsis, which is allelic to ozone-sensitive rcd1, is tolerant to supplemental ultraviolet-B irradiation. Plant Physiol. 2004, 134, 275–285. [Google Scholar] [CrossRef] [Green Version]
  8. Ahlfors, R.; Laång, S.; Overmyer, K.; Jaspers, P.; Broscheé, M.; Tauriainen, A.; Kollist, H.; Tuominen, H.; Belles-Boix, E.; Piippo, M.; et al. Arabidopsis RADICAL-INDUCED CELL DEATH1 belongs to the WWE protein–protein interaction domain protein family and modulates abscisic acid, ethylene, and methyl jasmonate responses. Plant Cell 2004, 16, 1925–1937. [Google Scholar] [CrossRef] [Green Version]
  9. Katiyar-Agarwal, S.; Zhu, J.; Kim, K.; Agarwal, M.; Fu, X.; Huang, A.; Zhu, J.K. The plasma membrane Na+/H+ antiporter SOS1 interacts with RCD1 and functions in oxidative stress tolerance in Arabidopsis. Proc. Natl. Acad. Sci. USA 2006, 103, 18816–18821. [Google Scholar] [CrossRef] [Green Version]
  10. Vainonen, J.P.; Jaspers, P.; Wrzaczek, M.; Lamminmäki, A.; Reddy, R.A.; Vaahtera, L.; Brosché, M.; Kangasjärvi, J. RCD1-DREB2A interaction in leaf senescence and stress responses in Arabidopsis thaliana. Biochem. J. 2012, 442, 573–581. [Google Scholar] [CrossRef] [Green Version]
  11. Jaspers, P.; Blomster, T.; Brosché, M.; Salojärvi, J.; Ahlfors, R.; Vainonen, J.P.; Reddy, R.A.; Immink, R.; Angenent, G.; Turck, F.; et al. Unequally redundant RCD1 and SRO1 mediate stress and developmental responses and interact with transcription factors. Plant J. 2009, 60, 268–279. [Google Scholar] [CrossRef]
  12. Hong, Y.; Gao, Y.; Pang, J.; Shi, H.; Li, T.; Meng, H.; Kong, D.; Chen, Y.; Zhu, J.K.; Wang, Z. The Sm core protein SmEb regulates salt stress responses through maintaining proper splicing of RCD1 pre-mRNA in Arabidopsis. J. Integr. Plant. Biol. 2023. [Google Scholar] [CrossRef]
  13. Belles-Boix, E.; Babiychuk, E.; Van Montagu, M.; Inzé, D.; Kushnir, S. CEO1, a new protein from Arabidopsis thaliana, protects yeast against oxidative damage. FEBS Lett. 2000, 482, 19–24. [Google Scholar] [CrossRef]
  14. Jaspers, P.; Overmyer, K.; Wrzaczek, M.; Vainonen, J.P.; Blomster, T.; Salojärvi, J.; Reddy, R.A.; Kangasjärvi, J. The RST and PARP-like domain containing SRO protein family: Analysis of protein structure, function and conservation in land plants. BMC Genom. 2010, 11, 170. [Google Scholar] [CrossRef] [Green Version]
  15. Shapiguzov, A.; Vainonen, J.P.; Hunter, K.; Tossavainen, H.; Tiwari, A.; Järvi, S.; Hellman, M.; Aarabi, F.; Alseekh, S.; Wybouw, B.; et al. Arabidopsis RCD1 coordinates chloroplast and mitochondrial functions through interaction with ANAC transcription factors. eLife 2019, 8, e43284. [Google Scholar] [CrossRef]
  16. De Clercq, I.; Vermeirssen, V.; Van Aken, O.; Vandepoele, K.; Murcha, M.W.; Law, S.R.; Inzé, A.; Ng, S.; Ivanova, A.; Rombaut, D.; et al. The membrane-bound NAC transcription factor ANAC013 functions in mitochondrial retrograde regulation of the oxidative stress response in Arabidopsis. Plant Cell 2013, 25, 3472–3490. [Google Scholar] [CrossRef] [Green Version]
  17. Ng, S.; Ivanova, A.; Duncan, O.; Law, S.R.; Van Aken, O.; De Clercq, I.; Wang, Y.; Carrie, C.; Xu, L.; Kmiec, B.; et al. A membrane-bound NAC transcription factor, ANAC017, mediates mitochondrial retrograde signaling in Arabidopsis. Plant Cell 2013, 25, 3450–3471. [Google Scholar] [CrossRef] [Green Version]
  18. Van Aken, O.; Ford, E.; Lister, R.; Huang, S.; Millar, A.H. Retrograde signalling caused by heritable mitochondrial dysfunction is partially mediated by ANAC017 and improves plant performance. Plant J. 2016, 88, 542–558. [Google Scholar] [CrossRef] [Green Version]
  19. Meng, X.; Li, L.; De Clercq, I.; Narsai, R.; Xu, Y.; Hartmann, A.; Claros, D.L.; Custovic, E.; Lewsey, M.G.; Whelan, J.; et al. ANAC017 coordinates organellar functions and stress responses by reprogramming retrograde signaling. Plant Physiol. 2019, 180, 634–653. [Google Scholar] [CrossRef] [Green Version]
  20. Gleason, C.; Huang, S.; Thatcher, L.F.; Foley, R.C.; Anderson, C.R.; Carroll, A.J.; Millar, A.H.; Singh, K.B. Mitochondrial complex II has a key role in mitochondrial-derived reactive oxygen species influence on plant stress gene regulation and defense. Proc. Natl. Acad. Sci. USA 2011, 108, 10768–10773. [Google Scholar] [CrossRef] [Green Version]
  21. Shapiguzov, A.; Vainonen, J.P.; Wrzaczek, M.; Kangasjärvi, J. ROS-talk—How the apoplast, the chloroplast, and the nucleus get the message through. Front. Plant. Sci. 2012, 3, 292. [Google Scholar] [CrossRef] [PubMed] [Green Version]
  22. Foyer, C.H. Reactive oxygen species, oxidative signaling and the regulation of photosynthesis. Environ. Exp. Bot. 2018, 154, 134–142. [Google Scholar] [CrossRef]
  23. Huang, S.; Van Aken, O.; Schwarzländer, M.; Belt, K.; Millar, A.H. The roles of mitochondrial reactive oxygen species in cellular signaling and stress response in plants. Plant Physiol. 2016, 171, 1551–1559. [Google Scholar] [CrossRef] [PubMed] [Green Version]
  24. Jurdak, R.; Launay-Avon, A.; Paysant-Le Roux, C.; Bailly, C. Retrograde signalling from the mitochondria to the nucleus translates the positive effect of ethylene on dormancy breaking of Arabidopsis thaliana seeds. New Phytol. 2021, 229, 2192–2205. [Google Scholar] [CrossRef] [PubMed]
  25. Bose, J.; Rodrigo-Moreno, A.; Shabala, S. ROS homeostasis in halophytes in the context of salinity stress tolerance. J. Exp. Bot. 2014, 65, 1241–1257. [Google Scholar] [CrossRef]
  26. Nadarajah, K.K. ROS homeostasis in abiotic stress tolerance in plants. Int. J. Mol. Sci. 2020, 21, 5208. [Google Scholar] [CrossRef]
  27. Dvořák, P.; Krasylenko, Y.; Zeiner, A.; Šamaj, J.; Takáč, T. Signaling toward reactive oxygen species-scavenging enzymes in plants. Front. Plant. Sci. 2020, 11, 618835. [Google Scholar] [CrossRef]
  28. Gill, S.S.; Tuteja, N. Reactive oxygen species and antioxidant machinery in abiotic stress tolerance in crop plants. Plant Physiol. Biochem. 2010, 48, 909–930. [Google Scholar] [CrossRef]
  29. Del Río, L.A.; Corpas, F.J.; López-Huertas, E.; Palma, J.M. Plant superoxide dismutases: Function under abiotic stress conditions. In Antioxidants and Antioxidant Enzymes in Higher Plants; Gupta, D.K., Palma, J.M., Corpas, F.J., Eds.; Springer International Publishing: Cham, Switzerland, 2018; pp. 1–26. [Google Scholar]
  30. O’Malley, R.C.; Huang, S.C.; Song, L.; Lewsey, M.G.; Bartlett, A.; Nery, J.R.; Galli, M.; Gallavotti, A.; Ecker, J.R. Cistrome and epicistrome features shape the regulatory DNA landscape. Cell 2016, 165, 1280–1292. [Google Scholar] [CrossRef] [Green Version]
  31. Yang, Y.; Guo, Y. Elucidating the molecular mechanisms mediating plant salt-stress responses. N. Phytol. 2018, 217, 523–539. [Google Scholar] [CrossRef] [Green Version]
  32. Zhuang, Y.; Wei, M.; Ling, C.; Liu, Y.; Amin, A.K.; Li, P.; Li, P.; Hu, X.; Bao, H.; Huo, H.; et al. EGY3 mediates chloroplastic ROS homeostasis and promotes retrograde signaling in response to salt stress in Arabidopsis. Cell Rep. 2021, 36, 109384. [Google Scholar] [CrossRef]
  33. Zhu, Y.; Du, B.; Qian, J.; Zou, B.; Hua, J. Disease resistance gene-induced growth inhibition is enhanced by rcd1 independent of defense activation in Arabidopsis. Plant Physiol. 2013, 161, 2005–2013. [Google Scholar] [CrossRef] [Green Version]
  34. Jin, T.; Wu, H.; Deng, Z.; Cai, T.; Li, J.; Liu, Z.; Waterhouse, P.M.; White, R.G.; Liang, D. Control of root-to-shoot long-distance flow by a key ROS-regulating factor in Arabidopsis. Plant Cell Environ. 2022, 45, 2476–2491. [Google Scholar] [CrossRef]
  35. Singh, A.; Mehta, S.; Yadav, S.; Nagar, G.; Ghosh, R.; Roy, A.; Chakraborty, A.; Singh, I.K. How to cope with the challenges of environmentalstresses in the era of global climate change: An update on ROS stave off in Plants. Int. J. Mol. Sci. 2022, 23, 1995. [Google Scholar] [CrossRef]
  36. Broda, M.; Khan, K.; O’Leary, B.; Pružinská, A.; Lee, C.P.; Millar, A.H.; Van Aken, O. Increased expression of ANAC017 primes for accelerated senescence. Plant Physiol. 2021, 186, 2205–2221. [Google Scholar] [CrossRef]
  37. Wang, L.; Cheng, H.; Wang, Q.; Si, C.; Yang, Y.; Yu, Y.; Zhou, L.; Ding, L.; Song, A.; Xu, D.; et al. CmRCD1 represses flowering by directly interacting with CmBBX8 in summer chrysanthemum. Hortic. Res. 2021, 8, 79. [Google Scholar] [CrossRef]
  38. Hasanuzzaman, M.; Raihan, M.R.H.; Masud, A.A.C.; Rahman, K.; Nowroz, F.; Rahman, M.; Nahar, K.; Fujita, M. Regulation of reactive oxygen species and antioxidant defense in plants under salinity. Int. J. Mol. Sci. 2021, 22, 9326. [Google Scholar] [CrossRef]
  39. Mittler, R.; Zandalinas, S.I.; Fichman, Y.; Van Breusegem, F. Reactive oxygen species signalling in plant stress responses. Nat. Rev. Mol. Cell. Biol. 2022, 23, 663–679. [Google Scholar] [CrossRef]
  40. Van Breusegem, F.; Slooten, L.; Stassart, J.M.; Moens, T.; Botterman, J.; Van Montagu, M.; Inzé, D. Overproduction of Arabidopsis thaliana FeSOD confers oxidative stress tolerance to transgenic maize. Plant Cell Physiol. 1999, 40, 515–523. [Google Scholar] [CrossRef]
  41. Hamid Badawi, G.; Yamauchi, Y.; Shimada, E.; Sasaki, R.; Kawano, N.; Tanaka, K.; Tanaka, K. Enhanced tolerance to salt stress and water deficit by overexpressing superoxide dismutase in tobacco (Nicotiana tabacum) chloroplasts. Plant Sci. 2004, 166, 919–928. [Google Scholar] [CrossRef]
  42. Sunkar, R.; Kapoor, A.; Zhu, J.K. Posttranscriptional induction of two Cu/Zn superoxide dismutase genes in Arabidopsis is mediated by downregulation of miR398 and important for oxidative stress tolerance. Plant Cell 2006, 18, 2051–2065. [Google Scholar] [CrossRef] [PubMed] [Green Version]
  43. Zhao, F.; Guo, S.; Zhang, H.; Zhao, Y. Expression of yeast SOD2 in transgenic rice results in increased salt tolerance. Plant Sci. 2006, 170, 216–224. [Google Scholar] [CrossRef]
  44. Zaefyzadeh, M.; Quliyev, R.A.; Babayeva, S.; Abbasov, M.A. The effect of the interaction between genotypes and drought stress on the superoxide dismutase and chlorophyll content in durum wheat landraces. Turk. J. Biol. 2009, 33, 1–7. [Google Scholar] [CrossRef]
  45. Kliebenstein, D.J.; Dietrich, R.A.; Martin, A.C.; Last, R.L.; Dangl, J.L. LSD1 regulates salicylic acid induction of copper zinc superoxide dismutase in Arabidopsis thaliana. Mol. Plant Microbe Interact. 1999, 12, 1022–1026. [Google Scholar] [CrossRef] [PubMed] [Green Version]
  46. Lee, J.; Chen, H.; Lee, G.; Emonet, A.; Kim, S.G.; Shim, D.; Lee, Y. MSD2-mediated ROS metabolism fine-tunes the timing of floral organ abscission in Arabidopsis. New Phytol. 2022, 235, 2466–2480. [Google Scholar] [CrossRef] [PubMed]
  47. Zhang, Z.; Huang, R. Analysis of malondialdehyde, chlorophyll proline, soluble sugar, and glutathione content in Arabidopsis seedling. Bio-Protocol 2013, 3, e817. [Google Scholar] [CrossRef]
  48. Zhu, M.; Chen, Y.; Ding, X.S.; Webb, S.L.; Zhou, T.; Nelson, R.S.; Fan, Z. Maize Elongin C interacts with the viral genome-linked protein, VPg, of Sugarcane mosaic virus and facilitates virus infection. New Phytol. 2014, 203, 1291–1304. [Google Scholar] [CrossRef] [Green Version]
  49. Yoo, S.D.; Cho, Y.H.; Sheen, J. Arabidopsis mesophyll protoplasts: A versatile cell system for transient gene expression analysis. Nat. Protoc. 2007, 2, 1565–1572. [Google Scholar] [CrossRef] [Green Version]
  50. Nelson, B.K.; Cai, X.; Nebenführ, A. A multicolored set of in vivo organelle markers for co-localization studies in Arabidopsis and other plants. Plant J. 2007, 51, 1126–1136. [Google Scholar] [CrossRef]
  51. Hellens, R.P.; Allan, A.C.; Friel, E.N.; Bolitho, K.; Grafton, K.; Templeton, M.D.; Karunairetnam, S.; Gleave, A.P.; Laing, W.A. Transient expression vectors for functional genomics, quantification of promoter activity and RNA silencing in plants. Plant Methods 2005, 1, 13. [Google Scholar] [CrossRef] [Green Version]
  52. Chen, C.; Chen, H.; Zhang, Y.; Thomas, H.R.; Frank, M.H.; He, Y.; Xia, R. TBtools: An integrative toolkit developed for interactive analyses of big biological data. Mol. Plant 2020, 13, 1194–1202. [Google Scholar] [CrossRef]
  53. Kumar, D.; Yusuf, M.A.; Singh, P.; Sardar, M.; Sarin, N.B. Histochemical detection of superoxide and H2O2 accumulation in Brassica juncea seedlings. Bio-Protocol 2014, 4, e1108. [Google Scholar] [CrossRef]
Figure 1. Loss of function in ANAC017 partially rescues the salt-sensitive phenotype of int51. (A) The phenotype of fourteen-day-old Col-0, int51, int51/anac017-1, anac017-1, and anac017-2 (lacking the transmembrane motif) seedlings grown on 1/2 MS medium with or without 100 mM NaCl treatment. Bar scale, 1 cm. (B) Quantitative analysis of leaf chlorosis percentage in WT and mutants under treatment with 100 mM NaCl. Data were collected from five biological replicates and presented as mean ± standard deviation. Fifty seedlings were used for each replicate. Letters indicate significant differences at p-value < 0.05 based on one-way ANOVA and Tukey’s HSD test. (C) Quantitative analysis of chlorophyll concentration in WT and mutants. Data were collected from five biological replicates and presented as mean ± standard deviation. Around 0.1 g seedlings were used for each replicate. Letters indicate significant differences at p-value < 0.05 based on one-way ANOVA and Tukey’s HSD test. FW, fresh weight. (D,E) Quantitative analysis of the relative fresh weights (D) and relative dry weights (E) (100 mM NaCl/Control) in WT and mutants. Data were collected from five biological replicates and presented as mean ± standard deviation. Five seedlings were used for each replicate. Letters indicate significant differences at p-value < 0.05 based on one-way ANOVA and Tukey’s HSD test. (F) The root phenotypes of seven-day-old Col-0, int51, int51/anac017-1, anac017-1, and anac017-2 seedlings vertically grown on 1/2 MS medium with or without 100 mM NaCl treatment. Bar scale, 1 cm. (G) Quantitative analysis of the relative root lengths (100 mM NaCl/Control) in WT and mutants. Data were collected from fifteen–twenty plants per genotype and presented as mean ± standard deviation. Letters indicate significant differences at p-value < 0.05 based on one-way ANOVA and Tukey’s HSD test.
Ijms 24 09793 g001
Figure 2. Salt stress triggers the translocation of ANAC017 from the ER to the nucleus. (A) The RFP-fused ER marker and mCherry-fused nucleus marker were separately co-infiltrated into the five-week-old N. benthamiana leaves with the plasmid of N-terminal GFP-fused full-length ANAC017, and the plants were grown for three days under normal conditions. Then the plants were treated with 50 µM AA (antimycin A) or 200 mM NaCl for 3 h before the GFP and RFP signals were observed using a confocal laser scanning microscope. The leaves without treatment served as the mock control. Two independent experiments were performed. ER marker, ER-rk CD3-959. Nucleus marker, H2B-mCherry. Bar scale, 25 µm. (B) The roots of seven-day-old 35S::GFP-ANAC017 transgenic plants harboring the fused GFP-ANAC017 protein were treated with or without 100 mM NaCl for 6 h, and the GFP and 4′,6-diamidino-2-phenylindole (DAPI) staining were observed using a confocal laser scanning microscope. White arrows indicated the cell nuclei. Two independent experiments were performed. Bar scale, 25 µm.
Ijms 24 09793 g002
Figure 3. RCD1 interacts with ANAC017 in the nucleus and represses the transcriptional activity of ANAC017. (A) The interaction between RCD1 and ANAC017 in the yeast two-hybrid assay. SD/-L-T indicated the synthetically defined medium lacking the amino acids of Leu and Trp. SD/-L-T-H-A indicated the synthetically defined medium lacking the amino acids of Leu, Trp, His, and Ade. (B) Bimolecular fluorescence complementation (BiFC) assay between RCD1 and ANAC017ΔTM in N. benthamiana leaves. The Venus signal was observed using a confocal laser scanning microscope. Venus-N, N-terminal half of the Venus fluorescent protein, Venus-C, C-terminal half of the Venus fluorescent protein. Experiments were repeated twice. H2B-mCherry served as the nucleus marker. Bar scale, 25 μm. (C) Plasmids used in a reporter gene assay are shown in the top panel. The bottom panel shows the activation of the 2 kb AOX1a promoter by ANAC017ΔTM and the antagonistic effects of RCD1 towards ANAC017ΔTM. The colors indicate relative expression values. EV: Empty vector. REN: Renilla luciferase. LUC: Luciferase. (D) LUC/REN ratios in N. benthamiana leaves. Data were collected from six biological replicates and presented as mean ± standard deviation. Letters indicate significant differences at p-value < 0.05 based on one-way ANOVA and Tukey’s HSD test.
Ijms 24 09793 g003
Figure 4. RNA-seq analysis of int51, int51/anac017-1 and anac017-2. (A,B,D) Volcano plots representing DEGs in int51 (A), int51/anac017-1 (B) and anac017-2 (D) compared with Col-0. The red, blue, and grey dots represent the up-regulated, down-regulated, and unchanged genes, respectively. The numbers in brackets indicate the numbers of DEGs. (C) Box plot presenting the expression levels of 282 genes that are up-regulated genes in int51 as compared to Col-0 and down-regulated in int51/anac017-1 as compared to int51. (E,F) Venn diagram showing the overlap in up-regulated genes (E) and down-regulated genes (F) between int51 and anac017-2. (G) Box plot presenting the expression levels of the 95 commonly up-regulated genes in (E). (H) Box plot showing the expression levels of the 69 commonly down-regulated genes in (F).
Ijms 24 09793 g004
Figure 5. GO enrichment analysis for differentially expressed genes in int51, anac017-2, and int51/anac017-1. (AC) GO enrichment analysis of the up-regulated genes in int51 (A), anac017-2 (B), and int51/anac017-1 (C), respectively, compared to Col-0.
Ijms 24 09793 g005
Figure 6. ANAC017 affects ROS homeostasis. (A,B) NBT staining (A) and DAB staining (B) in the leaves of Col-0 and mutants (int51, int51/anac017-1, anac017-1, and anac017-2). Seven-day-old seedlings grown on 1/2 MS medium were transferred to soil and grown for another two weeks before the treatment with or without 400 mM NaCl for 24 h. Bar scale, 0.5 cm. (CG) Quantitative analysis of ROS molecules O2•− (C) and H2O2 (D) and ROS-related enzyme activities of total SOD dismutase (E), POD (F), and CAT (G) in leaves of Col-0 and mutants. Seven-day-old seedlings grown on 1/2 MS medium were transferred to soil and grown for another two weeks before the treatment with or without 400 mM NaCl for four days. Data were collected from five biological replicates and presented as mean ± standard deviation. About 0.1 g rosette leaves were used in each replicate. Letters indicate significant differences at p-value < 0.05 based on one-way ANOVA and Tukey’s HSD test.
Ijms 24 09793 g006
Figure 7. Overexpression of ANAC017 results in hypersensitivity to salt stress. (A) The phenotype of fourteen-day-old Col-0, OE-ANAC017#1, OE-ANAC017#2, and OE-ANAC017#3 grown on 1/2 MS with or without 100 mM NaCl. (B,C) Quantitative analysis of chlorophyll content (B) and germination rate (C) in WT and mutants. Data were collected from five biological replicates and presented as mean ± standard deviation. About 0.1 g seedlings were used for chlorophyll determination in each replicate. (DG) Quantitative analysis of ROS molecules O2•− (D) and H2O2 (E) and ROS-related enzyme activities of total SOD dismutase (F) and POD (G) in leaves of Col-0, OE-ANAC017#1, and OE-ANAC017#2. Seven-day-old seedlings grown on 1/2 MS medium were transferred to soil and grown for another two weeks before the treatment with or without 400 mM NaCl for four days. Data were collected from five biological replicates and presented as mean ± standard deviation. About 0.1 g rosette leaves were used in each replicate. Letters indicate significant differences at p-value < 0.05 based on one-way ANOVA and Tukey’s HSD test.
Ijms 24 09793 g007
Disclaimer/Publisher’s Note: The statements, opinions and data contained in all publications are solely those of the individual author(s) and contributor(s) and not of MDPI and/or the editor(s). MDPI and/or the editor(s) disclaim responsibility for any injury to people or property resulting from any ideas, methods, instructions or products referred to in the content.

