Article

Comparative Transcriptome Profiling Unfolds a Complex Defense and Secondary Metabolite Networks Imparting Corynespora cassiicola Resistance in Soybean (Glycine max (L.) Merrill)

1
Department of Crop, Soil and Environmental Sciences, Auburn University, Auburn, AL 36849, USA
2
School of Fisheries, Aquaculture and Aquatic Sciences, Auburn University, Auburn, AL 36849, USA
3
Department of Entomology and Plant Pathology, Auburn University, Auburn, AL 36849, USA
*
Author to whom correspondence should be addressed.
Int. J. Mol. Sci. 2023, 24(13), 10563; https://doi.org/10.3390/ijms241310563
Submission received: 17 May 2023 / Revised: 7 June 2023 / Accepted: 20 June 2023 / Published: 23 June 2023
(This article belongs to the Section Molecular Plant Sciences)

Abstract

:
Target spot is caused by Corynespora cassiicola, which heavily affects soybean production areas that are hot and humid. Resistant soybean genotypes have been identified; however, the molecular mechanisms governing resistance to infection are unknown. Comparative transcriptomic profiling using two known resistant genotypes and two susceptible genotypes was performed under infected and control conditions to understand the regulatory network operating between soybean and C. cassiicola. RNA-Seq analysis identified a total of 2571 differentially expressed genes (DEGs) which were shared by all four genotypes. These DEGs are related to secondary metabolites, immune response, defense response, phenylpropanoid, and flavonoid/isoflavonoid pathways in all four genotypes after C. cassiicola infection. In the two resistant genotypes, additional upregulated DEGs were identified affiliated with the defense network: flavonoids, jasmonic acid, salicylic acid, and brassinosteroids. Further analysis led to the identification of differentially expressed transcription factors, immune receptors, and defense genes with a leucine-rich repeat domain, dirigent proteins, and cysteine (C)-rich receptor-like kinases. These results will provide insight into molecular mechanisms of soybean resistance to C. cassiicola infection and valuable resources to potentially pyramid quantitative resistance loci for improving soybean germplasm.

1. Introduction

Soybean (Glycine max (L.) Merrill) is widely consumed in many forms, contributing 59% of the world’s edible oil production and supplying 31–40% of high-quality protein, making it a good staple food source for human and animal consumption. In 2021, 128 million ha of soybean was produced with yields of 364 million metric tons [1]. Soybean production typically does not achieve its full yield potential due to biotic stresses [2].
Growers in the southern US soybean industry are facing a serious challenge posed by the plant pathogenic fungus, Corynespora cassiicola ((Berk. & M.A. Curtis) C.T. Wei). This fungus causes target spot and thrives in warm and moist environments, leading to estimated yield losses of 18–32% [3,4]. Symptoms of infection by C. cassiicola are necrotic spots with alternating concentric rings of light and dark brown bands, usually encircled by a yellow halo on the foliage. In addition, lesions on stems, pods, and seeds, and premature leaf senescence could occur in severe cases [3,5]. The present method for controlling target spot relies on fungicide applications. The immense use of fungicides can lead to the development of resistance in C. cassiicola isolates and reduce the effectiveness of fungicides [6,7,8]. A more eco-friendly and sustainable approach is to use resistant cultivars.
Corynespora cassiicola resistance exists in soybean genotypes [9]; however, the genes and mechanisms of resistance are unknown. Investigating disease resistance mechanisms relies on the identification of genomic regions, genes, and gene networks associated with defense responses triggered by the host upon infection with a pathogen [10]. RNA sequencing (RNA-Seq) is an advanced and effective technology used for studying gene expression at the whole genome level which can detect novel transcripts, splice junctions, facilitates DEG analysis, and allow functional gene mining [11,12]. The enhancement of high-throughput sequencing (HTS) technology and the availability of comprehensive soybean genome sequences have allowed the full-scale examination of the transcriptomic response to disease [13]. Soybean RNA-Seq studies have provided an opportunity to gain in-depth knowledge of plant–pathogen interactions by identifying responsive genes and pathways for disease resistance such as to soybean cyst nematodes [14,15], Phytophthora root and stem rot [16], Fusarium root rot [17], bacterial leaf pustules [18], Soybean mosaic virus [19], downy mildew [20], and brown stem rot [21].
Corynespora cassiicola is a devastating pathogen in crops such as rubber tree (Hevea brasiliensis), cotton (Gossypium hirsutum L.), and cucumber (Cucumis sativus L.) [22,23,24]. RNA-Seq studies in cucumber and rubber, after infection by C. cassiicola, have found differential gene expression associated with Ca2+ signaling pathways, pathways targeting salicylic acid (SA), ethylene (ET), and phenylpropanoid biosynthesis [25,26,27,28]. Such studies have aided in the identification of miRNAs, genes, and gene variations that are critical for understanding the genetic basis and marker development for disease resistance. In soybean, histochemical characterization and biochemical assays in control and infected tissues of the plant suggest a major role of total soluble phenolics (TSP) and lignin-thioglycolic acid (LTGA) derivatives in controlling the spread of C. cassiicola in leaf tissue [29,30]. However, to date, there have been no transcriptome studies for the C. cassiicola interaction with soybean to validate such claims. Two genotypes, Bedford and Council, have some level of resistance as low levels of disease developed on each after inoculation with C. cassiicola; two other genotypes, Henderson and Pembina, are documented as susceptible [9]. The objective of this study is to conduct a comparative transcriptomic analysis to determine the differentially expressed genes (DEGs) between non-inoculated control and post-C. cassiicola infection at 24 and 48 h post-infection. These DEGs will be further evaluated for Gene Ontology (GO) and Kyoto Encyclopedia of Genes and Genomes (KEGG) pathways. This will provide insight into genes and molecular mechanisms that underlie soybean resistance to C. cassiicola infection.

2. Results

2.1. RNA Sequencing Data Analysis and DEGs in Response to C. cassiicola

For RNA sequencing, raw reads ranged from 22,838,228 to 33,485,280 per sample, with an average GC content of 44–45%. After quality control, the adapter and low-quality reads were discarded from the data. The clean data ranged from 22,381,404 to 33,067,807 reads per sample (Table 1). A total of 88–91% of the sequence reads were successfully mapped to the soybean reference genome. A total of 11,263 DEGs were identified at 24 hpi, including 1387 DEGs that were common in all four genotypes. Moreover, a total of 11,094 DEGs were determined at 48 hpi, including 1184 DEGs that were common in all four genotypes (Figure 1). The number of up- and downregulated genes differed between the four genotypes. Specifically, Bedford and Pembina had more differentially expressed genes at 24 hpi, whereas Council and Henderson had more at 48 hpi (Figure 1).
A total of 5172 genes at 24 hpi and 5384 genes at 48 hpi were uniquely differentially expressed in one of the four genotypes after C. cassiicola infection. In the resistant genotypes, 3403 and 2760 genes were differentially expressed at 24 hpi and 48 hpi, respectively, that were not expressed in susceptible genotypes. Unique DEGs in Council were 895 at 24 hpi and 1799 at 48 hpi; for Bedford, there were 2353 at 24 hpi, and 798 at 48 hpi. A total of 155 and 163 DEGs were shared in both resistant genotypes at 24 hpi and 48 hpi, respectively (Figure 1B,C).
A total of 334 and 693 DEGs were shared between susceptible genotypes at 24 hpi and 48 hpi, respectively. The unique DEGs in Henderson were 578 at 24 hpi and 2237 at 48 hpi; in Pembina, there were 1346 DEGs at 24 hpi and 550 DEGs at 48 hpi (Figure 1B,C).

2.2. Gene Ontology (GO) Enrichment Analysis of DEGs

The results of GO enrichment for the DEGs common in all four genotypes after C. cassiicola infection, regardless of time after inoculation, revealed 150 GO terms and 139 GO terms for upregulated and downregulated DEGs, respectively. The enriched GO terms in upregulated biological processes were the secondary metabolic process, RNA modification, the glucosinolate metabolic process, cell recognition, response to biotic stimulus, the flavonoid biosynthetic process, regulation of protein serine/threonine phosphatase activity, the defense response, and the immune response, indicating the importance of the activation of a defense-related network in response to C. cassiicola infection. In addition, a cluster of GO terms related to oxidoreductase activity, monooxygenase activity, peroxidase activity, protein serine kinase activity, naringenin-chalcone synthase activity, protein serine/threonine kinase activity, hormone binding, glucosidase activity, and phenylalanine ammonia-lyase activity were also observed in the molecular function category (Figure 2, Supplementary Table S1). Thus, upregulated DEGs were assigned to GO terms mainly associated with defending the soybean plant in response to C. cassiicola infection.
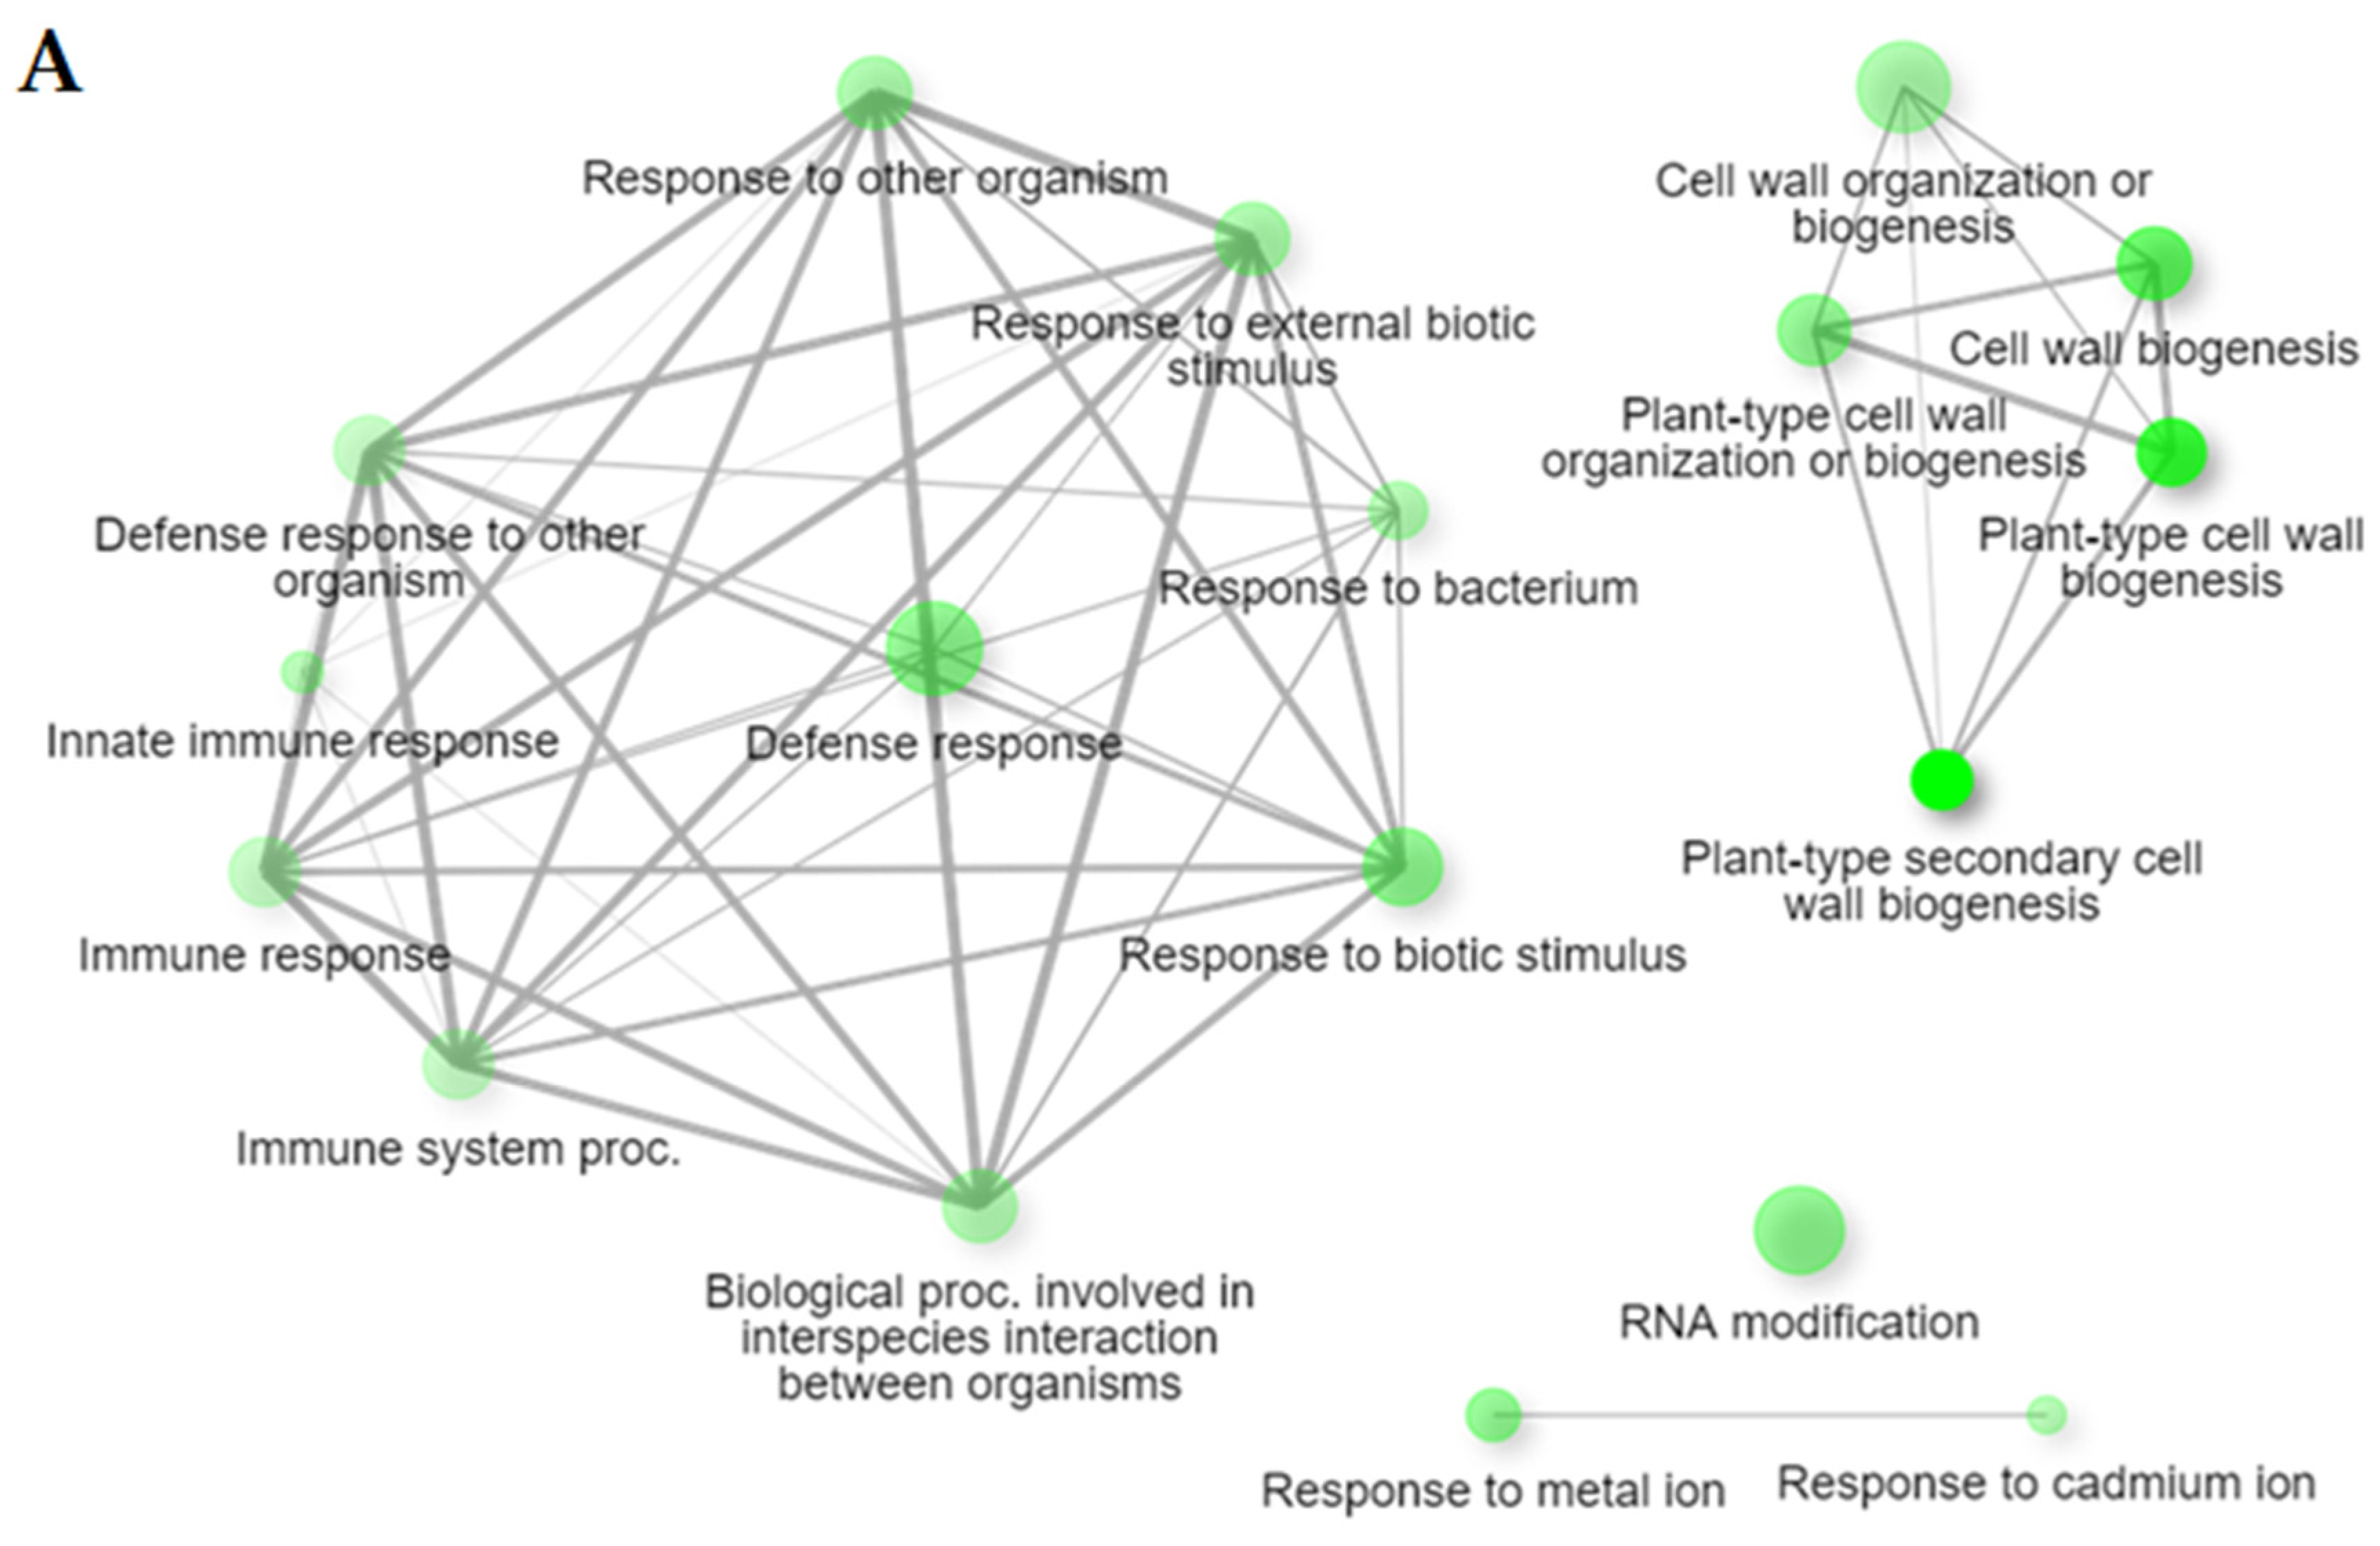
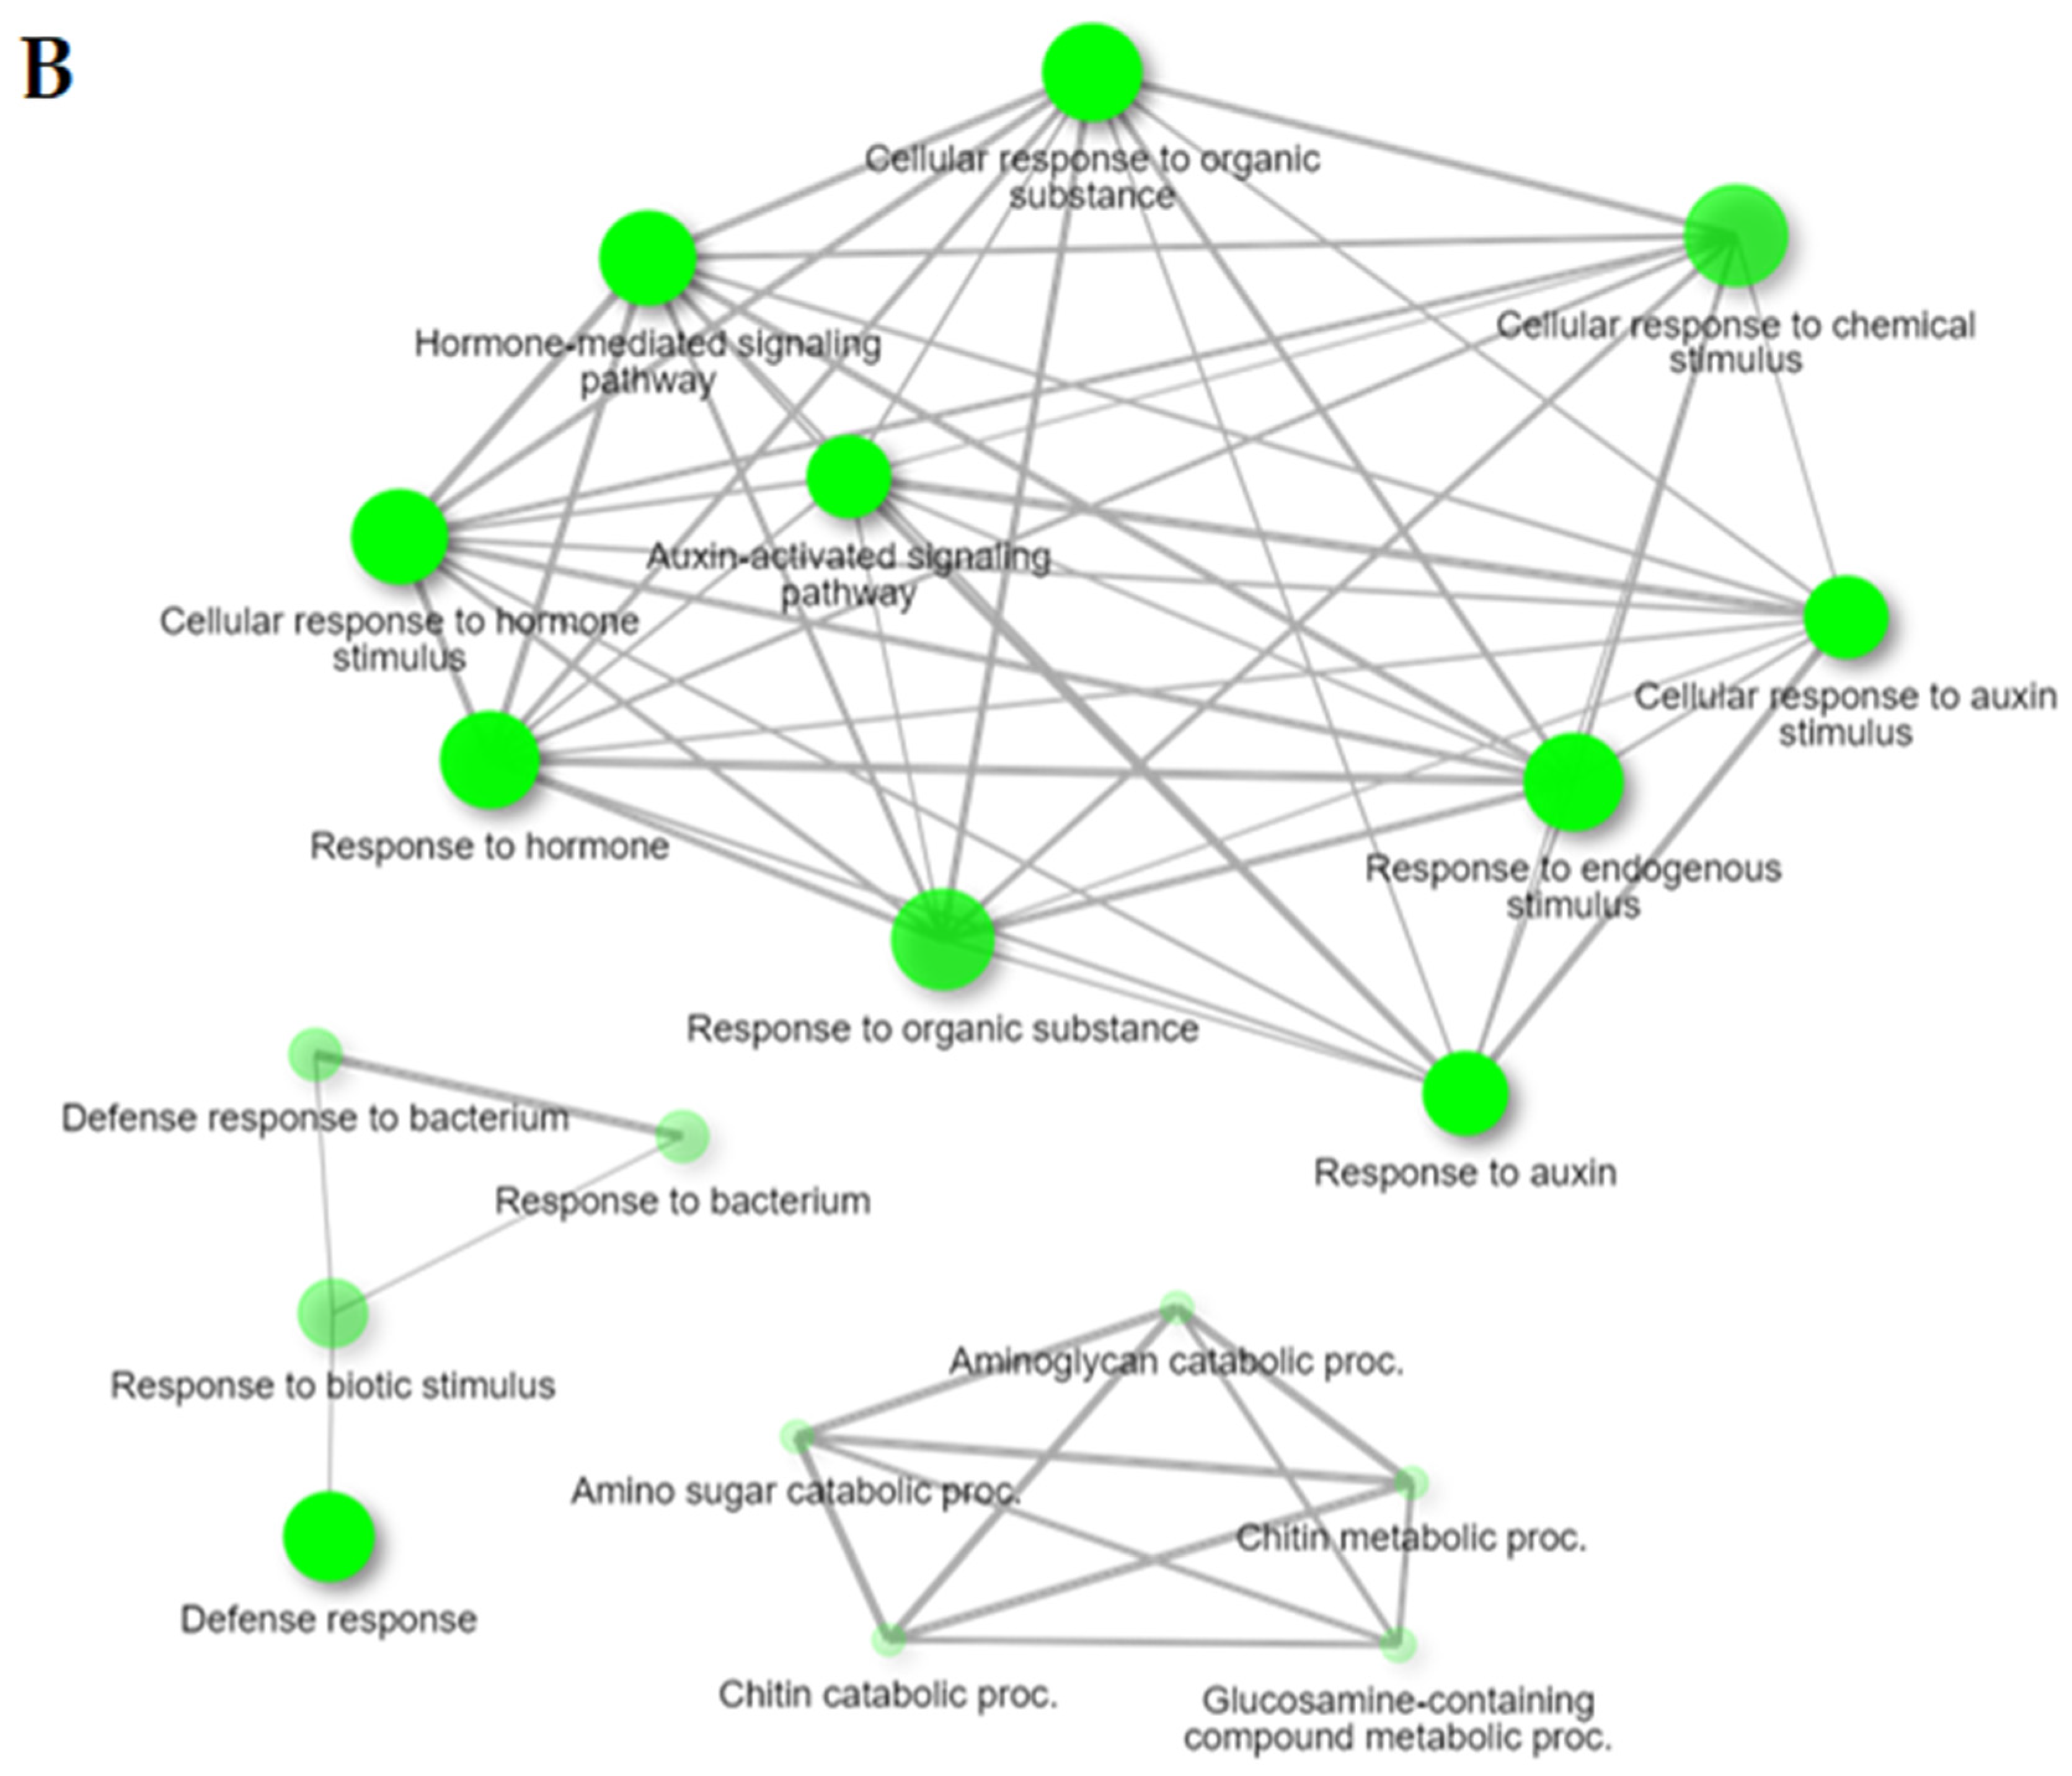
The GO analysis (based on uniquely identified DEGs for each genotype) identified in Bedford were: gene functions involved in biotic stimulus, the defense response to other organisms, immune system process, immune response, defense response, innate immune response, plant type secondary cell wall biogenesis, response to external biotic stimulus, cell wall organization and biogenesis (Figure 3A, Supplementary Table S2). In Council, unique upregulated DEGs have enriched biological processes, GO terms involved in the defense response, the chitin metabolic process, chitin catabolic process, hormone-mediated signaling pathway, response to auxin, response to biotic stimulus, induced systemic resistance, activation of an innate immune response, and the auxin-activated signaling pathway. Protein serine/threonine kinase activity, chitin binding, chitinase activity, and oxidoreductase activity were upregulated in molecular functions after infection compared to susceptible genotypes. Moreover, a cluster of GO terms related to meiotic nuclear division, the meiotic cell cycle process, chromatin assembly, nucleosome assembly, chromosome segregation, chromosome organization, and nuclear division was downregulated after C. cassiicola infection in Council, which indicates that cell division processes might be affected (Figure 3B, Supplementary Table S2).
In susceptible genotypes, the enriched GO terms assigned to unique DEGs were not involved directly with the defense network. The most enriched upregulated biological process GO terms in Henderson were rRNA processing, the RNA metabolic process, and ribosome biogenesis. Likewise, in Pembina, RNA modification, the phenylpropanoid metabolic process, and the lignin metabolic process were the most enriched upregulated GO terms in the biological process (Supplementary Table S2).

2.3. KEGG Pathway Analysis

The KEGG enrichment analysis utilized the DEGs shared by all four genotypes at 24 hpi or 48 hpi against the Glycine max gene background, assigned to 98 pathways; 18 pathways were significantly enriched (FDR—adjusted p ≤ 0.05) [31]. The metabolic pathways (gmx01100), biosynthesis of secondary metabolites (gmx01110), phenylpropanoid biosynthesis (gmx00940), plant hormone signal transduction (gmx04075), starch and sucrose metabolism (gmx00500), MAPK signaling pathway (gmx04016), circadian rhythm (gmx04712), and flavonoid biosynthesis (gmx00941) were prominent pathways in response to C. cassiicola at 24 and 48 hpi across all genotypes. In addition, isoflavonoid biosynthesis, cutin, suberine and wax biosynthesis, fatty acid elongation, glycerolipid metabolism, ascorbate and aldarate metabolism, cyanoamino acid metabolism, thiamine metabolism, carotenoid biosynthesis, nitrogen metabolism, ubiquinone, and other terpenoid-quinone biosynthesis were also enriched (Table 2).
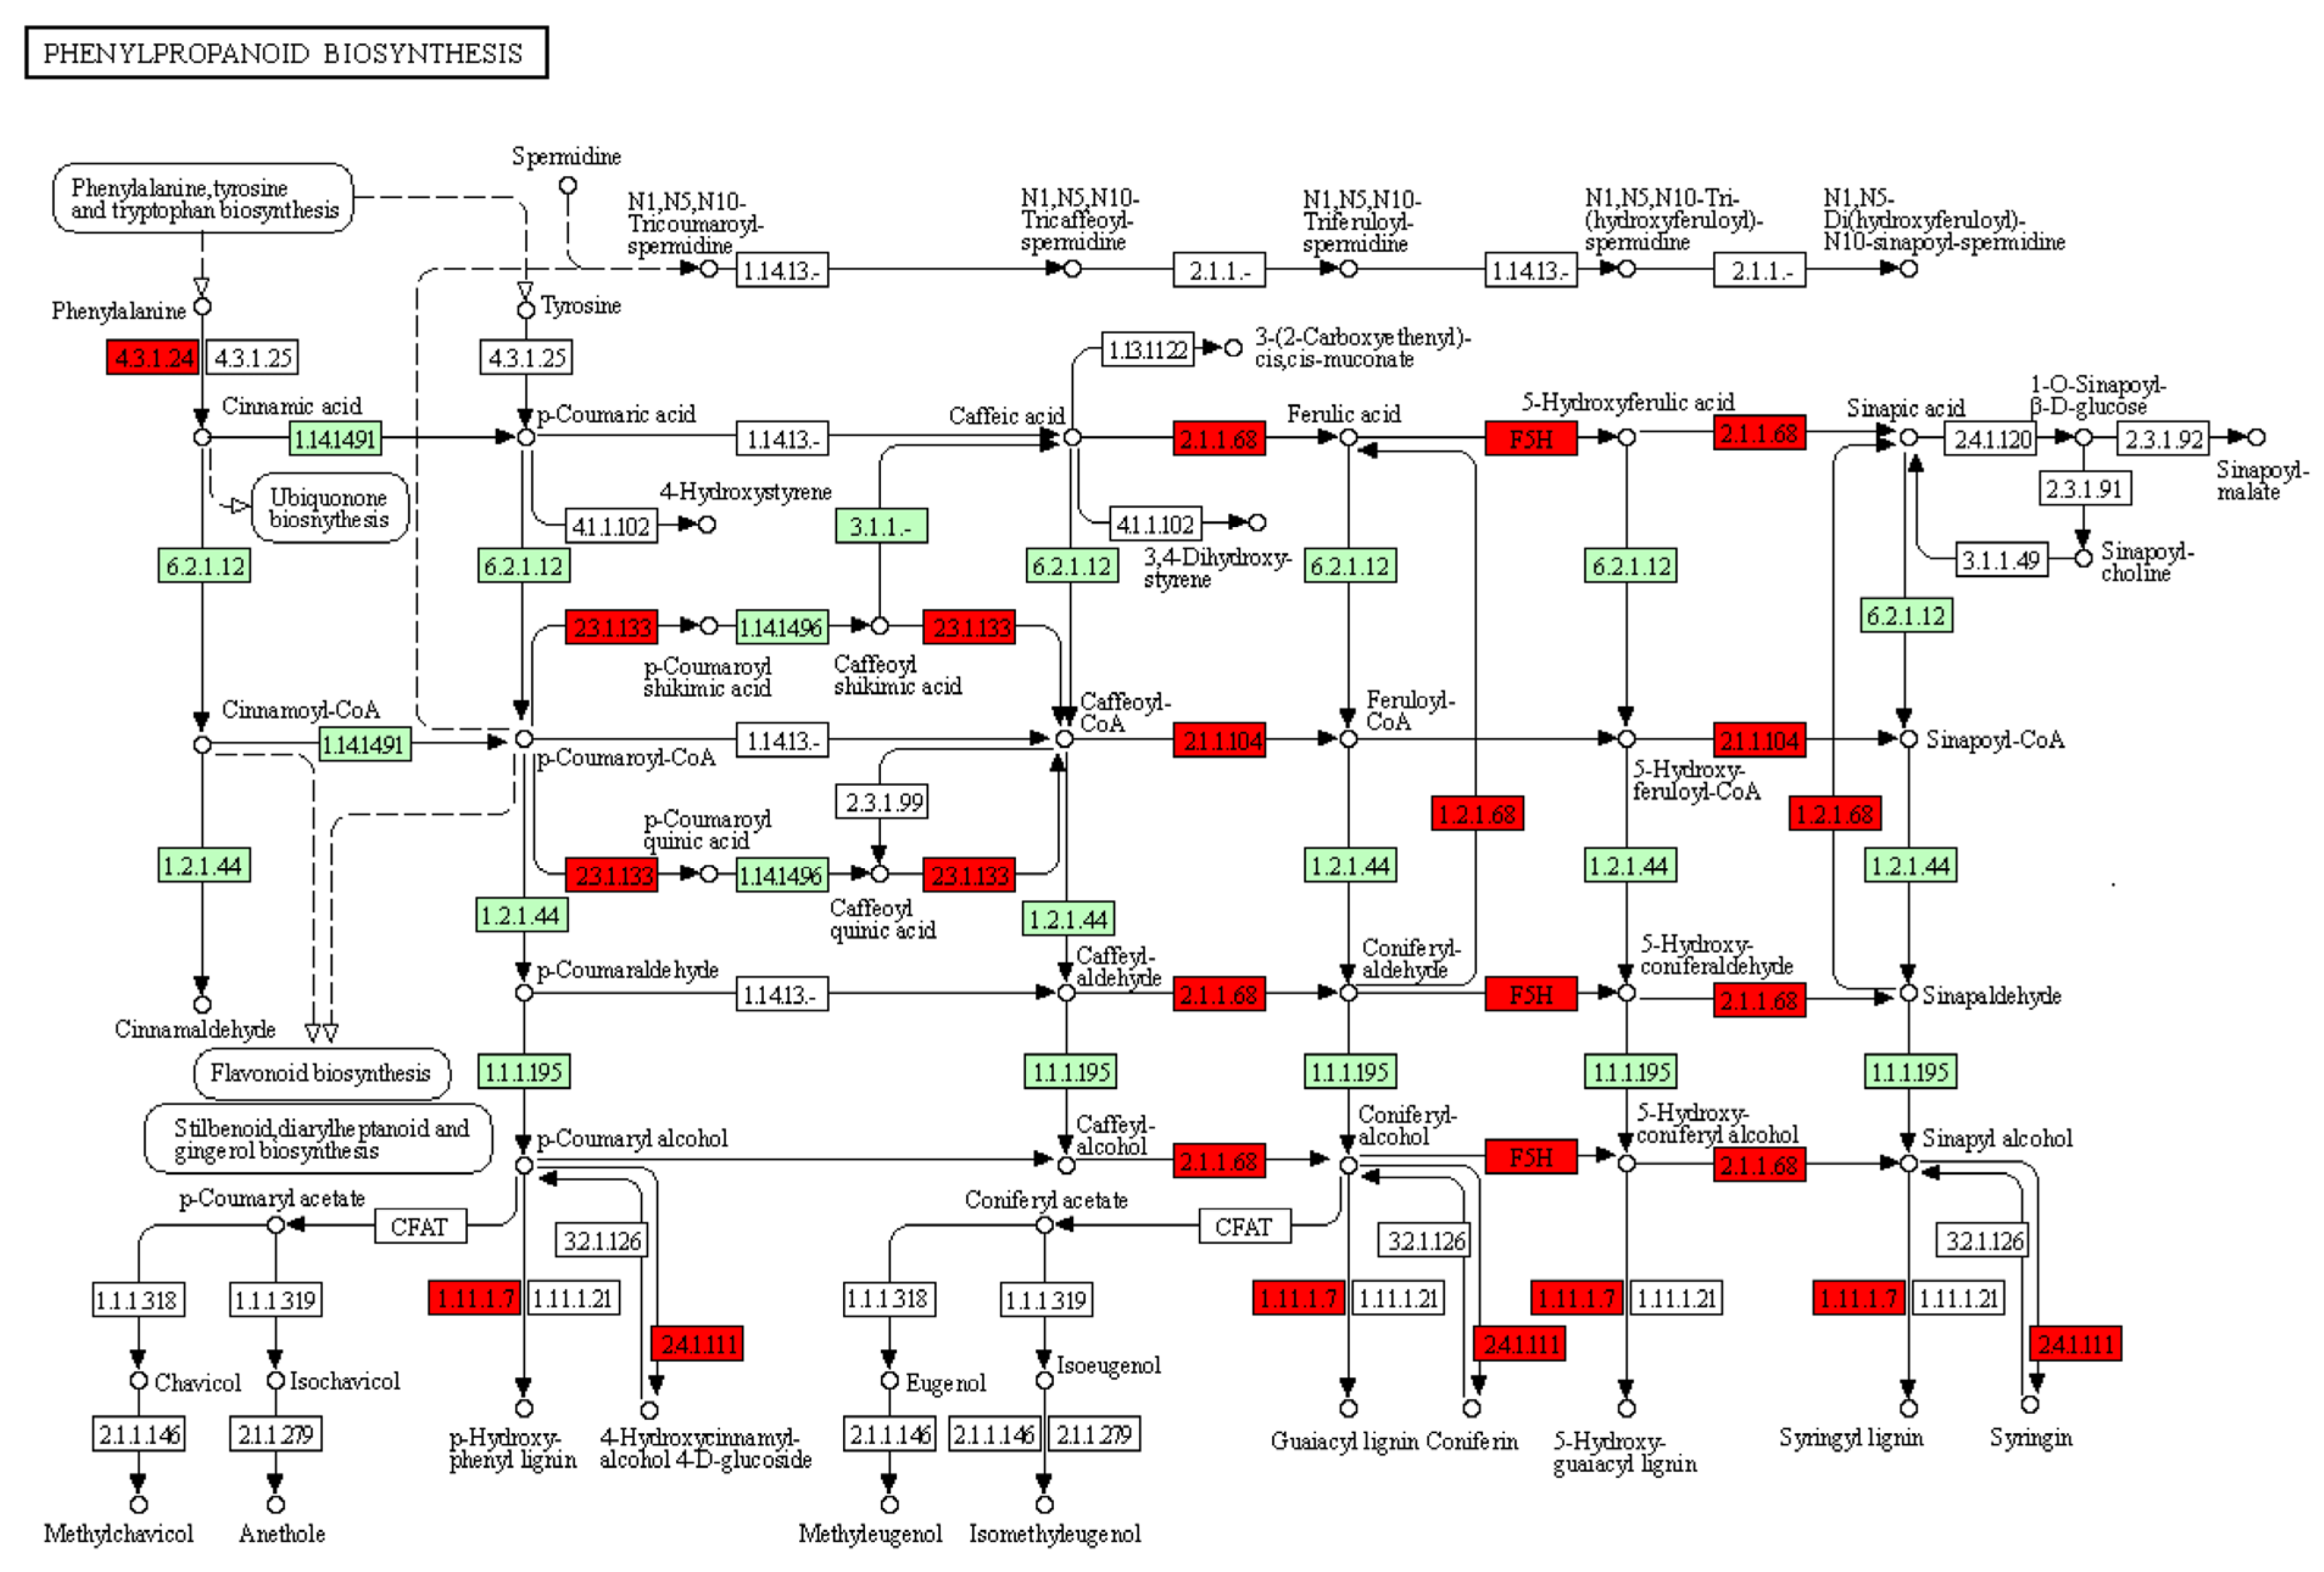
A closer investigation of the phenylpropanoid pathway revealed that many DEGs are involved in the biogenesis of various phenolic and lignin compounds. Figure 4 illustrates the activation of various phenolic polymers and lignin compounds in the phenylpropanoid pathway. The upregulated DEGs were phenylalanine ammonia-lyase (EC:4.3.1.24), caffeate O-methyltransferase (EC 2.1.1.68), coniferyl-aldehyde dehydrogenase (EC:1.2.1.68), shikimate O-hydroxycinnamoyltransferase (EC:2.3.1.133), coniferyl-alcohol glucosyltransferase (EC:2.4.1.111), and 1-cys peroxiredoxin (EC:1.11.1.7). This indicates that these pathways may increase soybean immunity against C. cassiicola (Figure 4).
Several upregulated DEGs were assigned to the biosynthesis of the flavonoid/isoflavonoid pathway: IFS1 (isoflavone synthase 1 precursor), IOMT1 (isoflavone 4′-O-methyltransferase), isoflavone 7-O-methyltransferase (EC:2.1.1.150), isoflavone 7-O-glucoside-6″-O-malonyltransferase (EC:2.3.1.115), isoflavone/4′-methoxyisoflavone 2′-hydroxylase (EC:1.14.14.90; 1.14.14.89), and CYP93A1 (3,9-dihydroxypterocarpan 6A-monooxygenase). Similarly, in the flavonoid biosynthesis pathway, upregulated DEGs were CHS8 (chalcone synthase), shikimate O-hydroxycinnamoyltransferase (EC:2.3.1.133), caffeoyl-CoA O-methyltransferase (EC:2.1.1.104), flavonoid 3′-monooxygenase (EC:1.14.14.82), flavonoid 4′-O-methyltransferase (EC:2.1.1.231), and flavanone 4-reductase (EC:1.1.1.219; 1.1.1.234) (Supplementary Figure S1A,B).

2.4. Identification of Differentially Expressed Transcription Factors (TFs)

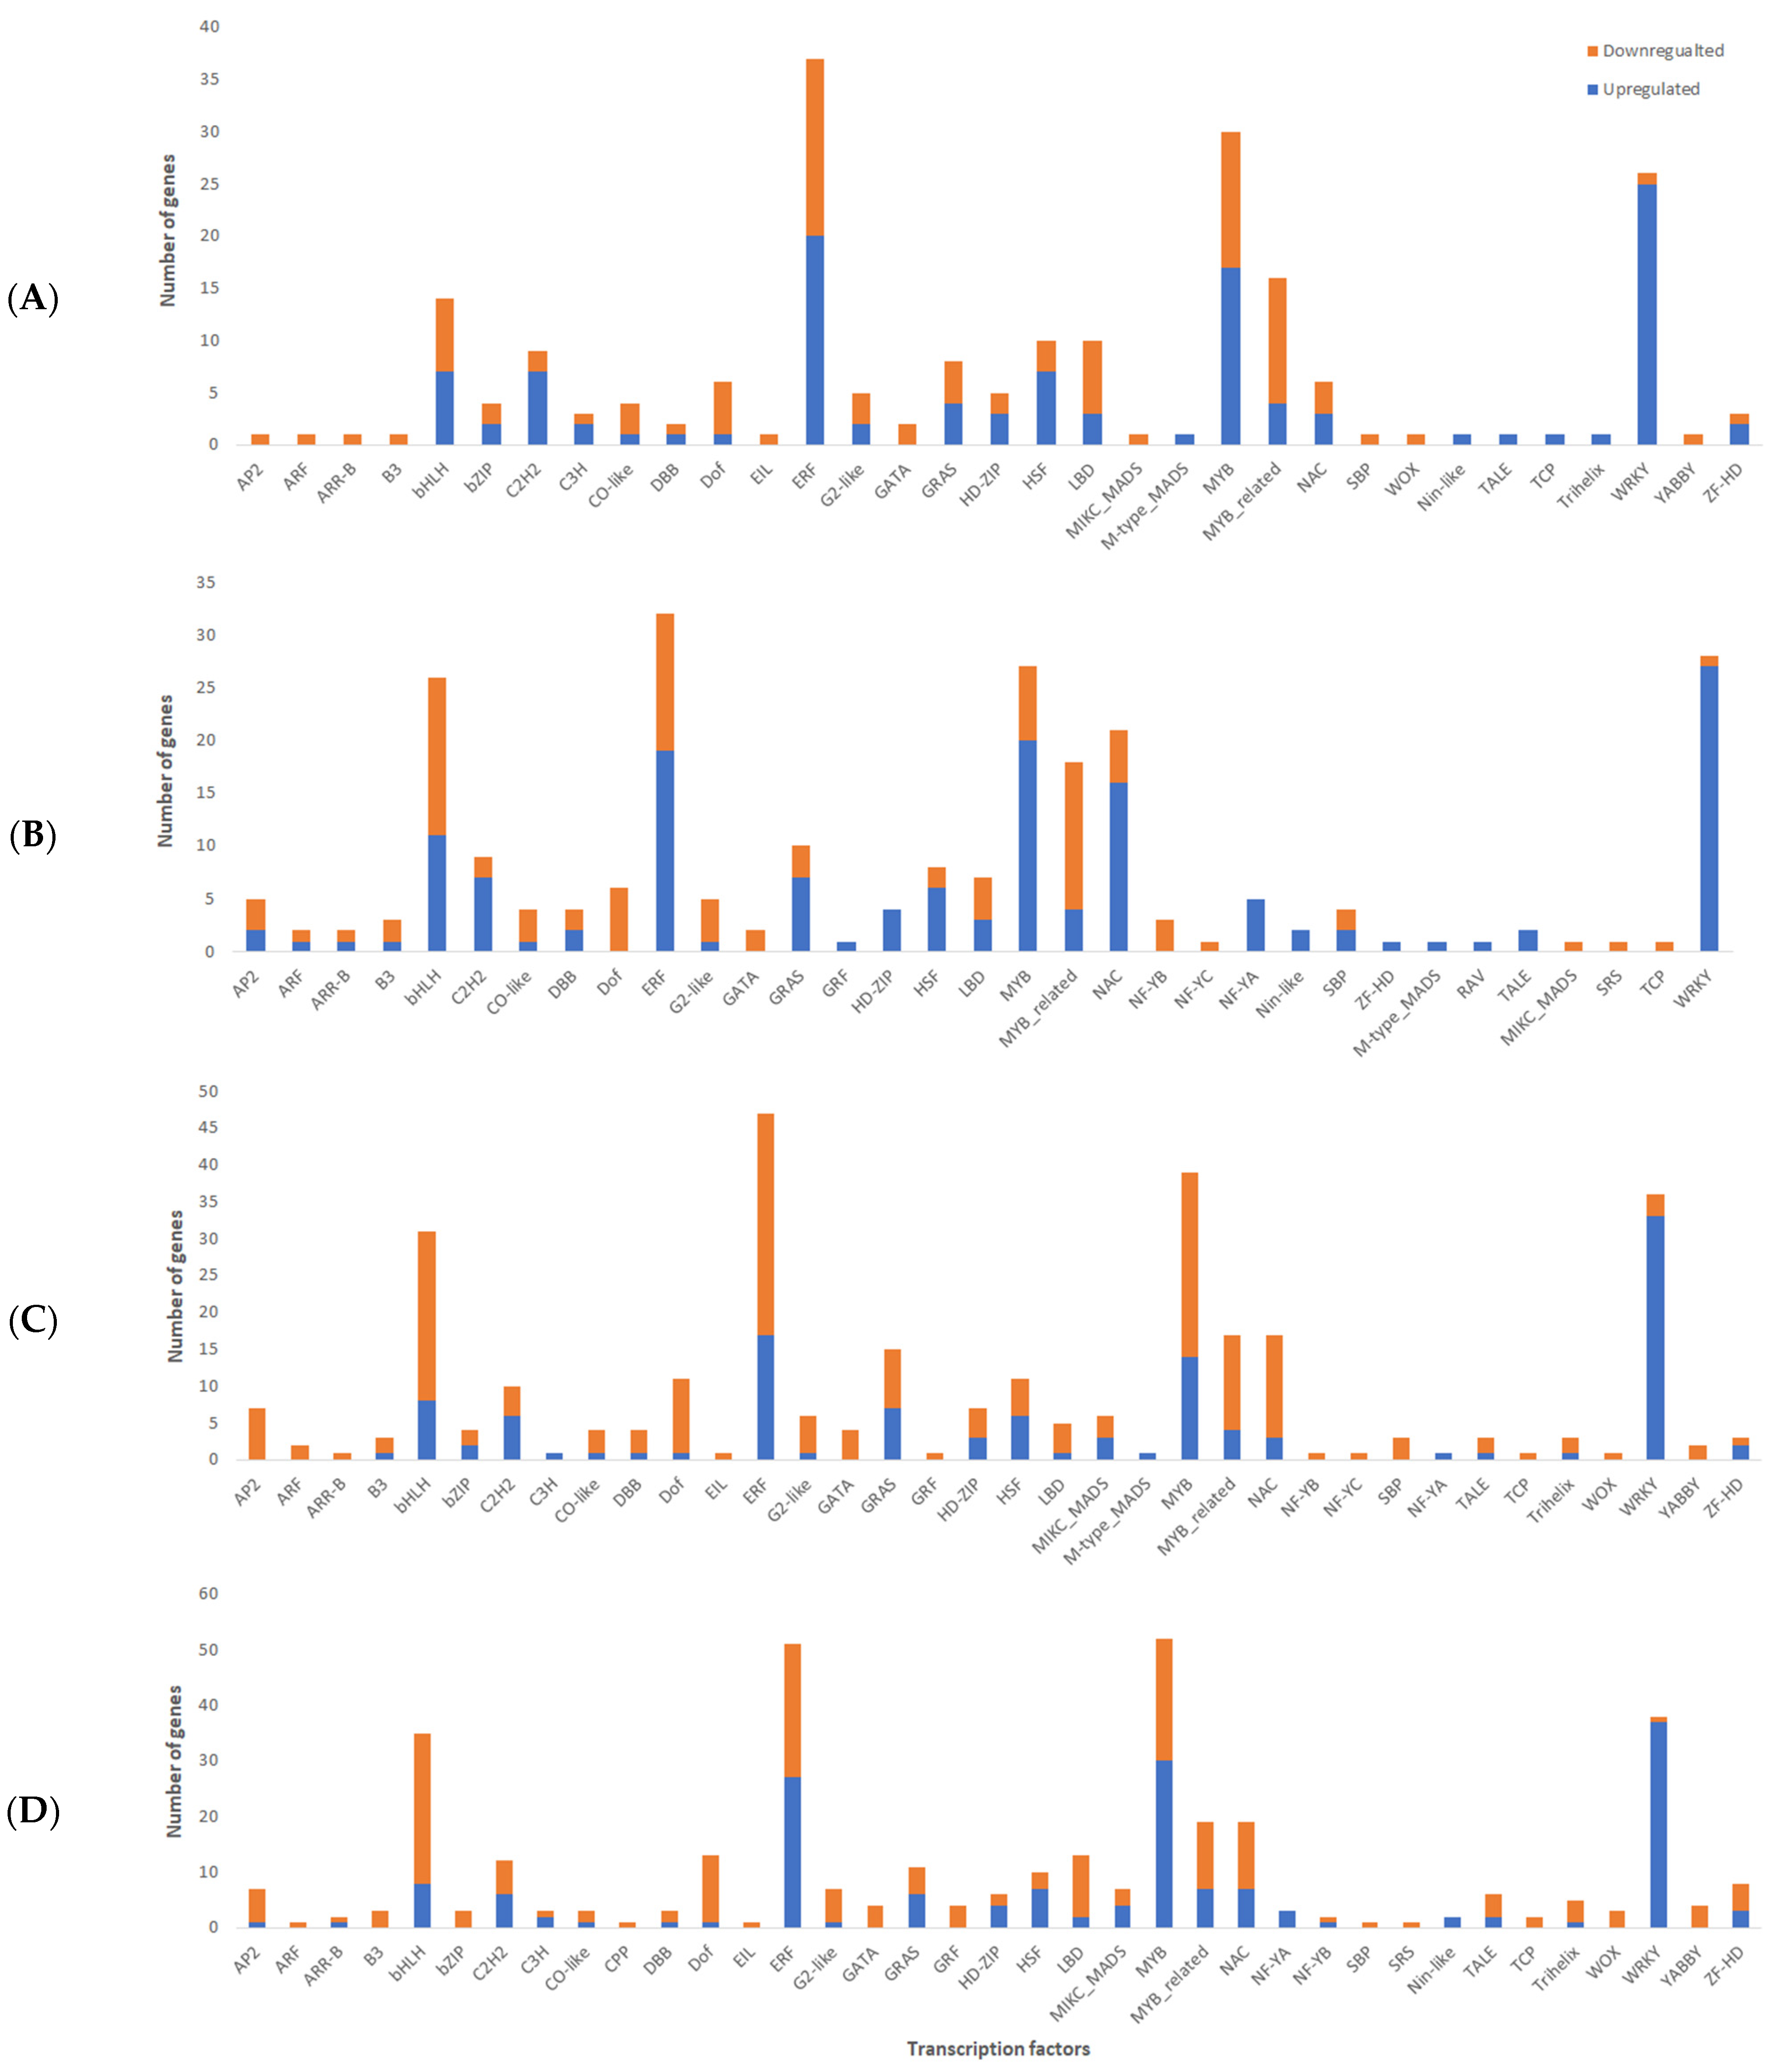
For transcription factors (TF), 574 DEGs were identified in 40 different TF families across all four genotypes. The highest represented TF families are 80 DEGs in ethylene responsive factor (ERFs), 74 MYB, 51 WRKY, 62 bHLH, and 38 NAC. Our study found that WRKY TFs were predominantly upregulated after infection, suggesting that this particular group might have a critical role in response to C. cassiicola (Figure 5). Furthermore, a total of 16 DEGs belonging to the WRKY family were upregulated in all four genotypes after C. cassiicola infection (Figure 5).
In Council, 45 DEGs belonging to 22 TFs families were observed with upregulated TFs distributed between the C2H2 family (3 TFs), WRKY (1 TFs), NAC (1 TFs), MYB (2 TFs), and MYB-related family (1 TFs). In Bedford, 66 genes belonging to 24 TF families were differentially expressed after C. cassiicola infection. Among them, upregulated TFs were distributed in NAC (9 TFs), WRKY (4 TFs), bHLH (4 TFs), ERF (3 TFs), MYB (3 TFs), and MYB-related family (2 TFs). These upregulated TFs may enhance resistance in genotypes against C. cassiicola infection. Interestingly, there was no expression change in these TFs in susceptible genotypes after C. cassiicola infection.

2.5. Quantitative Real-Time Expression Analysis

Comparing the log2 fold change from RNA-Seq analysis for eight differentially expressed genes with qPCR results revealed a positive correlation (r = 0.81) and had consistent expression trends (Figure 6). These results suggest the reliability of RNA-seq in analyzing the transcriptome of resistant and susceptible plants after C. cassiicola infection.

3. Discussion

Target spot, caused by C. cassiicola, is an emerging problematic disease in regions with warm and humid climates; this RNA-Seq study, involving two resistant genotypes (Bedford and Council) and two susceptible genotypes (Pembina and Henderson), sheds light on possible soybean responses to C. cassiicola infection and potential resistance mechanisms. The Illumina sequencing for 36 RNA-Seq libraries generating 94 GB of data was used for further analysis. An average of 25.72 million clean reads per library was obtained, of which 88.76% were mapped to the soybean genome. This indicates that our data are sufficient for conducting DEG analysis to identify defense-related genes and pathways against C. cassiicola.
During their life cycle, soybean plants are attacked by various pathogens (fungi, nematodes, bacteria, and viruses), which impact plant growth and development, ultimately reducing the yield [32]. Plants respond to pathogen attacks by changing their expression of genes, which alters different pathways [33]. The functional analysis of common DEGs in all four genotypes indicated that several genes belonging to biological processes, cellular components, and molecular function were influenced by C. cassiicola infection. Enriched GO terms of interest in all four genotypes altered in response to C. cassiicola infection were: defense response, response to biotic stimulus, cutin biosynthetic process, protein serine/threonine kinase, oxidoreductase activity, and peroxidase activity. These pathways have been highlighted in several plant–pathogen interaction transcriptomic studies such as Athelia (Sclerotium) rolfsii in peanut [34] and Xanthomonas sp. in pepper [35] and tomato [36]. Moreover, upregulated genes only in Bedford and Council after C. cassiicola infection were assigned to the defense response, response to biotic stimulus, and immune response. Additionally, upregulated genes found only in Council (the genotype with the highest level of target spot resistance) exhibit the activation of chitin-binding/catabolic, chitinase activity, the salicylic acid biosynthetic process, hormone-mediated signaling pathway, and protein serine/threonine kinase activity. These unique upregulated DEGs found in the resistant genotypes after infection might contribute to resistance to C. cassiicola. Transcriptome studies involving C. cassiicola infection of rubber found similar activation of the defense response and chitinase activity only in a tolerant clone [27,28].
Fungal invasion of plants triggers two layers of immune defense mechanisms. Transmembrane proteins such as receptor kinases (RLKs) and receptor-like proteins (RLPs) act as pattern-recognition receptors (PRRs), known as host sensors, that allow plants to recognize microbial pathogens, surrounding them through pathogen-associated molecular pattern (PAMP)-triggered immunity (PTI) [37]. This PTI is the first line of defense that restricts pathogen invasion. Effector-triggered immunity (ETI) is the second layer of defense against pathogen attack. This system recognizes the effector proteins that cause local cell death, often called the hypersensitive reaction (HR) in plants [33]. A leucine-rich repeat (LRR) domain is generally present in immune receptors and defense genes of plants. Several genes with the LRR domain were upregulated in all four genotypes after C. cassiicola infection. Specifically, 73 and 33 LRR genes were upregulated in Council and Bedford, while no expression difference was found in susceptible genotypes. These genes found in Council and Bedford were in the disease resistance protein (TIR-NBS-LRR class) family (10, 6), Leucine-rich receptor-like protein kinase family (10, 2), LRR family protein (22, 14), LRR protein kinase family (19, 8), LRR transmembrane protein kinase (10, 3), LRR and NB-ARC domains containing disease resistance protein (1, 0) and the MLLR family (1, 0), respectively.
The most well-known disease-resistant genes (R genes) contain a nucleotide-binding site (NSB) and LRR protein, which helps in the identification of specialized pathogen-associated proteins [38]. These genes can be further classified into proteins with the north terminal toll and interleukin 1 receptor (TIR) domain, coiled-coil (CC) domain, and without any N domain [39]. Interestingly, it was observed that all additional upregulated NBS-LLR genes in Council and Bedford had a TIR domain. Two different TIR-NB-LLRs were identified in Arabidopsis, providing tolerance to Leptosphaeria maculans fungus [40]. Another gene, RLM3, encoding the TIR-NB class, was found to provide immunity to different necrotrophic fungal pathogens in Arabidopsis [41]. Further investigation is needed to understand the role of TIR-NBS-LLR genes in the soybean defense response to C. cassiicola.
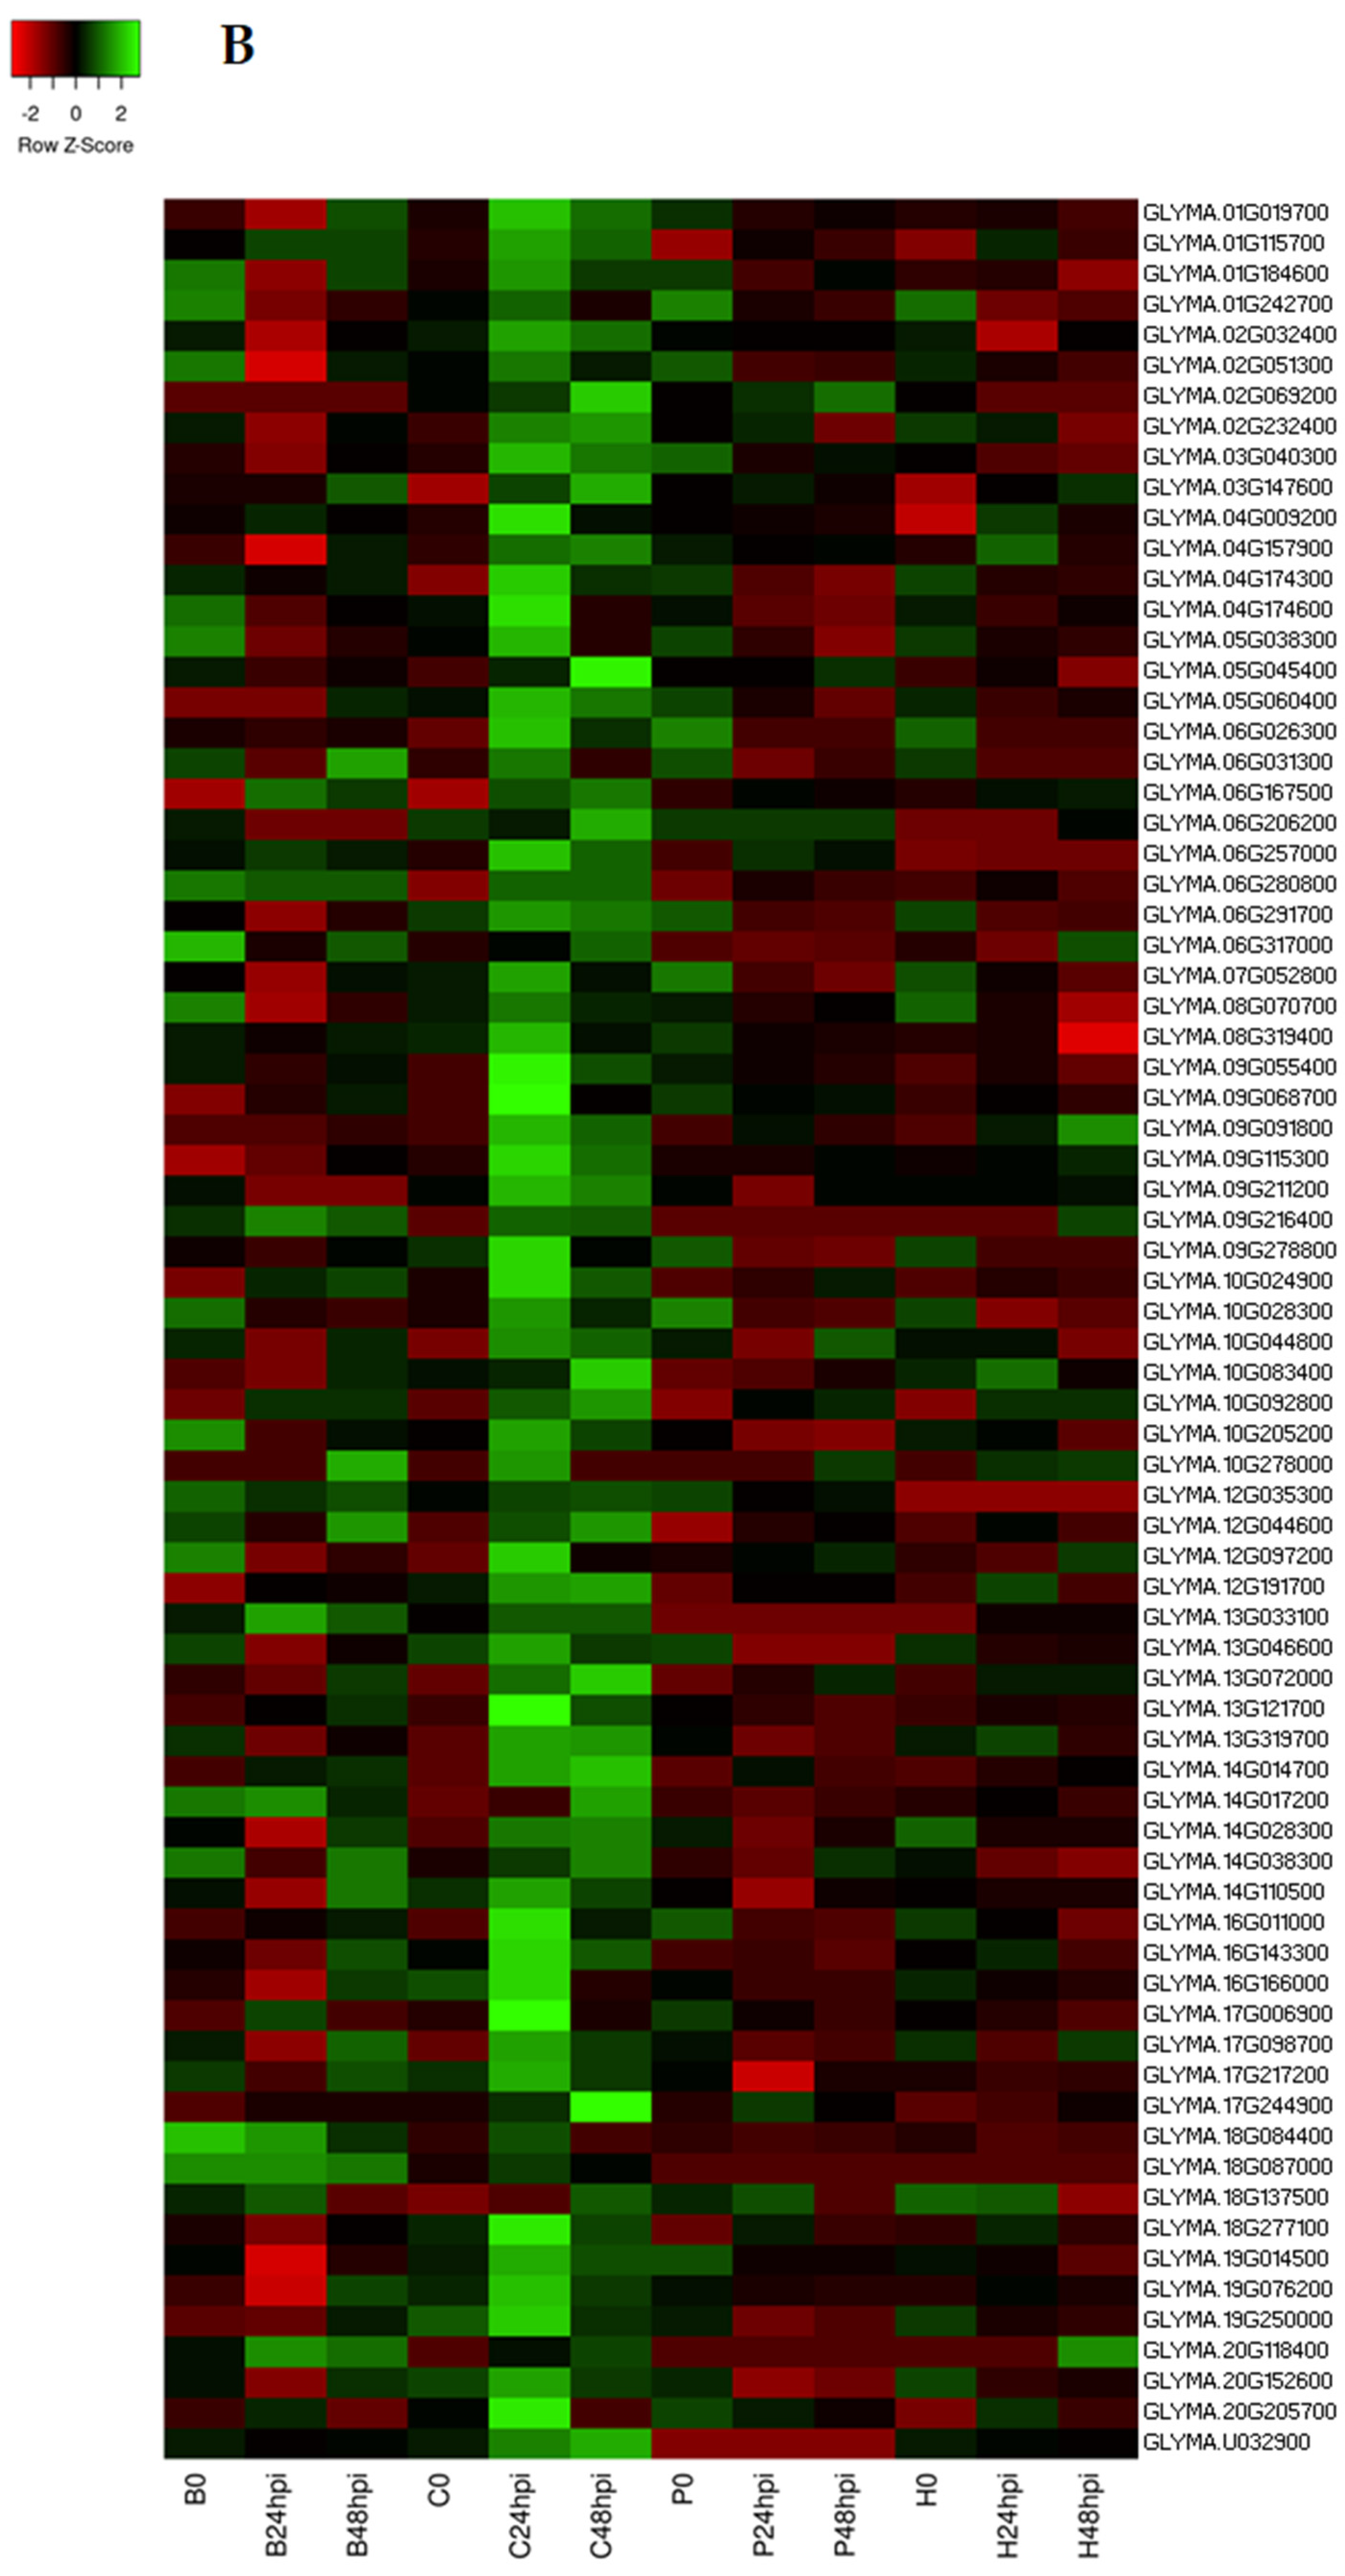
Receptor kinases send downstream signals for an appropriate cellular response to biotic and abiotic stress. Some receptor kinases contain cysteine-rich proteins, known as cysteine-rich receptor-like kinases (CRKs). Genes in the CRK family play important roles in disease resistance by interacting with PAMP and sending defense signaling for an HR-like cell death [42,43,44]. A total of 46 and 42 CRKs genes were upregulated in Council and Bedford, respectively, after C. cassiicola infection. Interestingly, two copies of the CRK 25 gene (Glyma.20g137400 and Glyma.20g139300) were highly upregulated in Bedford and a copy of CRK 4 (Glyma.20g118400) was upregulated in both resistant genotypes but had very low expression at 24 hpi in both susceptible genotypes (Figure 7A,B). CRK 4 is an important receptor protein kinase identified to have a critical role in early PTI response by triggering HR [42,43,44]. This suggests that early activation of CRK genes in resistance genotypes is vital to reducing the colonization of C. cassiicola.
Chitin is a cell wall component of fungi that is not present in the plant cell wall [45]. Chitinase possesses antifungal properties, restricting the growth of many fungal pathogens such as Trichosanthes dioica, Aspergillus niger, Alternaria solani, Fusarium spp., Rhizoctonia solani, and Verticillium dahlia [46,47,48,49]. Chitinase A (Glyma.19G076200) was highly expressed in Council when compared to susceptible genotypes at 24hpi and 48 hpi (Figure 7B). Tobacco plants overexpressing Chitinase A from Autographa californica nuclear polyhedrosis virus showed resistance to fungal pathogens [50]. Thus, higher expression of Chitinase A might reduce in planta colonization of C. cassiicola.
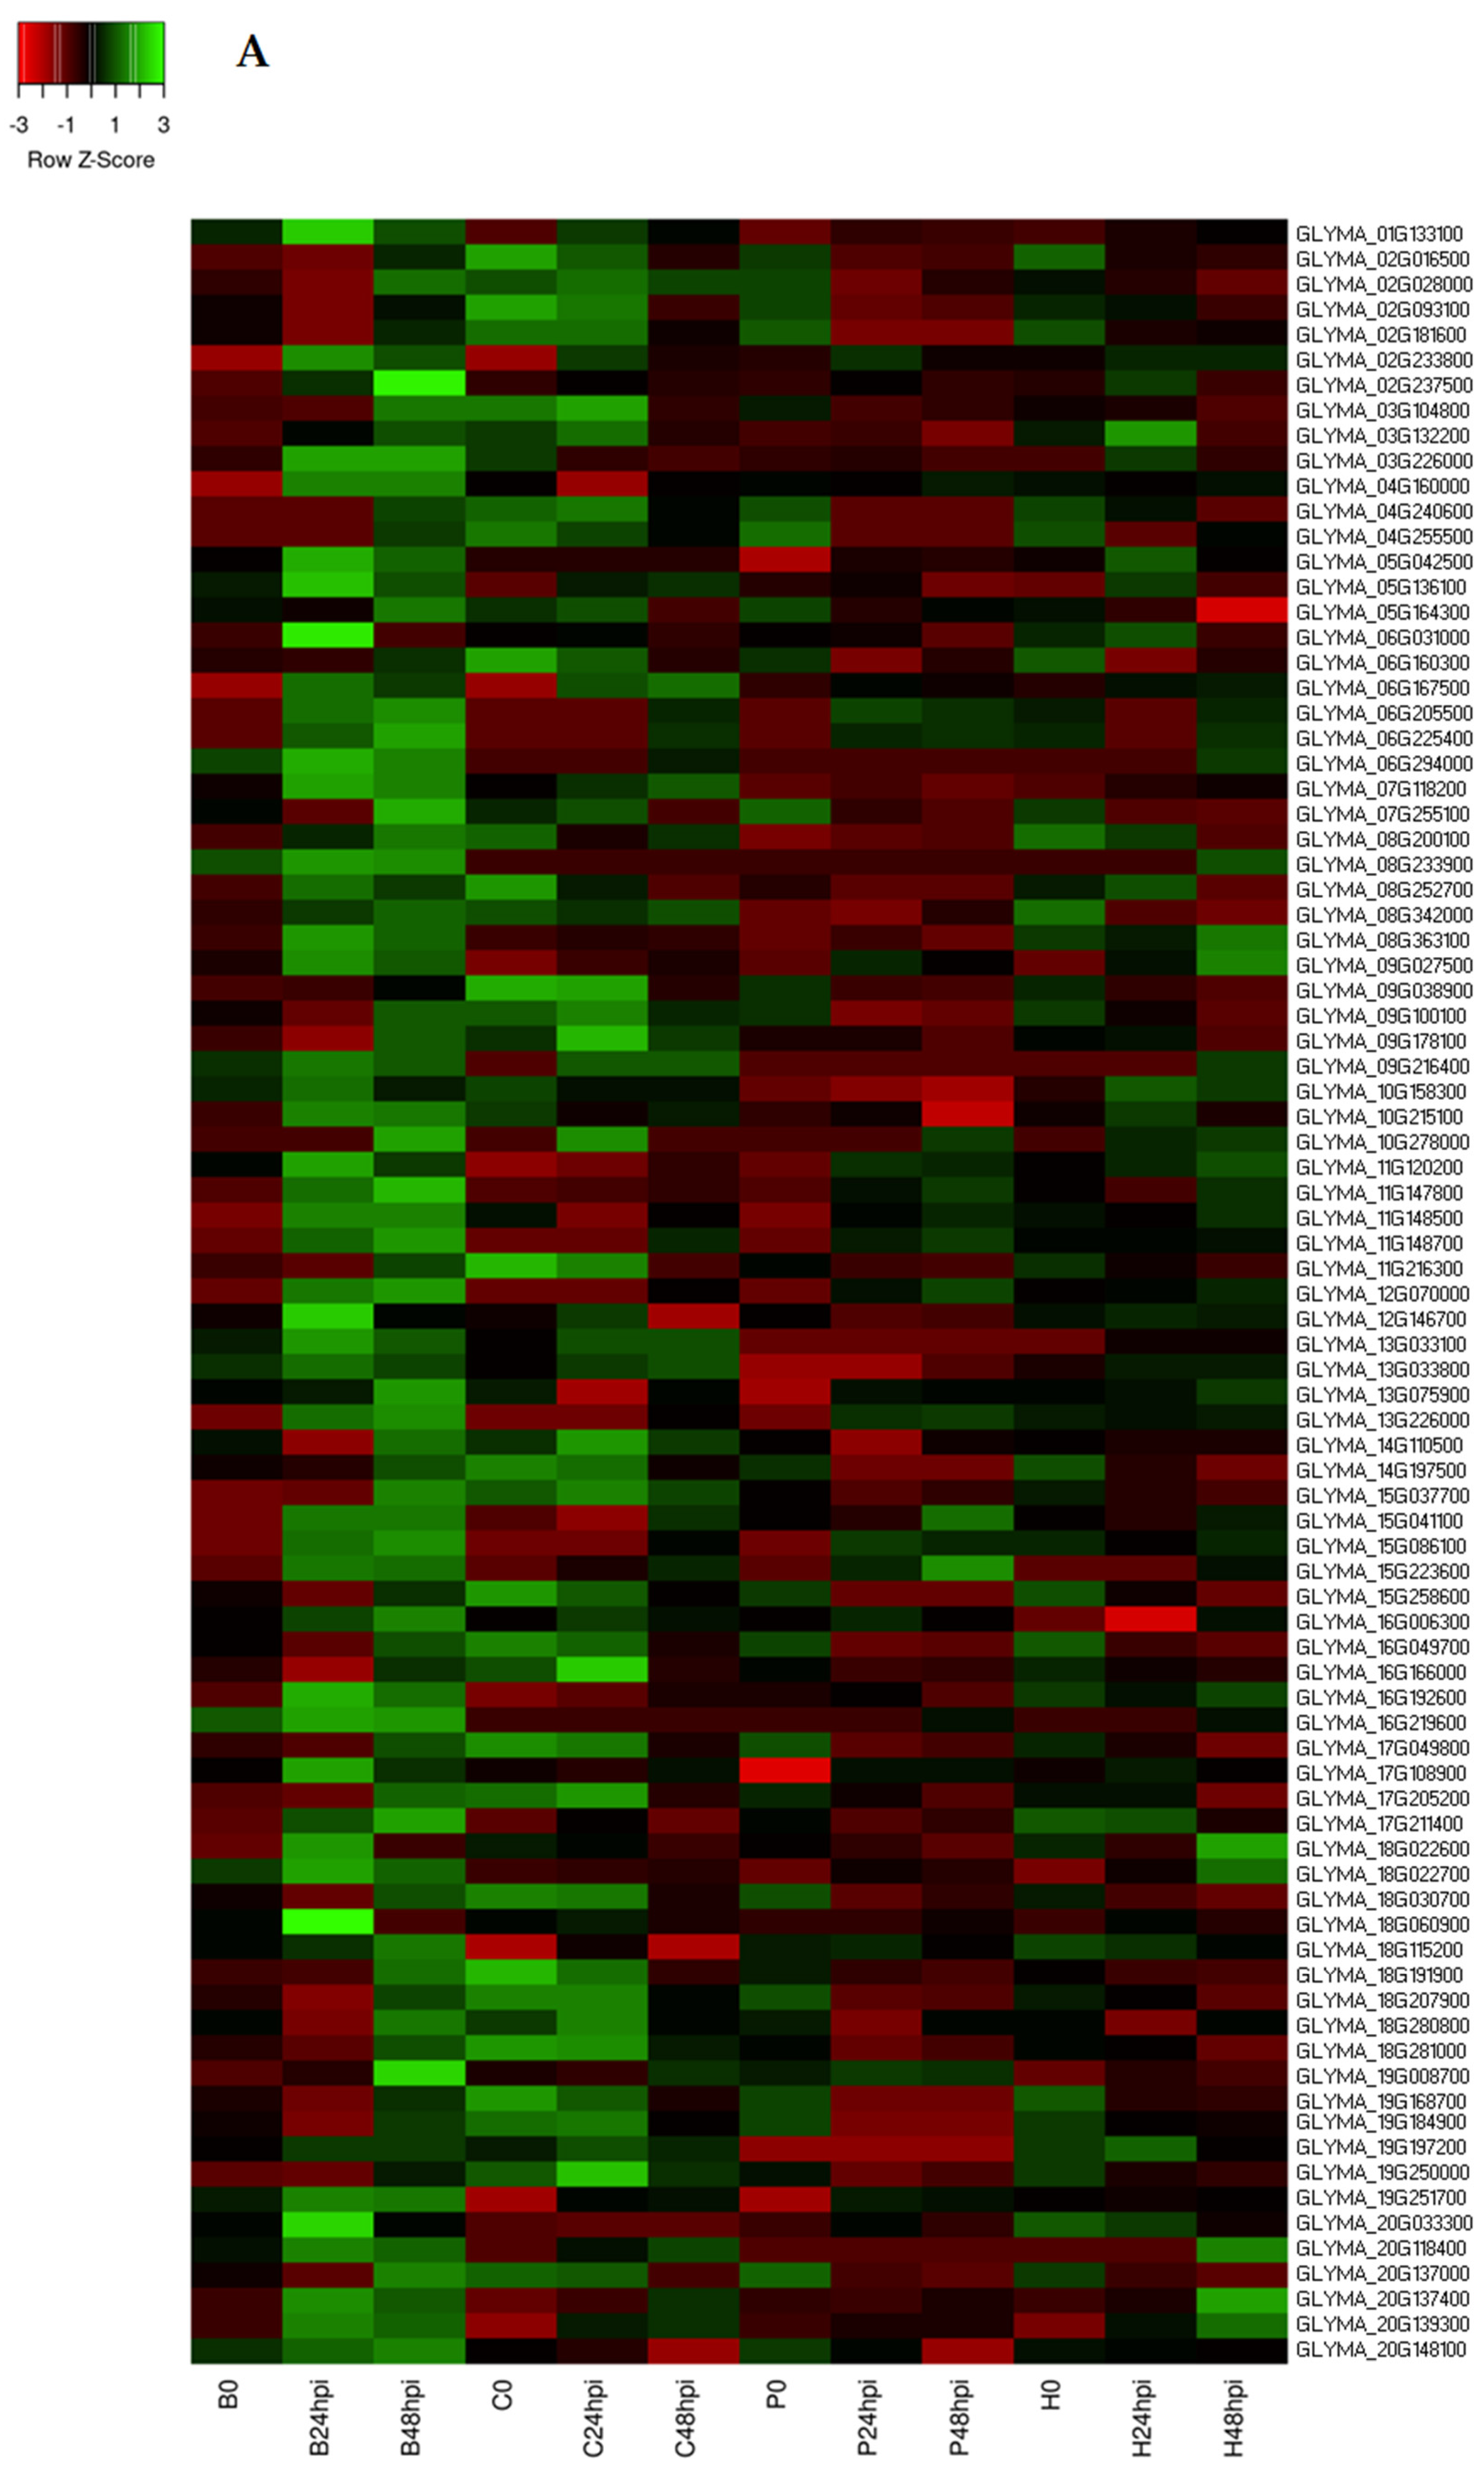
Other defense-related genes were upregulated in resistant genotypes with significantly higher expression than susceptible genotypes at 24 and 48 hpi. In Council, these genes belong to disease-resistance-responsive dirigent-like protein (Glyma.03g147600), B-box zinc finger (Glyma.04g009200), mitogen-activated protein kinase (Glyma.12g097200), cysteine-rich secretory protein (Glyma.16g143300, NPR1), NB-ARC domain-containing disease resistance protein (Glyma.18g084400, RPM1) and Glyma.18g087000, RPM4), receptor serine/threonine kinase (Glyma.13g033100), and serine protease inhibitor (Glyma.20g205700) (Figure 7B). The RPM1 gene provides resistance in A. thaliana against P. syringae [51] and in wheat against Puccinia striiformis [52]. RPM gene families have been identified as major players in the soybean defense mechanism against pathogens and in the stress response [53,54]. Pathogenesis-related proteins (PR) in plants participate in the innate immune system defense response against pathogens. Several studies have found that the NPR1 gene provides resistance to different species of fungus in cotton [55], Arabidopsis [56], and Brassica juncea [57]. In Bedford, these genes belong to wall-associated kinase family protein (Glyma.09g027500), mitogen-activated protein kinase (Glyma.18g060900, MAPK), kunitz trypsin inhibitor 1 (Glyma.08g342000, KTI1), pentatricopeptide repeat (PPR) superfamily protein (Glyma.08g233900), scorpion toxin-like knottin superfamily protein (Glyma.06g160300), cytochrome P450 (Glyma.07g118200 and Glyma.05g042500), receptor serine/threonine kinase (Glyma.13g033100 and Glyma.13g033800), and peroxidase superfamily protein (Glyma.02g233800) (Figure 7A). The transcriptomic study revealed the expression of some DEGs associated with MAPK cascades in response to Xanthomonas oryzae infection in a resistant rice genotype [58]. Moreover, the overexpression of KTI1 in tobacco enhances the resistance to Rhizoctonia solani infection [59]. There is a need to understand the impact of these upregulated genes relative to target spot resistance.
In this study, C. cassiicola infection was associated with diverse plant defense response TF families, such as ERFs, WRKY, MYB, and bHLH. For the WRKY TF family, WRKY29 (Glyma.08G018300) in Council, and WRKY6 (Glyma.08G320200, Glyma.18G092200), WRKY7 (Glyma.17G239200), and WRKY41 (Glyma.19G254800) in Bedford were upregulated after C. cassiicola infection, while in the susceptible genotypes, there was no expression difference between control and infected tissue. Previous studies show that the expression of WRKY29 and WRKY41 TFs increased Fusarium head blight resistance in wheat [60] and Pseudomonas resistance in Arabidopsis [61].
Phenylpropanoid biosynthesis plays an essential role in the plant stress response. This pathway leads to the biogenesis of various phenolic polymers, lignin compounds, and flavonoids, increasing plant immunity [62,63]. The gene coding for phenylalanine ammonia-lyase (PAL), caffeate O-methyltransferase (CCoAOMT), coniferyl-aldehyde dehydrogenase, 1-cys peroxiredoxin, shikimate O-hydroxycinnamoyltransferase, and coniferyl-alcohol glucosyltransferase was found to be upregulated in all four genotypes. This indicates that this pathway might be stimulated early in all genotypes as part of the PTI response. Similar results were observed in the research conducted on rubber tree clones in response to C. cassiicola infection [27]. Moreover, these gene-coding enzymes form syringyl and guaiacyl, units of lignin polymers, which are major building blocks of lignin and end products of lignin biosynthesis. Phenylpropanoid polymer lignin acts as a physical barrier against pathogen invasion [64]. The phenylpropanoid pathway is regulated in stress conditions and associated with the lignification process in Arabidopsis and Populous [65]. Similarly, lignin formation is an essential process for the defense of host plants under both abiotic and biotic stresses [66,67].
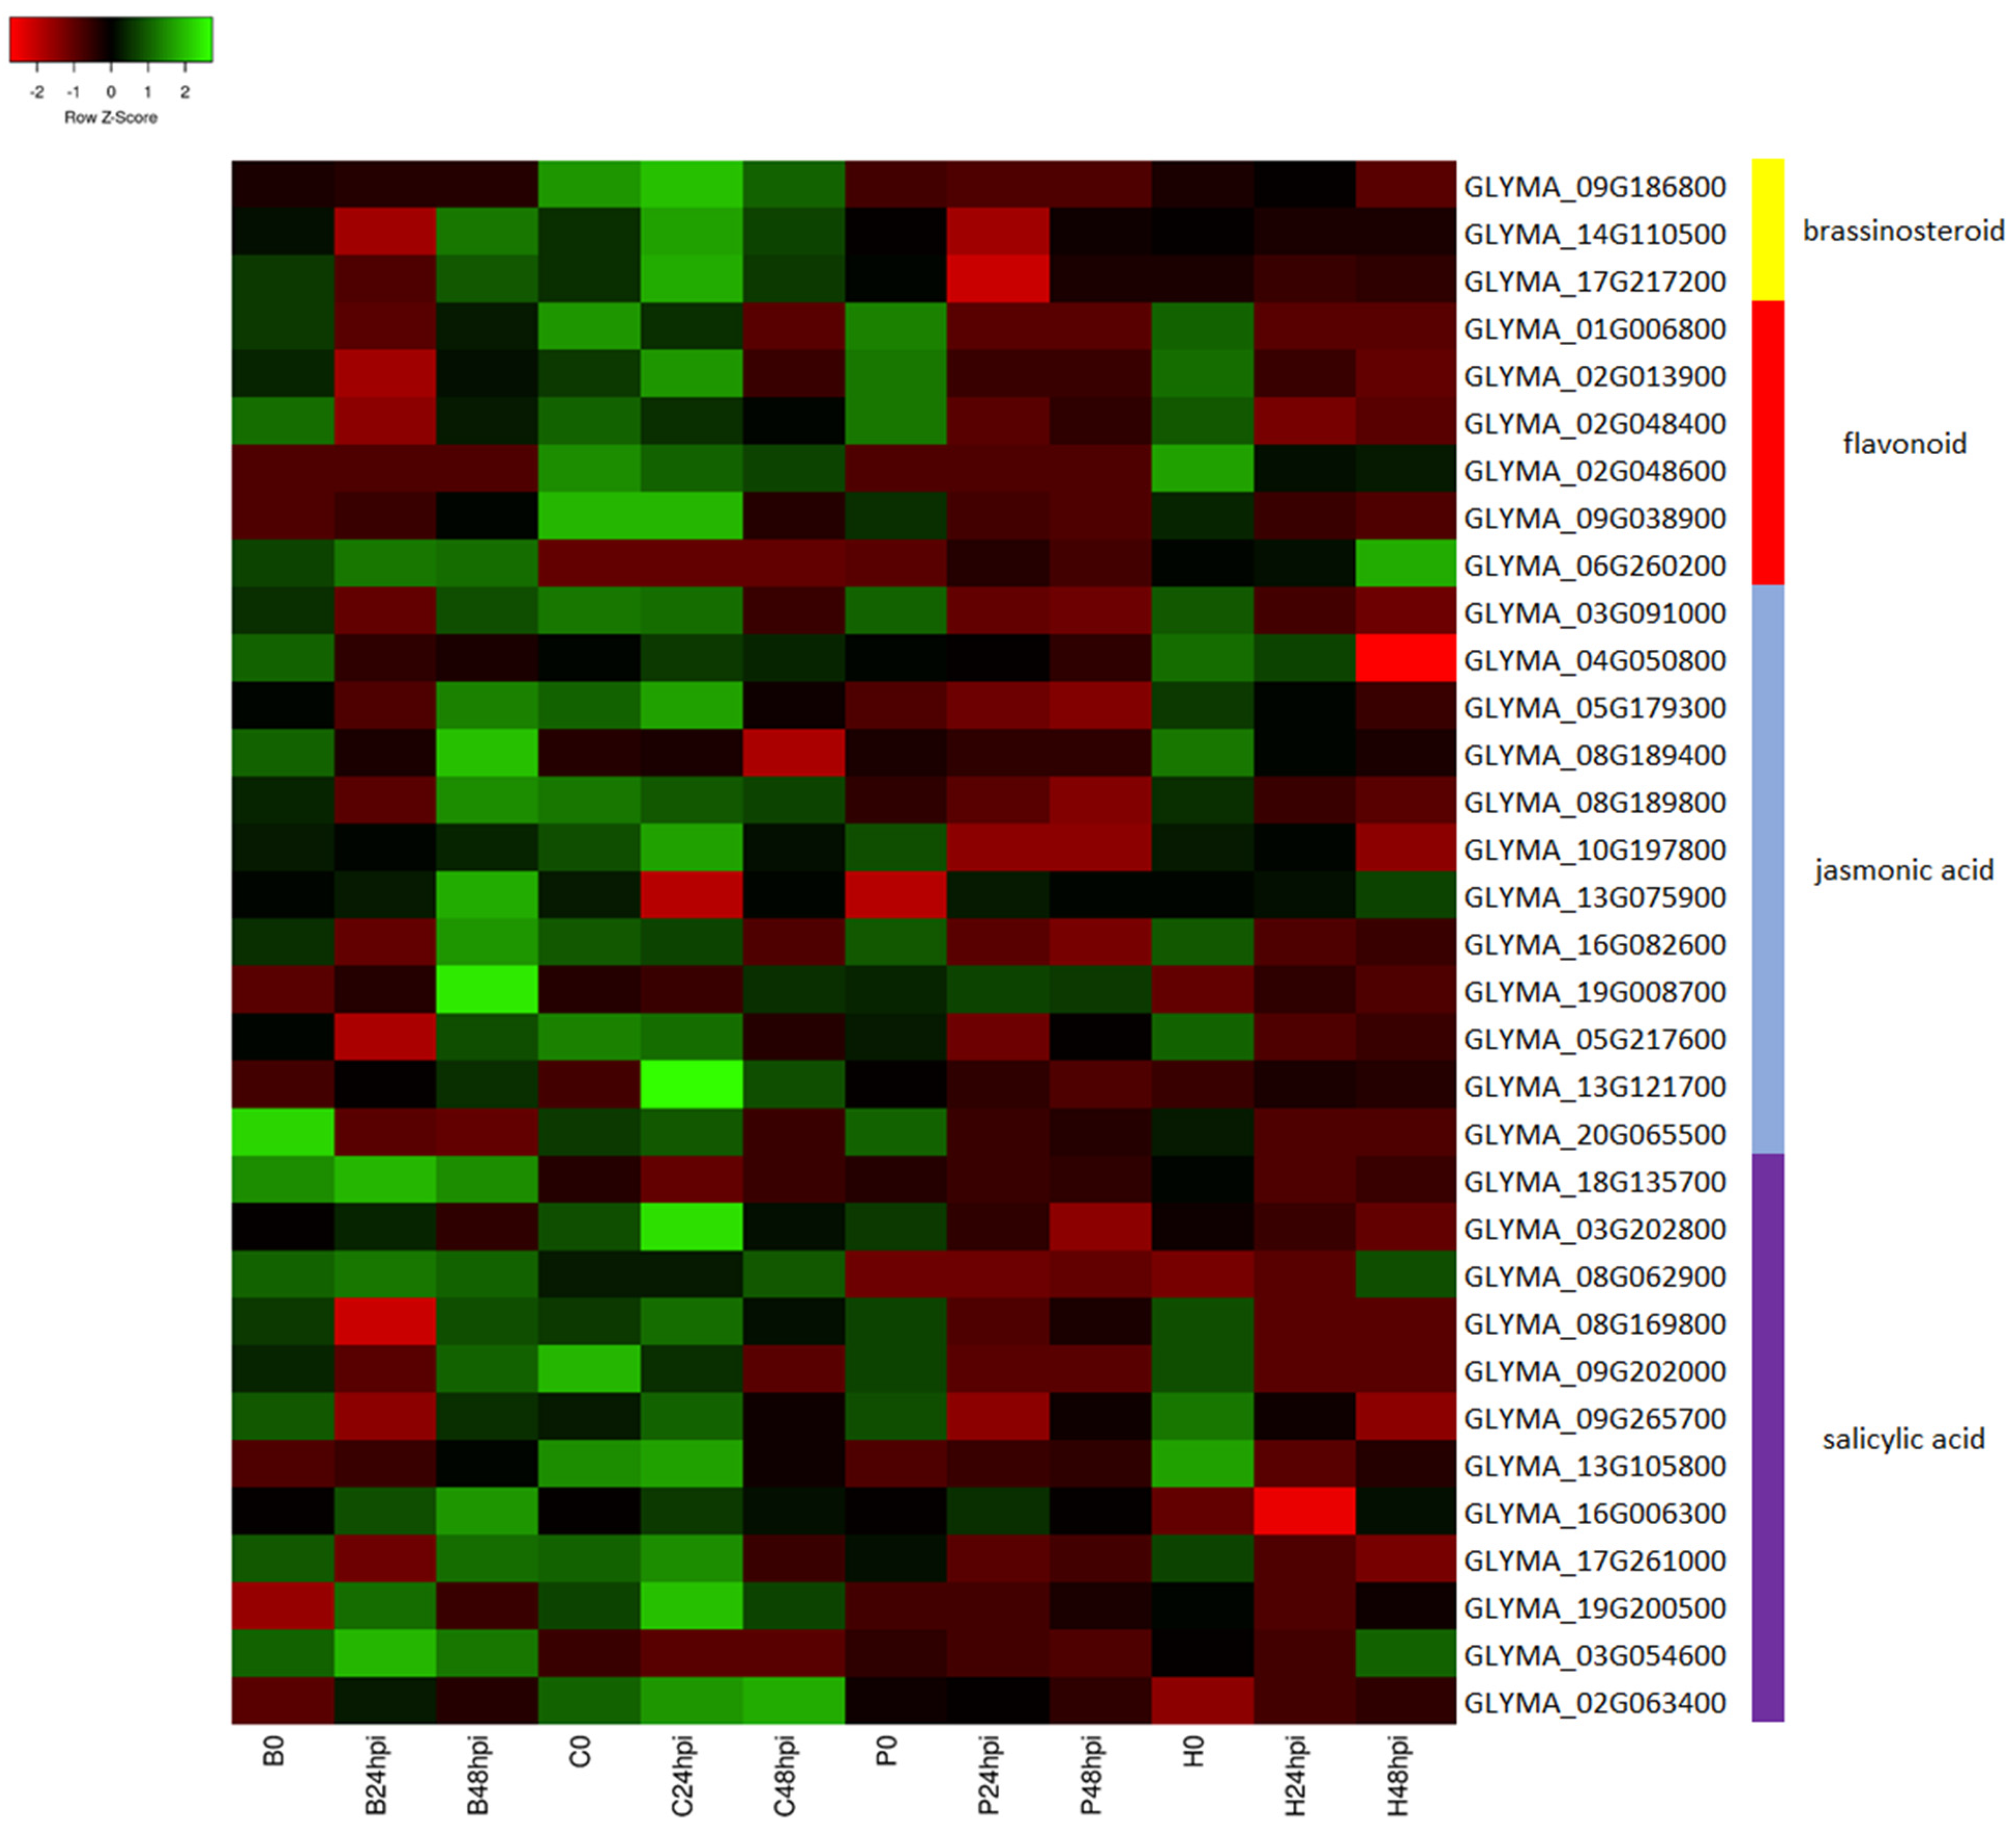
Flavonoid biosynthesis is an essential downstream branch of phenylpropanoid metabolism. The gene expression of chalcone synthase, the key enzyme in the flavonoid pathway, is induced in plants with fungal or bacterial infection [68]. Similarly, isoflavonoids are a mainly legume-specific subclass of flavonoid metabolites with significant roles in plant defense [69]. In the enriched isoflavonoid pathway, three cytochrome families were involved in the biosynthesis process: CYP93C (cytochrome P45093C), CYP81E1/E7, (isoflavone/4′-methoxyisoflavone 2′-hydroxylase) and CYP93A1 (3,9-dihydroxypterocarpan 6A-monooxygenase). These pathways were activated in both resistant and susceptible genotypes in this study, suggesting a common defense pathway activated in soybean plants when attacked by C. cassiicola. Additionally, few genes in the flavonoid biosynthesis pathway were more highly expressed in Council and/or Bedford (Figure 8). In Bedford, two genes, Glyma.09g038900 (MYB111) and Glyma.06g260200 (NAD(P)-linked oxidoreductase), involved in flavonoid biosynthesis were upregulated and more highly expressed than in the susceptible genotypes after infection. Similarly, in Council, four genes involved in flavonoid biosynthesis had higher expression than in susceptible genotypes after infection: Glyma.01g006800 (pectin lyase-like superfamily protein), Glyma.02g013900 (MYB domain protein 12), Glyma.02g048400 (flavanone 3-hydroxylase), and Glyma.02g048600 (flavanone 3-hydroxylase). MYB transcription factors such as MYB12 and MYB111 modulate the production flavonoid pathway by regulating early biosynthesis genes such as chalcone synthase (CHS), chalcone isomerase (CHI), flavanone 3-hydroxylase (F3H), and flavonol synthase1 (FLS1) during normal development stages and in stress conditions [70,71,72,73]. Two different copies of flavanone 3-hydroxylase (F3H) were more highly expressed in Council compared to susceptible genotypes at 24 hpi and 48 hpi. Flavanone 3-hydroxylase (F3H) is responsible for producing different flavonoid compounds. Studies have associated the upregulation of genes with tolerance/resistance to pathogens such as Alternaria solani, Ascochyta rabiei (Pass) Labr., and Xanthomonas oryzae pv. oryzae [74,75,76]. Thus, our study speculates a major role of genes involved in the flavonoid pathway in contributing to resistance to C. cassiicola.
Jasmonic acid (JA), salicylic acid (SA), and brassinosteroids (BRs) are the plant defense hormones activated in the downstream process of PTI and ETI responses [77,78]. In this study, genes associated with the biosynthesis of BRs, JA, and SA were upregulated in resistant genotypes compared to susceptible genotypes after C. cassiicola infection. Three and two genes related to BR biosynthesis were highly expressed after infection in Council and Bedford, respectively (Figure 8). Furthermore, twelve genes for each SA and JA were upregulated in at least one resistant genotype while having lower expression in susceptible genotypes after infection. Such higher expression of genes involved in these defense-related hormones might play a vital role in conferring target spot resistance. Similar results were observed in other transcriptomic studies involving plant host–pathogen interactions [34,79,80].
Quantitative disease resistance (QDR) is a phenomenon wherein many genes with small effects are differentially expressed during the invasion of the pathogen, which results in a reduction in fungal colonization. Pyramiding such small effect genes from the different resistant genotypes would be an effective strategy to develop an enduring disease-resistant variety [81,82]. Studies have demonstrated a higher level of disease resistance by pyramiding such QDRs [83,84]. Further research needs to be conducted to understand the effects of QDRs and genetic gain for disease resistance by pyramiding these QDRs from Bedford and Council into a single germplasm. This would also help to develop germplasm with broad-spectrum resistance as QDR generally participates in defense mechanisms against a wide range of microbial pathogens and multiple races [82,85].

4. Materials and Methods

4.1. Plant Materials and Inoculation

The experiment was performed using two resistant soybean genotypes, ‘Council (PI 587091)’ and ‘Bedford (PI 548974)’, and two susceptible genotypes, ‘Henderson (PI 665225)’ and ‘Pembina (PI 638510)’, which were selected based on a screening study conducted [9]. In the greenhouse, soybean seeds were sown in twelve separate 11.5 × 11.5 cm2 pots filled with PRO-MIX BX (Premier Tech Horticulture, Quakertown, PA, USA). Plants were watered as needed under a photoperiod of 14/10 (light/dark) and a thermocycle of 24 °C/12 °C for 25 days (growth stage V3–V4) before fungal infection. An isolate of C. cassiicola (LIM01) was grown on V8 agar plates for twelve days at 28 °C with 12/12 h of light/dark in an incubator and then conidia were scraped into sterile distilled water and filtered with cheesecloth to make a conidial suspension with a concentration of 50,000 per mL [9]. Plants were sprayed with 0.05% of a Tween 20 solution and allowed to dry for 5 min before inoculation. The freshly prepared conidial suspension was sprayed onto the axial and abaxial leaf sides using a fine mist professional spray bottle (Spray Pro) until run-off. Afterward, inoculated plants were transferred into a plastic mist chamber inside the greenhouse with a non-inoculated control of each genotype (sprayed with distilled water). Plants were arranged in a completely randomized design (CRD) in the mist chamber; the mist ran for 2 s every 10 min for three days to maintain high humidity [9].

4.2. RNA Extraction, Library Preparation, and Illumina Sequencing

Three biological replicates from all four genotypes at 24 and 48 h post-inoculation (hpi), and their respective controls, were selected for RNA isolation. RNA was extracted from 100–150 mg tissue samples using the Direct-zol RNA Mini-Prep Kit (Zymo Research, Irvine, CA, USA) and the concentration was estimated using a Nanodrop 2000 spectrophotometer (ThermoFisher Sci., Waltham, MA, USA). The RNA degradation was evaluated using agarose gel electrophoresis and intact RNA was sent for RNA sequencing (RNA-Seq). Novo gene Bioinformatics Technology Co., Ltd., Sacramento, CA, USA, performed cDNA library construction of 36 samples (4 genotypes × 3 treatments × 3 replicates) and 150 bp paired-end sequencing run on an Illumina NovaSeq 6000 (Illumina Inc., San Diego, CA, USA). Data were released after a read quality check for a percentage of reads containing N > 10% (N represents the base that cannot be determined) and low-quality reads (Q score ≤ 5).

4.3. RNA-Seq Data Analysis

An additional quality check of raw reads was performed using fastp software v0.23.1 [86] to remove adapters, Poly A sequences, low-quality reads (Q < 30), and reads < 15 bp in length after trimming. These cleaned reads were mapped to the soybean (Glycine max (L.) Merr.) reference genome [13], and transcript quantification was performed using Salmon ver.0.9.1 [87]. A total of eight comparisons, which include 24 hpi vs. control and 48 hpi vs. control for all four genotypes, were performed to identify differentially expressed genes (DEGs) using R-package DESeq2 (Version 1.37.6) [88]. The genes with an absolute value of log2 fold change ≥2 (upregulated genes) or ≤−2 (downregulated genes) and a false discovery rate (FDR) < 0.01 were considered significant DEGs.

4.4. GO Enrichment and KEGG Pathway Analysis

Gene ontology functional enrichment (GO) analysis for the DEGs was conducted using ShinyGo v 0.76 [89] with Glycine max as the background. Gene ontology provided annotations at cellular, molecular, and biological levels. The function categories of enriched GO terms were considered significant with an FDR-adjusted p ≤ 0.05.
KEGG pathway analysis of DEGs was carried out using KOBAS v 3.0 software [31] with Glycine max sequences as the background, a hypergeometric test, and Bonferroni FDR correction (FDR p ≤ 0.05). This analysis tests the statistical enrichment of DEGs in KEGG pathways.

4.5. Identification of Transcription Factors (TFs)

PlantTFDB (http://planttfdb.gao-lab.org/ (accessed on 10 January 2022)) was used to identify transcription factors involved in regulating the soybean response after C. cassiicola infection, containing 58 plant transcription factor (TF) families from 165 plants [90]. The analysis was conducted using the TF enrichment tool and soybean (G. max) transcription factor database, which contains 6150 TFs (3747 loci) distributed into 57 families. TFs were searched in differentially expressed genes at 24 hpi or 48 hpi for each genotype.

4.6. Quantitative Real-Time PCR Validation

Quantitative real-time PCR (qRT-PCR) was performed for the relative expression of selected eight DEGs to validate RNA-Seq data. All of the eight randomly selected gene sequences were retrieved from Soybase (https://soybase.org/ (accessed on 5 July 2022)). RNA extraction was conducted as described above, and cDNA synthesis was carried out using a qScript™ cDNA Synthesis Kit (New England Biolabs, Inc., Ipswich, MA, USA). Primers were designed using the Primer-BLAST tool [91] and listed in Supplementary Table S3. The qRT-PCR was performed with the Thermo Fisher Scientific Biosystems StepOnePlus™ Real-Time PCR system (Applied Biosystem, MA, USA) using PerfeCTa SYBR Green ROX FastMix (Quantabio). The following conditions were used for amplification: 2 min at 95 °C followed by 40 cycles of 5 s at 95 °C and 10 s at 58 °C plus melting curves to verify PCR products. The gene expression level of selected genes was calculated with the 2−ΔΔCT method [92], and the ubiquitin-conjugating protein endogenous control was used to normalize the variance among samples.

5. Conclusions

This study presents the first large-scale comparative transcriptomic profiling of resistant and susceptible soybean genotypes in response to the invasion of the necrotrophic fungus C. cassiicola. The results revealed a complex and massive gene network response, providing insight into mechanisms directing resistance to C. cassiicola in soybean. The analysis suggests that the TIR-NBS-LRR, LRR, NB-ARC, CRKLs, and DIR genes play an essential role in understanding pathogen invasion through a downstream resistance mechanism. Furthermore, genes involved in flavonoid/isoflavonoid, phenylpropanoid, JA, SA, and BA are upregulated upon C. cassiicola attack, thereby inducing systemic resistance.

Supplementary Materials

The following supporting information can be downloaded at: https://www.mdpi.com/article/10.3390/ijms241310563/s1.

Author Contributions

Conceptualization, S.P., J.P. and J.K.; methodology, S.P., J.P., J.K. and K.B.; data analysis S.P., K.S., N.H. and J.P.; supervision, J.K.; writing—original draft preparation, S.P.; writing—review and editing, S.P., J.K., K.B., J.P., K.S. and N.H.; funding acquisition, J.K. All authors have read and agreed to the published version of the manuscript.

Funding

The Alabama Soybean Producers (Cultivar development grant) and USDA-NIFA Hatch funds provided funding for this project.

Institutional Review Board Statement

Not applicable.

Informed Consent Statement

Not applicable.

Data Availability Statement

The data presented in this study are available on request to the corresponding author.

Conflicts of Interest

The authors declare no conflict of interest.

References

  1. USDA. World Agricultural Production. Available online: https://apps.fas.usda.gov/psdonline/circulars/production.pdf (accessed on 30 July 2021).
  2. Hartman, G.L.; Rupe, J.C.; Sikora, E.J.; Domier, L.L.; Davis, J.A.; Steffey, K.L. (Eds.) Compendium of Soybean Diseases and Pests; Am Phytopath Society: St. Paul, MN, USA, 2015. [Google Scholar]
  3. Godoy, C.V. Target spot. In Compendium of Soybean Diseases and Pests; Hartman, G.L., Rupe, J.C., Sikora, E.J., Domier, L.L., Davis, J.A., Steffey, K.L., Eds.; Am Phytopath Society: St. Paul, MN, USA, 2015; pp. 62–63. [Google Scholar]
  4. Faske, T. Arkansas Soybeans: Target Spot—What Do We Know? Available online: https://agfax.com/2016/11/02/arkansas-soybeans-target-spot-what-do-we-know/ (accessed on 12 March 2019).
  5. Koenning, S.; Creswell, T.; Dunphy, E.; Sikora, E.; Mueller, J. Increased occurrence of target spot of soybean caused by Corynespora cassiicola in the Southeastern United States. Plant Dis. 2006, 90, 974. [Google Scholar] [CrossRef]
  6. Duan, Y.; Xin, W.; Lu, F.; Li, T.; Li, M.; Wu, J.; Wang, J.; Zhou, M. Benzimidazole-and QoI-resistance in Corynespora cassiicola populations from greenhouse-cultivated cucumber: An emerging problem in China. Pestic. Biochem. Physiol. 2019, 153, 95–105. [Google Scholar] [CrossRef] [PubMed]
  7. Xavier, S.A.; Canteri, M.G.; Barros, D.; Godoy, C.V. Sensitivity of Corynespora cassiicola from soybean to carbendazim and prothioconazole. Trop. Plant Pathol. 2013, 38, 431–435. [Google Scholar] [CrossRef] [Green Version]
  8. de Mello, F.E.; Lopes-Caitar, V.S.; Prudente, H.; Xavier-Valencio, S.A.; Franzenburg, S.; Mehl, A.; Marcelino-Guimaraes, F.C.; Verreet, J.-A.; Balbi-Peña, M.I.; Godoy, C.V. Sensitivity of Cercospora spp. from soybean to quinone outside inhibitors and methyl benzimidazole carbamate fungicides in Brazil. Trop. Plant Pathol. 2021, 46, 69–80. [Google Scholar] [CrossRef]
  9. Patel, S.; Bowen, K.; Patel, J.; Koebernick, J. Evaluating target spot (Corynespora cassiicola) resistance in soybean (Glycine max (L.) Merrill) in a controlled environment. Crop Prot. 2022, 159, 106018. [Google Scholar] [CrossRef]
  10. Amaral, D.O.J.d.; Lima, M.M.d.A.; Resende, L.V.; Silva, M.V.d. Differential gene expression, induced by salicylic acid and Fusarium oxysporum f. sp. lycopersici infection, in tomato. Pesqui. Agropecuária Bras. 2008, 43, 1017–1023. [Google Scholar] [CrossRef] [Green Version]
  11. Wang, Z.; Gerstein, M.; Snyder, M. RNA-Seq: A revolutionary tool for transcriptomics. Nat. Rev. Genet. 2009, 10, 57–63. [Google Scholar] [CrossRef]
  12. Van Verk, M.C.; Hickman, R.; Pieterse, C.M.; Van Wees, S.C. RNA-Seq: Revelation of the messengers. Trends Plant Sci. 2013, 18, 175–179. [Google Scholar] [CrossRef] [Green Version]
  13. Schmutz, J.; Cannon, S.B.; Schlueter, J.; Ma, J.; Mitros, T.; Nelson, W.; Hyten, D.L.; Song, Q.; Thelen, J.J.; Cheng, J. Genome sequence of the palaeopolyploid soybean. Nature 2010, 463, 178–183. [Google Scholar] [CrossRef] [Green Version]
  14. Miraeiz, E.; Chaiprom, U.; Afsharifar, A.; Karegar, A.; Drnevich, J.M.; Hudson, M.E. Early transcriptional responses to soybean cyst nematode HG Type 0 show genetic differences among resistant and susceptible soybeans. Theor. Appl. Genet. 2020, 133, 87–102. [Google Scholar] [CrossRef]
  15. Kofsky, J.; Zhang, H.; Song, B.-H. Novel resistance strategies to soybean cyst nematode (SCN) in wild soybean. Sci. Rep. 2021, 11, 7967. [Google Scholar] [CrossRef] [PubMed]
  16. Lin, F.; Zhao, M.; Baumann, D.D.; Ping, J.; Sun, L.; Liu, Y.; Zhang, B.; Tang, Z.; Hughes, E.; Doerge, R.W. Molecular response to the pathogen Phytophthora sojae among ten soybean near isogenic lines revealed by comparative transcriptomics. BMC Genom. 2014, 15, 18. [Google Scholar] [CrossRef] [Green Version]
  17. Lanubile, A.; Muppirala, U.K.; Severin, A.J.; Marocco, A.; Munkvold, G.P. Transcriptome profiling of soybean (Glycine max) roots challenged with pathogenic and non-pathogenic isolates of Fusarium oxysporum. BMC Genom. 2015, 16, 1089. [Google Scholar] [CrossRef] [Green Version]
  18. Kim, K.H.; Kang, Y.J.; Kim, D.H.; Yoon, M.Y.; Moon, J.-K.; Kim, M.Y.; Van, K.; Lee, S.-H. RNA-Seq analysis of a soybean near-isogenic line carrying bacterial leaf pustule-resistant and-susceptible alleles. DNA Res. 2011, 18, 483–497. [Google Scholar] [CrossRef] [Green Version]
  19. DeMers, L.C.; Redekar, N.R.; Kachroo, A.; Tolin, S.A.; Li, S.; Saghai Maroof, M. A transcriptional regulatory network of Rsv3-mediated extreme resistance against Soybean mosaic virus. PLoS ONE 2020, 15, e0231658. [Google Scholar] [CrossRef] [Green Version]
  20. Dong, H.; Shi, S.; Zhang, C.; Zhu, S.; Li, M.; Tan, J.; Yu, Y.; Lin, L.; Jia, S.; Wang, X. Transcriptomic analysis of genes in soybean in response to Peronospora manshurica infection. BMC Genom. 2018, 19, 366. [Google Scholar] [CrossRef] [PubMed] [Green Version]
  21. McCabe, C.E.; Cianzio, S.R.; O’Rourke, J.A.; Graham, M.A. Leveraging RNA-Seq to characterize resistance to Brown stem rot and the Rbs3 locus in soybean. Mol. Plant-Microbe Interact. 2018, 31, 1083–1094. [Google Scholar] [CrossRef] [PubMed] [Green Version]
  22. Chee, K.H. Studies of sporulation, pathogenicity and epidemiology of Corynespora cassiicola on Hevea rubber. J. Not. Rubb. Res. 1988, 3, 21–29. [Google Scholar]
  23. Conner, K.; Hagan, A.; Zhang, L. First report of Corynespora cassiicola-incited target spot on cotton in Alabama. Plant Dis. 2013, 97, 1379. [Google Scholar] [CrossRef]
  24. Blazquez, C. Corynespora leaf spot of cucumber. Proc. Fla. State Hortic. Soc. 1967, 80, 177. [Google Scholar]
  25. Wang, X.; Zhang, D.; Cui, N.; Yu, Y.; Yu, G.; Fan, H. Transcriptome and miRNA analyses of the response to Corynespora cassiicola in cucumber. Sci. Rep. 2018, 8, 7798. [Google Scholar] [CrossRef] [PubMed]
  26. Liu, D.; Xin, M.; Zhou, X.; Wang, C.; Zhang, Y.; Qin, Z. Expression and functional analysis of the transcription factor-encoding Gene CsERF004 in cucumber during Pseudoperonospora cubensis and Corynespora cassiicola infection. BMC Plant Biol. 2017, 17, 96. [Google Scholar] [CrossRef] [PubMed] [Green Version]
  27. Ribeiro, S.; Label, P.; Garcia, D.; Montoro, P.; Pujade-Renaud, V. Transcriptome profiling in susceptible and tolerant rubber tree clones in response to cassiicolin Cas1, a necrotrophic effector from Corynespora cassiicola. PLoS ONE 2021, 16, e0254541. [Google Scholar] [CrossRef]
  28. Roy, C.B.; Liu, H.; Rajamani, A.; Saha, T. Transcriptome profiling reveals genetic basis of disease resistance against Corynespora cassiicola in rubber tree (Hevea brasiliensis). Curr. Plant Biol. 2019, 17, 2–16. [Google Scholar] [CrossRef]
  29. Fortunato, A.A.; Debona, D.; Bernardeli, A.M.; Rodrigues, F.A. Defence-related enzymes in soybean resistance to target spot. J. Phytopathol. 2015, 163, 731–742. [Google Scholar] [CrossRef] [Green Version]
  30. Fortunato, A.A.; Araujo, L.; Rodrigues, F.Á. Association of the production of phenylpropanoid compounds at the infection sites of Corynespora cassiicola with soybean resistance against target spot. J. Phytopathol. 2017, 165, 131–142. [Google Scholar] [CrossRef]
  31. Bu, D.; Luo, H.; Huo, P.; Wang, Z.; Zhang, S.; He, Z.; Wu, Y.; Zhao, L.; Liu, J.; Guo, J. KOBAS-i: Intelligent prioritization and exploratory visualization of biological functions for gene enrichment analysis. Nucleic Acids Res. 2021, 49, W317–W325. [Google Scholar] [CrossRef]
  32. Lee, D.S.; Kim, Y.C.; Kwon, S.J.; Ryu, C.-M.; Park, O.K. The Arabidopsis cysteine-rich receptor-like kinase CRK36 regulates immunity through interaction with the cytoplasmic kinase BIK1. Front. Plant Sci. 2017, 8, 1856. [Google Scholar] [CrossRef] [Green Version]
  33. Dodds, P.N.; Rathjen, J.P. Plant immunity: Towards an integrated view of plant–pathogen interactions. Nat. Rev. Genet. 2010, 11, 539–548. [Google Scholar] [CrossRef]
  34. Bosamia, T.C.; Dodia, S.M.; Mishra, G.P.; Ahmad, S.; Joshi, B.; Thirumalaisamy, P.P.; Kumar, N.; Rathnakumar, A.L.; Sangh, C.; Kumar, A.; et al. Unraveling the mechanisms of resistance to Sclerotium rolfsii in peanut (Arachis hypogaea L.) using comparative RNA-Seq analysis of resistant and susceptible genotypes. PLoS ONE 2020, 15, e0236823. [Google Scholar] [CrossRef]
  35. Gao, S.; Wang, F.; Niran, J.; Li, N.; Yin, Y.; Yu, C.; Jiao, C.; Yao, M. Transcriptome analysis reveals defense-related genes and pathways against Xanthomonas campestris pv. vesicatoria in pepper (Capsicum annuum L.). PLoS ONE 2021, 16, e0240279. [Google Scholar] [CrossRef] [PubMed]
  36. Du, H.; Wang, Y.; Yang, J.; Yang, W. Comparative transcriptome analysis of resistant and susceptible tomato lines in response to infection by Xanthomonas perforans race T3. Front. Plant Sci. 2015, 6, 1173. [Google Scholar] [CrossRef] [PubMed] [Green Version]
  37. Tang, D.; Wang, G.; Zhou, J.M. Receptor Kinases in Plant-Pathogen Interactions: More Than Pattern Recognition. Plant Cell 2017, 29, 618–637. [Google Scholar] [CrossRef] [PubMed] [Green Version]
  38. DeYoung, B.J.; Innes, R.W. Plant NBS-LRR proteins in pathogen sensing and host defense. Nat Immunol. 2006, 7, 1243–1249. [Google Scholar] [CrossRef] [PubMed] [Green Version]
  39. McHale, L.; Tan, X.; Koehl, P.; Michelmore, R.W. Plant NBS-LRR proteins: Adaptable guards. Genome Biol. 2006, 7, 212. [Google Scholar] [CrossRef] [Green Version]
  40. Staal, J.; Kaliff, M.; Bohman, S.; Dixelius, C. Transgressive segregation reveals two Arabidopsis TIR-NB-LRR resistance genes effective against Leptosphaeria maculans, causal agent of blackleg disease. Plant J. 2006, 46, 218–230. [Google Scholar] [CrossRef]
  41. Staal, J.; Kaliff, M.; Dewaele, E.; Persson, M.; Dixelius, C. RLM3, a TIR domain encoding gene involved in broad-range immunity of Arabidopsis to necrotrophic fungal pathogens. Plant J. 2008, 55, 188–200. [Google Scholar] [CrossRef]
  42. Chen, K.; Du, L.; Chen, Z. Sensitization of defense responses and activation of programmed cell death by a pathogen-induced receptor-like protein kinase in Arabidopsis. Plant Mol. Biol. 2003, 53, 61–74. [Google Scholar] [CrossRef]
  43. Yadeta, K.A.; Elmore, J.M.; Creer, A.Y.; Feng, B.; Franco, J.Y.; Rufian, J.S.; He, P.; Phinney, B.; Coaker, G. A Cysteine-Rich Protein Kinase Associates with a Membrane Immune Complex and the Cysteine Residues Are Required for Cell Death. Plant Physiol 2017, 173, 771–787. [Google Scholar] [CrossRef] [Green Version]
  44. Bourdais, G.; Burdiak, P.; Gauthier, A.; Nitsch, L.; Salojärvi, J.; Rayapuram, C.; Idänheimo, N.; Hunter, K.; Kimura, S.; Merilo, E. Large-scale phenomics identifies primary and fine-tuning roles for CRKs in responses related to oxidative stress. PLoS Genet. 2015, 11, e1005373. [Google Scholar] [CrossRef] [Green Version]
  45. Pusztahelyi, T. Chitin and chitin-related compounds in plant–fungal interactions. Mycology 2018, 9, 189–201. [Google Scholar] [CrossRef]
  46. Toufiq, N.; Tabassum, B.; Bhatti, M.U.; Khan, A.; Tariq, M.; Shahid, N.; Nasir, I.A.; Husnain, T. Improved antifungal activity of barley derived chitinase I gene that overexpress a 32 kDa recombinant chitinase in Escherichia coli host. Braz. J. Microbiol. 2018, 49, 414–421. [Google Scholar] [CrossRef] [PubMed]
  47. Schlumbaum, A.; Mauch, F.; Vögeli, U.; Boller, T. Plant chitinases are potent inhibitors of fungal growth. Nature 1986, 324, 365–367. [Google Scholar] [CrossRef]
  48. Kumar, M.; Brar, A.; Yadav, M.; Chawade, A.; Vivekanand, V.; Pareek, N. Chitinases—Potential candidates for enhanced plant resistance towards fungal pathogens. Agriculture 2018, 8, 88. [Google Scholar] [CrossRef] [Green Version]
  49. Kabir, S.R.; Rahman, M.M.; Tasnim, S.; Karim, M.R.; Khatun, N.; Hasan, I.; Amin, R.; Islam, S.S.; Nurujjaman, M.; Kabir, A.H. Purification and characterization of a novel chitinase from Trichosanthes dioica seed with antifungal activity. Int. J. Biol. Macromol. 2016, 84, 62–68. [Google Scholar] [CrossRef] [PubMed]
  50. Corrado, G.; Arciello, S.; Fanti, P.; Fiandra, L.; Garonna, A.; Digilio, M.C.; Lorito, M.; Giordana, B.; Pennacchio, F.; Rao, R. The Chitinase A from the baculovirus AcMNPV enhances resistance to both fungi and herbivorous pests in tobacco. Transgenic Res. 2008, 17, 557–571. [Google Scholar] [CrossRef]
  51. Reuber, T.L.; Ausubel, F.M. Isolation of Arabidopsis genes that differentiate between resistance responses mediated by the RPS2 and RPM1 disease resistance genes. Plant Cell 1996, 8, 241–249. [Google Scholar]
  52. Wang, J.; Tian, W.; Tao, F.; Wang, J.; Shang, H.; Chen, X.; Xu, X.; Hu, X. TaRPM1 positively regulates wheat high-temperature seedling-plant resistance to Puccinia striiformis f. sp. tritici. Front. Plant Sci. 2020, 10, 1679. [Google Scholar] [CrossRef] [Green Version]
  53. Afzal, M.; Alghamdi, S.S.; Nawaz, H.; Migdadi, H.H.; Altaf, M.; El-Harty, E.; Al-Fifi, S.A.; Sohaib, M. Genome-wide identification and expression analysis of CC-NB-ARC-LRR (NB-ARC) disease-resistant family members from soybean (Glycine max L.) reveal their response to biotic stress. J. King Saud Univ.-Sci. 2022, 34, 101758. [Google Scholar] [CrossRef]
  54. Whaley, A.; Sheridan, J.; Safari, S.; Burton, A.; Burkey, K.; Schlueter, J. RNA-seq analysis reveals genetic response and tolerance mechanisms to ozone exposure in soybean. BMC Genom. 2015, 16, 426. [Google Scholar] [CrossRef] [Green Version]
  55. Parkhi, V.; Kumar, V.; Campbell, L.M.; Bell, A.A.; Shah, J.; Rathore, K.S. Resistance against various fungal pathogens and reniform nematode in transgenic cotton plants expressing Arabidopsis NPR1. Transgenic Res. 2010, 19, 959–975. [Google Scholar] [CrossRef]
  56. Stein, E.; Molitor, A.; Kogel, K.-H.; Waller, F. Systemic resistance in Arabidopsis conferred by the mycorrhizal fungus Piriformospora indica requires jasmonic acid signaling and the cytoplasmic function of NPR1. Plant Cell Physiol. 2008, 49, 1747–1751. [Google Scholar] [CrossRef] [PubMed]
  57. Ali, S.; Mir, Z.A.; Tyagi, A.; Mehari, H.; Meena, R.P.; Bhat, J.A.; Yadav, P.; Papalou, P.; Rawat, S.; Grover, A. Overexpression of NPR1 in Brassica juncea confers broad spectrum resistance to fungal pathogens. Front. Plant Sci. 2017, 8, 1693. [Google Scholar] [CrossRef] [PubMed] [Green Version]
  58. Yang, Z.; Ma, H.; Hong, H.; Yao, W.; Xie, W.; Xiao, J.; Li, X.; Wang, S. Transcriptome-based analysis of mitogen-activated protein kinase cascades in the rice response to Xanthomonas oryzae infection. Rice 2015, 8, 4. [Google Scholar] [CrossRef] [PubMed] [Green Version]
  59. Huang, H.; Qi, S.D.; Qi, F.; Wu, C.A.; Yang, G.D.; Zheng, C.C. NtKTI1, a Kunitz trypsin inhibitor with antifungal activity from Nicotiana tabacum, plays an important role in tobacco’s defense response. FEBS J. 2010, 277, 4076–4088. [Google Scholar] [CrossRef] [PubMed]
  60. Sarowar, S.; Alam, S.T.; Makandar, R.; Lee, H.; Trick, H.N.; Dong, Y.; Shah, J. Targeting the pattern-triggered immunity pathway to enhance resistance to Fusarium graminearum. Mol. Plant Pathol. 2019, 20, 626–640. [Google Scholar] [CrossRef] [PubMed] [Green Version]
  61. Higashi, K.; Ishiga, Y.; Inagaki, Y.; Toyoda, K.; Shiraishi, T.; Ichinose, Y. Modulation of defense signal transduction by flagellin-induced WRKY41 transcription factor in Arabidopsis thaliana. Mol. Genet. Genom. 2008, 279, 303–312. [Google Scholar] [CrossRef] [PubMed] [Green Version]
  62. Dicko, M.H.; Gruppen, H.; Barro, C.; Traoré, A.S.; van Berkel, W.J.; Voragen, A.G. Impact of phenolic compounds and related enzymes in sorghum varieties for resistance and susceptibility to biotic and abiotic stresses. J. Chem. Ecol. 2005, 31, 2671–2688. [Google Scholar] [CrossRef]
  63. Lozovaya, V.V.; Lygin, A.V.; Zernova, O.V.; Ulanov, A.V.; Li, S.; Hartman, G.L.; Widholm, J.M. Modification of phenolic metabolism in soybean hairy roots through down regulation of chalcone synthase or isoflavone synthase. Planta 2007, 225, 665–679. [Google Scholar] [CrossRef]
  64. Mitchell, H.J.; Hall, S.A.; Stratford, R.; Hall, J.L.; Barber, M.S. Differential induction of cinnamyl alcohol dehydrogenase during defensive lignification in wheat (Triticum aestivum L.): Characterisation of the major inducible form. Planta 1999, 208, 31–37. [Google Scholar] [CrossRef]
  65. Hamberger, B.; Ellis, M.; Friedmann, M.; de Azevedo Souza, C.; Barbazuk, B.; Douglas, C.J. Genome-wide analyses of phenylpropanoid-related genes in Populus trichocarpa, Arabidopsis thaliana, and Oryza sativa: The Populus lignin toolbox and conservation and diversification of angiosperm gene families. Botany 2007, 85, 1182–1201. [Google Scholar]
  66. Vogt, T. Phenylpropanoid biosynthesis. Mol. Plant 2010, 3, 2–20. [Google Scholar] [CrossRef] [PubMed] [Green Version]
  67. Miedes, E.; Vanholme, R.; Boerjan, W.; Molina, A. The role of the secondary cell wall in plant resistance to pathogens. Front. Plant Sci. 2014, 5, 358. [Google Scholar] [CrossRef] [PubMed] [Green Version]
  68. Dao, T.T.; Linthorst, H.J.; Verpoorte, R. Chalcone synthase and its functions in plant resistance. Phytochem. Rev. 2011, 10, 397–412. [Google Scholar] [CrossRef] [PubMed] [Green Version]
  69. Algar, E.; Gutierrez-Mañero, F.J.; Garcia-Villaraco, A.; García-Seco, D.; Lucas, J.A.; Ramos-Solano, B. The role of isoflavone metabolism in plant protection depends on the rhizobacterial MAMP that triggers systemic resistance against Xanthomonas axonopodis pv. glycines in Glycine max (L.) Merr. cv. Osumi. Plant Physiol. Biochem. 2014, 82, 9–16. [Google Scholar] [CrossRef] [PubMed]
  70. Li, B.; Fan, R.; Guo, S.; Wang, P.; Zhu, X.; Fan, Y.; Chen, Y.; He, K.; Kumar, A.; Shi, J. The Arabidopsis MYB transcription factor, MYB111 modulates salt responses by regulating flavonoid biosynthesis. Environ. Exp. Bot. 2019, 166, 103807. [Google Scholar] [CrossRef]
  71. Mehrtens, F.; Kranz, H.; Bednarek, P.; Weisshaar, B. The Arabidopsis transcription factor MYB12 is a flavonol-specific regulator of phenylpropanoid biosynthesis. Plant Physiol. 2005, 138, 1083–1096. [Google Scholar] [CrossRef] [Green Version]
  72. Nakabayashi, R.; Yonekura-Sakakibara, K.; Urano, K.; Suzuki, M.; Yamada, Y.; Nishizawa, T.; Matsuda, F.; Kojima, M.; Sakakibara, H.; Shinozaki, K. Enhancement of oxidative and drought tolerance in Arabidopsis by overaccumulation of antioxidant flavonoids. Plant J. 2014, 77, 367–379. [Google Scholar] [CrossRef] [Green Version]
  73. Stracke, R.; Jahns, O.; Keck, M.; Tohge, T.; Niehaus, K.; Fernie, A.R.; Weisshaar, B. Analysis of PRODUCTION OF FLAVONOL GLYCOSIDES-dependent flavonol glycoside accumulation in Arabidopsis thaliana plants reveals MYB11-, MYB12-and MYB111-independent flavonol glycoside accumulation. New Phytol. 2010, 188, 985–1000. [Google Scholar] [CrossRef]
  74. Mahajan, M.; Yadav, S.K. Overexpression of a tea flavanone 3-hydroxylase gene confers tolerance to salt stress and Alternaria solani in transgenic tobacco. Plant Mol. Biol. 2014, 85, 551–573. [Google Scholar] [CrossRef]
  75. Jan, R.; Aaqil Khan, M.; Asaf, S.; Park, J.-R.; Lee, I.-J.; Kim, K.-M. Flavonone 3-hydroxylase relieves bacterial leaf blight stress in rice via overaccumulation of antioxidant flavonoids and induction of defense genes and hormones. Int. J. Mol. Sci. 2021, 22, 6152. [Google Scholar] [CrossRef] [PubMed]
  76. Cho, S.; Chen, W.; Muehlbauer, F.J. Constitutive expression of the Flavanone 3-hydroxylase gene related to pathotype-specific ascochyta blight resistance in Cicer arietinum L. Physiol. Mol. Plant Pathol. 2005, 67, 100–107. [Google Scholar] [CrossRef]
  77. Verhage, A.; van Wees, S.C.; Pieterse, C.M. Plant immunity: It’s the hormones talking, but what do they say? Plant Physiol. 2010, 154, 536–540. [Google Scholar] [CrossRef] [Green Version]
  78. Kohli, S.K.; Bali, S.; Khanna, K.; Bakshi, P.; Sharma, P.; Sharma, A.; Verma, V.; Ohri, P.; Mir, B.A.; Kaur, R. A current scenario on role of brassinosteroids in plant defense triggered in response to biotic challenges. In Brassinosteroids: Plant Growth and Development; Springer: Berlin/Heidelberg, Germany, 2019; pp. 367–388. [Google Scholar]
  79. Tariq, R.; Wang, C.; Qin, T.; Xu, F.; Tang, Y.; Gao, Y.; Ji, Z.; Zhao, K. Comparative transcriptome profiling of rice near-isogenic line carrying Xa23 under infection of Xanthomonas oryzae pv. oryzae. Int. J. Mol. Sci. 2018, 19, 717. [Google Scholar] [CrossRef] [PubMed] [Green Version]
  80. Dasgupta, U.; Mishra, G.P.; Dikshit, H.K.; Mishra, D.C.; Bosamia, T.; Roy, A.; Bhati, J.; Aski, M.; Kumar, R.R.; Singh, A.K. Comparative RNA-Seq analysis unfolds a complex regulatory network imparting yellow mosaic disease resistance in mungbean [Vigna radiata (L.) R. Wilczek]. PLoS ONE 2021, 16, e0244593. [Google Scholar] [CrossRef] [PubMed]
  81. French, E.; Kim, B.S.; Iyer-Pascuzzi, A.S. Mechanisms of quantitative disease resistance in plants. Semin. Cell Dev. Biol. 2016, 56, 201–208. [Google Scholar] [CrossRef]
  82. Poland, J.A.; Balint-Kurti, P.J.; Wisser, R.J.; Pratt, R.C.; Nelson, R.J. Shades of gray: The world of quantitative disease resistance. Trends Plant Sci. 2009, 14, 21–29. [Google Scholar] [CrossRef]
  83. Fukuoka, S.; Saka, N.; Mizukami, Y.; Koga, H.; Yamanouchi, U.; Yoshioka, Y.; Hayashi, N.; Ebana, K.; Mizobuchi, R.; Yano, M. Gene pyramiding enhances durable blast disease resistance in rice. Sci. Rep. 2015, 5, 7773. [Google Scholar] [CrossRef] [Green Version]
  84. Richardson, K.; Vales, M.; Kling, J.; Mundt, C.; Hayes, P. Pyramiding and dissecting disease resistance QTL to barley stripe rust. Theor. Appl. Genet. 2006, 113, 485–495. [Google Scholar] [CrossRef]
  85. Krattinger, S.G.; Lagudah, E.S.; Spielmeyer, W.; Singh, R.P.; Huerta-Espino, J.; McFadden, H.; Bossolini, E.; Selter, L.L.; Keller, B. A putative ABC transporter confers durable resistance to multiple fungal pathogens in wheat. Science 2009, 323, 1360–1363. [Google Scholar] [CrossRef] [Green Version]
  86. Chen, S.; Zhou, Y.; Chen, Y.; Gu, J. fastp: An ultra-fast all-in-one FASTQ preprocessor. Bioinformatics 2018, 34, i884–i890. [Google Scholar] [CrossRef] [PubMed]
  87. Patro, R.; Duggal, G.; Love, M.I.; Irizarry, R.A.; Kingsford, C. Salmon provides fast and bias-aware quantification of transcript expression. Nat. Methods 2017, 14, 417–419. [Google Scholar] [CrossRef] [Green Version]
  88. Love, M.I.; Huber, W.; Anders, S. Moderated estimation of fold change and dispersion for RNA-seq data with DESeq2. Genome Biol. 2014, 15, 550. [Google Scholar] [CrossRef] [PubMed] [Green Version]
  89. Ge, S.X.; Jung, D.; Yao, R. ShinyGO: A graphical gene-set enrichment tool for animals and plants. Bioinformatics 2020, 36, 2628–2629. [Google Scholar] [CrossRef] [PubMed]
  90. Jin, J.; Tian, F.; Yang, D.-C.; Meng, Y.-Q.; Kong, L.; Luo, J.; Gao, G. PlantTFDB 4.0: Toward a central hub for transcription factors and regulatory interactions in plants. Nucleic Acids Res. 2016, 45, D1040–D1045. [Google Scholar] [CrossRef] [PubMed] [Green Version]
  91. Ye, J.; Coulouris, G.; Zaretskaya, I.; Cutcutache, I.; Rozen, S.; Madden, T.L. Primer-BLAST: A tool to design target-specific primers for polymerase chain reaction. BMC Bioinform. 2012, 13, 134. [Google Scholar] [CrossRef] [Green Version]
  92. Livak, K.J.; Schmittgen, T.D. Analysis of relative gene expression data using real-time quantitative PCR and the 2−ΔΔCT method. Methods 2001, 25, 402–408. [Google Scholar] [CrossRef]
Figure 1. Differntially expressed genes (DEGs) retrieved from all four genotypes at 24 hpi and 48 hpi time intervals compared to non-inoculated control. (A) Total numbers of DEGs (upregulated and downregulated) at each time point. Venn diagram illustrating comparison of DEGs (B) at 24 hpi and (C) at 48 hpi, among all four genotypes, both resistant (Bedford and Council) and susceptible (Henderson and Pembina). Black-colored numbers represent upregulated genes, and red-colored numbers represent downregulated genes.
Ijms 24 10563 g001
Figure 2. A hierarchical clustering tree of enriched biological processes. This clustering summarizes the correlation between significant pathways and pathways are clustered together if they share any common genes. The Gene Ontology (GO) terms in the red box are some biosynthesis pathways and responses activated after a pathogen attack.
Ijms 24 10563 g002
Figure 3. The interactive plot displays the relationship between significant enriched biological processes. Activation of enrichment network of upregulated genes in resistant genotypes in response to C. cassiicola infection but not observed in susceptible (A) Bedford (B) Council. The circles on the plots represent nodes (different biological processes), and lines represent a connection between two biological processes.
Ijms 24 10563 g003aIjms 24 10563 g003b
Figure 4. Illustration of the phenylpropanoid biosynthesis pathway. The numbers in the boxes represent coding for enzymes. The red-colored boxes represent upregulated genes in all four genotypes after infection. The green boxes in the pathway diagram represent remaining genes or enzymes derived from the soybean genome and are involved in the pathway under investigation.
Ijms 24 10563 g004
Figure 5. Classification of transcription factor families for four genotypes: (A) Council, (B) Bedford, (C) Henderson, and (D) Pembina.
Ijms 24 10563 g005
Figure 6. Quantitative real-time PCR (qRT-PCR)-based validation of DEGs in response to C. cassiicola inoculation at different time points. Relative gene expression is represented in Log2fold change obtained from RNA-Seq, and fold changes in qRT-PCR are calculated using the 2−ΔΔCT method.
Ijms 24 10563 g006
Figure 7. Heat maps represent the log2fold-change-based expression pattern of defense-related genes in (A) Bedford and (B) Council after C. cassiicola inoculation compared to susceptible genotypes at different time points. The annotation of these genes was retrieved from Soybase.
Ijms 24 10563 g007aIjms 24 10563 g007b
Figure 8. The heat map represents the log2fold-change-based expression pattern of secondary metabolites biosynthesis DEGs in Bedford and Council after C. cassiicola inoculation at different time points compared to susceptible genotypes. The annotation of these genes was retrieved from Soybase.
Ijms 24 10563 g008
Table 1. An overview of statistics for the quality of sequencing data.
SamplesRaw ReadsClean ReadsMap ReadsRaw Data (G)Clean Data
(G)
Q30
(%)
GC
(%)
Bedford—0 hpi26,390,79325,793,638 23,582,978 7.97.893.3945.04
Council—0 hpi23,089,78722,563,156 20,640,957 6.96.893.5345.19
Henderson—0 hpi22,838,22822,381,404 20,209,026 6.96.793.1944.79
Pembina—0 hpi25,554,63325,099,735 22,617,422 7.77.593.3944.72
Bedford—24 hpi28,423,02128,174,656 24,664,671 8.68.593.1944.69
Council—24 hpi26,514,26426,147,721 23,551,179 8.07.893.1745.18
Henderson—24 hpi27,493,41027,128,017 23,310,773 8.28.193.0544.69
Pembina—24 hpi33,485,28033,067,807 29,065,093 10.19.993.1844.42
Bedford—48 hpi25,860,45125,641,661 22,746,284 7.87.793.3744.94
Council—48 hpi23,417,30623,237,271 20,529,754 7.07.093.3145.03
Henderson—48 hpi25,075,02324,887,851 21,578,946 7.57.493.0944.53
Pembina—48 hpi24,925,85924,478,453 21,424,984 7.57.393.2644.54
Table 2. Significantly enriched KEGG pathways of differentially expressed genes (DEGs) common in four genotypes.
TermIDInput
Number
Background
Number
p-ValueCorrected
p-Value
Biosynthesis of secondary metabolitesgmx0111012921211.83 × 10−191.79 × 10⁻¹⁷
Metabolic pathwaysgmx0110018041446.06 × 10−132.97 × 10⁻¹¹
Phenylpropanoid biosynthesisgmx00940353492.87 × 10−119.37 × 10⁻¹⁰
Circadian rhythm—plantgmx04712181061.29 × 10−93.17 × 10⁻⁸
Cyanoamino acid metabolismgmx0046015872.53 × 10−84.97 × 10⁻⁷
Flavonoid biosynthesisgmx0094115946.30 × 10−81.03 × 10⁻⁶
Isoflavonoid biosynthesisgmx0094310424.13 × 10−75.78 × 10⁻⁶
Starch and sucrose metabolismgmx00500232994.73 × 10−65.80 × 10⁻⁵
Thiamine metabolismgmx007307430.0001910.00199
Ubiquinone and other terpenoid-quinone biosynthesisgmx0013010930.0002030.00199
Fatty acid elongationgmx000627490.0003910.003485
MAPK signaling pathway—plantgmx04016193070.000430.003513
Plant hormone signal transductiongmx04075306750.002330.017564
Ascorbate and aldarate metabolismgmx000538900.0026350.018442
Cutin, suberine, and wax biosynthesisgmx000736540.0032450.021197
Nitrogen metabolismgmx009106650.0074290.043641
Carotenoid biosynthesisgmx009066660.0079420.043641
Glycerolipid metabolismgmx00561101580.0080160.043641
Disclaimer/Publisher’s Note: The statements, opinions and data contained in all publications are solely those of the individual author(s) and contributor(s) and not of MDPI and/or the editor(s). MDPI and/or the editor(s) disclaim responsibility for any injury to people or property resulting from any ideas, methods, instructions or products referred to in the content.