Article

The Role of SOCS3 in Regulating Meat Quality in Jinhua Pigs

1
College of Animal Sciences, Zhejiang University, Hangzhou 310058, China
2
Key Laboratory of Livestock and Poultry Resources Evaluation and Utilization, Ministry of Agriculture and Rural Affairs, Hangzhou 310058, China
*
Authors to whom correspondence should be addressed.
Int. J. Mol. Sci. 2023, 24(13), 10593; https://doi.org/10.3390/ijms241310593
Submission received: 24 May 2023 / Revised: 15 June 2023 / Accepted: 20 June 2023 / Published: 24 June 2023
(This article belongs to the Special Issue Animal Genomes and Epigenomes)

Abstract

:
Meat quality is an important economic trait that influences the development of the pig industry. Skeletal muscle development and glycolytic potential (GP) are two crucial aspects that significantly impact meat quality. It has been reported that abnormal skeletal muscle development and high glycogen content results in low meat quality. However, the genetic mechanisms underlying these factors are still unclear. Compared with intensive pig breeds, Chinese indigenous pig breeds, such as the Jinhua pig, express superior meat quality characteristics. The differences in the meat quality traits between Jinhua and intensive pig breeds make them suitable for uncovering the genetic mechanisms that regulate meat quality traits. In this study, the Jinhua pig breed and five intensive pig breeds, including Duroc, Landrace, Yorkshire, Berkshire, and Pietrain pig breeds, were selected as experimental materials. First, the FST and XP-EHH methods were used to screen the selective signatures on the genome in the Jinhua population. Then, combined with RNA-Seq data, the study further confirmed that SOCS3 could be a key candidate gene that influences meat quality by mediating myoblast proliferation and glycometabolism because of the down-regulated expression of SOCS3 in Jinhua pigs compared with Landrace pigs. Finally, through SOCS3 knockout (KO) and overexpression (OE) experiments in mouse C2C12 cells, the results showed that SOCS3 regulated the cell proliferation of myoblasts. Moreover, SOCS3 is involved in regulating glucose uptake by the IRS1/PI3K/AKT signaling pathway. Overall, these findings provide a basis for the genetic improvement of meat quality traits in the pig industry.

1. Introduction

Long-term natural and artificial selection have made Chinese indigenous pigs famous all over the world for their characteristics, e.g., excellent meat quality, high reproductive ability, and strong disease resistance [1,2]. It is known that China has a vast territory, and diverse geographical environments have resulted in pigs with distinct characteristics in different regions. For example, Tibetan pigs are known for their strong adaptability, particularly to hypoxia environments [3]. Taihu pigs are renowned for their high-fertility characteristics [1,4]. Jinhua pigs are widely praised for their superior meat quality, and Jinhua ham is a well-known trademark [5]. Meat quality is an important economic trait that influences people’s consumption and desire for pork [6]. With the development of society, people’s requirements for meat quality are increasing. Therefore, it is meaningful to explore the genetic mechanisms underlying meat quality traits for the further development of the pig industry.
Meat quality traits include intramuscular fat (IMF), pH, water-holding capacity, meat color and tenderness, and so on [7]. Previous studies have shown that most meat-quality traits exhibit low-to-moderate heritability [8]. Historically, swine breeders have focused on growth performance but have overlooked meat quality [9,10]. Due to its genetic relationships with other economic traits, meat quality has become one of the primary objectives of pig breeding programs today [11,12,13]. However, the current understanding of Chinese indigenous pigs is limited to their phenotypes. Therefore, further exploration of meat quality-related genes is necessary owing to the insufficient research on the gene localization of meat quality traits.
In livestock industries, both skeletal muscle development and the glycolysis potential (GP) of skeletal muscle are two vital aspects that influence meat quality. GP is particularly used as a biomarker to predict meat quality for farm workers. Cell proliferation, cell cycle, cell apoptosis, and cell differentiation are four manifestations of skeletal muscle development. Additionally, the glycogen contents in skeletal muscle are the determinant of GP values. Ma et al. [14] reported that a 32-bp deletion in the open reading frame of PHKG1 caused a high glycogen content and low water-holding capacity in pork. Additionally, PRKAG3 has been elaboratively evidenced to impact glycogen and GP levels in Hampshire and its related synthetic lines, thus influencing meat quality [15,16]. In view of glucose uptake as a determinant that influences glycogen synthesis capacity [17], the research progress on the regulation mechanism of glucose uptake in skeletal muscle is still slow, and lots of unknowns are still worth exploring.
At present, it is convenient to obtain the genomic and transcriptional information of a population based on high-throughput sequencing techniques. In this study, the Jinhua pig and five intensive pig breeds (Duroc, Landrace, Yorkshire, Pietrain, and Berkshire) were chosen as the research objects. The differences in meat quality between Jinhua pigs and Western pigs make it easier to reveal the genetic mechanism of meat quality. Meat quality traits were formed through long-term selections so that the associated selective signatures could be detected, which might provide efficient clues regarding the molecular mechanisms of meat quality. Both the population differentiation coefficient (FST) and cross-population extended haplotype homozygosity (XP-EHH) methods were identified as suitable methods for detecting selective signatures across populations [18,19]. Additionally, RNA-Seq data can comprehensively reflect transcription levels in the body. Therefore, with the aim of understanding the genetic mechanisms regulating meat quality, this study combined genome and transcriptome analysis to explore the candidate causal genes that might mediate meat quality through two different molecular levels, which were verified in vitro.

2. Results

2.1. Genetic Population Structure Analysis in Jinhua Pigs

This study was based on 8,528,947 SNPs uniformly distributed across the pig genome (Figure 1). NJ-tree, PCA, and population structure analysis were performed to test the consistency of the Jinhua pig population. Of particular interest is that Jinhua pigs and intensive pig breeds were separated into two clades by the NJ-tree and PCA. In the NJ-tree plot (Figure 2A), Jinhua pigs were clustered into one branch, and others, including Duroc, Landrace, Yorkshire, Pietrain, and Berkshire pigs, were clustered into another branch. The PCA plot showed that the contributions of the two PCs were 62.35% and 21.89%, respectively (Figure 2B). Herein, PC1 separated individuals into two groups: the Jinhua breed and the intensive breeds. Furthermore, population structure analysis showed two distinct subpopulations: Jinhua pigs and western breeds with K = 2. When K = 6, the cross-validation error, was the smallest value, and each pig breed could be distinguished clearly from others (Figure 2C). The overall results indicated the Jinhua pig population has good uniformity.

2.2. Screening for Candidate Genes Based on Selection Signature and RNA-Seq

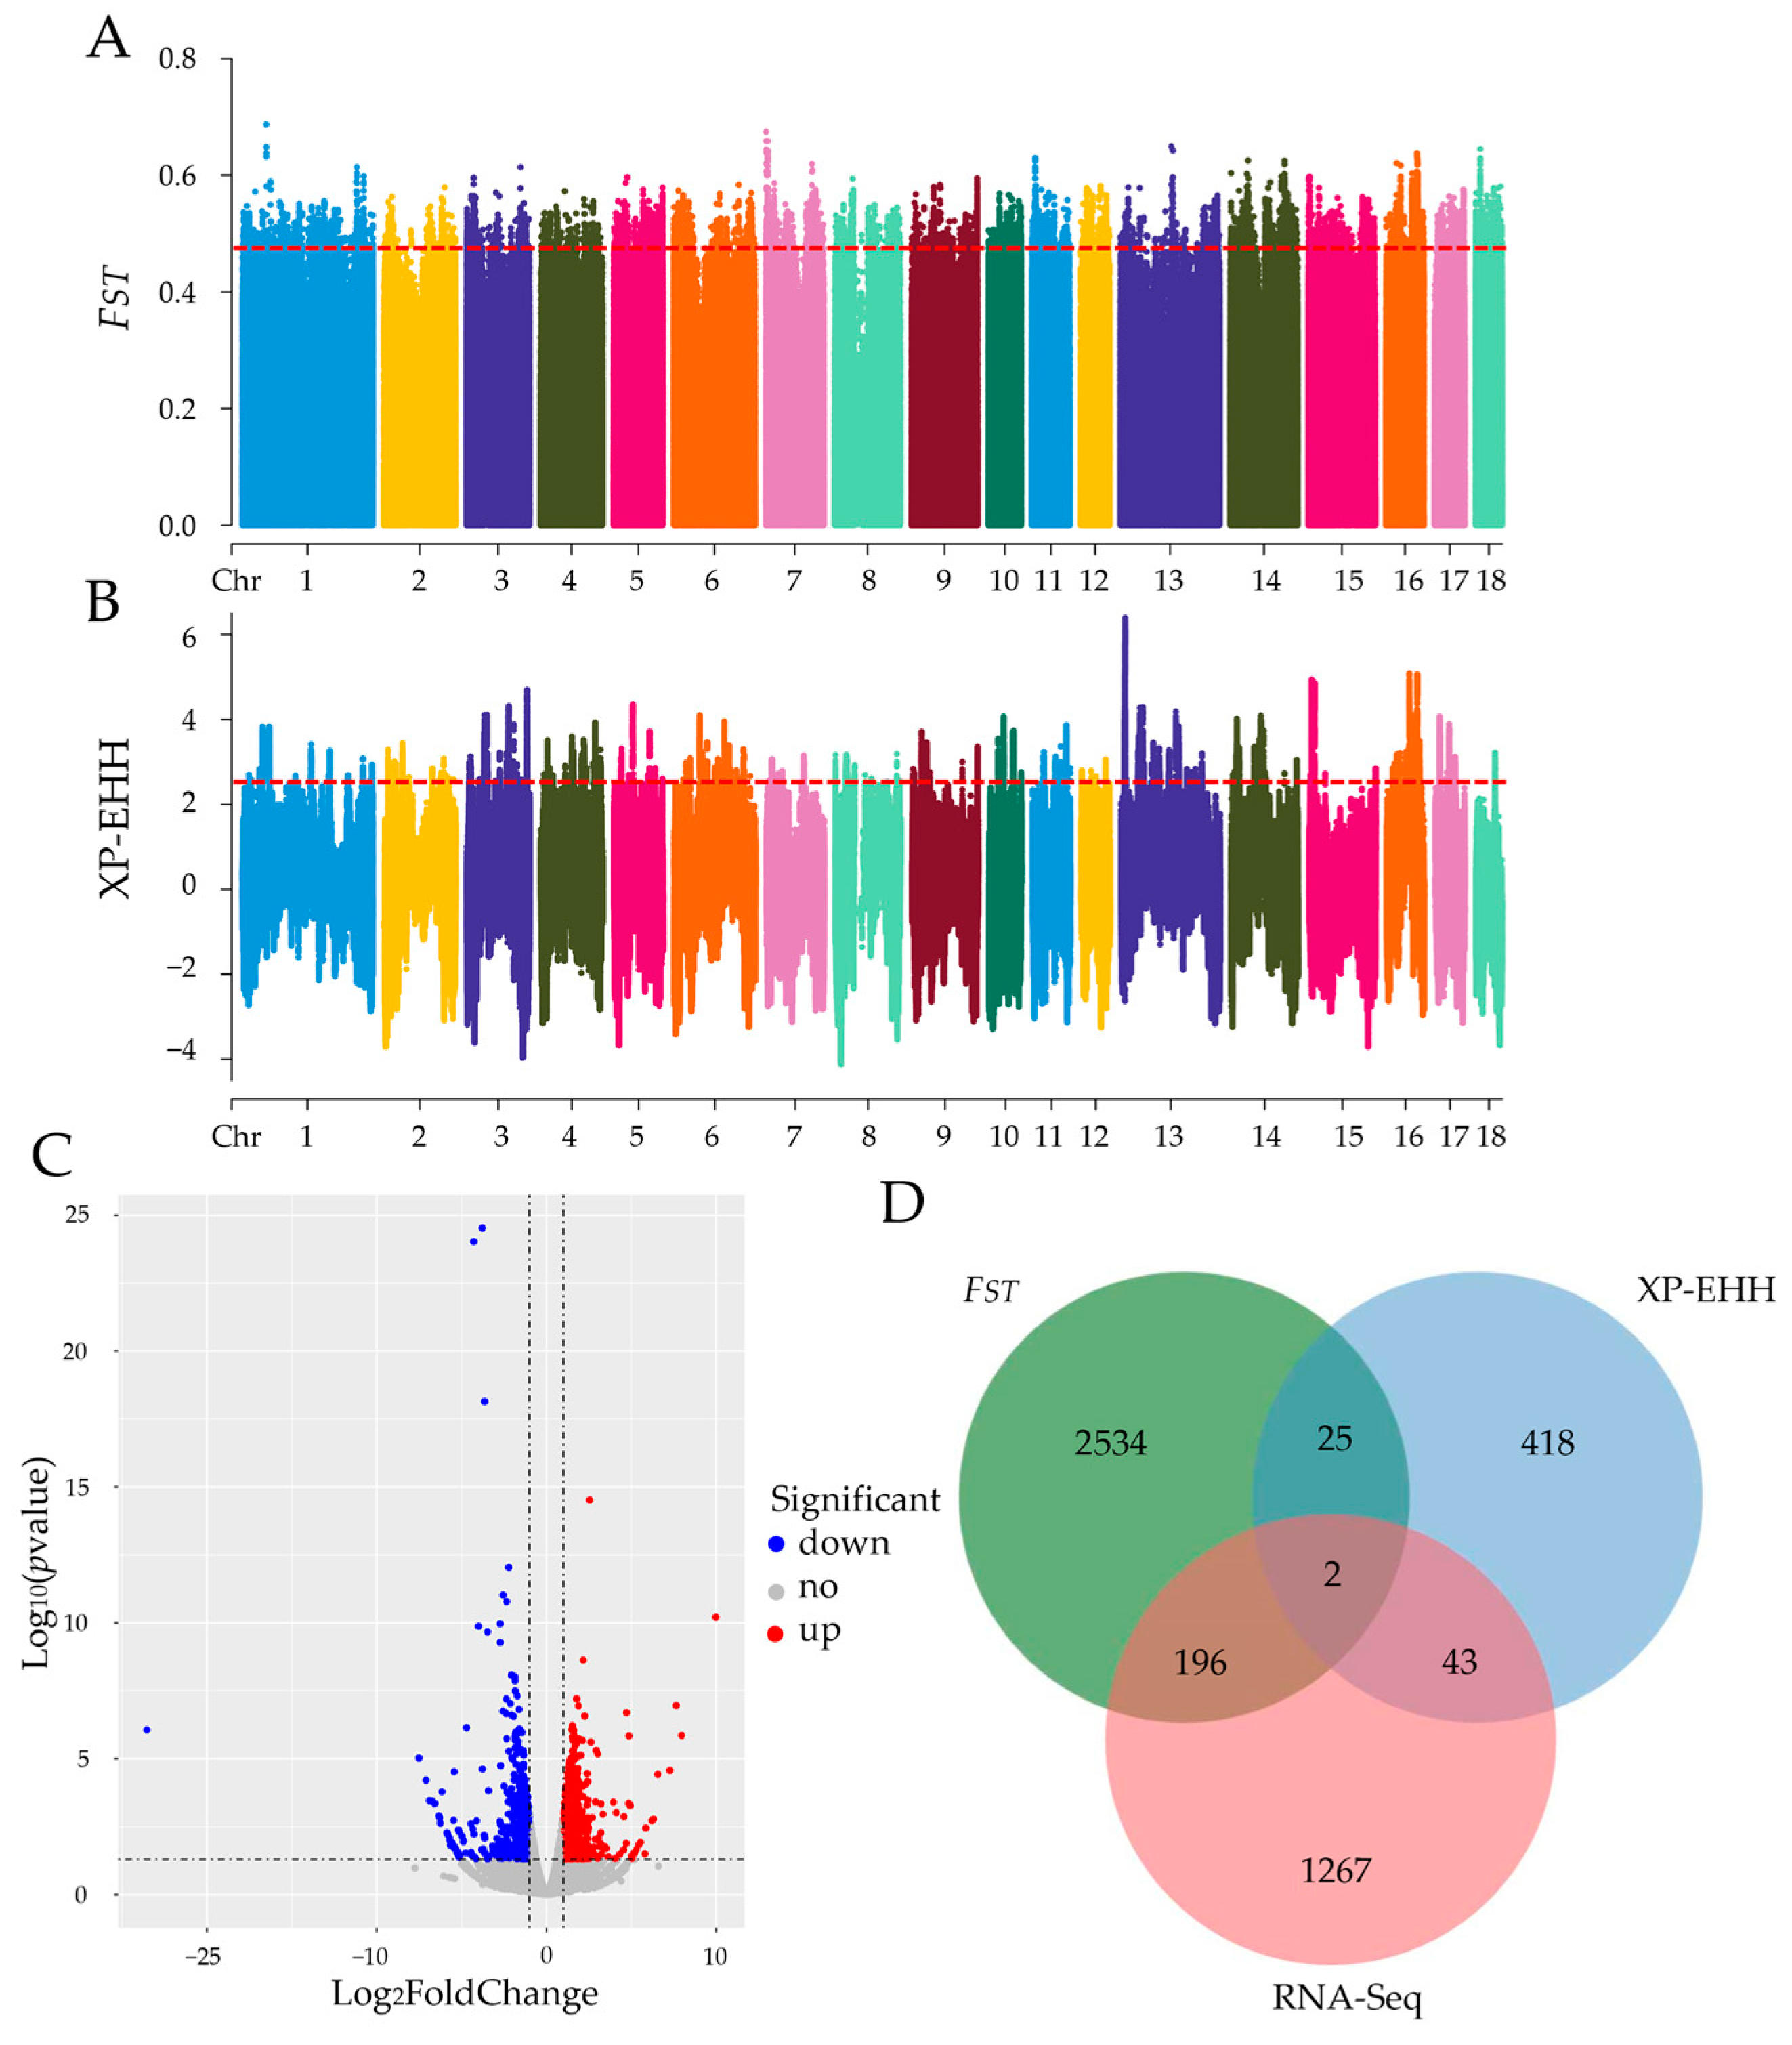
To explore the genomic variability of meat quality in different pig breeds, the genomic selection signatures of Jinhua pigs, compared with five Western pig breeds, were screened at a population level. Two different approaches, FST and XP-EHH, were applied to exhibit the distribution of SNPs with FST or XP-EHH values across the genome (Figure 3A,B). The top 0.5% SNPs based on FST values were considered as the candidate loci and 2757 genes were annotated (Table S1). The SNPs based on XP-EHH values with p < 0.01 were considered the candidate loci, and a total of 488 genes were annotated (Table S2). The RNA-Seq analysis of the longissimus dorsi muscle (LDM) showed 1508 differentially expressed genes (DEGs) between Jinhua and Landrace pigs. Compared with Landrace pigs, 803 genes were up-regulated, and 705 were down-regulated in Jinhua pigs (Figure 3C and Table S3). To reduce the false positive results, the genes detected by at least two methods were selected as the candidates. According to Venn’s result, 266 candidate genes overlapped between the two groups (Figure 3D).

2.3. Functional Analysis of Candidate Genes

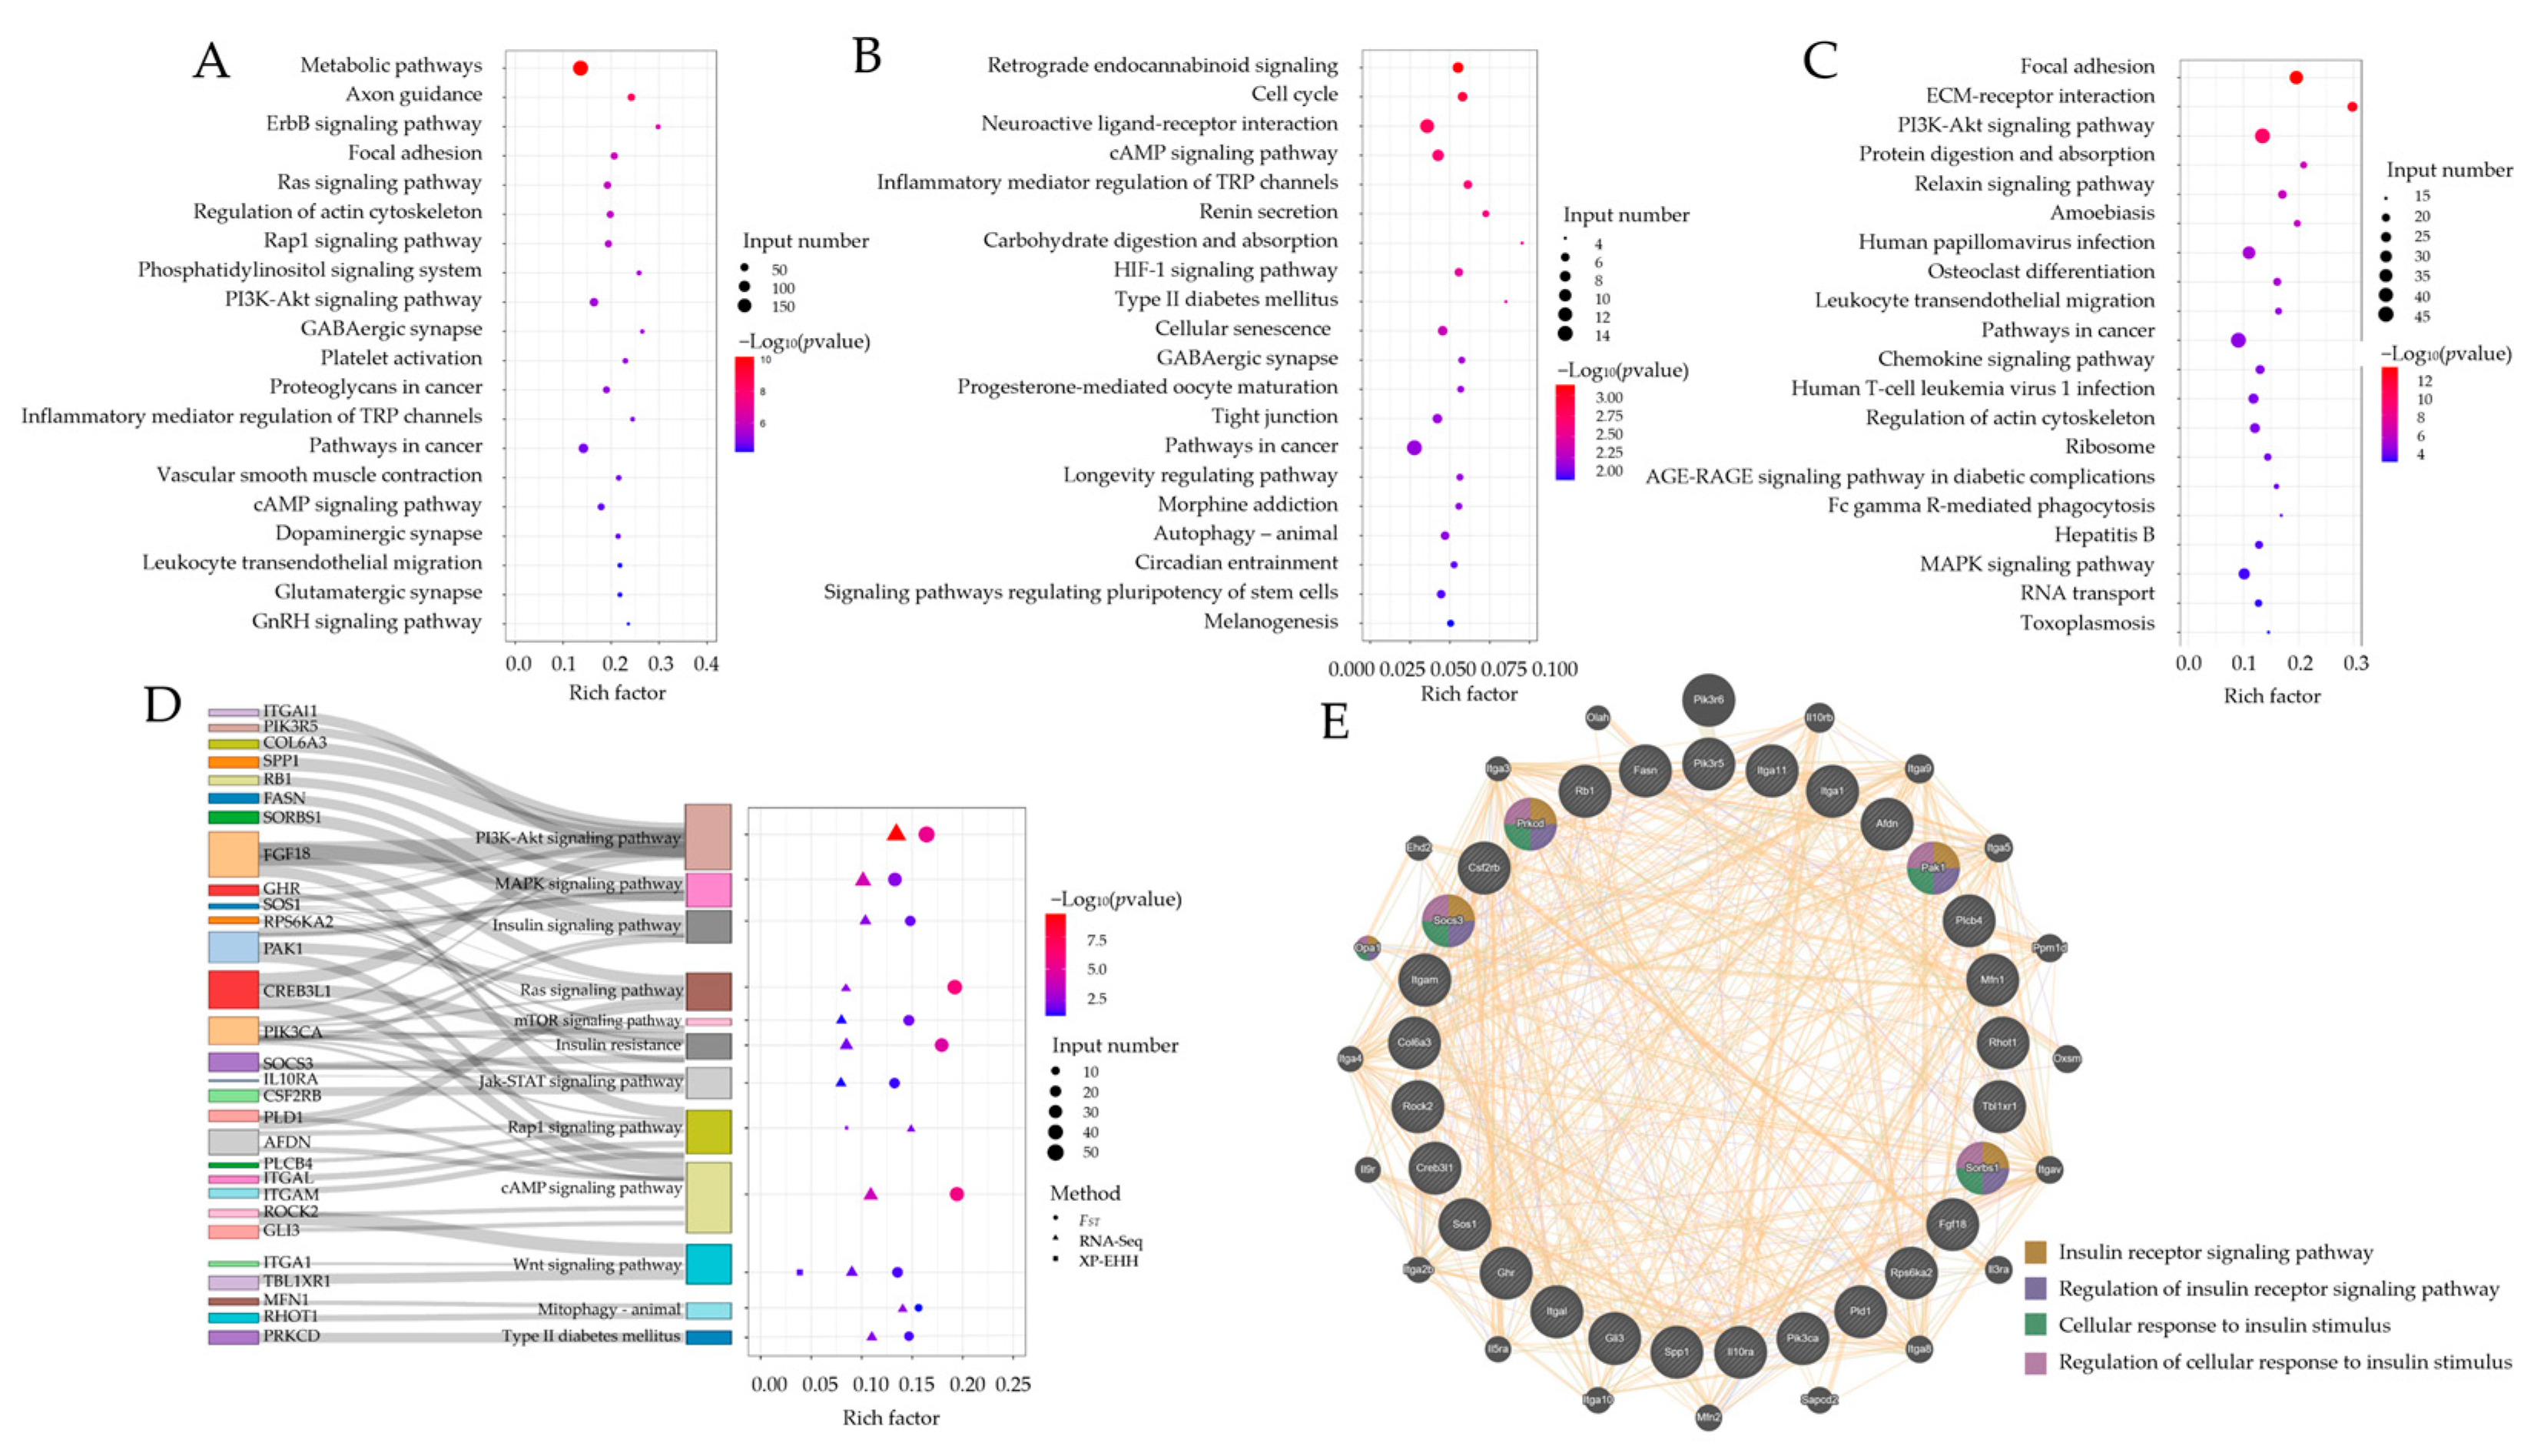
To explore the function of candidate genes, KEGG enrichment analysis was performed (p < 0.05). Genes annotated by FST, XP-EHH, and RNA-Seq methods, respectively, were enriched in the corresponding KEGG pathways (Figure 4A–C, Tables S4–S6). There were 29 common genes enriched in 12 common pathways in relation to energy metabolism, including the PI3K-AKT signaling pathway, MAPK signaling pathway, insulin signaling pathway, etc. (Figure 4D). Moreover, the protein–protein interaction network (PPI) analysis of these 29 common genes showed that SOCS3, PRKCD, PAK1, and SORBS1 were associated with insulin sensitivity, which could be related to glucose uptake (Figure 4E). Additionally, SOCS3 was the gene with the most significant difference in the expression level among these four genes above and between Jinhua pigs and Landrace pigs (Table S7). Therefore, the functions of SOCS3 in regulated myoblasts proliferation and glucose uptake need to be further explored.

2.4. Effects of Socs3 on the Proliferation Ability of Myoblasts

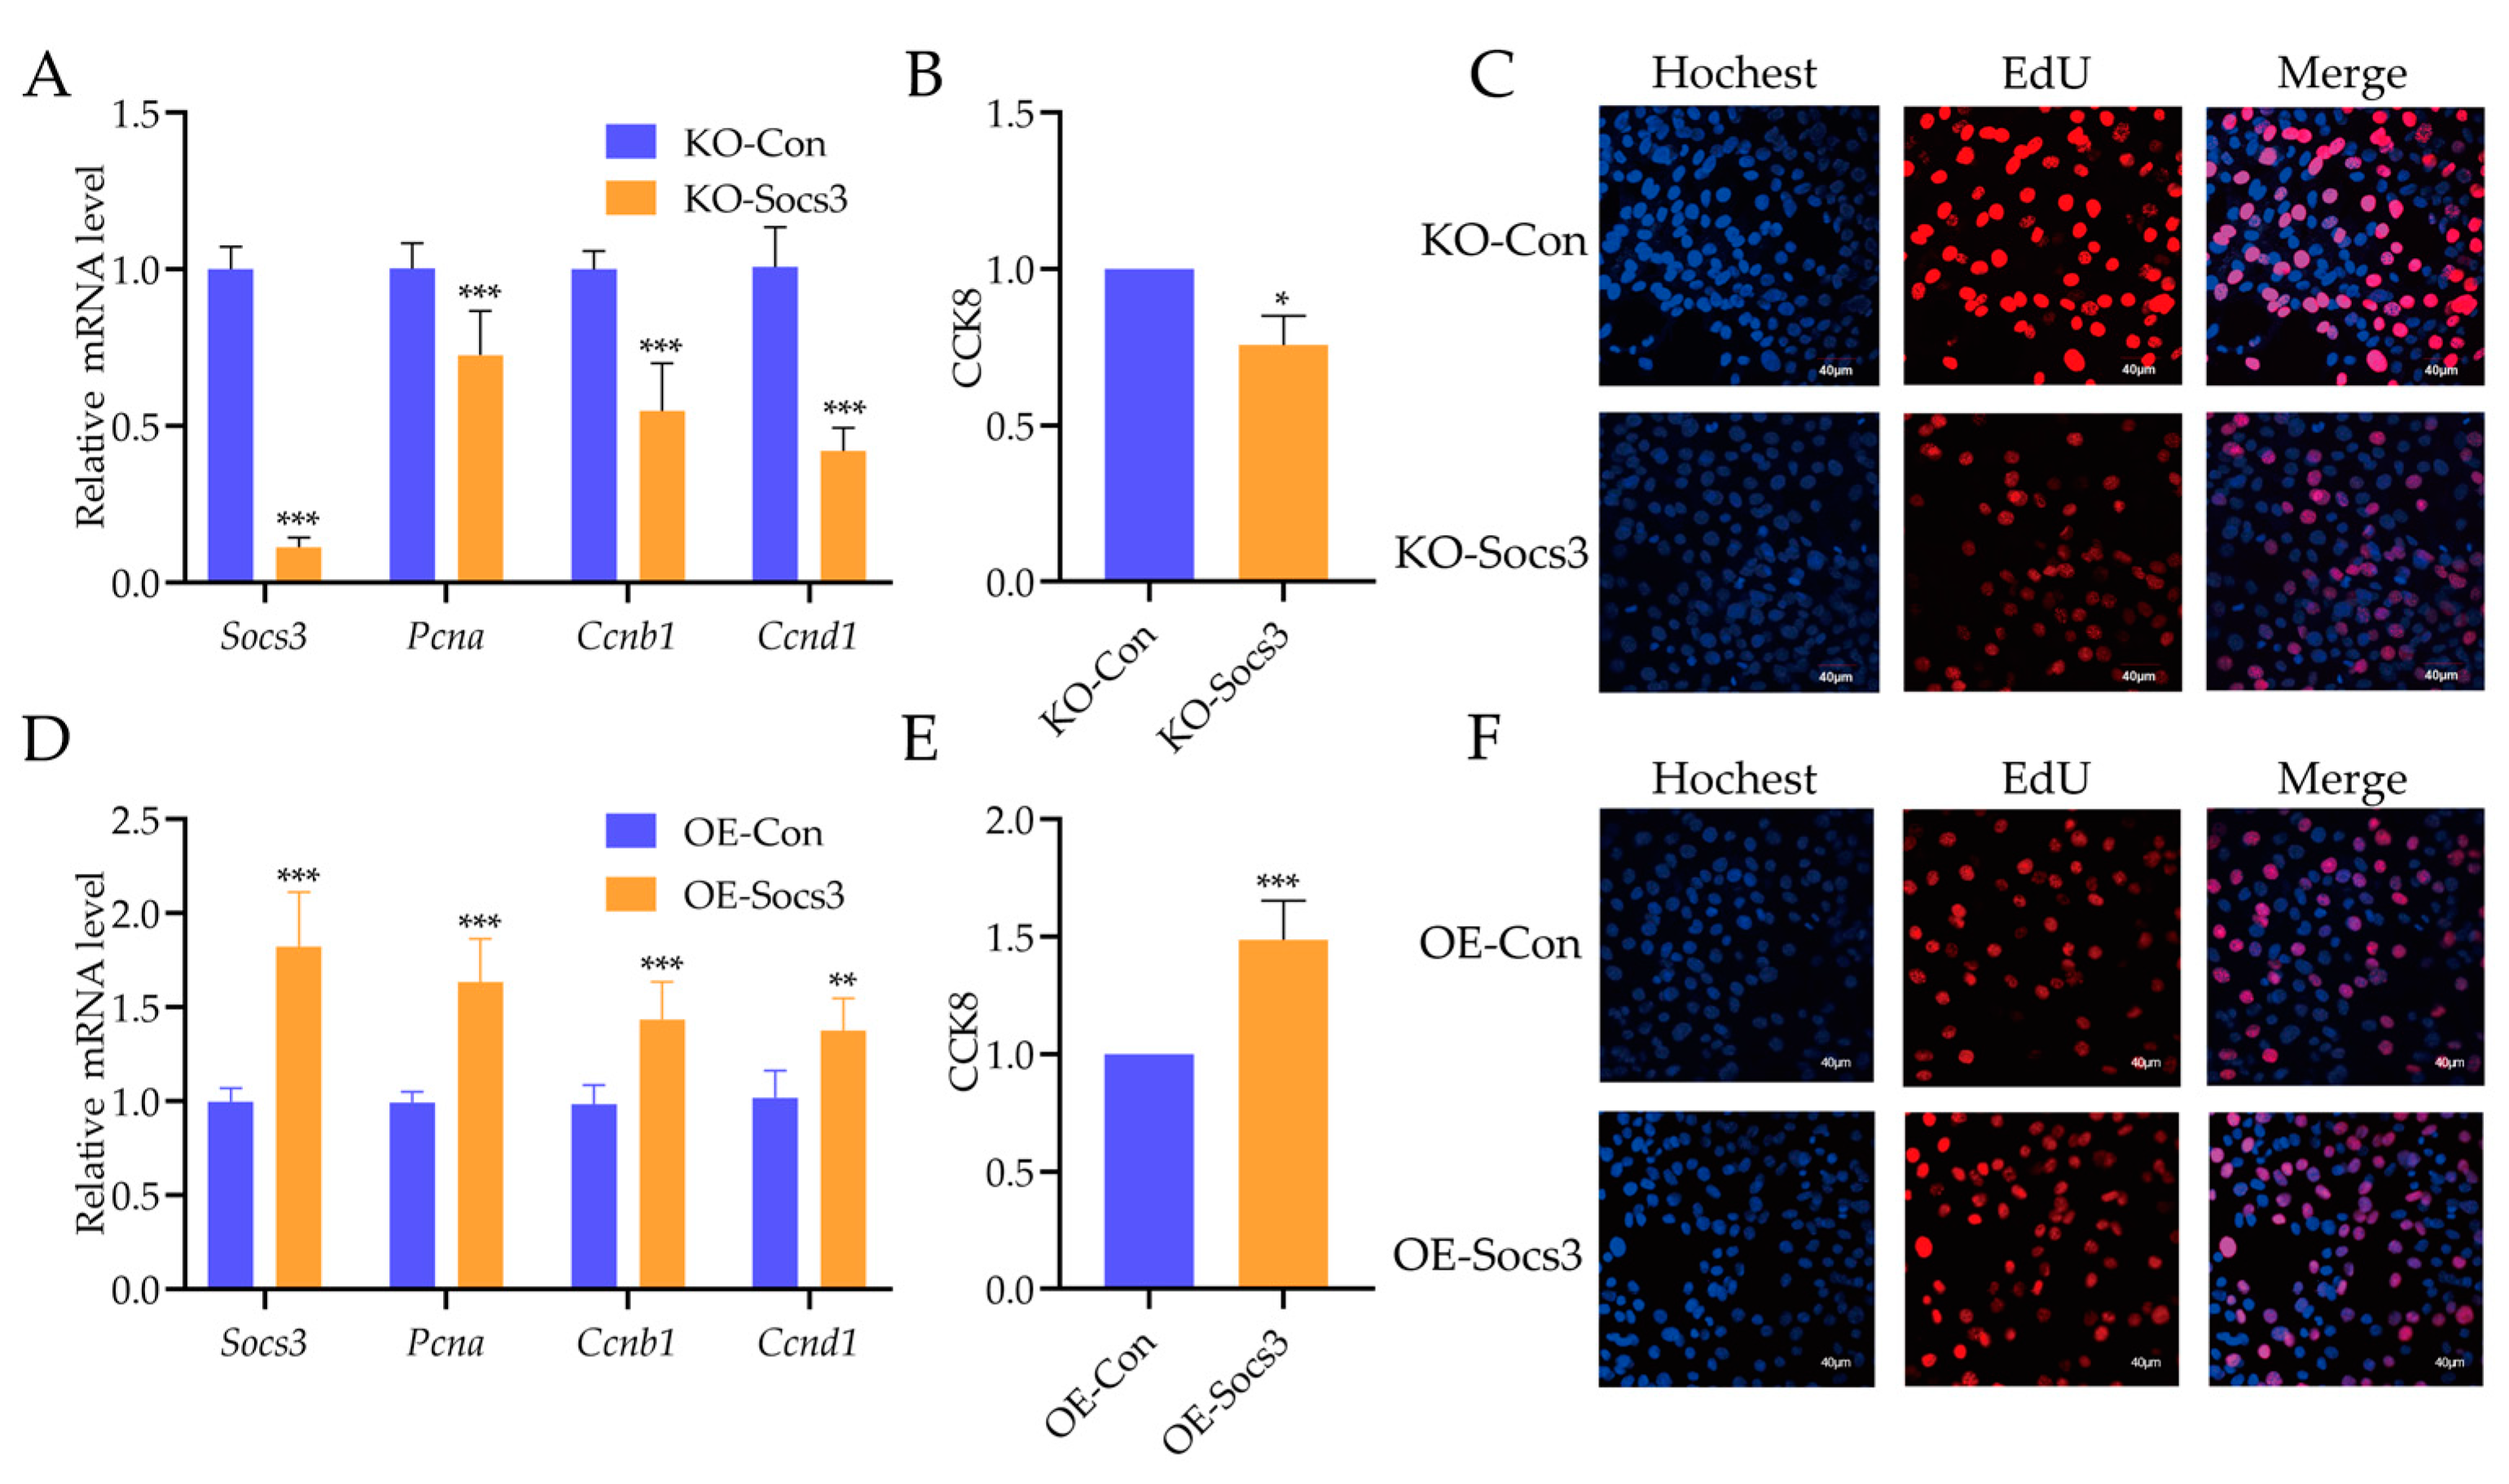
To explore the role of Socs3 for skeletal muscle, Socs3 knockout (KO) and overexpression (OE) mouse C2C12 cells were constructed. qPCR analysis showed that the Socs3 mRNA level significantly decreased and increased in Socs3 KO and OE mouse C2C12 cells, respectively (Figure 5A,D). Interestingly, proliferation-related genes, including Pcna, Ccnb1, and Ccnd1, were down-regulated in Socs3 KO cells (Figure 5A). The CCK8 and EdU cell proliferation assays further confirmed a decrease in the proliferation ability of Socs3 KO cells (Figure 5B,C). Conversely, Pcna, Ccnb1, and Ccnd1 were up-regulated in Socs3 OE cells. CCK8 and EdU cell proliferation assays showed an increase in the proliferation ability of Socs3 OE cells (Figure 5E,F). Then, the flow cytometry assay detected the cell cycle of Socs3 KO and OE cells. The results found that Socs3 KO decreased the percentage of cells in the G1 phase and increased cells in the G2 phase significantly (Figure 6A,B). Additionally, Socs3 OE increased the percentage of cells in the G1 phase and reduced cells in the S and G2 phases significantly (Figure 6C,D). These results indicate how Socs3 regulated the cell proliferation of myoblasts.

2.5. Socs3 Is Necessary for Glucose Uptake of Myotubes Cells

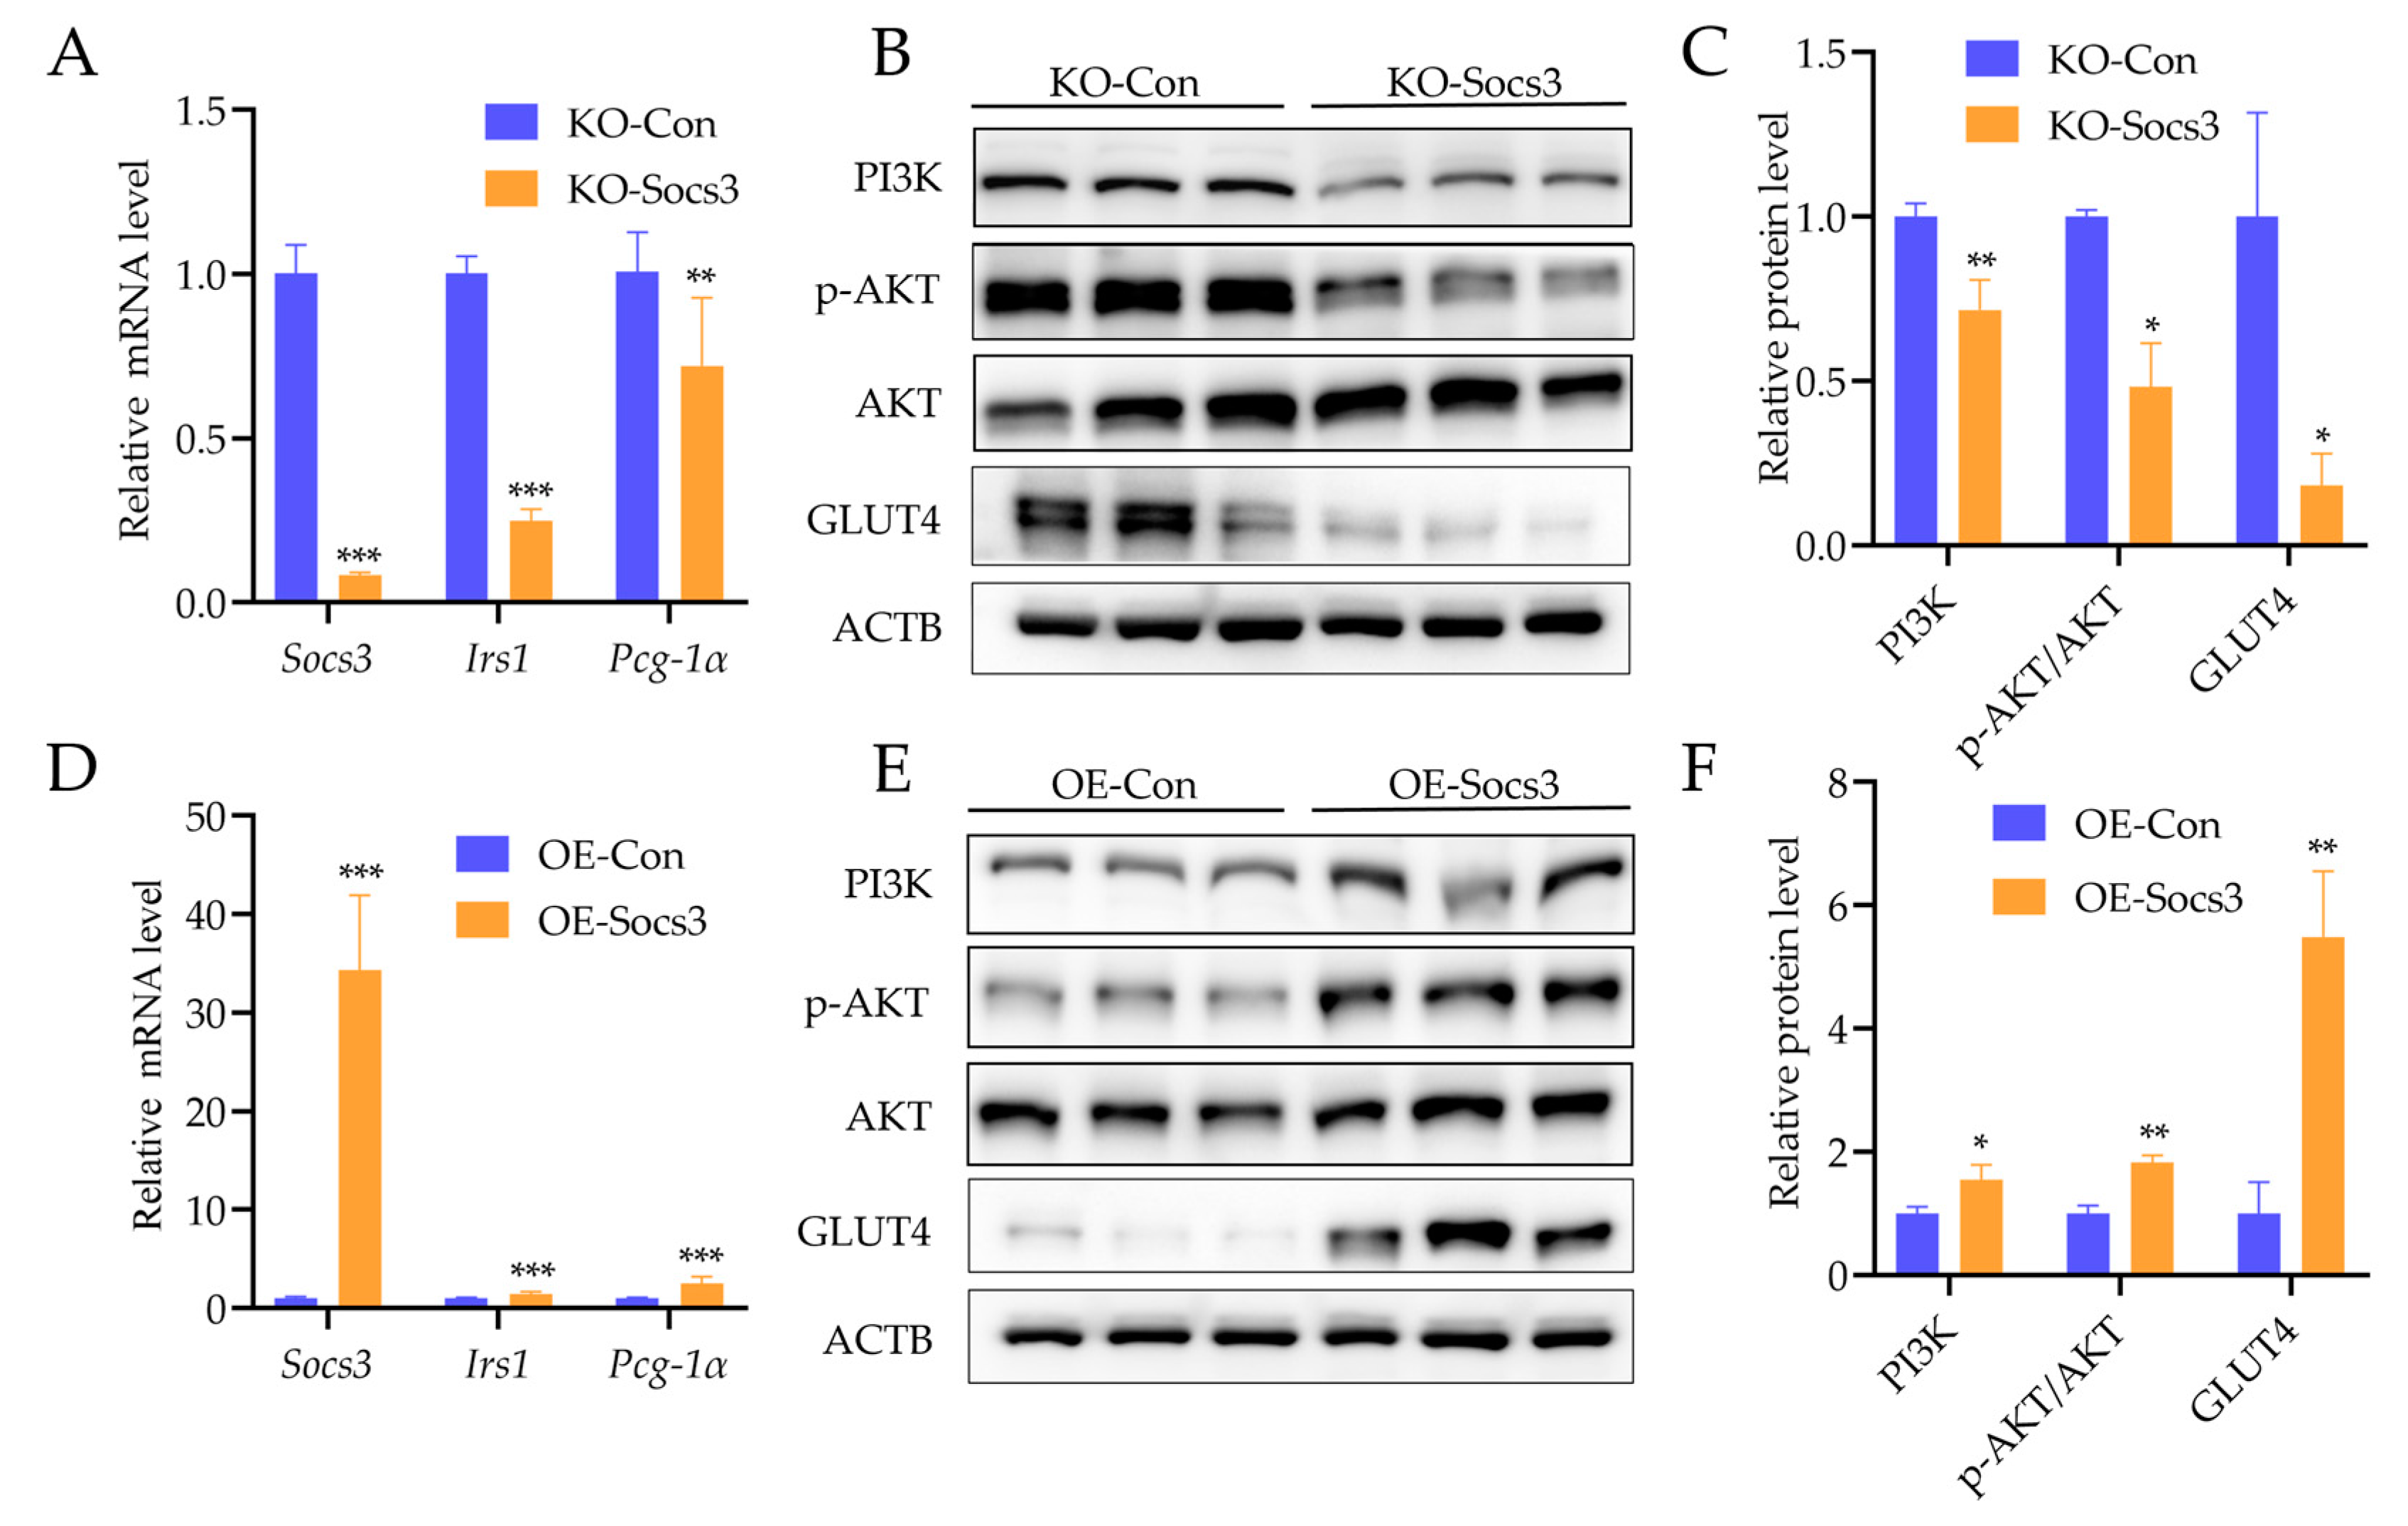
To identify the function of Socs3 in regulating glucose uptake in skeletal muscles, Socs3 KO and OE mouse C2C12 cells were induced with differentiation for 5 days and then collected for the experiments. The results showed that the Socs3 mRNA level significantly decreased and increased in Socs3 KO and OE C2C12 cells, respectively (Figure 7A,D). It is worth noticing that glucose-transfer-related genes, including Irs1 and Pcg-1α mRNA levels and GLUT4, PI3K, and p-AKT protein levels, were obviously reduced in Socs3 KO myotubes cells (Figure 7A–C). Additionally, Irs1 and Pcg-1α mRNA, as well as the GLUT4, PI3K, and p-AKT protein levels, evidently increased in Socs3 OE myotubes cells (Figure 7D–F). These results suggest that Socs3 mediated the glucose uptake of myotube cells.

3. Discussion

Jinhua pigs, one of the Chinese indigenous pig breeds, are well-known for their superior meat quality [20]. Intensive pig breeds generally exhibit lower meat quality traits than Jinhua pigs. Therefore, exploring the differences between the Jinhua pig breed and intensive pig breeds could contribute to uncovering the genetic mechanisms that regulate meat quality, which is meaningful for the development of the pig breeding industry. Considering the introduction of intensive pig breeds, the number of Chinese indigenous pigs was decreasing yearly, which has led to the crossbreeding of Chinese local pigs. To test the consistency of these samples, three population structure analysis methods (NJ-tree, PCA, Structure) were used to detect the authenticity and reliability of the Jinhua pig population. These results revealed the Jinhua pig population was significantly distinguished from intensive pig populations, which reflected that Jinhua pigs had a pure pedigree in this study. Meanwhile, these results provided a reliable basis for subsequent research.
With the development of high-throughput sequencing technology, a single level of molecules did not meet the research requirements at all, and multi-omics analysis came into being. In this context, for studying meat quality traits holistically, genomics and transcriptomics data were analyzed and combinedly to identify the candidate genes. The selection signatures method is commonly used for genomic analysis and has observed great progress in pigs [1,4], chickens [21,22], cattle [23,24], etc. Both the FST and XP-EHH methods are widely used for exploring selection signatures between populations [25]. In addition, RNA-Seq technology is generally used to identify the DEGs between two groups. Therefore, it might ensure the accuracy and reliability of the results and reduce false positive results through integrations of the FST, XP-EHH, and RNA-Seq methods. We know that multi-breed comparisons can better reflect the genetic differences in meat quality between Jinhua pigs and Western pigs. In future studies, we aim to continue to expand the data detection of different varieties.
There are many factors that influence meat quality, and skeletal muscle development is one of them. The rates of cell proliferation and cell cycle could reflect the conditions of skeletal muscle development [26]. Until now, the roles of SOCS3 in disease treatment and immune response have not been identified [27,28]. It remains unclear whether SOCS3 is involved in regulating skeletal muscle development. Therefore, we performed cell proliferation and the cell cycle of the myoblast in the current study. After the successful KO of Socs3, C2C12 cells showed a significant decrease in cell proliferation, as well as the cell ratios of the G1 phase, and Socs3 OE significantly increased cell proliferation, and the cell ratios in the G1 phase increased as well. These studies have confirmed that Socs3 regulates cell proliferation and the cell cycle to achieve the regulation of skeletal muscle development.
The glycogen content in skeletal muscle is another important factor that influences meat quality, and high glycogen content can result in low meat quality [14,16]. Considering that glucose is the basic building block of glycogen, it follows that the glucose uptake capacity of skeletal muscle determines the glycogen synthesis capacity [29,30]. Thus, it is necessary to explain the genetic mechanism in regulating the glucose uptake capacity of the skeletal muscle. Previous studies have reported that SOCS3 is a target for treating metabolic disorders and influences insulin sensitivity and glucose homeostasis in the body [31]. The insulin signaling pathway has a stimulatory effect on glucose uptake in skeletal muscle [32,33]. Additionally, the functions of SOCS3 in regulating energy metabolism and glycometabolism in tissues, such as the liver and adipose, have been reported widely [34,35]. However, the underlying mechanism of SOCS3 in the glucose uptake of skeletal muscle remains unclear as yet. In this study, by integrations of multi-omics analysis, SOCS3 was enriched significantly in Jinhua pigs, and a lower expression of SOCS3 was observed in Jinhua pigs compared to Landrace pigs. Therefore, it is necessary to verify the function of SOCS3 in regulating glucose uptake in skeletal muscle.
GLUT4 is the major glucose transport protein of skeletal muscle, which determines the glucose uptake level. Additionally, the PI3K-AKT signaling pathway is a classic pathway in muscle glucose metabolism. Skeletal muscle is the largest insulin receptor organ in the body when insulin binds to an insulin receptor, and activating IRS1 promotes the glucose uptake of skeletal muscle. Additionally, there was a paper published which suggested that IRS1 could be regulated by PCG-1α [36]. Furthermore, Guo et al. [37] found that the GLUT4 expression was mainly influenced by the IRS1/PI3K/AKT signal pathway. PI3K interacts with p-IRS with subunit p85 to activate/phosphorylate its downstream effector AKT; this response results in the translocation of GLUT4 and then the acceleration of glucose uptake activity in myoblasts and adipocytes [38,39]. Therefore, we evaluated the expression of IRS1, PI3K, and AKT since they are major upstream regulators of GLUT4 translocation. Here, the results describe how Socs3 KO myoblasts decreased the proteins of GLUT4, PI3K, and p-AKT, as well as the mRNA of Irs1 and Pcg-1α, which is consistent with the observations reported previously. In addition, Sosc3 OE myoblasts increased the proteins of GLUT4, PI3K, and p-AKT, and the mRNA of Irs1 and Pcg-1α increased as well. These results imply that Socs3 regulated the glucose uptake of myoblasts through the IRS1/PI3K/AKT signal pathway. Additionally, these results also suggest the reason why Jinhua pigs have better meat quality than intensive pigs may due to their lower expression of SOCS3, which reduces glucose uptake and results in decreased glycogen synthesis.

4. Materials and Methods

4.1. Genotype and Quality Control

A total of 558 pigs from six breeds were selected (Table S8). The DNA of Jinhua pigs was carried out from blood samples and genotyped using the GeneSeek GGP-Porcine chip (Neogen Corporation, Lansing, MI, USA). The SNP data of Duroc, Landrace, Large White, Berkshire, and Pietrain were obtained from the paper published by Yang et al. [40]. Genotype imputation was performed using Beagle version 5.0 via PHARP [41,42]. The quality control of SNPs was implemented using VCFtools version 0.1.14 [43], following the below criteria: (1) retaining the SNPs with a DR2 ≥ 0.5; (2) removing the SNPs with a call rate < 0.9 or MAF < 0.01; (3) retaining sites with a mean depth ≥ 3. Finally, the data set contained 8,528,947 autosome SNPs for further analysis.

4.2. Population Structure

To verify the consistency of the Jinhua pig population, we put Jinhua pigs together with other western pigs to make a population structure analysis. A molecular phylogenetic tree was constructed by the neighbor-joining (NJ) method in MEGA X, and the NJ-tree was visualized using FigTree v1.4.4. Principal component analysis (PCA) was conducted using Plink v1.9. software, and “PC1”, and “PC2” were used to distinguish the population structure. The result of PCA was visualized by the ggplot2 package. The population structure analysis was used by ADMIXTURE36 v1.3.0 [44]. The number of ancestral clusters (K) was set from 2 to 6, and a six-fold cross-validation was run to determine the K value with the lowest cross-validation error.

4.3. Selective Signatures Analysis and RNA-Seq Analysis

Two methods for genomic selection signature detection, including FST and XP-EHH, were performed to detect the genomic regions under selection in Jinhua pigs by comparing them with five western pig breeds. The FST value of each SNP between the Jinhua pigs and other pigs was calculated with vcftools v0.1.13. The top 0.05% of SNPs were empirically selected as potential candidate loci under a positive selection. The XP-EHH statistic was designed to detect ongoing or nearly fixed selection signatures by comparing the haplotypes from two populations [45]. XP-EHH values were estimated using Selscan v1.3.0, and the XP-EHH value of each SNP was normalized [46]. Extremely high values in the p < 0.005 right-tail of XP-EHH were selected as potential candidate loci under positive selection as well. The raw data of RNA-Seq of LDM between Jinhua and Landrace pigs were downloaded from the dataset GEO: GSE113237.

4.4. Functional Annotation

To define the actual function of the candidate genes above, the Kyoto Encyclopedia of Gene and Genomes (KEGG) pathway enrichment analysis was performed using KOBAS v3.0 [47]. The p < 0.05 of KEGG pathways were regarded as significant results.

4.5. Cell Culture and Treatment

C2C12 and 293T cell lines were used in this study and purchased from the National Collection of Authenticated Cell Cultures (Shanghai, China). The cells were cultured in a growth medium (GM) consisting of DMEM (Gibco, Grand Island, NY, USA) plus 10% fetal bovine serum (FBS; ExCell, Shanghai, China) and 1% penicillin-streptomycin (Gibco, Grand Island, NJ, USA) in a 5% CO2 humidified incubator at 37 °C. After C2C12 cells reached 80–90% confluence, the differentiation medium (DM), supplemented with 2% horse serum (HS; Gibco, USA), replacing FBS, was used to induce myogenic differentiation.

4.6. SOCS3 Knockdown and Overexpression

For lentiviral infection experiments, plasmid lentiCRISPRv2, psPAX2, and pMD2.G were necessary. At first, sgRNA (5′-TACTGGAGCGCCGTGACCGG-3′) was designed through an online website (https://crispr.dbcls.jp, accessed on 7 November 2020), which was subcloned into the lentiCRISPRv2 vector between BglII/HpaI restriction enzyme sites. The recombined lentiCRISPRv2 vector was co-transfected into 293T cells with psPAX2 and pMD2.G plasmids using the Lipofectamine 2000 reagent (Invitrogen, Waltham, MA, USA). After 48 h and 72 h, the supernatants were harvested and filtered through 0.22 μm pore filters (Sartorius, Göttingen, Germany) to gain lentiviruses. Finally, C2C12 myoblasts were infected with lentiviruses plus 4 μg/mL polybrene (Beyotime Biotechnology, Shanghai, China) and sieved with 3 μg/mL puromycin (Gibco, USA). SOCS3 overexpression plasmids were purchased from Hanbio (Shanghai, China).

4.7. Cell Proliferation and Cell Cycle Assay

For the cell proliferation assay, the transfected myoblasts were cultured in a 12-well plate detected by the EdU assay kit (Vazyme, Nanjing, China) and following the manufacturer’s protocol. Images were obtained by fluorescence microscopy (Nikon, Tokyo, Japan). Cell proliferation was also treated with a CCK-8 assay kit (Solarbio, Beijing, China). The transfected myoblasts were cultured in a 96-well plate treated with 10 μL of CCK-8 after incubation at 37 °C for 2 h and the absorbance was detected at 450 nm using a microplate reader (BioTek, Winooski, VT, USA). To detect the cell cycle, the transfected myoblasts were cultured in a 6-well plate and stained with propidium iodide. Then, the ratios of the cells in the G1, S, and G2 phases were counted and compared using flow cytometry (BD Biosciences, Franklin Lakes, NJ, USA).

4.8. Quantitative Real-Time PCR

The total RNA was extracted from C2C12 using the TRIzol reagent (Thermo, Waltham, MA, USA). mRNA, which was reverse-transcribed into cDNA using the reverse transcription kit (Vazyme, China), and cDNA was analyzed by an SYBR Green PCR mix kit (Vazyme, China) in the QIAquant96 2plex system (Qiagen, Hilden, Germany). Relative gene expression was calculated using the 2−ΔΔCt method and normalized to Actb. The primers are shown in Table S9.

4.9. Western Blot

The total proteins were isolated from C2C12 using RIPA lysis buffer plus protease and phosphatase inhibitors (Beyotime Biotechnology, China). The proteins were boiled with a 5× SDS loading buffer for 10 min at 100 °C for denaturation. The proteins were separated by SDS-PAGE and transferred to PVDF membranes (Millipore, Burlington, MA, USA). The membranes were blocked with 5% non-fat milk at room temperature for 1 h and were subsequently incubated with primary antibodies overnight at 4 °C. The next day, the membranes were washed three times using 1× TBST and were then incubated with secondary antibodies at room temperature for 1 h. At last, the membranes were washed three times and exposed to an ECL Reagent (Beyotime Biotechnology, China). The WB results were photographed by the SHST Capture system (Shenhua, Hangzhou, China) and quantified using ImageJ v.1.8.0. The antibodies are shown in Table S10.

4.10. Statistical Analysis

In this study, the statistical significance of differences was determined using an unpaired Student’s t-test with GraphPad Prism 8. The data were presented as the mean ± SD, * represents p < 0.05, ** represents p < 0.01, and *** represents p < 0.001.

5. Conclusions

Taken together, SOCS3 was simultaneously annotated through combination analysis based on genomics and transcriptomics and regarded as the candidate gene that could regulate the meat quality of pigs. The results indicate that SOCS3 not only influences myoblast proliferation and cell cycle but also regulates the glucose uptake of myoblasts through the IRS1/PI3K/AKT signaling pathway in mouse C2C12 cells. These findings provide a theoretical basis for further insights into the regulating mechanism of meat quality traits in pigs. In addition, we still need to further explore the function of SOCS3 in regulating porcine skeletal muscle cells.

Supplementary Materials

The supporting information can be downloaded at: https://www.mdpi.com/article/10.3390/ijms241310593/s1.

Author Contributions

F.W., Y.P. and Q.W. designed the research. F.W., Z.C., Z.W., Z.Z. (Zhenyang Zhang) and Z.Z. (Zhe Zhang) analyzed the data. F.W. wrote the paper. All authors have read and agreed to the published version of the manuscript.

Funding

This research was funded by the National Natural Science Foundation of China (Grant number: U21A20249, 32272833), Zhejiang Science and Technology Major Program on Agricultural New Variety Breeding (Grant number: 2021C02068-1) and the Zhejiang Provincial Natural Science Foundation of China under Grant No. LZ23C170003.

Institutional Review Board Statement

The experimental procedures in this study were approved by the Animal Care and Use Committee of Zhejiang University (Hangzhou, China) (No. ZJU20220224).

Informed Consent Statement

Not applicable.

Data Availability Statement

The SNP chip datasets: 558 samples are available from the APLHADB (http://alphaindex.zju.edu.cn/ALPHADB/download.html, accessed on 23 June 2023). The RNA-Seq data of LDM between Jinhua and Landrace pigs from previous study is available from the NCBI (Bioproject number PRJNA450530).

Conflicts of Interest

The authors declare no conflict of interest.

References

  1. Wang, Z.; Sun, H.; Chen, Q.; Zhang, X.; Wang, Q.; Pan, Y. A genome scan for selection signatures in Taihu pig breeds using next-generation sequencing. Anim. Int. J. Anim. Biosci. 2019, 13, 683–693. [Google Scholar] [CrossRef] [PubMed]
  2. Wang, K.; Wu, P.; Wang, S.; Ji, X.; Chen, D.; Jiang, A.; Xiao, W.; Gu, Y.; Jiang, Y.; Zeng, Y.; et al. Genome-wide DNA methylation analysis in Chinese Chenghua and Yorkshire pigs. BMC Genom. Data 2021, 22, 21. [Google Scholar] [CrossRef]
  3. Shi, Y.; Fan, S.; Wu, M.; Zuo, Z.; Li, X.; Jiang, L.; Shen, Q.; Xu, P.; Zeng, L.; Zhou, Y.; et al. YTHDF1 links hypoxia adaptation and non-small cell lung cancer progression. Nat. Commun. 2019, 10, 4892. [Google Scholar] [CrossRef] [Green Version]
  4. Sun, H.; Wang, Z.; Zhang, Z.; Xiao, Q.; Mawed, S.; Xu, Z.; Zhang, X.; Yang, H.; Zhu, M.; Xue, M.; et al. Genomic signatures reveal selection of characteristics within and between Meishan pig populations. Anim. Genet. 2018, 49, 119–126. [Google Scholar] [CrossRef] [Green Version]
  5. Xu, Z.; Sun, H.; Zhang, Z.; Zhao, Q.; Olasege, B.S.; Li, Q.; Yue, Y.; Ma, P.; Zhang, X.; Wang, Q.; et al. Assessment of Autozygosity Derived From Runs of Homozygosity in Jinhua Pigs Disclosed by Sequencing Data. Front. Genet. 2019, 10, 274. [Google Scholar] [CrossRef]
  6. Noidad, S.; Limsupavanich, R.; Suwonsichon, S.; Chaosap, C. Effect of visual marbling levels in pork loins on meat quality and Thai consumer acceptance and purchase intent. Asian-Australas. J. Anim. Sci. 2019, 32, 1923–1932. [Google Scholar] [CrossRef] [Green Version]
  7. Gjerlaug-Enger, E.; Aass, L.; Odegård, J.; Vangen, O. Genetic parameters of meat quality traits in two pig breeds measured by rapid methods. Anim. Int. J. Anim. Biosci. 2010, 4, 1832–1843. [Google Scholar] [CrossRef] [Green Version]
  8. Suzuki, K.; Irie, M.; Kadowaki, H.; Shibata, T.; Kumagai, M.; Nishida, A. Genetic parameter estimates of meat quality traits in Duroc pigs selected for average daily gain, longissimus muscle area, backfat thickness, and intramuscular fat content. J. Anim. Sci. 2005, 83, 2058–2065. [Google Scholar] [CrossRef] [Green Version]
  9. Lonergan, S.M.; Huff-Lonergan, E.; Rowe, L.J.; Kuhlers, D.L.; Jungst, S.B. Selection for lean growth efficiency in Duroc pigs influences pork quality. J. Anim. Sci. 2001, 79, 2075–2085. [Google Scholar] [CrossRef] [PubMed] [Green Version]
  10. Schwab, C.R.; Baas, T.J.; Stalder, K.J.; Mabry, J.W. Effect of long-term selection for increased leanness on meat and eating quality traits in Duroc swine. J. Anim. Sci. 2006, 84, 1577–1583. [Google Scholar] [CrossRef] [PubMed] [Green Version]
  11. Sant’anna, A.C.; Valente, T.D.S.; Magalhães, A.F.B.; Espigolan, R.; Ceballos, M.C.; de Albuquerque, L.G.; Paranhos da Costa, M.J.R. Relationships between temperament, meat quality, and carcass traits in Nellore cattle1. J. Anim. Sci. 2019, 97, 4721–4731. [Google Scholar] [CrossRef] [PubMed]
  12. Zhang, Y.; Zhang, J.; Gong, H.; Cui, L.; Zhang, W.; Ma, J.; Chen, C.; Ai, H.; Xiao, S.; Huang, L.; et al. Genetic correlation of fatty acid composition with growth, carcass, fat deposition and meat quality traits based on GWAS data in six pig populations. Meat Sci. 2019, 150, 47–55. [Google Scholar] [CrossRef] [PubMed]
  13. Bérard, J.; Kreuzer, M.; Bee, G. Effect of litter size and birth weight on growth, carcass and pork quality, and their relationship to postmortem proteolysis. J. Anim. Sci. 2008, 86, 2357–2368. [Google Scholar] [CrossRef]
  14. Ma, J.; Yang, J.; Zhou, L.; Ren, J.; Liu, X.; Zhang, H.; Yang, B.; Zhang, Z.; Ma, H.; Xie, X.; et al. A splice mutation in the PHKG1 gene causes high glycogen content and low meat quality in pig skeletal muscle. PLoS Genet. 2014, 10, e1004710. [Google Scholar] [CrossRef] [PubMed] [Green Version]
  15. Ciobanu, D.; Bastiaansen, J.; Malek, M.; Helm, J.; Woollard, J.; Plastow, G.; Rothschild, M. Evidence for new alleles in the protein kinase adenosine monophosphate-activated gamma(3)-subunit gene associated with low glycogen content in pig skeletal muscle and improved meat quality. Genetics 2001, 159, 1151–1162. [Google Scholar] [CrossRef]
  16. Milan, D.; Jeon, J.T.; Looft, C.; Amarger, V.; Robic, A.; Thelander, M.; Rogel-Gaillard, C.; Paul, S.; Iannuccelli, N.; Rask, L.; et al. A mutation in PRKAG3 associated with excess glycogen content in pig skeletal muscle. Science 2000, 288, 1248–1251. [Google Scholar] [CrossRef]
  17. Park, J.E.; Seo, Y.; Han, J.S. HM-chromanone, a component of Portulaca oleracea L., stimulates glucose uptake and glycogen synthesis in skeletal muscle cell. Phytomed. Int. J. Phytother. Phytopharm. 2021, 83, 153473. [Google Scholar] [CrossRef]
  18. Ma, H.; Zhang, S.; Zhang, K.; Zhan, H.; Peng, X.; Xie, S.; Li, X.; Zhao, S.; Ma, Y. Identifying Selection Signatures for Backfat Thickness in Yorkshire Pigs Highlights New Regions Affecting Fat Metabolism. Genes 2019, 10, 254. [Google Scholar] [CrossRef] [Green Version]
  19. Diao, S.; Huang, S.; Chen, Z.; Teng, J.; Ma, Y.; Yuan, X.; Chen, Z.; Zhang, H.; Li, J.; Zhang, Z. Genome-Wide Signatures of Selection Detection in Three South China Indigenous Pigs. Genes 2019, 10, 346. [Google Scholar] [CrossRef] [Green Version]
  20. Wu, T.; Zhang, Z.; Yuan, Z.; Lo, L.J.; Chen, J.; Wang, Y.; Peng, J. Distinctive genes determine different intramuscular fat and muscle fiber ratios of the longissimus dorsi muscles in Jinhua and landrace pigs. PLoS ONE 2013, 8, e53181. [Google Scholar] [CrossRef] [PubMed] [Green Version]
  21. Luo, W.; Luo, C.; Wang, M.; Guo, L.; Chen, X.; Li, Z.; Zheng, M.; Folaniyi, B.S.; Luo, W.; Shu, D.; et al. Genome diversity of Chinese indigenous chicken and the selective signatures in Chinese gamecock chicken. Sci. Rep. 2020, 10, 14532. [Google Scholar] [CrossRef]
  22. Tan, X.; Liu, R.; Li, W.; Zheng, M.; Zhu, D.; Liu, D.; Feng, F.; Li, Q.; Liu, L.; Wen, J.; et al. Assessment the effect of genomic selection and detection of selective signature in broilers. Poult. Sci. 2022, 101, 101856. [Google Scholar] [CrossRef]
  23. Duarte, I.N.H.; Bessa, A.F.O.; Rola, L.D.; Genuíno, M.V.H.; Rocha, I.M.; Marcondes, C.R.; Regitano, L.C.A.; Munari, D.P.; Berry, D.P.; Buzanskas, M.E. Cross-population selection signatures in Canchim composite beef cattle. PLoS ONE 2022, 17, e0264279. [Google Scholar] [CrossRef]
  24. Ma, X.; Cheng, H.; Liu, Y.; Sun, L.; Chen, N.; Jiang, F.; You, W.; Yang, Z.; Zhang, B.; Song, E.; et al. Assessing Genomic Diversity and Selective Pressures in Bohai Black Cattle Using Whole-Genome Sequencing Data. Animals 2022, 12, 665. [Google Scholar] [CrossRef]
  25. Vatsiou, A.I.; Bazin, E.; Gaggiotti, O.E. Detection of selective sweeps in structured populations: A comparison of recent methods. Mol. Ecol. 2016, 25, 89–103. [Google Scholar] [CrossRef] [PubMed] [Green Version]
  26. Hwang, S.Y.; Kang, Y.J.; Sung, B.; Jang, J.Y.; Hwang, N.L.; Oh, H.J.; Ahn, Y.R.; Kim, H.J.; Shin, J.H.; Yoo, M.A.; et al. Folic acid is necessary for proliferation and differentiation of C2C12 myoblasts. J. Cell. Physiol. 2018, 233, 736–747. [Google Scholar] [CrossRef] [PubMed]
  27. Zhang, B.; Yuan, L.; Chen, G.; Chen, X.; Yang, X.; Fan, T.; Sun, C.; Fan, D.; Chen, Z. Deciphering Obesity-Related Gene Clusters Unearths SOCS3 Immune Infiltrates and 5mC/m6A Modifiers in Ossification of Ligamentum Flavum Pathogenesis. Front. Endocrinol. 2022, 13, 861567. [Google Scholar] [CrossRef] [PubMed]
  28. Li, H.B.; Tong, J.; Zhu, S.; Batista, P.J.; Duffy, E.E.; Zhao, J.; Bailis, W.; Cao, G.; Kroehling, L.; Chen, Y.; et al. m6A mRNA methylation controls T cell homeostasis by targeting the IL-7/STAT5/SOCS pathways. Nature 2017, 548, 338–342. [Google Scholar] [CrossRef] [Green Version]
  29. Phielix, E.; Begovatz, P.; Gancheva, S.; Bierwagen, A.; Kornips, E.; Schaart, G.; Hesselink, M.K.C.; Schrauwen, P.; Roden, M. Athletes feature greater rates of muscle glucose transport and glycogen synthesis during lipid infusion. JCI Insight 2019, 4, e127928. [Google Scholar] [CrossRef] [Green Version]
  30. Yang, H.; Li, H.; Song, Y.; Sui, Y.; Du, Z.; Zhang, G. Bombyxin II Regulates Glucose Absorption and Glycogen Synthesis through the PI3K Signaling Pathway in HepG2 Cells. BioMed Res. Int. 2021, 2021, 6639232. [Google Scholar] [CrossRef]
  31. Pedroso, J.A.B.; Ramos-Lobo, A.M.; Donato, J., Jr. SOCS3 as a future target to treat metabolic disorders. Hormones 2019, 18, 127–136. [Google Scholar] [CrossRef]
  32. Cazarolli, L.H.; Pereira, D.F.; Kappel, V.D.; Folador, P.; Figueiredo Mdos, S.; Pizzolatti, M.G.; Silva, F.R. Insulin signaling: A potential signaling pathway for the stimulatory effect of kaempferitrin on glucose uptake in skeletal muscle. Eur. J. Pharmacol. 2013, 712, 1–7. [Google Scholar] [CrossRef]
  33. Di Camillo, B.; Eduati, F.; Nair, S.K.; Avogaro, A.; Toffolo, G.M. Leucine modulates dynamic phosphorylation events in insulin signaling pathway and enhances insulin-dependent glycogen synthesis in human skeletal muscle cells. BMC Cell Biol. 2014, 15, 9. [Google Scholar] [CrossRef] [Green Version]
  34. Ye, J.; Zheng, R.; Wang, Q.; Liao, L.; Ying, Y.; Lu, H.; Cianflone, K.; Ning, Q.; Luo, X. Downregulating SOCS3 with siRNA ameliorates insulin signaling and glucose metabolism in hepatocytes of IUGR rats with catch-up growth. Pediatr. Res. 2012, 72, 550–559. [Google Scholar] [CrossRef] [PubMed] [Green Version]
  35. Palanivel, R.; Fullerton, M.D.; Galic, S.; Honeyman, J.; Hewitt, K.A.; Jorgensen, S.B.; Steinberg, G.R. Reduced Socs3 expression in adipose tissue protects female mice against obesity-induced insulin resistance. Diabetologia 2012, 55, 3083–3093. [Google Scholar] [CrossRef] [PubMed] [Green Version]
  36. Montori-Grau, M.; Aguilar-Recarte, D.; Zarei, M.; Pizarro-Delgado, J.; Palomer, X.; Vázquez-Carrera, M. Endoplasmic reticulum stress downregulates PGC-1α in skeletal muscle through ATF4 and an mTOR-mediated reduction of CRTC2. Cell Commun. Signal. CCS 2022, 20, 53. [Google Scholar] [CrossRef] [PubMed]
  37. Guo, X.; Sun, W.; Luo, G.; Wu, L.; Xu, G.; Hou, D.; Hou, Y.; Guo, X.; Mu, X.; Qin, L.; et al. Panax notoginseng saponins alleviate skeletal muscle insulin resistance by regulating the IRS1-PI3K-AKT signaling pathway and GLUT4 expression. FEBS Open Bio 2019, 9, 1008–1019. [Google Scholar] [CrossRef] [Green Version]
  38. Zhu, Y.L.; Chen, T.; Xiong, J.L.; Wu, D.; Xi, Q.Y.; Luo, J.Y.; Sun, J.J.; Zhang, Y.L. miR-146b Inhibits Glucose Consumption by Targeting IRS1 Gene in Porcine Primary Adipocytes. Int. J. Mol. Sci. 2018, 19, 783. [Google Scholar] [CrossRef]
  39. Li, W.; Liang, X.; Zeng, Z.; Yu, K.; Zhan, S.; Su, Q.; Yan, Y.; Mansai, H.; Qiao, W.; Yang, Q.; et al. Simvastatin inhibits glucose uptake activity and GLUT4 translocation through suppression of the IR/IRS-1/Akt signaling in C2C12 myotubes. Biomed. Pharmacother. Biomed. Pharmacother. 2016, 83, 194–200. [Google Scholar] [CrossRef] [Green Version]
  40. Yang, B.; Cui, L.; Perez-Enciso, M.; Traspov, A.; Crooijmans, R.; Zinovieva, N.; Schook, L.B.; Archibald, A.; Gatphayak, K.; Knorr, C.; et al. Genome-wide SNP data unveils the globalization of domesticated pigs. Genet. Sel. Evol. GSE 2017, 49, 71. [Google Scholar] [CrossRef] [Green Version]
  41. Browning, B.L.; Zhou, Y.; Browning, S.R. A One-Penny Imputed Genome from Next-Generation Reference Panels. Am. J. Hum. Genet. 2018, 103, 338–348. [Google Scholar] [CrossRef] [Green Version]
  42. Wang, Z.; Zhang, Z.; Chen, Z.; Sun, J.; Cao, C.; Wu, F.; Xu, Z.; Zhao, W.; Sun, H.; Guo, L.; et al. PHARP: A pig haplotype reference panel for genotype imputation. Sci. Rep. 2022, 12, 12645. [Google Scholar] [CrossRef] [PubMed]
  43. Danecek, P.; Auton, A.; Abecasis, G.; Albers, C.A.; Banks, E.; DePristo, M.A.; Handsaker, R.E.; Lunter, G.; Marth, G.T.; Sherry, S.T.; et al. The variant call format and VCFtools. Bioinformatics 2011, 27, 2156–2158. [Google Scholar] [CrossRef] [PubMed] [Green Version]
  44. Alexander, D.H.; Novembre, J.; Lange, K. Fast model-based estimation of ancestry in unrelated individuals. Genome Res. 2009, 19, 1655–1664. [Google Scholar] [CrossRef] [PubMed] [Green Version]
  45. Sabeti, P.C.; Varilly, P.; Fry, B.; Lohmueller, J.; Hostetter, E.; Cotsapas, C.; Xie, X.; Byrne, E.H.; McCarroll, S.A.; Gaudet, R.; et al. Genome-wide detection and characterization of positive selection in human populations. Nature 2007, 449, 913–918. [Google Scholar] [CrossRef] [Green Version]
  46. Szpiech, Z.A.; Hernandez, R.D. selscan: An efficient multithreaded program to perform EHH-based scans for positive selection. Mol. Biol. Evol. 2014, 31, 2824–2827. [Google Scholar] [CrossRef] [Green Version]
  47. Bu, D.; Luo, H.; Huo, P.; Wang, Z.; Zhang, S.; He, Z.; Wu, Y.; Zhao, L.; Liu, J.; Guo, J.; et al. KOBAS-i: Intelligent prioritization and exploratory visualization of biological functions for gene enrichment analysis. Nucleic Acids Res. 2021, 49, W317–W325. [Google Scholar] [CrossRef]
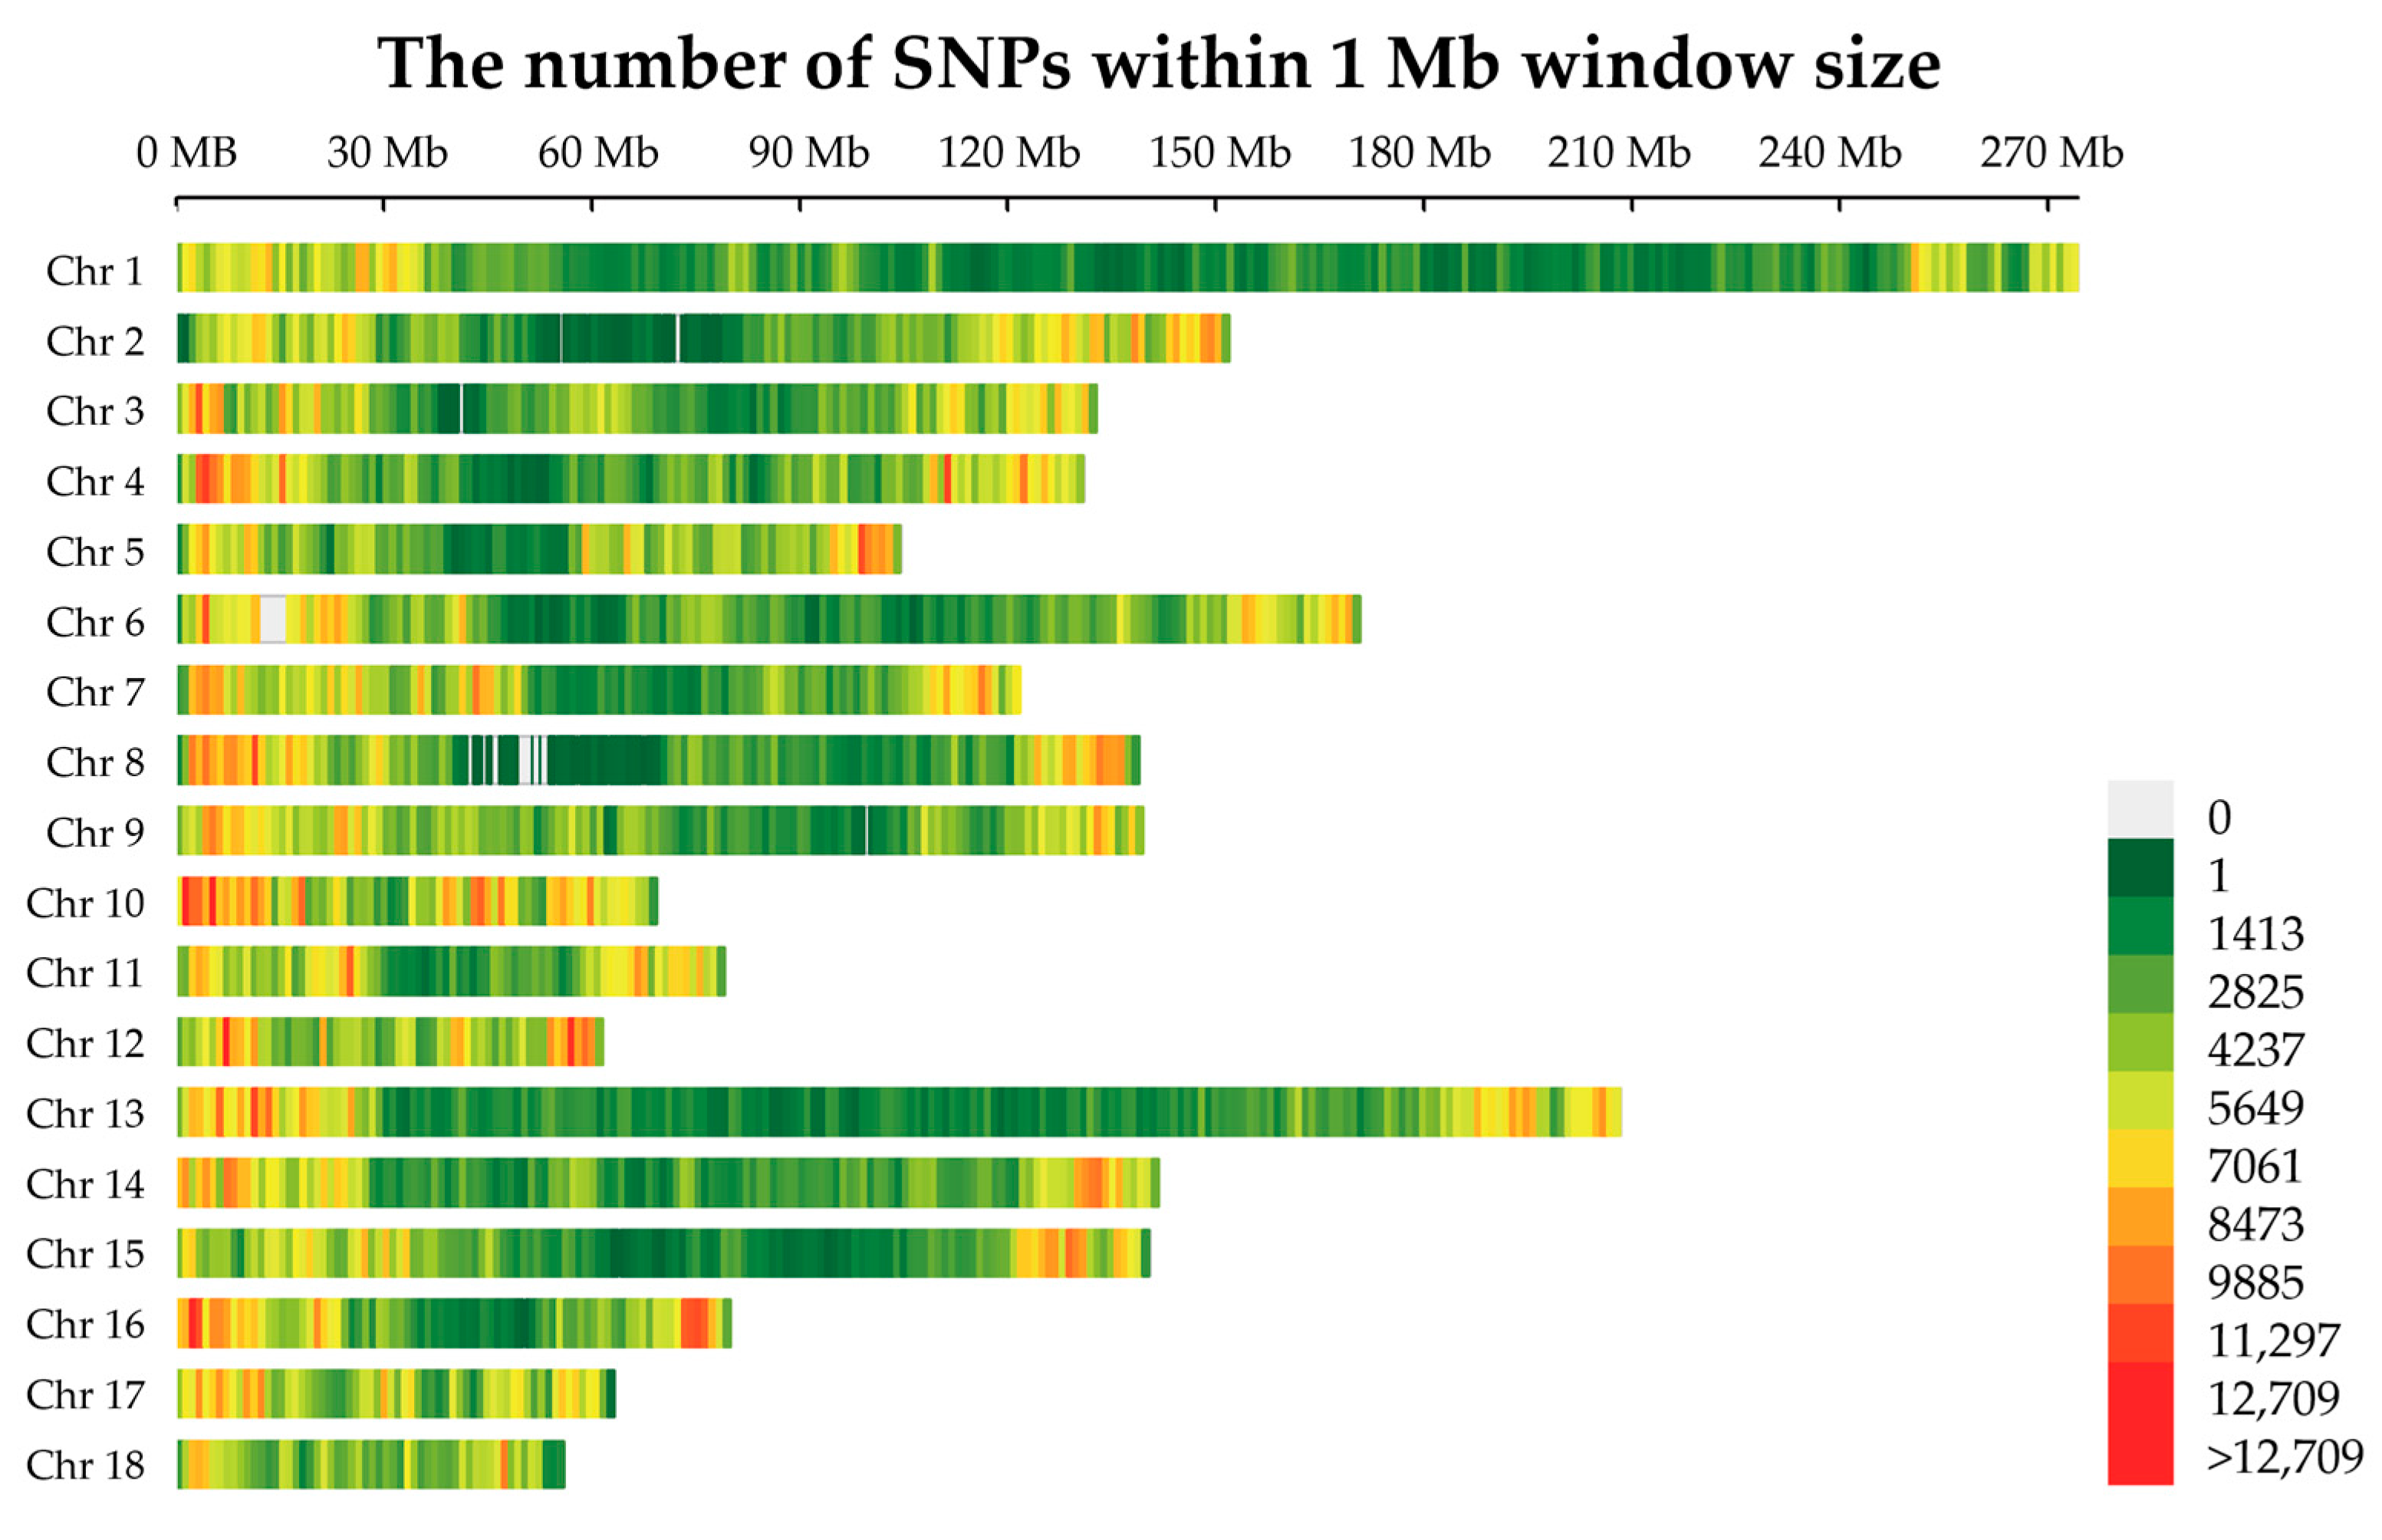
Figure 1. Distribution of SNPs on chromosomes. The x-axis represents the chromosomal position, and the y-axis represents chromosomes. Different colors represent SNP density in each 1 Mb genome block.
Ijms 24 10593 g001
Figure 2. Population structure analysis between Jinhua, Duroc, Landrace, Yorkshire, Pietrain, and Berkshire pig breeds. (A) The NJ-tree analysis of all individuals. (B) The PCA analysis of all individuals. The x-axis denotes the first principal component, and the y-axis represents the second principal component. (C) The population structure of all individuals. K represents the number of possible ancestral varieties.
Ijms 24 10593 g002
Figure 3. Selection signature analysis and RNA-Seq analysis. (A) The distribution of selection signatures between Jinhua pigs and Western pigs was detected by the FST method. The x-axis represents the chromosome location of SNPs; the y-axis represents the FST values of SNPs. (B) The distribution of selection signatures between Jinhua pigs and western pigs was detected by the XP-EHH method. The x-axis represents the chromosome location of SNPs, and the y-axis represents the XP-EHH values of SNPs. (C) The volcano plot of DEGs based on RNA-Seq analysis. The red dots, blue dots, and grey dots represent the up-regulated genes, down-regulated genes, and no differentially expressed genes in Jinhua pigs compared with Landrace pigs, respectively. (D) The Venn analysis of different genes annotated by FST, XP-EHH, and RNA-Seq methods.
Ijms 24 10593 g003
Figure 4. The function analysis of candidate genes. (A) The KEGG enrichment of genes selected by the FST method. (B) The KEGG enrichment of genes selected by the XP-EHH method. (C) The KEGG enrichment of genes annotated by the RNA-Seq method. (D) The KEGG enrichment analysis of common candidate genes found by FST, XP-EHH, and RNA-Seq methods. (E) The PPI interaction network analysis of candidate genes.
Ijms 24 10593 g004
Figure 5. Socs3 influences the proliferation of myoblasts. (A) The mRNA levels of Socs3, Pcna, Ccnb1, and Ccnd1 in Socs3 knockdown C2C12 cells using qPCR. (B) The CCK-8 assay was used to measure the proliferation of Socs3 knockdown C2C12 cells. (C) The EdU assay was used to measure the proliferation of Socs3 knockdown C2C12 cells. (D) The mRNA levels of Socs3, Pcna, Ccnb1, and Ccnd1 in Socs3 overexpression C2C12 cells using qPCR. (E) The CCK-8 assay was used to measure the proliferation of Socs3 overexpression C2C12 cells. (F) The EdU assay was used to measure the proliferation of Socs3 overexpression C2C12 cells. The scale bar indicates 40 μm. Actb was used as a loading control in qPCR. *: p < 0.05, **: p < 0.01, ***: p < 0.001.
Ijms 24 10593 g005
Figure 6. Socs3 influences the cell cycle of myoblasts. (A) The cell cycle distribution of Socs3 knockdown C2C12 cells was evaluated using a flow cytometry assay. (B) Statistical analysis of the percentage of Socs3 knockdown C2C12 cells in the G1, S, and G2 phases. (C) The cell cycle distribution of Socs3 overexpression C2C12 cells was evaluated using a flow cytometry assay. (D) The statistical analysis of the percentage of Socs3 overexpression C2C12 cells in the G1, S, and G2 phases. **: p < 0.01, ***: p < 0.001.
Ijms 24 10593 g006
Figure 7. Socs3 mediates the glycogen uptake of myotubes. (A) mRNA expression levels of Socs3, Irs1 and Pcg-1α in Socs3 KO C2C12 cells by qPCR. (B,C) The protein expression levels of GLUT4, PI3K, AKT and p-AKT in Socs3 KO C2C12 cells by Western blot and quantification analysis. (D) mRNA expression levels of Socs3, Irs1, and Pcg-1α in Socs3 OE C2C12 cells by qPCR. (E,F) The protein expression levels of GLUT4, PI3K, AKT, and p-AKT in Socs3 OE C2C12 cells by Western blot and quantification analysis. Actb and ACTB were used as the loading controls in qPCR and Western blot respectively. *: p < 0.05, **: p < 0.01, ***: p < 0.001.
Ijms 24 10593 g007
Disclaimer/Publisher’s Note: The statements, opinions and data contained in all publications are solely those of the individual author(s) and contributor(s) and not of MDPI and/or the editor(s). MDPI and/or the editor(s) disclaim responsibility for any injury to people or property resulting from any ideas, methods, instructions or products referred to in the content.