Article

Co-Expression of Multiple PAX Genes in Renal Cell Carcinoma (RCC) and Correlation of High PAX Expression with Favorable Clinical Outcome in RCC Patients

1
Department of Pathology, Dunedin School of Medicine, University of Otago, Dunedin 9016, New Zealand
2
Department of Radiation Oncology, Stanford University School of Medicine, Stanford, CA 94305, USA
3
Maurice Wilkins Centre for Molecular Biodiscovery, Level 2, 3A Symonds Street, Auckland 1010, New Zealand
*
Author to whom correspondence should be addressed.
Int. J. Mol. Sci. 2023, 24(14), 11432; https://doi.org/10.3390/ijms241411432
Submission received: 26 May 2023 / Revised: 10 July 2023 / Accepted: 11 July 2023 / Published: 14 July 2023
(This article belongs to the Special Issue PAX Genes in Health and Diseases)

Abstract

:
Renal cell carcinoma (RCC) is the most common form of kidney cancer, consisting of multiple distinct subtypes. RCC has the highest mortality rate amongst the urogenital cancers, with kidney renal clear cell carcinoma (KIRC), kidney renal papillary cell carcinoma (KIRP), and kidney chromophobe carcinoma (KICH) being the most common subtypes. The Paired-box (PAX) gene family encodes transcription factors, which orchestrate multiple processes in cell lineage determination during embryonic development and organogenesis. Several PAX genes have been shown to be expressed in RCC following its onset and progression. Here, we performed real-time quantitative polymerase chain reaction (RT-qPCR) analysis on a series of human RCC cell lines, revealing significant co-expression of PAX2, PAX6, and PAX8. Knockdown of PAX2 or PAX8 mRNA expression using RNA interference (RNAi) in the A498 RCC cell line resulted in inhibition of cell proliferation, which aligns with our previous research, although no reduction in cell proliferation was observed using a PAX2 small interfering RNA (siRNA). We downloaded publicly available RNA-sequencing data and clinical histories of RCC patients from The Cancer Genome Atlas (TCGA) database. Based on the expression levels of PAX2, PAX6, and PAX8, RCC patients were categorized into two PAX expression subtypes, PAXClusterA and PAXClusterB, exhibiting significant differences in clinical characteristics. We found that the PAXClusterA expression subgroup was associated with favorable clinical outcomes and better overall survival. These findings provide novel insights into the association between PAX gene expression levels and clinical outcomes in RCC patients, potentially contributing to improved treatment strategies for RCC.

1. Introduction

Approximately 430,000 people worldwide were diagnosed with kidney cancer in 2020, and around 179,000 kidney cancer patients died worldwide in the same year [1,2]. Renal cell carcinoma (RCC) is the most common type of kidney malignancy, accounting for approximately 85% of kidney cancer cases. Based on histological characteristics, RCC may be categorized into fifteen different subtypes [3,4]. Among these subtypes, kidney renal clear cell carcinoma (KIRC), kidney renal papillary cell carcinoma (KIRP), and kidney chromophobe carcinoma (KICH) are the most common. KIRC, which is the most common subtype, accounts for 75–80% of RCC. The next most common type is the KIRP subtype, which is characterized by papillary or tubular-papillary structures and accounts for 15–20% of RCCs. The KICH subtype typically contains a mixture of eosinophilic and clear cells, with abundant cytoplasm and well-defined cell boundaries, accounting for approximately 5% of RCCs. Metastasis and recurrence are common in RCC patients, leading to poor clinical outcomes. However, the lack of sensitive biomarkers for RCC tumors contributes to the challenges in effective management [5,6].
The current treatment modalities for RCC mainly include surgery, chemotherapy, immunotherapy, and molecular targeted therapy. However, RCC poses significant challenges in terms of treatment efficacy, as tumor metastasis and recurrence are frequently observed. In a recent commentary by Turajlic et al. [2] focusing on the molecular pathological characteristics, patient outcomes, and potential treatment strategies of kidney cancer, it was proposed that KIRC tumors with low intra-tumoral heterogeneity (ITH) and a low fraction of the genome affected by somatic copy-number alterations (SCNA) often exhibit reduced metastatic potential and more favorable overall prognosis. In contrast, tumors exhibiting increased SCNA, even with the presence of low ITH, tend to have enhanced metastatic potential and poorer prognosis. The authors emphasized the significance of understanding the molecular pathology of RCC in guiding treatment decisions for patients [2].
The PAX family of developmental control genes is frequently dysregulated in RCC [7,8]. This gene family, consisting of PAX1-PAX9, encodes a group of nine transcription factors (PAX1-PAX9), which are expressed in various human cancers and which have been implicated in the onset of malignancies, such as alveolar rhabdomyosarcoma [9]. Approximately 95% of RCC patients exhibit high expression levels of the PAX2 and PAX8 genes, and the expression of PAX genes has been associated with metastasis [10,11]. In previous studies on RCC, we demonstrated that knockdown of PAX2 enhances cisplatin-induced apoptosis in RCC cells, suggesting that targeting of PAX2 could be a potential therapeutic approach [12]. Furthermore, novel inhibitors of PAX2 have been shown to suppress cancer cell proliferation in vitro [13]. Doberstein et al. found that PAX2 binds to the A Disintegrin and metalloproteinase domain-containing protein 10 (ADAM10) promoter and that inhibiting PAX2 expression significantly reduces the expression levels of ADAM10 protein in RCC cells [14]. This leads to a more diffuse cellular phenotype, accompanied by the upregulation of Snail family transcriptional repressor 2 (Slug) expression and the loss of E-cadherin, thereby promoting the migration of RCC cells [15]. Treatment with Transforming growth factor Beta 1 (TGF-β1) promotes epithelial-mesenchyme transition (EMT) of RCC cells in vitro, inducing stem cell-like characteristics in the cells [15]. In our previous work, we demonstrated that TGF-β1 treatment inhibits PAX2 promoter activity, thereby suppressing PAX2 expression in RCC cells [16].
In KIRC, the activation of a transcriptional program mediated by hypoxia-inducible factor alpha (HIFA) occurs due to VHL mutations, leading to the loss of von Hippel–Lindau (VHL) protein function. This, combined with the hypoxic conditions in the local tumor tissue microenvironment, has been shown to induce re-expression of PAX2 [17]. The loss of VHL is observed in approximately 90% of KIRCs and leads to stabilization of HIF2A. Recent studies by Patel et al. have shown that HIF2A is preferentially recruited to transcriptional enhancers in chromatin where PAX8 is bound. This includes a pro-tumorigenic enhancer for cyclin D1 (CCND1), which is regulated by both PAX8 and HIF2A [18]. The interaction between PAX8 and HIF2A promotes the activation of several other oncogenes in KIRC. Therefore, targeting PAX8 may offer a promising therapeutic approach for the treatment of RCC [19,20].
The above studies suggest that PAX genes play an important role in RCC. Consequently, we aimed to examine the relationship between PAX gene expression and clinical outcomes in RCC patients. Specifically, we investigated whether altered expression levels of PAX could be associated with poor clinical features such as invasion and metastasis in patients with advanced RCC.
In this study, we conducted a comprehensive analysis of publicly available renal cell carcinoma (RCC) data from The Cancer Genome Atlas (TCGA) to explore the significance of the PAX gene family in RCC (Figure 1). Additionally, we performed RT-qPCR analysis to assess the expression levels of PAX genes in various RCC cell lines. Using siRNAs, we selectively knocked down PAX2 or PAX8 genes in RCC cells and evaluated the effects on cell proliferation. Our results demonstrated that PAX8 knockdown, but not PAX2 knockdown, suppressed RCC cell proliferation. Furthermore, we classified RCC tumors into two distinct expression subgroups, namely PAXClusterA and PAXClusterB, based on the collective expression levels of PAX genes (PAX2, PAX6, and PAX8). We examined the correlation between these subgroups and the clinical characteristics of RCC patients. Our findings provide valuable insights into the potential implications of PAX gene expression in the treatment outcomes of RCC patients. Moreover, this study serves as a foundation for future investigations exploring the potential of PAX gene expression as a prognostic indicator or biomarker for treatment response in RCC.

2. Results

2.1. Clinical Characteristics of RCC Patients in the TCGA Cohort

In total, RNA-sequencing data and detailed clinical prognostic information from 883 patients represented in the TCGA database were incorporated in the present study. The patients included 288 females and 595 males with an age range of 17–90 years and a median age of 58 years. Among the 883 patients, 52.55% of the patients had stage I; 12.11% had stage II; 21.29% had stage III; and 11.66% had stage IV RCC. A summary of the clinical information including age at diagnosis, gender, ethnicity, and pathologic stage (T, N or M) is presented in Table 1.

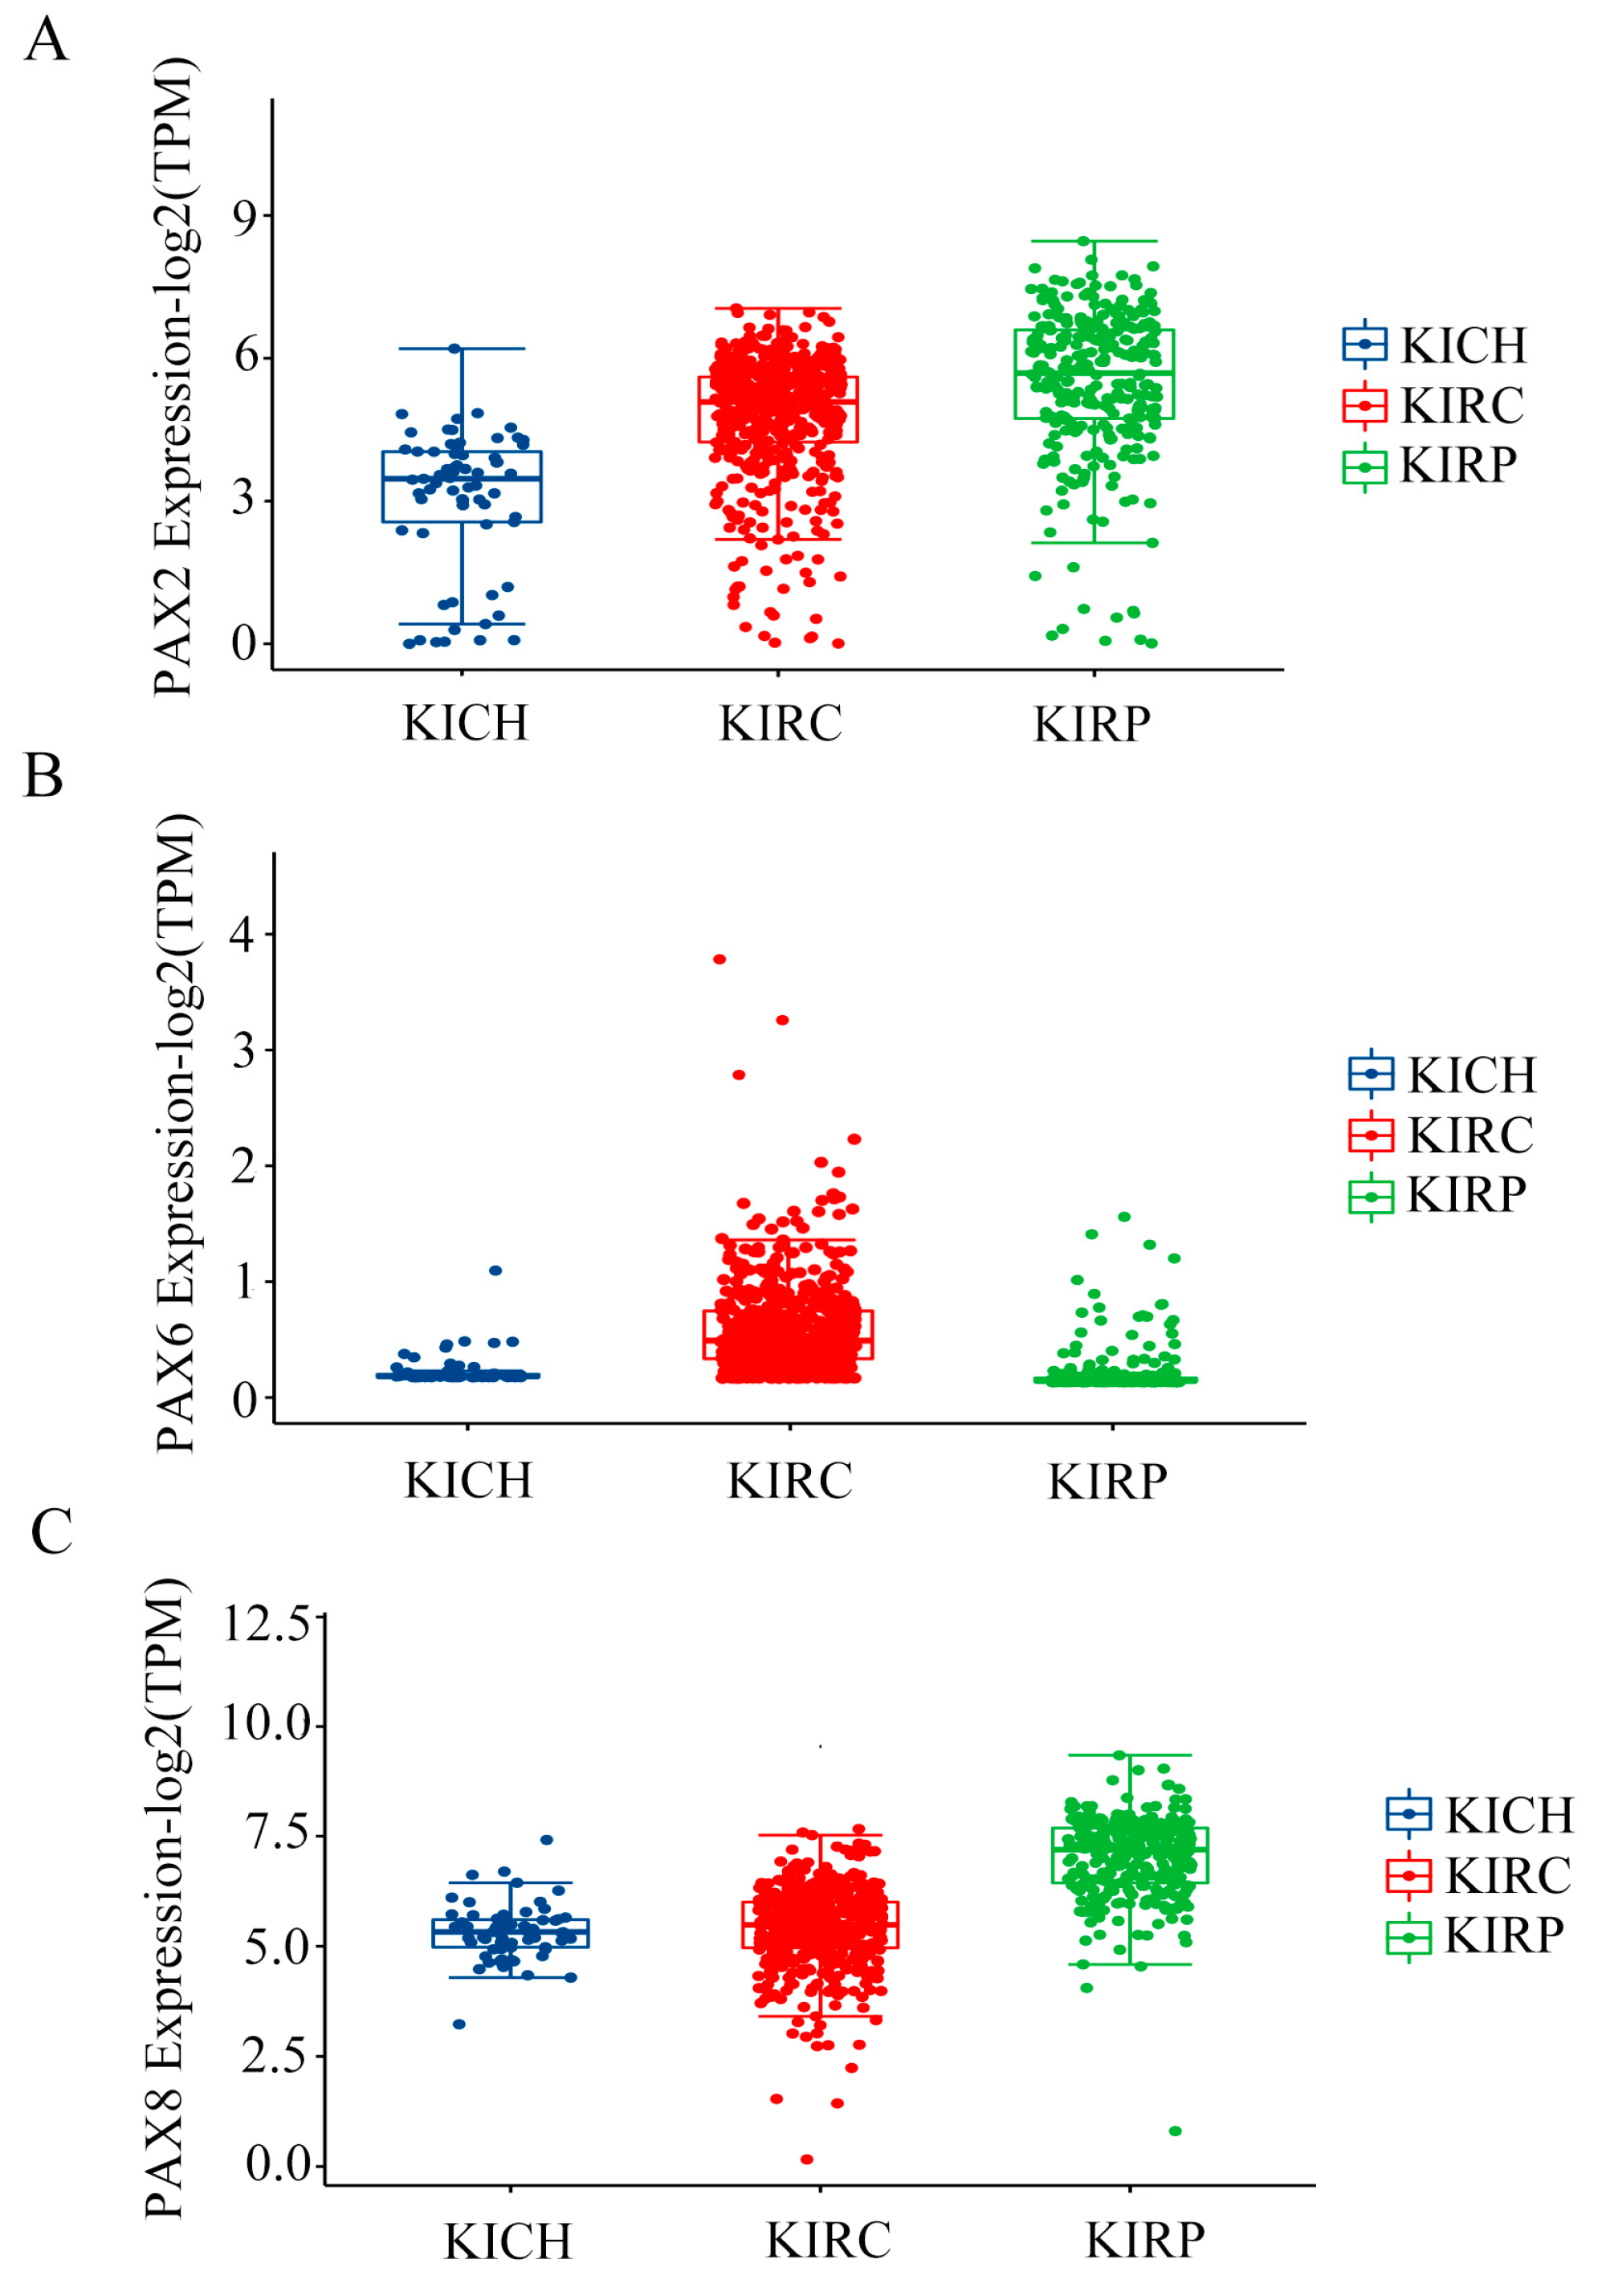
2.2. Multiple PAX Genes Are Expressed in Clear Cell (KIRC), Papillary (KIRP), and Chromophobe (KICH) Renal Cell Carcinoma

In line with the workflow outlined in Figure 1, our initial analysis focused on examining the mRNA expression levels of PAX genes in three common subtypes of RCC (Figure 2; Supplementary Figure S1), KICH, KIRC, and KIRP, using the publicly available TCGA dataset. Patients with incomplete clinical information were excluded from the study.
The mRNA expression levels of PAX2, PAX6, and PAX8 were significantly elevated in the three common subtypes of RCC, as compared to the other members of the PAX family (Figure 2). This difference in expression was observed in contrast to the levels of PAX1, PAX3, PAX4, PAX5, PAX7, and PAX9 (Supplementary Figure S1).

2.3. Analysis of PAX Gene Expression Levels in Human RCC Cell Lines

To validate the expression patterns of PAX genes observed in the TCGA RCC dataset (Figure 2), we conducted RT-qPCR analysis on RCC cell lines (Figure 3). Relative expression levels of the reference genes are shown in Supplementary Figure S2. The relative expression levels of PAX2, PAX3, PAX5, PAX6, PAX8, and PAX9 were assessed in RCC cell lines, compared to a calibrator cell line, which exhibited the highest expression level (as designated by an asterisk in Figure 3). In agreement with the TCGA data analysis, PAX2 showed relatively high expression levels in most RCC cell lines, with PAX2 and PAX8 exhibiting higher expression than PAX6. PAX9 was also expressed at relatively low levels in seven out of nine RCC cell lines, while the expression of PAX1, PAX4, and PAX7 was either very low or undetectable in RCC cell lines.

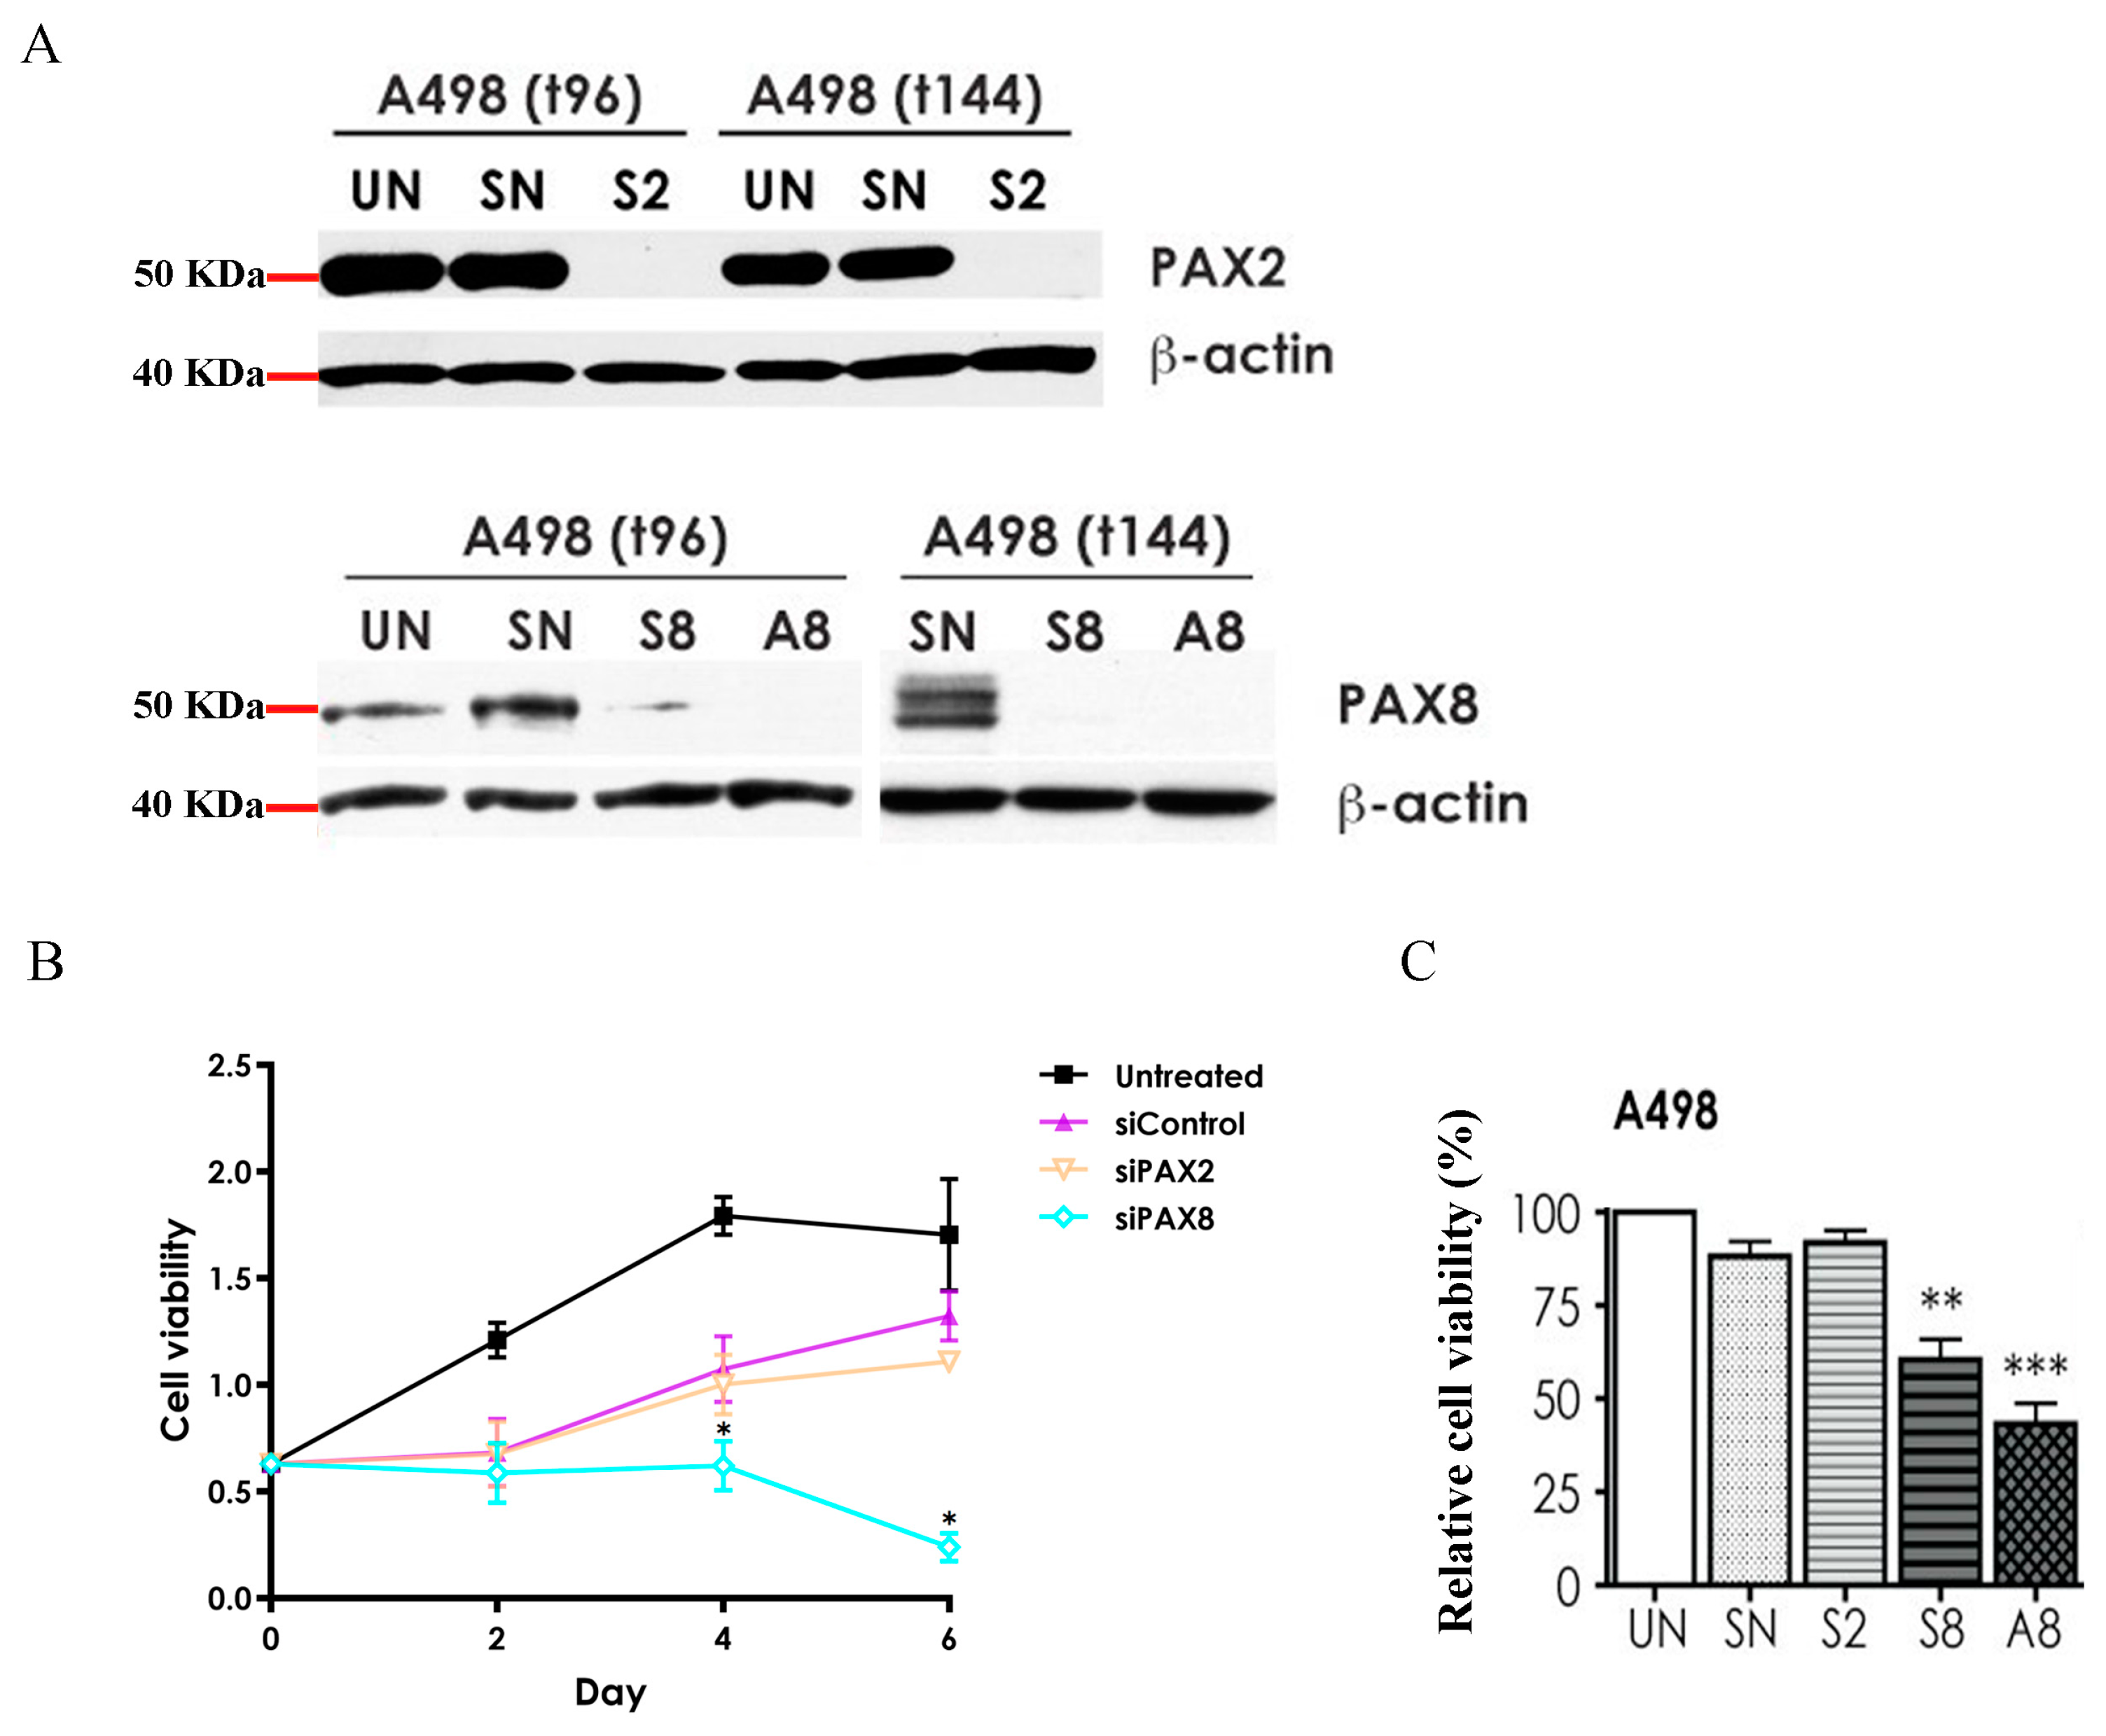
2.4. Effects of PAX2 or PAX8 Knockdown on A498 Cell Proliferation

Previous studies have shown that downregulation of PAX gene expression in cancer cells leads to reduced cell proliferation and induction of apoptosis [21,22,23]. In our earlier investigations [20], we provided evidence indicating that depletion of PAX8 in RCC cell lines led to growth inhibition and initiation of senescence. In the present study, we utilized siRNAs to specifically target and suppress the expression levels of either PAX2 or PAX8 in A498 cells. Subsequently, we examined the impact of PAX2 or PAX8 depletion on A498 cell proliferation by employing the MTT colorimetric cell metabolic activity assay.
Cell proliferation in A498 RCC cells was monitored for six days following knockdown of PAX2 or PAX8. Since PAX6 was expressed at very low levels in the A498 cell line, PAX6 knockdown was not performed. Successful knockdowns of PAX2 and PAX8 proteins were confirmed by Western blot analysis (Figure 4A) and RT-qPCR (Supplementary Figure S3) at multiple timepoints. The RT-qPCR results demonstrated a significant decrease in mRNA expression levels of PAX2 or PAX8 in the A498 cell line after 72 h of knockdown, with expression levels being reduced to approximately 20% of the untreated (UN) group (Supplementary Figure S3). The Western blot results further demonstrated significant inhibition of protein expression levels for both PAX2 and PAX8 at 96 h and 144 h after knockdown (Figure 4A).
In line with our previous data [20], the PAX8 siRNA-treated samples exhibited a significant decrease in proliferation at 96 h (4 days) post-treatment compared to untreated (UN) or control siRNA-treated (SN, siControl) samples (Figure 4B). Moreover, two different siRNAs targeting PAX8 (labeled S8 and A8) resulted in a significant reduction in cell number (proliferation) at 96 h (Figure 4C), which corresponded to the loss of PAX8 protein expression at these time points in the A498 cell line (Figure 4A). In contrast, despite siRNA knockdown of PAX2 protein expression at 96 h and 144 h (S2), the knockdown of PAX2 did not significantly impact the proliferation of the A498 cell line compared to the negative control samples (Figure 4B).

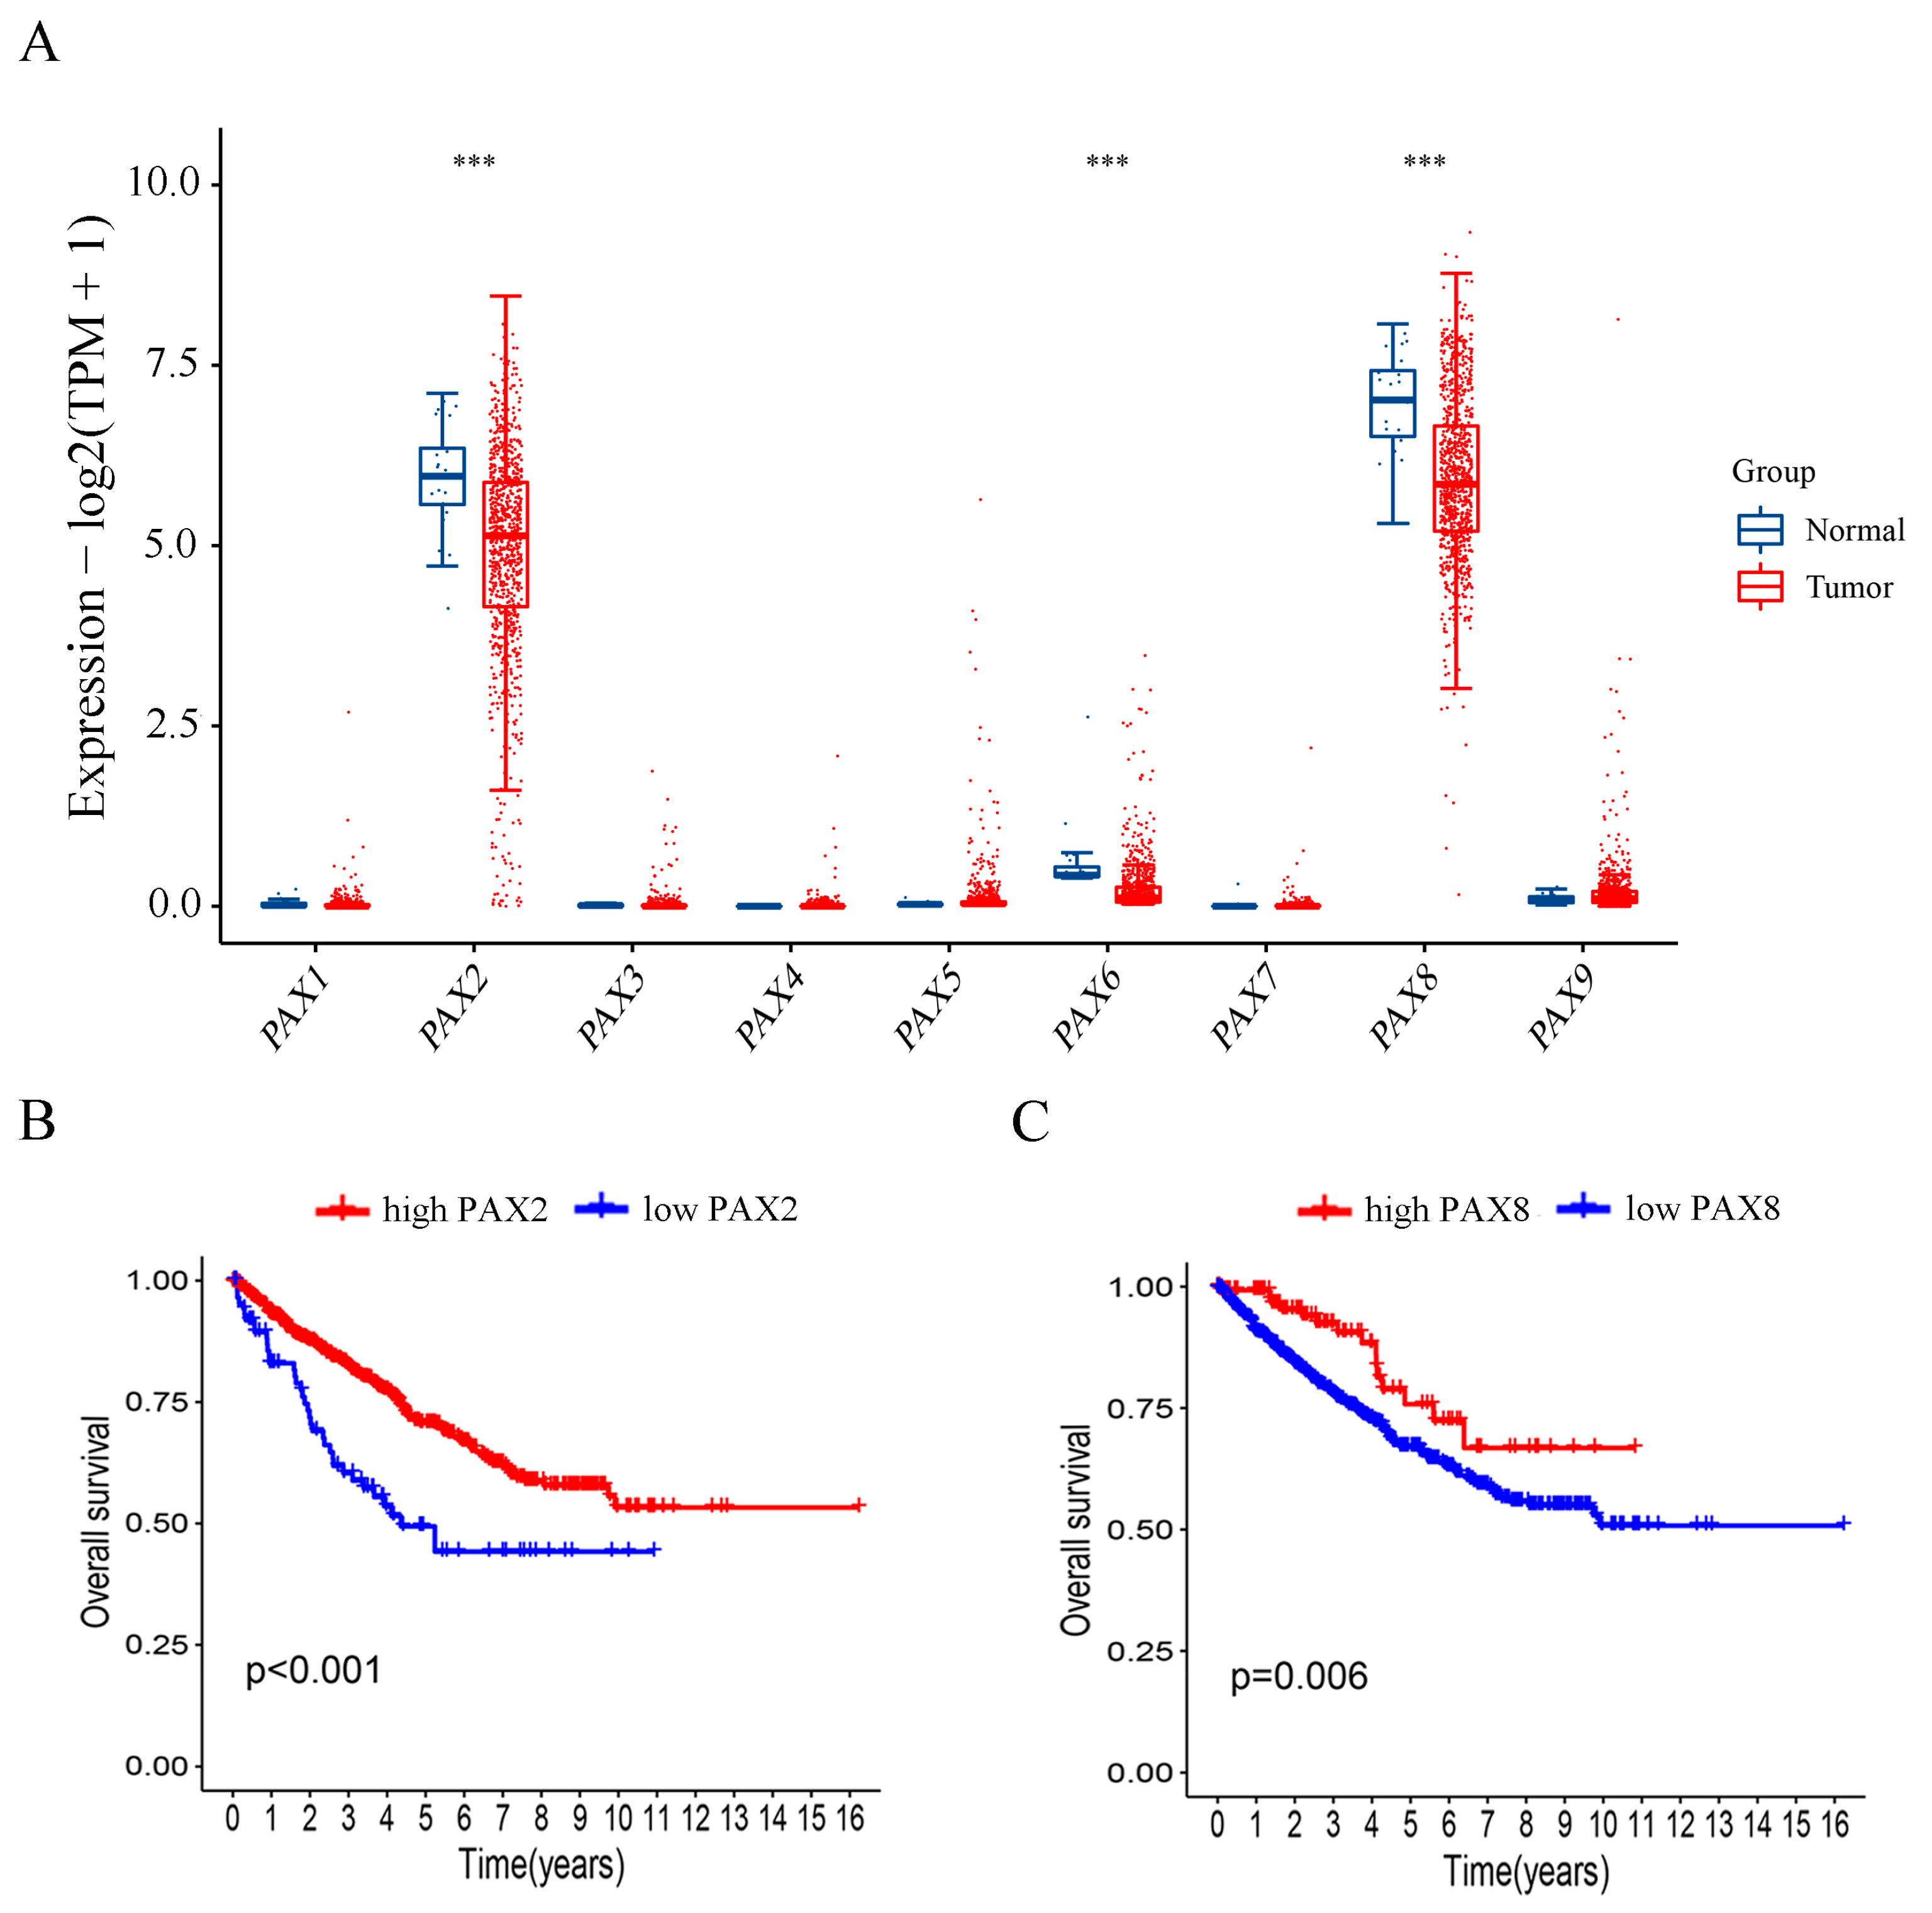
2.5. Investigation of PAX Gene Expression Levels in Relation to Publicly Available Clinical Data from RCC Patients

To investigate the potential effects of PAX gene expression on clinical features in RCC patients, we combined the TCGA data for the three RCC subtypes (KIRC, KIRP, and KICH) into one analysis cohort. We compared the mRNA expression levels of PAX1-9 in RCC samples and adjacent normal tissues (Figure 5A). Interestingly, PAX2, PAX6, and PAX8 showed significantly higher mRNA expression levels in RCC samples compared to other members of the PAX gene family. However, these genes were significantly downregulated (p < 0.001) in the tumor samples compared to the adjacent normal kidney tissue (Figure 5A). Of note, the expression level of PAX6 was relatively lower than PAX2 and PAX8 but still significantly above background.

2.6. Patients with Higher PAX2 and PAX8 mRNA Expression Exhibited Better Overall Survival in RCC

An analysis of PAX2 and PAX8 expression levels in relation to the survival of RCC patients revealed high expression levels of both PAX2 (p < 0.001; Figure 5B) and PAX8 (p = 0.006; Figure 5C) in RCC which were associated with better overall patient survival. Specifically, we observed a positive correlation between PAX2 expression and overall survival (OS) in patients from the KIRP (HR = 0.78), KIRC (HR = 0.63), and KICH (HR = 0.3) cohorts (Supplementary Figures S4–S6). Similarly, the expression of PAX8 showed a positive correlation with OS in patients from the KIRP (HR = 0.59), KIRC (HR = 1.1), and KICH (HR = 0.11) subtypes. In contrast, PAX6 expression did not show a significant association with overall patient survival. These results indicate that high expression of PAX2 in KIRC patients and high expression of PAX8 in KICH patients are associated with better prognosis (Supplementary Figures S5 and S6).

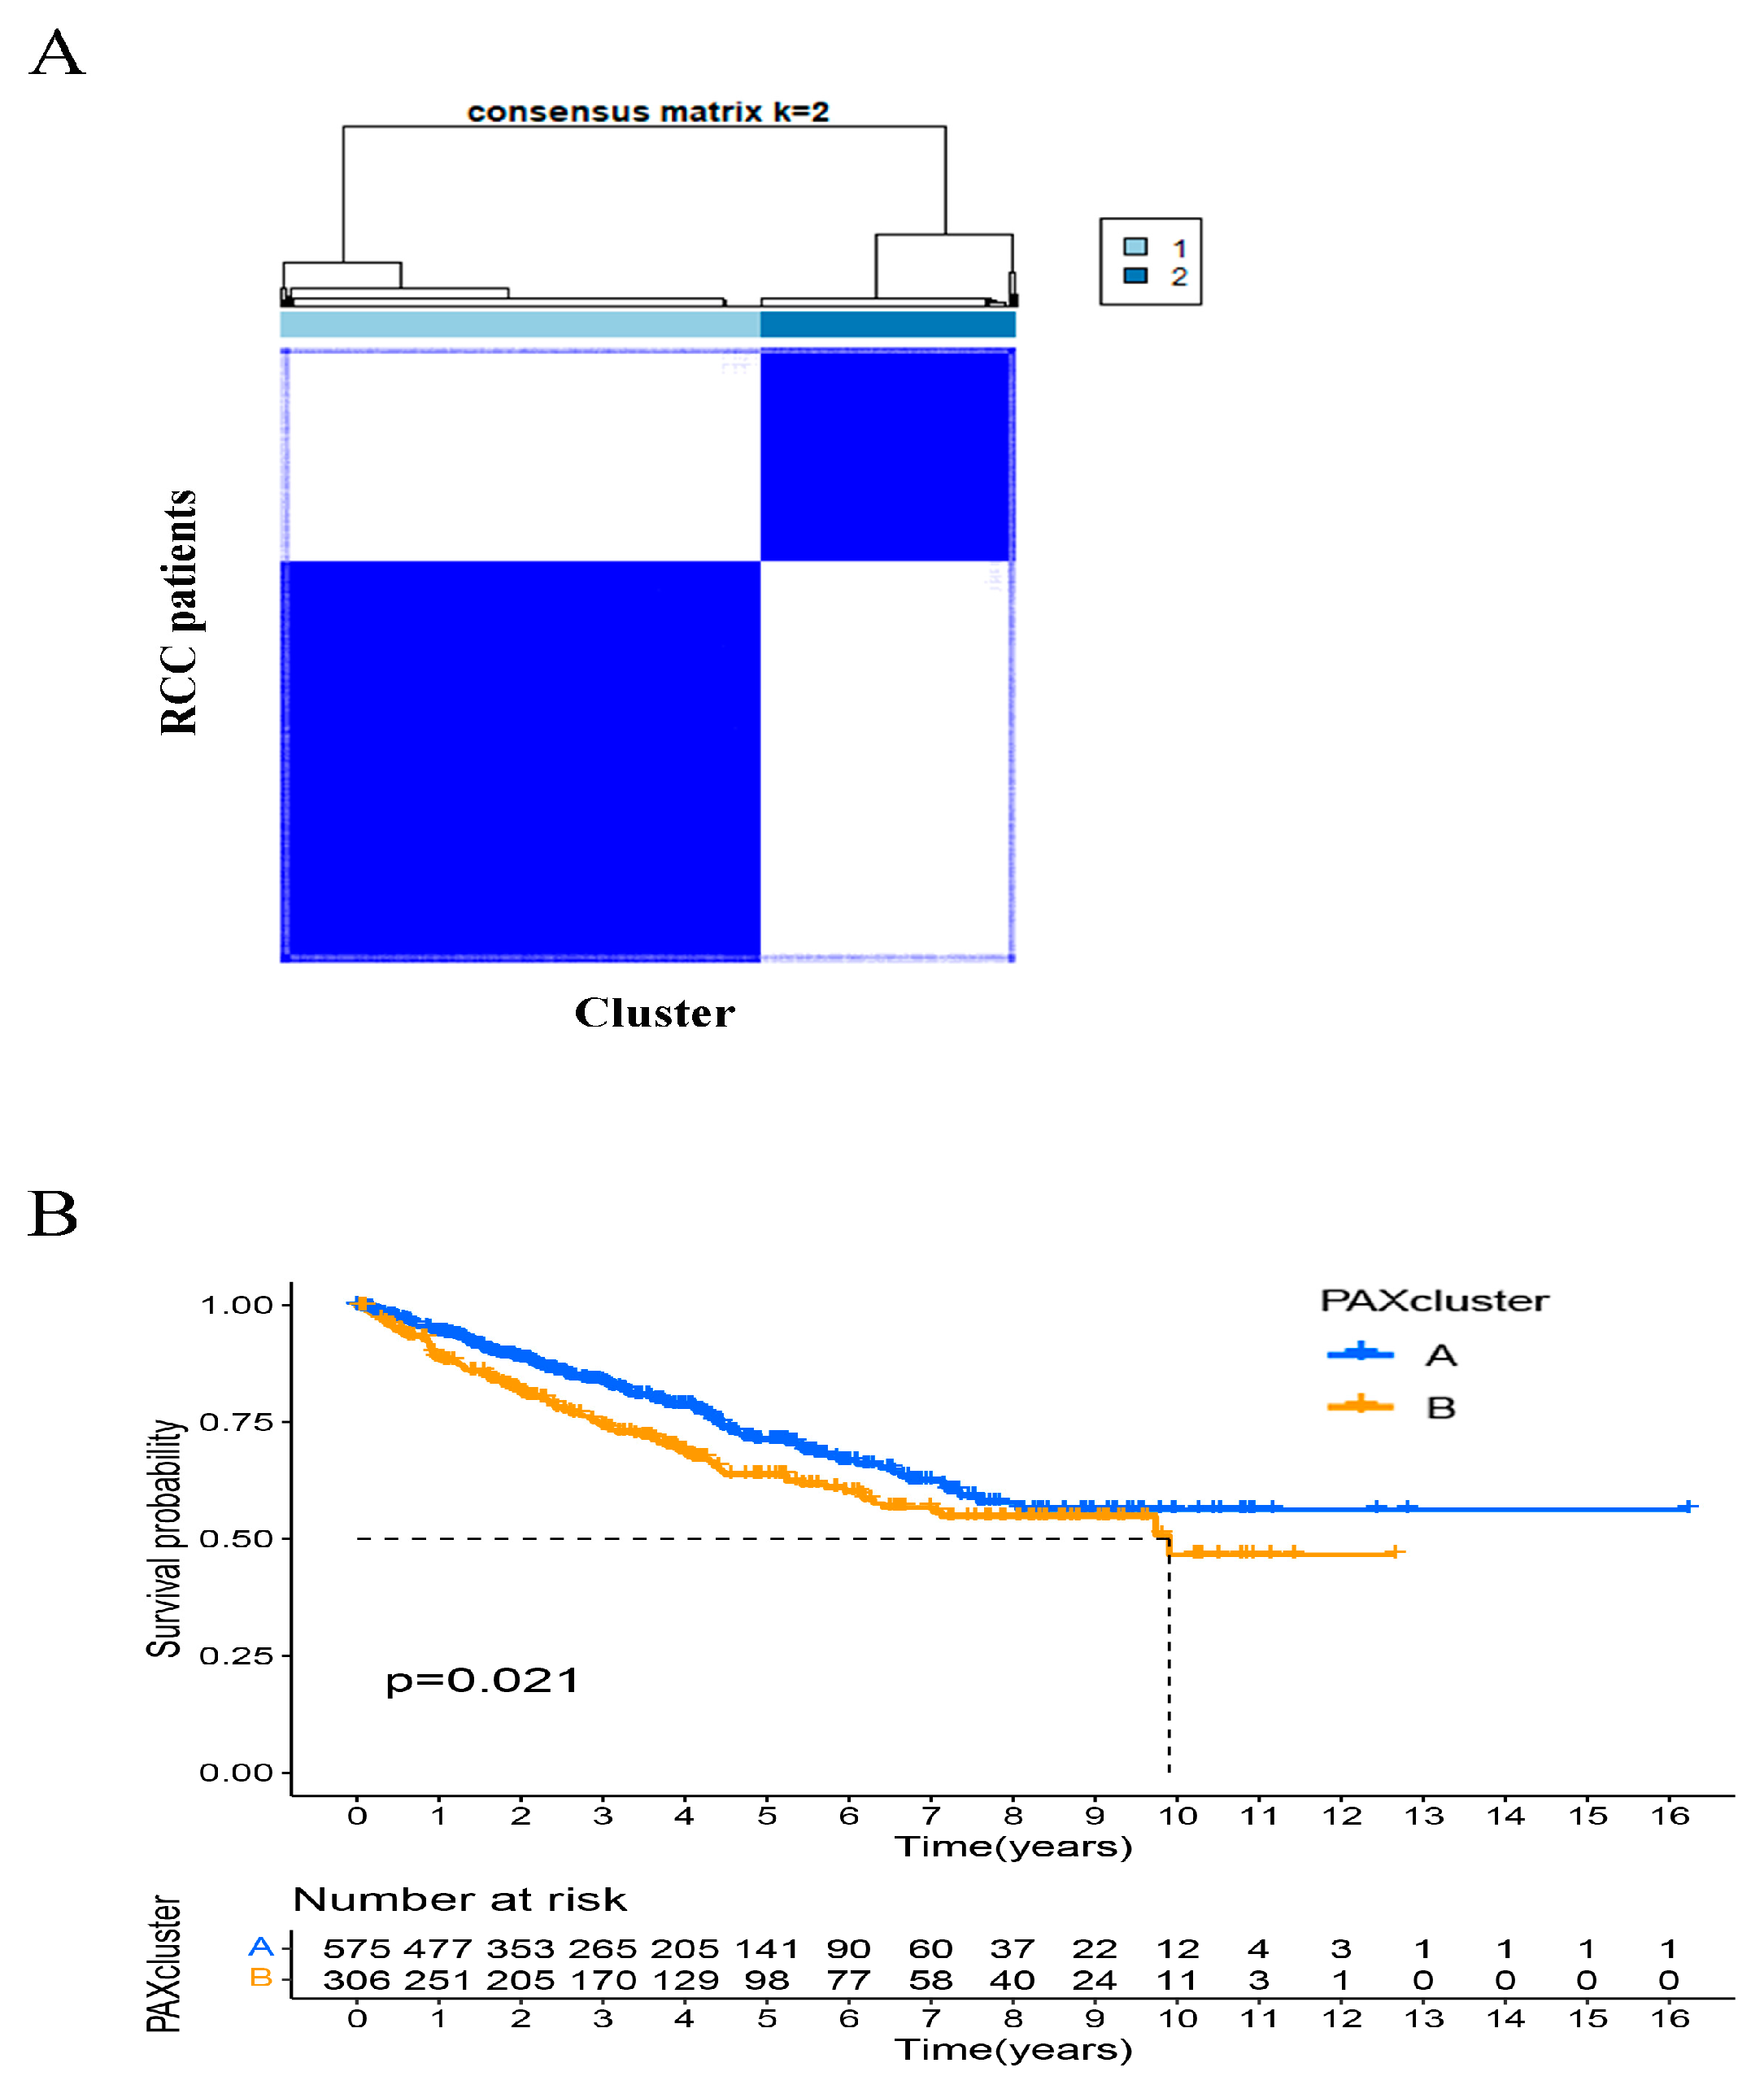
2.7. Identification of PAXcluster A and PAXcluster B Subgroups in RCC Tumors

In both the RCC cell line investigations and the analysis of TCGA public data, it was observed that PAX2, PAX6, and PAX8 were the most highly expressed PAX genes in RCC. High expression of these genes was generally associated with better OS in the KIRC, KIRP, and KICH RCC subtype cohorts (Supplementary Figures S4–S6). Using the unsupervised consensus clustering method “ConsensusClusterPlus” on the combined cohort of RCC patients (KIRC, KIRP, and KICH), we performed cluster analysis based on the expression profiles of PAX2, PAX6, and PAX8 genes (Figure 6A). The analysis revealed that the PAX gene expression patterns of each cluster were highly significant by consensus matrix analysis and by principal component analysis (Supplementary Figure S7), and from this analysis two different subtypes, which we called PAXcluster A and PAXcluster B, were identified. The results of a prognostic analysis showed that the PAXcluster A subtype, which has relatively high PAX expression, had a better survival advantage than the PAXcluster B subtype, which exhibited relatively lower PAX expression (Figure 6B). To explore biological processes between these two clusters, we performed a gene set variation enrichment analysis (GSVA) (Supplementary Figure S8), which showed that the PAXcluster A was markedly enriched in pathways related to metabolism and repair, such as mammalian circadian rhythm, snare interactions in vesicular transport, histidine metabolism, base excision repair, and glycosylphosphatidylinositol (GPI) anchor biosynthesis. The PAXcluster B was mainly enriched in tumor-related pathways, such as alpha-linolenic acid metabolism, calcium signaling pathways, neuroactive ligand-receptor interactions, cardiac muscle contraction, extracellular matrix (ECM) receptor interactions, and aldosterone-regulated sodium reabsorption.

2.8. Clinical Features Are Associated with PAXcluster A and PAXcluster B Expression Subtypes in RCC Patients

The PAXcluster A subtype was observed significantly more frequently in female patients (p = 0.012). Furthermore, the PAXclusterA subtype was observed significantly more frequently in early-stage tumors: stage I and stage II (p < 0.001), grade 1 and grade 2 (p = 0.023), and T stage 1 (T1) and T stage 2 (T2) (p < 0.001). Our findings suggest that patients with RCCs of the PAXclusterA subtype may tend to have a better prognosis, and patients with RCCs of the PAXclusterB subtype may tend to have tumors that exhibit more advanced stage and grade. In contrast, there were significantly fewer N stage 0 (N0, p = 0.005) and M stage 0 (M0, p = 0.001) tumors exhibiting the PAXclusterA subtype (Figure 7). The results showed there was no relationship between PAXcluster and age (p = 0.696). A heatmap presenting the overall pattern of clinical characteristics is shown in Supplementary Figure S9.

3. Discussion

The PAX gene family consists of highly conserved transcription factors that play crucial roles in embryonic development and organogenesis [24,25,26,27,28]. These genes are regulated in a temporal and spatial manner, and expression patterns of PAX2 and PAX8 are typically downregulated in the kidneys during fetal development as they undergo terminal differentiation [10]. Healthy postnatal tissues can also express PAX genes in a restricted fashion. For example, PAX2 and PAX8 have been shown to be re-expressed in postnatal kidneys in response to acute kidney injury, nephrotoxicity, and regenerative changes [25,28]. However, in various types of cancer, including RCC, PAX genes can be re-expressed in an aberrant manner, contributing to abnormal cell proliferation and cancer cell survival [7].
Here we examined the expression levels of PAX gene family members in RCC cell lines and in TCGA data derived from three RCC subtypes (KIRC, KIRP, and KICH). Analysis of the online data revealed that PAX2 and PAX8 were expressed at relatively high levels in RCC tumor tissues compared to other PAX genes, while PAX6 was expressed at lower but still significant levels. We also found that PAX2, PAX6, and PAX8 were expressed in most RCC cell lines, indicating their potential involvement in controlling cell proliferation, survival, and chemoresistance in RCCs [13].
To investigate the functional significance of PAX2 and PAX8 in RCC, knockdown experiments were performed in A498 cells. Interestingly, inhibition of PAX8 expression significantly suppressed cell proliferation, while inhibition of PAX2 had little to no effect. This finding is supported by previous studies demonstrating that PAX8 can activate genes involved in cell cycle regulation and metabolism, acting as a transcriptional coactivator in RCC cells [19]. Silencing PAX8 has been shown to decrease RCC cell proliferation, suggesting it is potentially an oncogene in RCC. On the other hand, PAX2 expression was found to be significantly reduced in high-grade RCC, particularly in the KIRC subtype, compared to low-grade RCC.
In the TCGA data analysis, we observed a correlation between the expression levels of PAX2 and PAX8 and the clinical outcomes of RCC patients. Higher expression of PAX2 and PAX8 was associated with better survival of RCC patients compared to those with lower expression levels. Specifically, higher PAX2 expression was associated with improved overall survival in KIRC and KICH patients (although the latter was not statistically significant). Also, relatively higher PAX8 expression was observed (although not statistically significant) in KICH patients with improved overall survival. These findings suggest that higher expression of PAX2 and possibly of PAX8 are associated with better clinical outcomes in RCC. The role of PAX6 expression in RCC remains unclear, although its expression in normal brain tissue is associated with cell differentiation and migration [8,27].
By using the “ConsensusClusterPlus” R package, we stratified RCC patients into two subtypes based on the expression levels of PAX2, PAX6, and PAX8. Some clinical characteristics associated with RCC patients in the in silico analysis showed correlation with the PAXClusterA versus PAXClusterB subgroups. For instance, we found that PAXClusterA, which was associated with relatively higher PAX gene expression, correlated with better survival and prognosis of RCC patients, compared to PAXClusterB. PAXClusterA also tended to be associated with lower stages of RCC. Gene enrichment pathway analysis showed that the PAXClusterA subgroup was significantly associated with metabolism and repair-related pathways. Another important finding is that female RCC patients exhibit a higher proportion of PAXClusterA subtypes. This suggests that female patients could exhibit more favorable survival outcomes in association with PAXClusterA. Lee et al. showed that female RCC patients had a significantly higher survival rate than male patients [29]. Significant molecular differences may exist between male and female RCC patients, and therefore gender-specific RCC studies and personalized gender-specific therapies may be warranted.
Using co-transfection experiments, Schwarz et al. showed reciprocal inhibition of promoter/enhancer activity by the respective PAX2 and PAX6 proteins acting on each other’s gene promoters [30]. Therefore, very likely inter-regulatory relationships exist between different PAX genes that are expressed in the same RCC cells. PAX2 and PAX8 may play synergistic roles in gene regulation [31]. For instance, PAX2 and PAX8 are essential for initiating pro- and mesonephros development, and together they play a role in the expression of GATA binding protein 3 (GATA3) and initiating Hepatocyte nuclear factor 1 alpha, or beta (HNF1ba/b) expression [32,33]. Therefore, specific interactions between PAX genes likely occur in RCC, although further investigations will be needed to refine PAX gene interaction networks.
The re-expression of PAX2 has been suggested to be required for renal tubular regeneration, proliferation, and repair [34]. Bleu et al. found that PAX8 can activate metabolic genes through enhancer elements in renal cell carcinoma [19]. PAX8 has also been shown to transcriptionally activate (E2F transcription factor 1) E2F1 expression, and hence the cell cycle, in RCC cells [20]. Moreover, PAX2 and PAX8 are potential oncogenes in RCC [35,36]. However, the full extent of mechanisms involved in their oncogenic effects remains unclear. Some studies have found that PAX2 has both oncogenic and inhibitory effects on invasion during tumor development. In ovarian cancer, reduction of PAX2 expression appears to be an early event of cancer clonal expansion, during which PAX2 has inhibitory effects on tumor invasion and metastasis, potentially through interactions involving multiple pathways, including between Phosphatase and tensin homolog (PTEN), PAX2, and Tumor protein p53 (TP53) [37,38]. Transcription of PAX2 was also shown to be dependent on TP53 mutation status. PAX2 was found to be directly transcriptionally activated by wildtype p53, but conversely PAX2 transcription was inhibited by mutant p53 in murine oviduct epithelial cells [38]. In an in vitro invasion model using prostate cancer cells 22Rv1 and DU145, PAX2 overexpression promoted prostate cancer cell invasion, which was associated with upregulated N-cadherin expression [39].
The expression of PAX2 and PAX8 in RCC may be associated with the maintenance of an epithelial phenotype during the epithelial-mesenchyme transition (EMT). In normal kidney development, PAX2 and PAX8 are necessary for the epithelial differentiation of renal precursor cells, and PAX2 promotes the trans-differentiation of mesenchymal cells into epithelial cells [28]. Thus, the downregulation of PAX gene expression in later stages of RCC may facilitate mesenchymal transition, which is linked to tumor cell invasion and metastasis. TGF-β signaling, elevated in advanced (stage III and IV) RCC tumors, has been shown to repress PAX2 mRNA transcription through Mothers against decapentaplegic homolog 2, or 3 (SMAD2/3)-mediated mechanisms, potentially contributing to the reduced PAX2 expression observed in advanced stages of RCC [16,40].

4. Materials and Methods

4.1. TCGA Database Patient Selection

A total of 883 RCC patients from the TCGA database were identified with KIRC, KIRP, or KICH. Of these, two patients did not have associated survival data; therefore, 881 RCC patients were included in the analyses of clinical features and outcomes, including patient overall survival.

4.2. Analysis Using Gene Expression Profiling Interactive Analyses {GEPIA) Online Tools

The GEPIA website (available at http://gepia.cancer-pku.cn/, accessed on 20 December 2022) is an online resource to analyze clinical data from TCGA database and tissue-specific expression patterns [41,42]. The relationship between the expression level of PAX genes and patient survival in different RCC subtypes was analyzed by GEPIA. Overall survival (OS) analysis was performed based on gene expression levels. The median gene expression level was the Group Cutoff between the high- and low-expression groups. A hypothesis test was performed using the Mantel–Cox test.

4.3. Unsupervised Clustering Based on PAX Genes

To further analyze the biological characteristics of the PAX genes in RCC patients, we performed unsupervised cluster analysis on the combined RCC patients to classify the RCC patients based on the expression level of the PAX genes for further analysis. We used the R software package “ConsensusClusterPlus” [43,44,45,46] to detect high consensus, optimal molecular subgroups based on PAX2, PAX6, and PAX8 gene expression features. The clustering was performed by a K-means algorithm with Euclidean distance. The maximum cluster number was set to 9. The final cluster number was determined by the consensus matrix and the cluster consensus score (score > 0.8), and 50 iterations were used to assess the clustering stability.

4.4. Gene Set Variation Analysis (GSVA) and Functional Annotation

We identified the potential functional pathways of the PAX clusters using the “GSVA” R package [47]. The R package “clusterProfiler” was used to process biological-term classification and the enrichment analysis of gene clusters [48]. The gene set of “c2.cp.kegg.v7.2.symbols.gmt” obtained from the Molecular Signatures Database (MSigDB; https://www.gsea-msigdb.org, accessed on 10 January 2023) was used to run GSVA [49].

4.5. Cell Culture

All mammalian cell lines used in this study were grown in a humidified 37 °C incubator with 5% CO2. Cell line information, including its source and culture medium, is listed in Supplementary Table S1. To maintain a cell line in log-growth phase, the culture medium was refreshed every three days. Cells were sub-cultured when the confluence reached 90%.

4.6. Semi-Quantitative Reverse Transcription Real-Time PCR (RT-qPCR)

Experiments were performed as previously described [16]. For screening PAX gene expression in mammalian cell lines, 500 ng of total RNA from each cell line was used for generating cDNA in a 20 μL reaction. SuperScript III Reverse Transcriptase Kit (Invitrogen, Waltham, MA, USA) was used for synthesizing first-strand cDNA (primed with 0.5 mM dNTP mix and 250 ng random hexamers, Invitrogen, USA). Specific primers were used with the Platinum SYBR Green qRT-PCR SuperMix-UDG with ROX Kit (Invitrogen, USA) to amplify and detect target genes with three technical replicates for each cell line. To assess transcriptional expression, the fold change in the expression of PAX genes compared to three reference genes was employed (PAX gene expression levels were determined using the −∆∆Ct method). Gene expression data, with three technical replicates per knockdown, were normalized to the reference genes (Supplementary Table S2), as previously described [20]. The primer sequences used for RT-qPCR analysis are presented in Table 2.

4.7. siRNA Transfection

Gene silencing was achieved using gene-specific small interfering RNAs (siRNAs). The siRNAs used are listed in Supplementary Table S3 and were transfected using “reverse transfection”. The transfection mix, which contained 10 nM (final concentration) siRNA, Lipofectamine RNAiMAX (Invitrogen, USA), and OPTI-MEM (Invitrogen, USA), was prepared according to the RNAiMAX instruction manual. Cells were harvested by trypsinization and counted using a hemocytometer. The siRNA transfection mix was added to a multi-well plate, followed by the drop-wise addition of the cell suspension, as described previously [20].

4.8. Western Blotting

Protein isolation and Western blots were performed as previously described [20]. Briefly, cells were trypsinized, washed in PBS, and lysed on ice for 30 min. Proteins were transferred from the SDS gel onto a nitrocellulose membrane (Hybond-C Extra) using a Mini Trans-Blot cell system (Bio-Rad Laboratories, Hercules, CA, USA). After transfer, the membrane was rinsed briefly in PBS with 0.1% Tween-20 (PBST) and transferred to blocking buffer for 1 h at room temperature. After blocking, the membrane was incubated in primary antibody diluted in blocking buffer (with the addition of 0.1% sodium azide) overnight at 4 °C. Next, the membrane was washed in PBST. The membrane was then transferred to the appropriate horseradish peroxidase (HRP)-conjugated secondary antibody (Sigma-Aldrich, Burlington, MA, USA) diluted in blocking buffer and incubated for 2 h at room temperature. Finally, protein detection was performed by incubating the membrane in freshly prepared SuperSignal West Pico Chemiluminescent Substrate. Antibody information and their optimized dilutions are listed in Supplementary Table S4.

4.9. Measurement of Cell Proliferation: The MTT Assay

For the MTT assay, cell transfections/manipulations were performed in duplicate in a 96-well plate format. Two controls were included: cells without siRNA transfection and cells transfected with the negative control siRNA. MTT assays were carried out using the Cell Proliferation Kit (Roche Applied Science, Penzberg, Bavaria, Germany) at selected time-points, following the manufacturer’s instructions. Absorbance of the final solution was measured at 570 nm using an Anthos ELISA plate reader, and values were expressed relative to the control samples.

4.10. Statistical Analysis

For RT-qPCR analysis, the qBase software (http://medgen.ugent.be/qbase/) (version qbase-windows-x64-v3.4) was used. For statistical analysis between two samples, the unpaired two-tailed t-test was used. For the comparison of categorical variables, we used the Chi-squared test. Bioinformatic analyses were performed using R software (version 4.1.2). We used the files that contain “fragments per kilobase per million” (FPKM) values. FPKM values were transformed into transcripts per kilobase million (TPM) values. Batch effects were removed from TPM expression data using the ComBat function from the “sva” R package [50]. The visualization of heatmaps and histograms was based on the “ggplot2” package [51]. Survival analysis was conducted based on R packages “survival” and “survminer” [52]. If not specified above, p-value < 0.05 was considered statistically significant for the results.

5. Conclusions

In conclusion, this study investigated the prognostic relevance of PAX gene expression levels and clinical outcomes in RCC. Higher expression of levels of PAX2 and PAX8 were associated with better overall survival in RCC patients. Stratification of patients based on PAX expression subtypes revealed that the subtype with relatively higher PAX expression (PAXCluster A) was associated with more favorable clinical features and improved survival outcomes. These findings contribute to our understanding of the role of PAX gene expression in RCC, and they may help guide future studies to improve treatment outcomes for RCC patients.

Supplementary Materials

The supporting information can be downloaded at: https://www.mdpi.com/article/10.3390/ijms241411432/s1.

Author Contributions

Conceptualization, L.L. and M.R.E.; methodology, C.G.L. and L.L.; formal analysis, C.G.L. and L.L.; investigation, C.G.L. and L.L.; writing—original draft preparation, L.L.; writing—review and editing, C.G.L., S.N.A., S.M.H. and M.R.E.; funding acquisition, M.R.E. All authors have read and agreed to the published version of the manuscript.

Funding

This research was funded by The Health Research Council of New Zealand, grant numbers HRC 07-284 and HRC 18-144. SMH is supported by a University of Otago Doctoral Scholarship. LL is supported by the Chinese Scholarship Council–New Zealand-China Research Collaboration Centres (CSC-NZ CRCC) joint funding programme and the New Zealand-China Non-Communicable Diseases Research Collaboration Centre (NCD CRCC).

Institutional Review Board Statement

Ethical review and approval were waived for this study due to the human cell lines being commercially available and the publicly available data not requiring ethical review and approval for their use.

Informed Consent Statement

Patient consent was waived due to the human cell lines being commercially available and the publicly available data not requiring ethical review and approval for their use.

Data Availability Statement

Datasets that were analyzed during this study are available in TCGA (https://portal.gdc.cancer.gov/, accessed on 20 December 2022).

Acknowledgments

The authors acknowledge administrative support from the Chinese Scholarship Council–New Zealand-China Research Collaboration Centres (CSC-NZ CRCC).

Conflicts of Interest

The authors declare no conflict of interest.

References

  1. World Health Organization International Agency for Research on Cancer. GLOBOCAN: Estimated Cancer Incidence, Mortality and Prevalence Worldwide in 2022. Available online: https://gco.iarc.fr (accessed on 10 April 2023).
  2. Turajlic, S.; Swanton, C.; Boshoff, C. Kidney cancer: The next decade. J. Exp. Med. 2018, 215, 2477–2479. [Google Scholar] [CrossRef] [Green Version]
  3. Truong, L.D.; Shen, S.S. Immunohistochemical diagnosis of renal neoplasms. Arch. Pathol. Lab. Med. 2011, 135, 92–109. [Google Scholar] [CrossRef] [PubMed]
  4. Prasad, S.R.; Humphrey, P.A.; Catena, J.R.; Narra, V.R.; Srigley, J.R.; Cortez, A.D.; Dalrymple, N.C.; Chintapalli, K.N. Common and un-common histologic subtypes of renal cell carcinoma: Imaging spectrum with pathologic correlation. Radiographics 2006, 26, 1795–1806; discussion 1806–1810. [Google Scholar] [CrossRef] [Green Version]
  5. Zhang, H.; Zhu, G. Predictive Biomarkers and Novel Targets in the Treatment of Metastatic Renal Cell Carcinoma. Curr. Med. Chem. 2021, 28, 5213–5227. [Google Scholar] [CrossRef]
  6. Ged, Y.; Voss, M.H. Novel emerging biomarkers to immunotherapy in kidney cancer. Ther. Adv. Med. Oncol. 2021, 13, 17588359211059367. [Google Scholar] [CrossRef] [PubMed]
  7. Muratovska, A.; Zhou, C.; He, S.; Goodyer, P.; Eccles, M.R. Paired-Box genes are frequently expressed in cancer and often required for cancer cell survival. Oncogene 2003, 22, 7989–7997. [Google Scholar] [CrossRef] [Green Version]
  8. Li, C.G.; Eccles, M.R. PAX Genes in Cancer; Friends or Foes? Front. Genet. 2012, 3, 6. [Google Scholar] [CrossRef] [Green Version]
  9. Robson, E.J.; He, S.J.; Eccles, M.R. A PANorama of PAX genes in cancer and development. Nat. Rev. Cancer 2006, 6, 52–62. [Google Scholar] [CrossRef]
  10. Tong, G.X.; Melamed, J.; Mansukhani, M.; Memeo, L.; Hernandez, O.; Deng, F.M.; Chiriboga, L.; Waisman, J. PAX2: A reliable marker for nephrogenic adenoma. Mod. Pathol. 2006, 19, 356–363. [Google Scholar] [CrossRef] [PubMed] [Green Version]
  11. Ozcan, A.; de la Roza, G.; Ro, J.Y.; Shen, S.S.; Truong, L.D. PAX2 and PAX8 expression in primary and metastatic renal tumors: A comprehensive comparison. Arch. Pathol. Lab. Med. 2012, 136, 1541–1551. [Google Scholar] [CrossRef] [Green Version]
  12. Hueber, P.A.; Waters, P.; Clark, P.; Eccles, M.; Goodyer, P. PAX2 inactivation enhances cisplatin-induced apoptosis in renal carcinoma cells. Kidney Int. 2006, 69, 1139–1145, Erratum in Kidney Int. 2006, 70, 1666. [Google Scholar] [CrossRef] [PubMed] [Green Version]
  13. Bradford, S.T.J.; Grimley, E.; Laszczyk, A.M.; Lee, P.H.; Patel, S.R.; Dressler, G.R. Identification of Pax protein inhibitors that suppress target gene expression and cancer cell proliferation. Cell Chem. Biol. 2022, 29, 412–422.e4. [Google Scholar] [CrossRef]
  14. Doberstein, K.; Pfeilschifter, J.; Gutwein, P. The transcription factor PAX2 regulates ADAM10 expression in renal cell carcinoma. Carcinogenesis 2011, 32, 1713–1723. [Google Scholar] [CrossRef] [Green Version]
  15. Singla, M.; Kumar, A.; Bal, A.; Sarkar, S.; Bhattacharyya, S. Epithelial to mesenchymal transition induces stem cell like phenotype in renal cell carcinoma cells. Cancer Cell Int. 2018, 18, 57. [Google Scholar] [CrossRef] [Green Version]
  16. Kaur, G.; Li, C.G.; Chantry, A.; Stayner, C.; Horsfield, J.; Eccles, M.R. SMAD proteins directly suppress PAX2 transcription downstream of transforming growth factor-beta 1 (TGF-β1) signalling in renal cell carcinoma. Oncotarget 2018, 9, 26852–26867. [Google Scholar] [CrossRef] [Green Version]
  17. Luu, V.D.; Boysen, G.; Struckmann, K.; Casagrande, S.; von Teichman, A.; Wild, P.J.; Sulser, T.; Schraml, P.; Moch, H. Loss of VHL and hypoxia provokes PAX2 up-regulation in clear cell renal cell carcinoma. Clin. Cancer Res. 2009, 15, 3297–3304. [Google Scholar] [CrossRef] [PubMed] [Green Version]
  18. Patel, S.A.; Hirosue, S.; Rodrigues, P.; Vojtasova, E.; Richardson, E.K.; Ge, J.; Syafruddin, S.E.; Speed, A.; Papachristou, E.K.; Baker, D.; et al. The renal lineage factor PAX8 controls oncogenic signalling in kidney cancer. Nature 2022, 606, 999–1006. [Google Scholar] [CrossRef]
  19. Bleu, M.; Gaulis, S.; Lopes, R.; Sprouffske, K.; Apfel, V.; Holwerda, S.; Pregnolato, M.; Yildiz, U.; Cordo’, V.; Dost, A.F.M.; et al. PAX8 activates metabolic genes via enhancer elements in Renal Cell Carcinoma. Nat. Commun. 2019, 10, 3739. [Google Scholar] [CrossRef] [Green Version]
  20. Li, C.G.; Nyman, J.E.; Braithwaite, A.W.; Eccles, M.R. PAX8 promotes tumor cell growth by transcriptionally regulating E2F1 and stabilizing RB protein. Oncogene 2011, 30, 4824–4834. [Google Scholar] [CrossRef] [Green Version]
  21. Lun, J.; Wang, Y.; Gao, Q.; Wang, Y.; Zhang, H.; Fang, J. PHD3 inhibits cell proliferation through hydroxylation of PAX2 at proline 9. Acta Biochim. Biophys. Sin. Shanghai 2022, 54, 708–715. [Google Scholar] [CrossRef]
  22. Song, H.; Kwan, S.Y.; Izaguirre, D.I.; Zu, Z.; Tsang, Y.T.; Tung, C.S.; King, E.R.; Mok, S.C.; Gershenson, D.M.; Wong, K.K. PAX2 Expression in Ovarian Cancer. Int. J. Mol. Sci. 2013, 14, 6090–6105. [Google Scholar] [CrossRef] [Green Version]
  23. Baumann Kubetzko, F.B.; Di Paolo, C.; Maag, C.; Meier, R.; Schäfer, B.W.; Betts, D.R.; Stahel, R.A.; Himmelmann, A. The PAX5 oncogene is expressed in N-type neuroblastoma cells and increases tumorigenicity of a S-type cell line. Carcinogenesis 2004, 25, 1839–1846. [Google Scholar] [CrossRef]
  24. Geeleher, P.; Cox, N.; Huang, R.S. pRRophetic: An R package for prediction of clinical chemotherapeutic response from tumor gene expression levels. PLoS ONE 2014, 9, e107468. [Google Scholar] [CrossRef] [Green Version]
  25. Lang, D.; Powell, S.K.; Plummer, R.S.; Young, K.P.; Ruggeri, B.A. PAX genes: Roles in development, pathophysiology, and cancer. Biochem. Pharmacol. 2007, 73, 1–14. [Google Scholar] [CrossRef] [PubMed]
  26. Eccles, M.R.; Wallis, L.J.; Fidler, A.E.; Spurr, N.K.; Goodfellow, P.J.; Reeve, A.E. Expression of the PAX2 gene in human fetal kidney and Wilms’ tumor. Cell Growth Differ. 1992, 3, 279–289. [Google Scholar]
  27. Kaddour, H.; Coppola, E.; Di Nardo, A.A.; Le Poupon, C.; Mailly, P.; Wizenmann, A.; Volovitch, M.; Prochiantz, A.; Pierani, A. Extracellular Pax6 Regulates Tangential Cajal-Retzius Cell Migration in the Developing Mouse Neocortex. Cereb. Cortex. 2020, 30, 465–475. [Google Scholar] [CrossRef] [Green Version]
  28. Harshman, L.A.; Brophy, P.D. PAX2 in human kidney malformations and disease. Pediatr. Nephrol. 2012, 27, 1265–1275. [Google Scholar] [CrossRef]
  29. Lee, S.; Jeon, H.G.; Kwak, C.; Kim, H.H.; Byun, S.S.; Lee, S.E.; Lee, E. Gender-specific clinicopathological features and survival in patients with renal cell carcinoma (RCC). BJU Int. 2012, 110, E28–E33. [Google Scholar] [CrossRef] [PubMed]
  30. Schwarz, M.; Cecconi, F.; Bernier, G.; Andrejewski, N.; Kammandel, B.; Wagner, M.; Gruss, P. Spatial specification of mammalian eye territories by reciprocal transcriptional repression of Pax2 and Pax6. Development 2000, 127, 4325–4334. [Google Scholar] [CrossRef] [PubMed]
  31. Hans, S.; Liu, D.; Westerfield, M. Pax8 and Pax2a function synergistically in otic specification, downstream of the Foxi1 and Dlx3b transcription factors. Development 2004, 131, 5091–5102. [Google Scholar] [CrossRef] [Green Version]
  32. Grote, D.; Souabni, A.; Busslinger, M.; Bouchard, M. Pax 2/8-regulated Gata 3 expression is necessary for morphogenesis and guidance of the nephric duct in the developing kidney. Development 2006, 133, 53–61. [Google Scholar] [CrossRef] [Green Version]
  33. Naylor, R.W.; Przepiorski, A.; Ren, Q.; Yu, J.; Davidson, A.J. HNF1β is essential for nephron segmentation during nephrogenesis. J. Am. Soc. Nephrol. 2013, 24, 77–87. [Google Scholar] [CrossRef] [PubMed] [Green Version]
  34. Wessely, O.; Shankland, S.J. The proliferative and the antifibrotic side of PAX2 in tubular repair. Kidney Int. 2022, 102, 12–13. [Google Scholar] [CrossRef]
  35. Allison, S.J. PAX8: A candidate oncogene in RCC. Nat. Rev. Nephrol. 2019, 15, 662. [Google Scholar] [CrossRef] [PubMed]
  36. Hueber, P.A.; Iglesias, D.; Chu, L.L.; Eccles, M.; Goodyer, P. In vivo validation of PAX2 as a target for renal cancer therapy. Cancer Lett. 2008, 265, 148–155. [Google Scholar] [CrossRef]
  37. Roh, M.H.; Yassin, Y.; Miron, A.; Mehra, K.K.; Mehrad, M.; Monte, N.M.; Mutter, G.L.; Nucci, M.R.; Ning, G.; Mckeon, F.D.; et al. High-grade fimbrial-ovarian carcinomas are unified by altered p53, PTEN and PAX2 expression. Mod. Pathol. 2010, 23, 1316–1324. [Google Scholar] [CrossRef] [Green Version]
  38. Modi, D.A.; Tagare, R.D.; Karthikeyan, S.; Russo, A.; Dean, M.; Davis, D.A.; Lantvit, D.D.; Burdette, J.E. PAX2 function, regulation and targeting in fallopian tube-derived high-grade serous ovarian cancer. Oncogene 2017, 36, 3015–3024. [Google Scholar] [CrossRef] [Green Version]
  39. Ueda, T.; Ito, S.; Shiraishi, T.; Kulkarni, P.; Ueno, A.; Nakagawa, H.; Kimura, Y.; Hongo, F.; Kamoi, K.; Kawauchi, A.; et al. Hyper-expression of PAX2 in human metastatic prostate tumors and its role as a cancer promoter in an in vitro invasion model. Prostate 2014, 73, 1403–1412, Erratum in Prostate 2014, 74, 450. [Google Scholar] [CrossRef]
  40. Frost, V.; Grocott, T.; Eccles, M.R.; Chantry, A. Self-regulated Pax gene expression and modulation by the TGFbeta superfamily. Crit. Rev. Biochem. Mol. Biol. 2008, 43, 371–391. [Google Scholar] [CrossRef] [PubMed]
  41. Tang, Z.; Li, C.; Kang, B.; Gao, G.; Li, C.; Zhang, Z. GEPIA: A web server for cancer and normal gene expression profiling and interactive analyses. Nucleic Acids Res. 2017, 45, W98–W102. [Google Scholar] [CrossRef] [Green Version]
  42. Tang, Z.; Kang, B.; Li, C.; Chen, T.; Zhang, Z. GEPIA2: An enhanced web server for large-scale expression profiling and interactive analysis. Nucleic Acids Res. 2019, 47, W556–W560. [Google Scholar] [CrossRef] [Green Version]
  43. Han, H.; Chen, Y.; Yang, H.; Cheng, W.; Zhang, S.; Liu, Y.; Liu, Q.; Liu, D.; Yang, G.; Li, K. Identification and Verification of Diagnostic Biomarkers for Glomerular Injury in Diabetic Nephropathy Based on Machine Learning Algorithms. Front. Endocrinol. 2022, 13, 876960. [Google Scholar] [CrossRef] [PubMed]
  44. Tong, S.; Ye, L.; Xu, Y.; Sun, Q.; Gao, L.; Cai, J.; Ye, Z.; Tian, D.; Chen, Q. IRF2-ferroptosis related gene is associated with prognosis and EMT in gliomas. Transl. Oncol. 2022, 26, 101544. [Google Scholar] [CrossRef] [PubMed]
  45. Wilkerson, M.D.; Hayes, D.N. ConsensusClusterPlus: A class discovery tool with confidence assessments and item tracking. Bioinformatics 2010, 26, 1572–1573. [Google Scholar] [CrossRef] [Green Version]
  46. Zhou, T.; Yang, P.; Tang, S.; Zhu, Z.; Li, X.; Yang, Z.; Wu, R.; Tian, X.; Li, L. Classification of Lung Adenocarcinoma Based on Immune Checkpoint and Screening of Related Genes. J. Oncol. 2021, 2021, 5512325. [Google Scholar] [CrossRef]
  47. Hänzelmann, S.; Castelo, R.; Guinney, J. GSVA: Gene set variation analysis for microarray and RNA-seq data. BMC Bioinform. 2013, 14, 7. [Google Scholar] [CrossRef] [PubMed] [Green Version]
  48. Yu, G.; Wang, L.G.; Han, Y.; He, Q.Y. clusterProfiler: An R package for comparing biological themes among gene clusters. OMICS 2012, 16, 284–287. [Google Scholar] [CrossRef]
  49. Subramanian, A.; Tamayo, P.; Mootha, V.K.; Mukherjee, S.; Ebert, B.L.; Gillette, M.A.; Paulovich, A.; Pomeroy, S.L.; Golub, T.R.; Lander, E.S.; et al. Gene set enrichment analysis: A knowledge-based approach for interpreting genome-wide expression profiles. Proc. Natl. Acad. Sci. USA 2005, 102, 15545–15550. [Google Scholar] [CrossRef]
  50. Leek, J.T.; Johnson, W.E.; Parker, H.S.; Jaffe, A.E.; Storey, J.D. The sva package for removing batch effects and other unwanted variation in high-throughput experiments. Bioinformatics 2012, 28, 882–883. [Google Scholar] [CrossRef] [PubMed] [Green Version]
  51. Ito, K.; Murphy, D. Application of ggplot2 to Pharmacometric Graphics. CPT Pharmacomet. Syst. Pharmacol. 2013, 2, e79. [Google Scholar] [CrossRef]
  52. Liao, X.; Wang, W.; Yu, B.; Tan, S. Thrombospondin-2 acts as a bridge between tumor extracellular matrix and immune infiltration in pancreatic and stomach adenocarcinomas: An integrative pan-cancer analysis. Cancer Cell Int. 2022, 22, 213. [Google Scholar] [CrossRef]
Figure 1. Flow diagram of the study. This study aims to investigate the expression levels and potential roles of the PAX gene family in RCC. RCC patients are classified based on the expression of key PAX genes, leading to the identification of two subgroups: PAXClusterA and PAXClusterB. Further, the study explores the differences in clinical outcomes between RCCs belonging to these subgroups.
Ijms 24 11432 g001
Figure 2. Analysis of PAX gene expression in RCC subtypes using the TCGA dataset. (A) Box plots depicting the expression levels of PAX2 in three RCC subtypes. (B) Box plots displaying the expression of PAX6 in three RCC subtypes. (C) Box plots displaying the expression levels of PAX8 in three RCC subtypes. KICH (n = 65), KIRC (n = 530), KIRP (n = 288).
Ijms 24 11432 g002
Figure 3. Analysis of PAX gene expression in RCC cell lines using RT-qPCR. The expression levels of multiple PAX genes were normalized to reference genes. The expression data are presented relative to the “calibrator” cell line, which exhibited the highest expression level (*). The gene expression profiles were determined using the −ΔΔCt method. RT-qPCR was performed with three biological replicates (n = 3).
Ijms 24 11432 g003
Figure 4. Effects of PAX2 or PAX8 knockdown on cell proliferation in A498 cell line. (A) Protein levels of PAX2 and PAX8 in A498 cell line were assessed using Western blots at various time points (as indicated) after transfecting with siRNA (S2, S8 or A8). Negative control samples were untreated (UN) and control siRNA-treated (SN) cells. (B) A498 cells were untreated (UN) or treated with SN, S2, or S8 on Day 0. Cell proliferation assays (MTT) were performed at the indicated time points (0, 2, 4, and 6 days post-treatment). (C) Cell proliferation was quantified (MTT) at 96 h post-treatment. PAX8 knockdown was carried out using two different PAX8 siRNAs (S8 and A8) to verify the proliferation reduction observed in A498 cells. siRNA concentration: 10 nm. *, p < 0.05; **, p < 0.01; and ***, p < 0.001 (one-way ANOVA, Tukey’s test).
Ijms 24 11432 g004
Figure 5. This figure illustrates the correlation between PAX gene expression and publicly available clinical data in RCC patients. (A) Gene expression levels of PAX genes in RCC compared to adjacent normal tissue; (B,C) Kaplan–Meier plots showing analysis of the relative level of PAX2 (B) and PAX8 (C) expression versus overall survival in RCC patients. RCC patient data were derived from three TCGA cohorts (TCGA-KIRC, TCGA-KIRP, and TCGA-KICH), while the data from a group of normal controls were derived from the normal adjacent/matched normal samples of RCC patients in TCGA. The analysis included a total of 881 patients. The significance level is indicated as *** p < 0.001.
Ijms 24 11432 g005
Figure 6. Unsupervised clustering and its association with RCC clinical outcome. (A) Heatmap representing the consensus matrix with a cluster count of two, which was determined using the minimal consensus score of >0.8. (B) Kaplan–Meier survival curve showing the relationship between PAX gene-related subtypes and overall survival. The PAXcluster A subtype has a better survival advantage than the PAXcluster B subtype. n = 881 patients.
Ijms 24 11432 g006
Figure 7. Identification of clinical features of PAXClusterA and PAXClusterB expression subtypes. The relationship between age, gender, stage, grade, T, M, N, and the PAXCluster subtypes, PAXClusterA (ClusterA) and PAXClusterB (Cluster B). The TNM system of cancer staging reflects the extent of primary tumor growth (T), the nodal status for metastasis (N), and the metastasis to distant organs (M). Statistical analysis was carried out using the Chi-squared test. n = 881 patients.
Ijms 24 11432 g007
Table 1. TGCA-Patient Clinical Information.
Clinical FeaturesKICHKIRCKIRP
StatusAlive55357244
Dead1017344
AgeMean (SD)51.9 (14.1)60.6 (12.1)61.6 (11.9)
Median [MIN, MAX]50 [17, 86]61 [26, 90]61 [28, 88]
GenderFemale2618676
Male39344212
RaceAsian286
Black45660
White57459205
American Indian 2
pT_stageT120271199
T2256936
T31817947
T42112
TX 4
pN_stageN039239143
N131624
N22 3
NX21275118
pM_stageM050440205
M12809
MX131074
pTNM_stageI20265179
II255725
III1412351
IV68215
Table 2. Gene-specific primers used in this study.
Target GeneForward PrimerReverse Primer
PAX1ACCCCCGCAGTGAATGGTGTACACGCCGTGCTGGTT
PAX2CCTGGCCACACCATTGTTCTCACGTTTCCTCTTCTCACCAT
PAX3ACGCGGTCTGTGATCGAAACATCTCGCTTTCCTCTGCCTCCTT
PAX4CAGAGGCACTGGAGAAAGAGTTCCCATTTGGCTCTTCTGTTGGA
PAX5GTGCCTGGGAGTGAGTTTTCCGGCGGCAGCGCTATAATAGT
PAX6GAGGCTCAAATGCGACTTCAGTGCTAGTCTTTCTCGGGCAAA
PAX7GGAAGAAAGAGGAGGAGGATGAGCCAGCCGGTTCCCTTTGT
PAX8TGAGGGCGTCTGTGACAATGCGGGACTCAGGGACTTGGT
PAX9AGTACGGTCAGGCACCAAATGATAACCAGAAGGAGCAGCACTGTAG
Disclaimer/Publisher’s Note: The statements, opinions and data contained in all publications are solely those of the individual author(s) and contributor(s) and not of MDPI and/or the editor(s). MDPI and/or the editor(s) disclaim responsibility for any injury to people or property resulting from any ideas, methods, instructions or products referred to in the content.

