1. Introduction
Skeletal muscle (SKM) is the largest metabolic organ and constitutes approximately 35–40% of the adult body mass in mammals, and it is highly energy demanding because of its essential role in various physical activities, such as ambulation and various body movements [
1]. Therefore, a proper energy supply is critical for the SKM, as well as the whole body’s health. Mitochondria (MITO) and peroxisomes (PEXO) are the major organelles involved in oxidative metabolism that generate ATP currency in the cell, and their biogenesis and functions are critically regulated by the transcriptional coactivator PGC-1α [
2,
3]. MITO are double-membraned organelles that carry extra-nuclear DNA genome (mtDNA), and they provide ATP currency through oxidative phosphorylation (OXPHOS) of the reducing equivalents FADH2 and NAD(P)H, which are mainly derived from glycolysis and the tricarboxylic acid (TCA) cycle, which occur in the cytoplasm and MITO matrix, respectively [
4]. OXPHOS is performed by five complexes embedded in the MITO inner membrane, and electron leakage from the OXPHOS is a major source of reactive oxygen species (ROS) in the cell.
PEXO are single-membrane-bounded organelles that do not carry genetic material [
5,
6]. In addition to the β-oxidation of very long chain, unsaturated, and branched fatty acids, they can also metabolize carboxylates containing a 3-methyl or 2-hydroxy group via α-oxidation, whereby one-carbon shortened products can be passed onto the β-oxidation system [
6]. Another important function of peroxisomes is the removal of harmful reactive oxygen species (ROS) concomitantly generated via oxidation of substrates in mitochondria and peroxisomes, which is performed by several antioxidant enzymes, including catalase, SOD1, and PRDX5.
Both mitochondria and peroxisomes are highly dynamic, and their number and morphology are regulated by the balance between biogenesis and autophagy (mitophagy and pexophagy, respectively) to meet physiological demands, such as exercise, in the SKM. Oxidative exercise induces MITO proliferation to promote oxidative respiration which, in turn, will increase the number of type-I myotubes in SKM, while a sedentary lifestyle or disuse antagonizes this process [
7]. The fusion and fission of existing MITO are the two processes that generate new MITO, and both are mediated by members of the dynamin GTPase-related protein (DRP) family. Enhanced fusion creates MITO networks that are higher in membrane potential (Δψ
m) and ATP production efficiency; on the contrary, a lack of fusion generates more vesicular MITO that are poor in efficiency (reviewed in [
8]), probably due to increased mtDNA mutation and depletion [
9].
The biogenesis of peroxisomes can be achieved through the fission of existing peroxisomes and de novo from ER- and MITO-derived membrane; regardless of the pathway, the import of matrix and membrane proteins is essential for biogenesis. Peroxisome matrix proteins carrying peroxisome targeting signal 1 or 2 (PTS-1/2) can be recognized by their cognate receptors, Pxe5 or Pex7, respectively, before being carried to the surface for translocation into peroxisomes [
6]. Peroxisome membrane proteins (PMPs) can be recognized by cytoplasmic receptor Pex19, which docks onto Pex3, located on the peroxisome’s surface, to transfer PMPs to PEXO via the class I pathway. Pex3 is also recognized by Pex19 in the cytoplasm, and it is received by Pex16, located on pre-peroxisome’s membrane, via the class II pathway, and the newly integrated Pex3 recruits more Pex19, which carry PMPs, to generate mature PEXO. After docking, Pex19 is recycled back to the cytoplasm via both pathways. A recent study found that Pex3 and Pex16 are preferentially located on pre-peroxisome vesicles derived from MITO and ER, respectively, demonstrating the differential contribution of the membrane from both organelles [
10]. Peroxisome proliferators, such as fenofibrate, stimulate peroxisome fission in which Pex11βs, which oligomerizes on elongated peroxisome surfaces, recruit fission machinery consisting of Mff, Fis1, and DLP1 to promote peroxisomal fission.
Although MITO and PEX perform independent roles in the metabolism, they collaborate in many metabolic processes, especially fatty acid β-oxidation (FABO) and ROS metabolism [
11]. Fatty acids of short (<C8), medium (C8−C14), and long (C16−C20) chains are majorly metabolized in MITO. Peroxisomes prefer very long chain fatty acids (VLCFA, >C20) for oxidation but only digest them to C8−C6 before transferring them to MITO for further processing. Acetyl-CoA, generated from FABO in peroxisomes, is transported into MITO for further metabolism in the TCA cycle. ROS leaked from MITO can be handled by the scavenging systems in peroxisomes and cytoplasm. It will be interesting to determine how the functions and crosstalk of these two organelles are coordinated during myogenesis and the development of SKM.
All trunk and limb SKM cells in vertebrates are derived from progenitor cells residing in transient embryonic tissue, called somites, located on both sides of the neural tube [
12]. Myogenic stem cells (MSCs) in somites are marked by the expression of
Pax3 and
Pax7, and they become myoblasts after the expression of
Myf5 or
MyoD [
13]. Upon the stimulation of differentiation signals, myoblasts (
Myf5+ or
MyoD+) start expressing
Myogenin and
Mef2c that cooperatively drive the terminal myogenic differentiation process. A later stage of muscle development, including alignment and maturation of myotubes, is regulated by Mrf4. The expression of
MyoD,
Myf5,
Myogenin, and
Mrf4 is highly SKM-specific, and they are collectively called myogenic regulatory factors (MRFs). MRFs recognize a CANNTG
cis-element (called E-box) with their basic helix–loop–helix (bHLH) DNA-binding domain, and they control the expression of most, if not all, SKM-specific genes [
14]. Notably, Mrf4 is the dominant MRF in mature myofibers of postnatal muscles, while MyoD is essential to the activation of SKM stem cells, the satellite cells, and thus critical to the regeneration of damaged SKM [
15].
Since SKM is a highly energy-demanding organ that is highly reliant on oxidative metabolism performed in MITO and PEXO, the coordinated regulation of both organelles should play critical roles in its development. However, the dynamics and functional changes of MITO and PEXO during this process have not been observed before. Here, the dynamics of both organelles were examined during myogenesis in vitro and in vivo/utero, and an interesting change in number and function was observed during myogenesis. Hopefully, unraveling the coupled regulation of both organelles will shed light on the complex mechanism of cell differentiation.
4. Methods
4.1. Plasmids
The promoter of
Pex3 was amplified from mouse genomic DNA by
Taq DNA polymerase and inserted into the
XhoI site of the pStable-luc vector. The promoters of
Pex16 and
Pex19 were amplified from mouse genomic DNA by
Taq DNA polymerase (
pfu) and inserted into the
SmaI site of the pGL3-basic vector and the
XhoI (blunted) site of the pStable-luc vector, respectively. The expression vector (TRCN0000126812) for
shRNA targeting
Pex3 was acquired from the RNAi core facility of the Academia Sinica (
https://rnai.genmed.sinica.edu.tw/index.html (accessed on 5 August 2018)). The coding sequence of RFP was PCR amplified from PLKO-
RFP vector with primers containing the PTS1 sequence in the N-terminus and inserted into the
EcoRV site of the pCDNA3.0 vector [
26]. The coding sequence of the Flag-HA-mEeos4b was amplified from parental vector pCDNA3-Flag-HA-mEeos4b (a general gift from Dr. Won-Jin Wang, National Yang Ming University) by
Taq DNA polymerase (
pfu) with PTS1-Tag encoded in the reverse primer. The PCR product (Flag-HA-mEeos4b-PTS1) was inserted into the
EcoRV site of the pCDNA3 vector. The CDS of
Pex3 was amplified from the p
PEX3–GFP (a generous gift from Dr. Jennifer Lippincott-Schwartz, Janelia Research Campus, Howard Hughes Medical Institute) by
Taq DNA polymerase (
pfu) and inserted into the
XhoI (blunted) site of the pCEGFP-TRE vector to generate the pCEGFP-TRE-
Pex3 plasmid. Both pCEGFP-TRE and pStable-luc vectors were created in our laboratory and their description can be found in our previous studies [
39]. The primer sets used in the cloning are listed in the
Supplementary Table S2.
4.2. Cell Culture and Differentiation
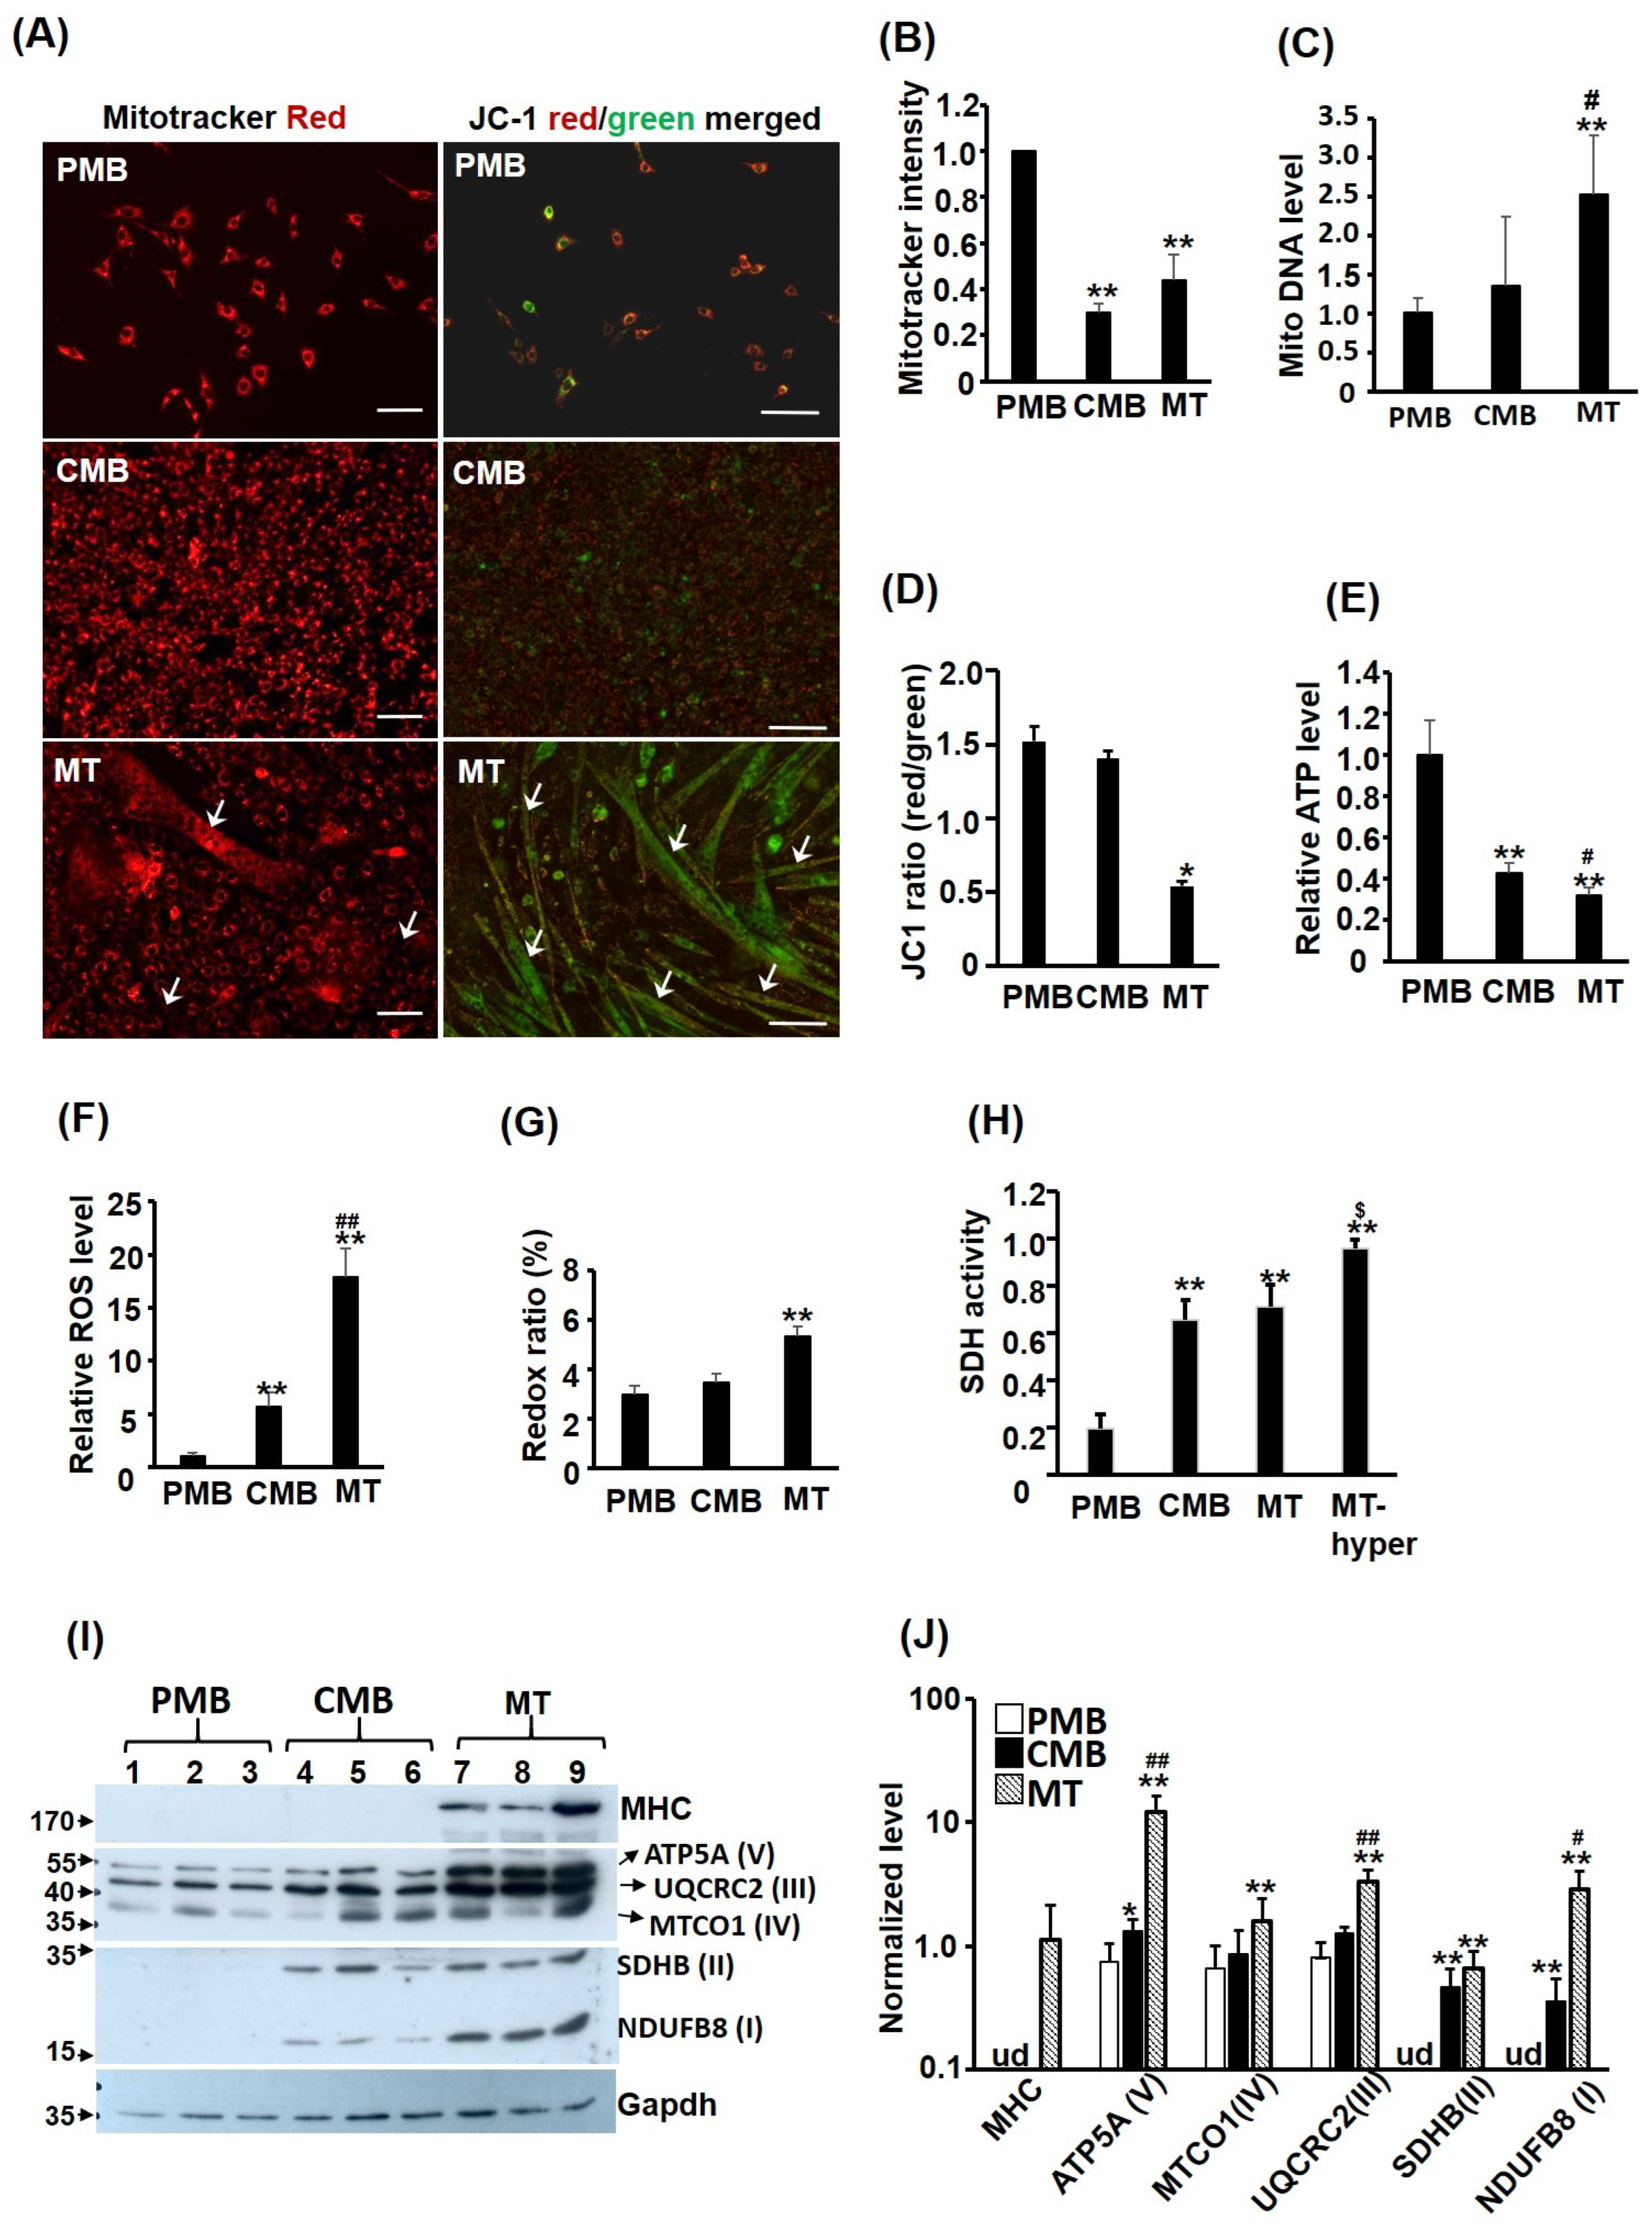
C2C12 myoblasts and C3H10T1/2 fibroblasts were kept in growth medium (GM) containing DMEM supplemented with 20% and 10% FCS, respectively. C2C12 were kept at low confluence during passage to avoid spontaneous differentiation and cells at this stage were called proliferating myoblasts (PMB). To induce myogenic differentiation, C2C12 were allowed to grow confluent to become confluent myoblasts (CMB), then GM was replaced by differentiation medium (DM, DMEM supplemented with 2% horse serum) to trigger the formation of multinucleated myotubes (MT) for 3–4 days before it was harvested for various analyses.
4.3. Satellite Cells Isolation and Culture
Satellite cells were isolated with the pre-plating protocol as reported previously [
40]. Briefly, neonatal FVB mice were euthanized with a CO
2 overdose and their SKM was isolated and cut into small pieces before digestion with collagenase (2 mg/mL) and trypsin (0.5×) at 37 °C for 2 h. Suspended cells and tissues were collected via centrifugation and further digested with new enzymes for 2 h at 37 °C until tissue clumps disappeared. An equal volume of plating medium (DMEM with 10% horse serum) was added and the mixture was filtered through cell strainers to remove undigested tissues. Cells in the filtrate were collected via spinning and re-suspended in growth medium (DMEM with 20% FCS and 3% chicken embryo extract) before being seeded onto dishes for attachment of adherent cells (named pre-plating #1, PP1). After 1 h, suspended cells were transferred to new dishes (PP2) and incubated for 2 h before being transferred to new dishes (PP3) for further incubation for 24 h. Then, cells were transferred to new dishes coated with collagen I/II (PP4) and incubated for 24 h before being transferred again to collagen-coated dishes with collected PP5 cells. Both PP4 and PP5 cells contained major satellite cells (>95%) and were further expended and used as satellite cells in various assays. The use of mice for isolating satellite cells and embryos has been approved by the Institutional Animal Care and Use Committee of National Central University with the approval numbers NCU-108–015 and NCU-109–012. Satellite cells were kept at low confluence to avoid spontaneous differentiation and their myogenic differentiation was induced when they were in high density, but not confluent, by changing to differentiation medium as seen in C2C12 myoblasts.
4.4. Transfection and Transient Promoter Assay
Cells were split and plated into 12-well culture dishes one day before transfection, so all transfections were performed at 60–70% of cell confluence. DNA aliquots (0.67 µg reporter construct and 0.33 µg expression vector per well) and transfection reagent (T-Pro NTR-II, T-Pro Biotechnology) were mixed in 1X Hepes buffer (20 mM Hepes at pH 7.0, 187 mM NaCl, 5 mM KCl, 0.7 mM Na2HPO4, and 5.5 mM dextrose) and incubated at room temperature for 15–30 min, allowing the DNA/liposome complex to form. Then, aliquots of culture medium were added to each tube and mixed gently, and medium containing the DNA/liposome complex was transferred to cells in triplicate. This transfection step was allowed to proceed overnight before the media were replaced with differentiation medium containing 2% horse serum. Cells were harvested and assayed for luciferase activity 16–24 h after transfection in a Clarity 2 luminometer (BioTEK; Winooski, VM, USA).
4.5. Stable Transfection of Over-Expressed Cells
C2C12 myoblasts stably over-expressed with RFP-PTS1 (C2-RFP-PTS1) was created by transfecting pCDNA3-RFP-PTS1 into C2C12 at low confluence, as described in the transfection before selection with G418 (800 μg/mL) for 2–3 weeks until multiple stable clones were acquired. Monoclonal colonies were picked and expended to identify clones with high RFP-PTS1 expression and normal myogenic differentiation. C2C12 myoblasts stably over-expressed with Flag-HA-mEeos4b-PTS1 (C2-Flag-HA-mEeos4b-PTS1) were created similarly.
To establish the Tet-off stable clones, the tetracycline-controlled transactivator (tTA) expression vector pEF-tTA-IRES-puro (5 μg/well) was transfected into C2C12 myoblasts and selected with puromycin (2.5 μg/mL) for 2–3 weeks to generate multiple colonies. Monoclones (C2-tTA) with stable tTA expression and normal myogenesis were selected for further experiments. To generate stable clones with Pex3 expression under tTA regulation, pCEGFP-TRE-Pex3 vector (5 μg/well) was transfected into the C2-tTA cells and selected with G418 (800 μg/mL) and puromycin (2.5 μg/mL) for 2–3 weeks until stable clones were acquired. Monoclones (C2-tTA-Pex3) with stable GFP and Pex3 expression and normal myogenesis were selected for further analyses. Doxycycline (Dox, 25 ng/mL) was included in the medium to avoid the expression of Pex3 and GFP during selection and passage, and their expression was allowed when Dox was removed.
4.6. Gene Knockdown by Lentivirus Expressed shRNA
Infectious lentivirus expressing shRNA targeting Pex3 mRNA was generated by transfecting pCMV-Δ8.91 (5.625 μg), pMD.G (0.625 μg), and the shRNA expressing pLKO1 vectors (6.25 μg) into 293FT cells (on a 10 cm dish) for 48 hr before they were collected in the culture medium to infect C2C12 myoblasts. Infected C2C12 myoblasts were stored with puromycin (2 ug/mL) for at least 2 weeks to generate monoclonal colonies and these clones were expanded and examined for their Pex3 levels via RT-PCR. Clones derived from pLKO1-126812 plasmid (clone ID TRCN0000126812) showing reduced Pex3 levels were used for further experiments. All vectors used for the knockdown experiment were acquired from the RNAi core facility of Academia Sinica.
4.7. Knockdown of Pex3 by CRISPR Interference (CRISPRi)
The CRISPRi system was established according to previous studies [
41], and the detailed protocol has been published in our previous study [
42]. Briefly, C2C12 myoblasts were over-expressed with
KRAB-dCas9-P2A-mCherry fusion gene via lentivirus infection and infected C2C12 myoblasts were later serially diluted in a 96-well titer plate to identify red clones expressing KRAB-dCas9-P2A-mCherry. Cells with bright mCherry fluorescence were further expanded and then transfected with the PX459ΔCas9 vector (a derivative of the PX459 vector with the
Cas9 gene deleted) carrying
sgRNA (
sgPex3-1: 5′-TCCGTCCGCAAATAGCTCCC-3′ or
sgPex3-2: 5′-AGCTATTTGCGGACGGACCC-3′) targeting the sequence (−14~+6 and −11~+9, respectively) around the transcriptional initiation site of the
Pex3 gene and stored with puromycin (2.5 μg/mL) for 2–3 weeks. Monoclones with bright mCherry fluorescence and puromycin resistance were picked up and expanded to analyze the expression of
Pex3 and other genes via qRT-PCR. The targeting site and sgRNA sequences were designed using the CHOPCHOP (
https://chopchop.cbu.uib.no (accessed on 10 January 2021)) and CRISPO (
http://crispor.tefor.net (accessed on 11 May 2022)) algorithms.
4.8. Quantitative RT-PCR (qRT-PCR)
Total RNA was isolated by lysing cells with Solution D (4 M guanidinium thiocyanate, 25 mM sodium citrate, pH7.0, 0.5% sarcosyl, 0.1% β-mecaptoethanol) and the genomic DNA and proteins were removed via repeated (×4) acid phenol/chloroform extractions before they were cleaned up via ethanol precipitation and high speed centrifugation [
43]. The detailed protocol for traditional and quantitative RT-PCR has been described in our previous studies [
27,
44]. Briefly, the first strand of cDNA was synthesized using the Superscript III kit (Invitrogen) according to the manufacturer’s protocol. All qPCR was performed in a 15 μL reaction mixture containing 5 μM forward/reverse primers, template cDNA, and 1X SYBR Green reaction mix (RealQ Plus 2× Master Mix Green, Ampliqon) to detect PCR product. The signal of the
m36b4 gene, encoding for a ribosomal protein, was used as internal control amplified in the same PCR assay. The expression level of each gene was normalized to that of
m36b4 first, then, the normalized expression level (△C
t) in control cells was arbitrarily set as 1, and the control cell △C
t was deduced from those of the treatment groups to derived △△C
t. The relative expression level of each gene in treatment group cells was calculated using the equation (2
−△△Ct). To ensure the linearity of PCR amplification, 2 doses of template cDNA (equivalent to about 7 and 14 ng of total RNA) were used in separate tubes to obtain 1 cycle difference in their Ct value but with the same △C
t. All reactions were performed in the Rotor-Gene Q (QIAGEN) real-time PCR machine. The primer sets used in qRT-PCR are listed in
Supplementary Table S1.
4.9. Determination of ROS Level
The detailed protocols for these assays have been described in our previous study [
25]. Briefly, cells were grown in 6-well plates until confluent (CMB) or induced to become myotubes (MT) before they were used for assays. To measure ROS, cells were incubated in KRPH buffer (20 mM Hepes at pH 7.4, 5 mM KH
2PO
4, 1 mM MgSO
4, 1 mM CaCl
2, 136 mM NaCl, 4.7 mM KCl, and 1% BSA) containing 30 μM H2-DCFDA for 30 min. Then, cells were extensively washed with PBS, trypsinized (with 0.25× trypsin) and re-suspended in PBS buffer. The fluorescence of H2-DCFDA in the cells was measured using a fluorescence spectrophotometer (Hitachi F-4500) and normalized based on the protein level of lysate after cells were lysed post ROS determination.
4.10. Fatty Acid β-Oxidation
The protocol for measuring fatty acid oxidation has been described in our previous studies [
25,
26]. Briefly, BSA-conjugated 2 μCi
3H-labeled oleic acid (NET289005MC, Perkin Elmer) or palmitic acid (NET043001MC, Perkin Elmer) was added into cells kept in αMEM and incubated for 6 h in the presence of cold oleic (100 μM) or palmitic (50 μM) acid, respectively. Then, medium was collected and purified with 2 steps of methanol/chloroform ((3:2) followed by (1:1)) extraction to remove un-metabolized
3H-palmitic acid or -oleic acid, as reported before [
45]. The
3H radioactivity in the aqueous phase was determined using a scintillation β-counter (LS6500, Beckman) and normalized with cell lysate protein concentration to represent fatty acid β-oxidation activity of each treatment.
4.11. Redox Ratio Assay
This assay was performed as previously described [
46]. Briefly, cells grown on 6-well plates were harvested via trypsinization and suspended in PBS. Cell numbers were counted using a hemocytometer and their emission of 460 nm light after they were excited with 340 nm light was determined using the F-4500 fluorescence spectrophotometer (Hitachi) to measure their NAD(P)H content. Similarly, their emission of 528 nm light after they were excited with 454 nm light was detected to determine their FAD content. After normalization with the protein level of each sample, the redox ratio was calculated based on the emission intensity of FAD and NAD(P)H using the equation FAD/(FAD + NAD(P)H).
4.12. Mitochondrial Staining and DNA Quantification
Myoblasts grown on 6-well plates at various myogenic stages were washed with PBS thoroughly before incubated with KRPH buffer containing either MitoTracker Red CMXRox (50 ng/mL, Thermo Fisher Scientific, Waltham, MA, USA) or JC-1 (2 μM; #1130-5, BioVision, Waltham, MA, USA) for 30 min. After extensive wash in cold PBS, cells images were taken under a Carl Zeiss Axio Observer A1 fluorescence microscope with AxioVision 4.8 software. Then, cells were trypsined and re-suspended in PBS. Cell numbers were counted on hemocytometer and their emission of 595 nm light after excited with 575 nm light was determined using the F-4500 fluorescence spectrophotometer (Hitachi) to measure the MitoTracker Red staining level. The intensity of JC-1 staining of cells was measured by their emission of light at 590 (aggregates, red) and 530 (monomers, green) nm wavelengths after they were excited with light of 488 nm wavelength. The fluorescence intensity was normalized based on the protein concentration after cells were lysed. MITO morphology was also viewed through Mitotracker staining. Cells with all (or most) MITO shown as filament or vesicle in the cytoplasm were classified as filament or vesicle, respectively. While cells with both filament and vesicle MITO mixed in the cytoplasm were classified as mixture. If a cell with more than 4~5 vesicle MITO co-existed with filament MITO (or vice versa), it was classified as a mixture.
Total genomic DNA (nuclear and mitochondrial) was isolated from cells grown on 6-well plates at various myogenic stages. The relative amounts of mitochondrial DNA in the cells were determined via quantitative PCR detecting mitochondrial genes (cytochrome b and Cox II) and nuclear genes (MyoD and Oct4) levels in total genomic DNA of the same sample. The nuclear gene levels served as an input control to normalize levels of MITO genes to calculate the relative amount of MITO DNA in each sample.
4.13. Catalase Activity Assay
The assay was modified from previous studies [
47]. Briefly, C2C12 cells were harvested via trypsinization and re-suspended in PBS. Then, cells were lysed via sonication and then centrifuged to remove cell debris. The protein concentration in the supernatant was determined via Bradford protein assay and 10 ug total lysate was included in the 150 uL PBS-based reaction mixture (100 mM H
2O
2 with or without 20 mM catalase inhibitor 3-amino-1,2,4-triazole (3AT)). At various times (5, 10, or 20 min) after the reaction, residual H
2O
2 levels were determined by reading the light intensity in a Clarity 2 luminometer (BioTEK; Winooski, VM) after injecting detection mixture (100 µL) containing HRP-conjugated IgG (1 × 10
4-fold dilution in PBS) and enhanced chemiluminescence (ECL) reagent (Amersham Pharmacia Biotech). For reactions containing 3-amino-1,2,4-triazole (3AT), lysate and 3AT were pre-incubated for 20 min to ensure the inhibition of Catalase by 3-AT.
4.14. Succinate Dehydrogenase (SDH) Assay
This assay was performed as previously described [
48]. Briefly, cells at various myogenic stages were harvested via trypsinization or lifting in PBS containing 2 mM EDTA and washed extensively with PBS before being sonicated to lyse the cells. After centrifugation, the protein concentration in the supernatant was determined via Bradford assay. For SDH activity assay, lysate (50 μg), sodium succinate (200 mM, pH > 7), sodium azide (8 mM), and 2,6-dinitrophenolindophenol (DCPIP, 0.004%) were incubated at 37 °C for 30~60 min before SDS (final 2%) was added to stop the reaction. The reaction product was determined by reading the optic density (O.D.) at 600 nm in an ELISA reader and the SDH activity was calculated using equation O.D. (blank-sample)/O.D. (blank).
4.15. Western Blot
The Western blot protocol has been described in detail in our previous study [
39]. Briefly, aliquots of total lysate (50 μg) in RIPA buffer (with protease and phosphatase inhibitors) were run on 10% SDS-PAGE gels before being transferred onto a PVDF membrane (Pall FluoroTrans W membrane, PALL). After being extensively washed with PBST (PBS containing 0.5% Tween 20), PVDF membranes were blocked with 5% skimmed milk or 1% BSA (for phosphorylated proteins only) in PBST for 30~60 min. Primary antibody was diluted 1:1000 in blocking solution and incubated with the blot at 4 °C overnight. After several washes with PBST, HRP-conjugated secondary antibody (1:10,000 dilution) was added and incubated at room temperature for 1 h. After extensive washing in PBST, the HRP signal was detected using an enhanced chemiluminescence kit (Western Bright ECL, Advansta). Catalase antibody was obtained from Santa Cruz (H-9, SC271803) and the Flag antibody was purchased from Sigma (M2 antibody, F3165). The antibodies for SDHB2, Gapdh, Lamin B1, OXPHOS subunits, MTCO1, and MTCO2 were from Abcam (ab178423, ab9482-200, ab16043-25, ab110413, ab1475, and ab198286, respectively).
4.16. Detection and Counting of Peroxisomes
C2C12 myoblasts stably over-expressed with RFP-PTS1 (C2-RFP-PTS1) or Flag-HA-mEos4b (C2-tTA-mEos4b) were grown on glass cover slides held in 12-well dishes to reach various myogenic stages. Then, cells were washed extensively with cold PBS before being fixed in 4% paraformaldehyde for 30 min. Afterward, cells were extensively washed with PBS before being quenched with NH4Cl (50 mM) in PBS. To visualize the nuclei, cells were incubated with DAPI (2 μg/mL in PBS) at room temperature for 10 min and were washed with PBS thoroughly before being mounted on a slide and sealed with nail polish. To induce a color change of mEos4b, cells were exposed to UV light for a short time and harvested 24 h later or as indicated in the figure legends. All the images were observed and photographed under a Carl Zeiss Axio Observer A1 fluorescence microscope using AxioVision 4.8 software (Carl Zeiss; Oberkochen, Germany). The peroxisome numbers on photographed images were counted either manually or automatically using the Image J software.
4.17. Immunofluorescence (IF) Staining
For IF staining of myosin heavy chain (MHC), cells differentiated in DM for 72~96 h were washed with cold PBS before being fixed in 4% paraformaldehyde for 20 min. Then, they were quenched in 50 mM NH4Cl for 15 min before being permeabilized in 2% Triton-X 100 overnight. Cells were incubated in blocking solution (2% BSA and 2% goat serum in PBS) for 20 min, followed by incubation with MHC antibody (1:1000 dilution; clone MY-32, Sigma) overnight. After extensive washing with PBS, Alexa488- or 546/548-conjugated secondary antibody (Invitrogen) was added and incubated for one hour before it was washed in PBS and mounted on a slide as described above. The signals of MHC were observed and photographed under a Carl Zeiss Axio Observer A1 fluorescence microscope with AxioVision 4.8 software. To visualize PEXO, PMP70 antibody (ab3421, abcam) was used and cells were processed as described above. Goat anti-rabbit Alexa®488 and goat anti-mouse Alexa®568 were both purchased from Invitrogen (A-11001 and A-11004, respectively).
4.18. The Isolation of Embryos and Satellite Cells
Satellite cells were isolated according to the pre-plating protocol, as reported before [
40]. Briefly, neonatal FVB mice were euthanized with a CO
2 overdose and their SKM was isolated and cut into small pieces before being digested with collagenase (2 mg/mL) and trypsin (0.5×) at 37 °C for 2 h. Suspended cells and tissues were collected via centrifugation and further digested with new enzymes for 2 h at 37 °C until tissue clumps disappeared. An equal volume of plating medium (DMEM with 10% horse serum) was added and the mixture was filtered through cell strainers to remove undigested tissues. Cells in the filtrate were collected via spinning and re-suspended in growth medium (DMEM with 20% FCS and 3% chicken embryo extract) before being seeded onto dishes for attachment of adherent cells (named pre-plating #1, PP1). After 1 h, suspended cells were transferred to new dishes (PP2) and incubated for 2 h before being transferred to new dishes (PP3) for further incubation for 24 h. Then, cells were transferred to new dishes coated with collagen I/II (PP4) and incubated for 24 h before being transferred again to collagen-coated dishes to collect PP5 cells. Both PP4 and PP5 cells contained major satellite cells (>95%) and were further expended and used as satellite cells in various assays. Embryos were isolated on 11.5 dpc from CO
2-euthanized female mice and the day of females carrying a mating plug was counted as 0.5 dpc. After isolation, embryos were dissected under microscope into head, rostral, interlimb, and tail regions, and the same regions from different embryos were pooled to isolate total RNA. The use of mice for isolating satellite cells and embryos has been approved by the Institutional Animal Care and Use Committee of National Central University with the approval numbers NCU-108-015 and NCU-109-012. All animal experiments were conducted at the animal facility of the Department of Life Sciences, National Central University. The dissection and isolation of cells and embryos was performed at the Cell Differentiation Laboratory in the same department.
4.19. Statistical Analyses
All experiments were performed at least 3 times, with similar results. The results from independent experiments were pooled and their means and standard errors are shown. The difference between various treatments was examined using Student’s t-test. All tests were performed in one-to-one (treatment vs. control), but not paired, comparison and a probability value of <0.05 was considered statistically significant.


 ,
, 