Article

Metabolic Pathway Reconstruction Indicates the Presence of Important Medicinal Compounds in Coffea Such as L-DOPA

by
Thales Henrique Cherubino Ribeiro
1,
Raphael Ricon de Oliveira
1,
Taís Teixeira das Neves
2,
Wilder Douglas Santiago
3,
Bethania Leite Mansur
4,
Adelir Aparecida Saczk
5,
Mario Lucio Vilela de Resende
6 and
Antonio Chalfun-Junior
1,*
1
Laboratory of Plant Molecular Physiology, Plant Physiology Sector, Department of Biology, Federal University of Lavras (UFLA), Lavras 37200-000, Brazil
2
Plant Physiology Sector, Department of Biology, Federal University of Lavras (UFLA), Lavras 37200-000, Brazil
3
National Institute of Coffee Science and Technology (INCT-CAFÉ), Federal University of Lavras (UFLA), Lavras 37200-000, Brazil
4
Multiuser Instrumental Analysis Laboratory (LabMAI), Federal University of Lavras (UFLA), Lavras 37200-000, Brazil
5
Analytical and Electroanalytical Laboratory (LAE), Federal University of Lavras (UFLA), Lavras 37200-000, Brazil
6
Plant Pathology Department, Federal University of Lavras (UFLA), Lavras 37200-000, Brazil
*
Author to whom correspondence should be addressed.
Int. J. Mol. Sci. 2023, 24(15), 12466; https://doi.org/10.3390/ijms241512466
Submission received: 27 June 2023 / Revised: 21 July 2023 / Accepted: 2 August 2023 / Published: 5 August 2023
(This article belongs to the Section Bioactives and Nutraceuticals)

Abstract

:
The use of transcriptomic data to make inferences about plant metabolomes is a useful tool to help the discovery of important compounds in the available biodiversity. To unveil previously undiscovered metabolites of Coffea, of phytotherapeutic and economic value, we employed 24 RNAseq libraries. These libraries were sequenced from leaves exposed to a diverse range of environmental conditions. Subsequently, the data were meticulously processed to create models of putative metabolic networks, which shed light on the production of potential natural compounds of significant interest. Then, we selected one of the predicted compounds, the L-3,4-dihydroxyphenylalanine (L-DOPA), to be analyzed by LC–MS/MS using three biological replicates of flowers, leaves, and fruits from Coffea arabica and Coffea canephora. We were able to identify metabolic pathways responsible for producing several compounds of economic importance. One of the identified pathways involved in isoquinoline alkaloid biosynthesis was found to be active and producing L-DOPA, which is a common product of POLYPHENOL OXIDASES (PPOs, EC 1.14.18.1 and EC 1.10.3.1). We show that coffee plants are a natural source of L-DOPA, a widely used medicine for treatment of the human neurodegenerative condition called Parkinson’s disease. In addition, dozens of other compounds with medicinal significance were predicted as potential natural coffee products. By further refining analytical chemistry techniques, it will be possible to enhance the characterization of coffee metabolites, enabling a deeper understanding of their properties and potential applications in medicine.

1. Introduction

Coffee (Rubiaceae) is an important crop in which beans are harvested and roasted before being traded as a commodity [1]. It is produced mostly in tropical countries and is an important source of livelihood for millions of smallholder farmers and workers involved in the various steps of the coffee bean processing and trade [2]. Coffea arabica L. is the main source of coffee beans. This species is an interspecific hybrid of Coffea canephora Pierre and Coffea eugenioides Moore ancestors [3]. Among those parental species, only C. canephora is economically cultivated. The polyploidy of C. arabica (2n = 44) may provide physiological advantages to cope with abiotic stresses, improve phenotypic homeostasis [4], and allow a broader diversification of metabolite compounds—when compared to progenitor species—through the differential expression of homoeologous genes [5].
Beyond its beans, coffee leaves possess the potential to serve as a valuable source of economically important metabolites [6,7,8,9,10]. The tea derived from coffee leaves is abundant in natural polyphenolic compounds such as chlorogenic acids and xanthones, which act as vital dietary antioxidants, offering substantial health benefits to humans [7]. To further extend the portfolio of known bioactive compounds in coffee leaves, we applied bioinformatic methodologies with the aim of investigating metabolic pathways that may be constitutively expressed in C. canephora and C. arabica leaves. Our in silico analyses showed that POLYPHENOL OXIDASES (PPOs) and DOPA DECARBOXYLASES (DDCs) are expressed in leaves of both economically important coffee species.
PPOs are type III copper-containing metalloenzymes divided into three types: tyrosinases (TYRs, EC 1.14.18.1 and EC 1.10.3.1), CATECHOL OXIDASES (Cos, EC 1.10.3.1), and AURONE SYNTHASES (AUSs). AUSs are PPOs responsible for the synthesis of yellow pigments in the petals of various Asteraceae species [11]. PPOs are among the oldest enzymes known [12] and are widespread across all life kingdoms [13,14,15,16,17,18,19] with varying biological roles [16,20]. PPOs catalyze the oxidation of catechol to o-quinone in the presence of oxygen. The main difference between TYRs and COs is that the latter can only catalyze the oxidation of catechol (i.e., o-diphenol) to the corresponding o-quinone, whereas the former can catalyze both the monooxygenation of monophenols and the oxidation of catechols [21].
In animals and many microorganisms, PPOs are directly involved in the production of melanin pigments by oxidizing L-tyrosine (TYR) to L-DOPA (L-3,4-dihydroxyphenylalanine; levodopa) and other metabolites, ultimately producing dark-colored pigments [20,22]. Similarly, plant PPOs can produce dark-brownish compounds [23]. This browning process is the result of the oxidation of phenolics to quinones that are highly reactive intermediates involved in senescence, wounding, and response to pathogens [23]. After fruit harvest, the accumulation of these metabolites becomes evident. In many plant-derived foodstuffs, these reactions can reduce their nutritional quality and perceived commercial value [12,24,25].
It has been estimated that half of the world’s fruits and vegetable crops are lost due to postharvest deteriorative reactions [26]. This browning might be a side-effect of fundamental defense responses because, when PPOs are transcriptionally repressed in tomatoes (Lycopersicon esculentum L.), their susceptibility to the P. syringae is increased [23], whereas the overexpression of PPOs reduces the susceptibility to the same pathogen [27].
Apart from tyrosine, PPOs can accept diverse types of both monophenols and o-diphenols as substrates in different species and tissues. The monophenol substrates include, but are not limited to, 4-methylphenol [28], 4-propylphenol [29], 4-tert-butylphenol [30], 4-aminophenol [31], and p-tyrosol [29]. Similarly, o-diphenol substrates include 4-methylcatechol [28], L-3,4-dihydroxyphenylalanine (L-DOPA) [32], 4-tert-butylcatechol [32], 3,4-dihydroxyphenethylamine (dopamine) [29], caffeic acid [29], and 5-caffeoylquinic acid (5CQA; chlorogenic acid) [33]. In C. arabica leaves and the endosperm, the most efficient PPO substrate was found to be 5CQA, followed by 4-methilcatecol, caffeic acid, and catechol [33]. There is evidence that C.arabica cultivars in which leaves have higher concentration of 5CQA are more resistant to Hemileia vastatrix, a pathogen fungus to coffee plants and the causal agent of coffee leaf rust [6]. In addition, the PPO activity is higher in young coffee leaves and decreases with increasing leaf length and age [33,34].
In humans and other animals, L-DOPA is an important precursor of the neurotransmitter dopamine [35,36]. The depletion of dopamine in the human brain causes the neurodegenerative condition called Parkinson’s disease [37]. In humans, dopamine cannot cross the morphological barrier at the blood–brain interface while L-DOPA can [38]. Once L-DOPA enters the central nervous system, it is converted into dopamine by the enzyme DOPA decarboxylase (DDC; EC 4.1.1.28). Due to its capacity to traverse the blood–brain barrier and undergo metabolism by DDC, converting it into dopamine within the brain, L-DOPA serves as the standard treatment for Parkinson’s disease [35].
Plant DDCs are common enzymes that mediate numerous secondary reactions [39]. Nevertheless, the full extension of their biological function in plant growth and development remains unknown. DDC overexpression in apple trees increases both dopamine levels and salt tolerance [39]. This effect may be due to enhanced maintenance of ion homeostasis, which has been verified after dopamine treatment [40]. It has been reported that dopamine can promote nutrient uptake, transport, and distribution, in addition to promoting the downregulation of senescence-related genes [41]. In cucumber, it has been shown to meditate photosynthesis, as well as carbon and nitrogen metabolism, and reduce damage under nitrate stress [42]. Because dopamine can mediate important biological processes in plants, its production by DDC may be of relevance in coffee.
The full phenolic composition of C. arabica remains unknown [43,44]. To investigate potential metabolites, we evaluated the transcriptome profile of multiple C. arabica RNAseq leaves samples that are publicly available at the Sequence Read Archive (SRA) from the National Center for Biotechnology Information (NCBI). Then, we compared the expressed genes with metabolic pathways available at the Kyoto Encyclopedia of Genes and Genomes (KEGG) database [45].
We focused our attention on genes coding for the enzymes PPOs and DDC that are present in multiple copies in the genomes of C. arabica and C. canephora. We used the high-performance liquid chromatography with tandem mass spectrometry (HPLC–MS/MS) technique to show that L-DOPA is a phenolic metabolite that naturally occurs in Coffea leaves and fruits. To our knowledge, L-DOPA has not previously been documented as a naturally occurring phenolic compound in Coffea. Nevertheless, in vitro evidence suggests that a PPO extracted from the coffee endosperm can accept L-DOPA as a substrate, albeit with an activity 25.6 times lower than its preferred substrate, 5CQA [33]. The co-expression of PPO and DDC suggests that dopamine is also present in leaves of those species.
These results show that in silico analysis coupled with analytical chemistry techniques is a powerful combination of toolsets to allow the identification of compounds of economic and pharmacological importance in plants. In addition, these findings may provide additional base to the use of coffee leaves as a source of phenolic metabolites with medicinal, phytotherapeutic, and economic value.

2. Results

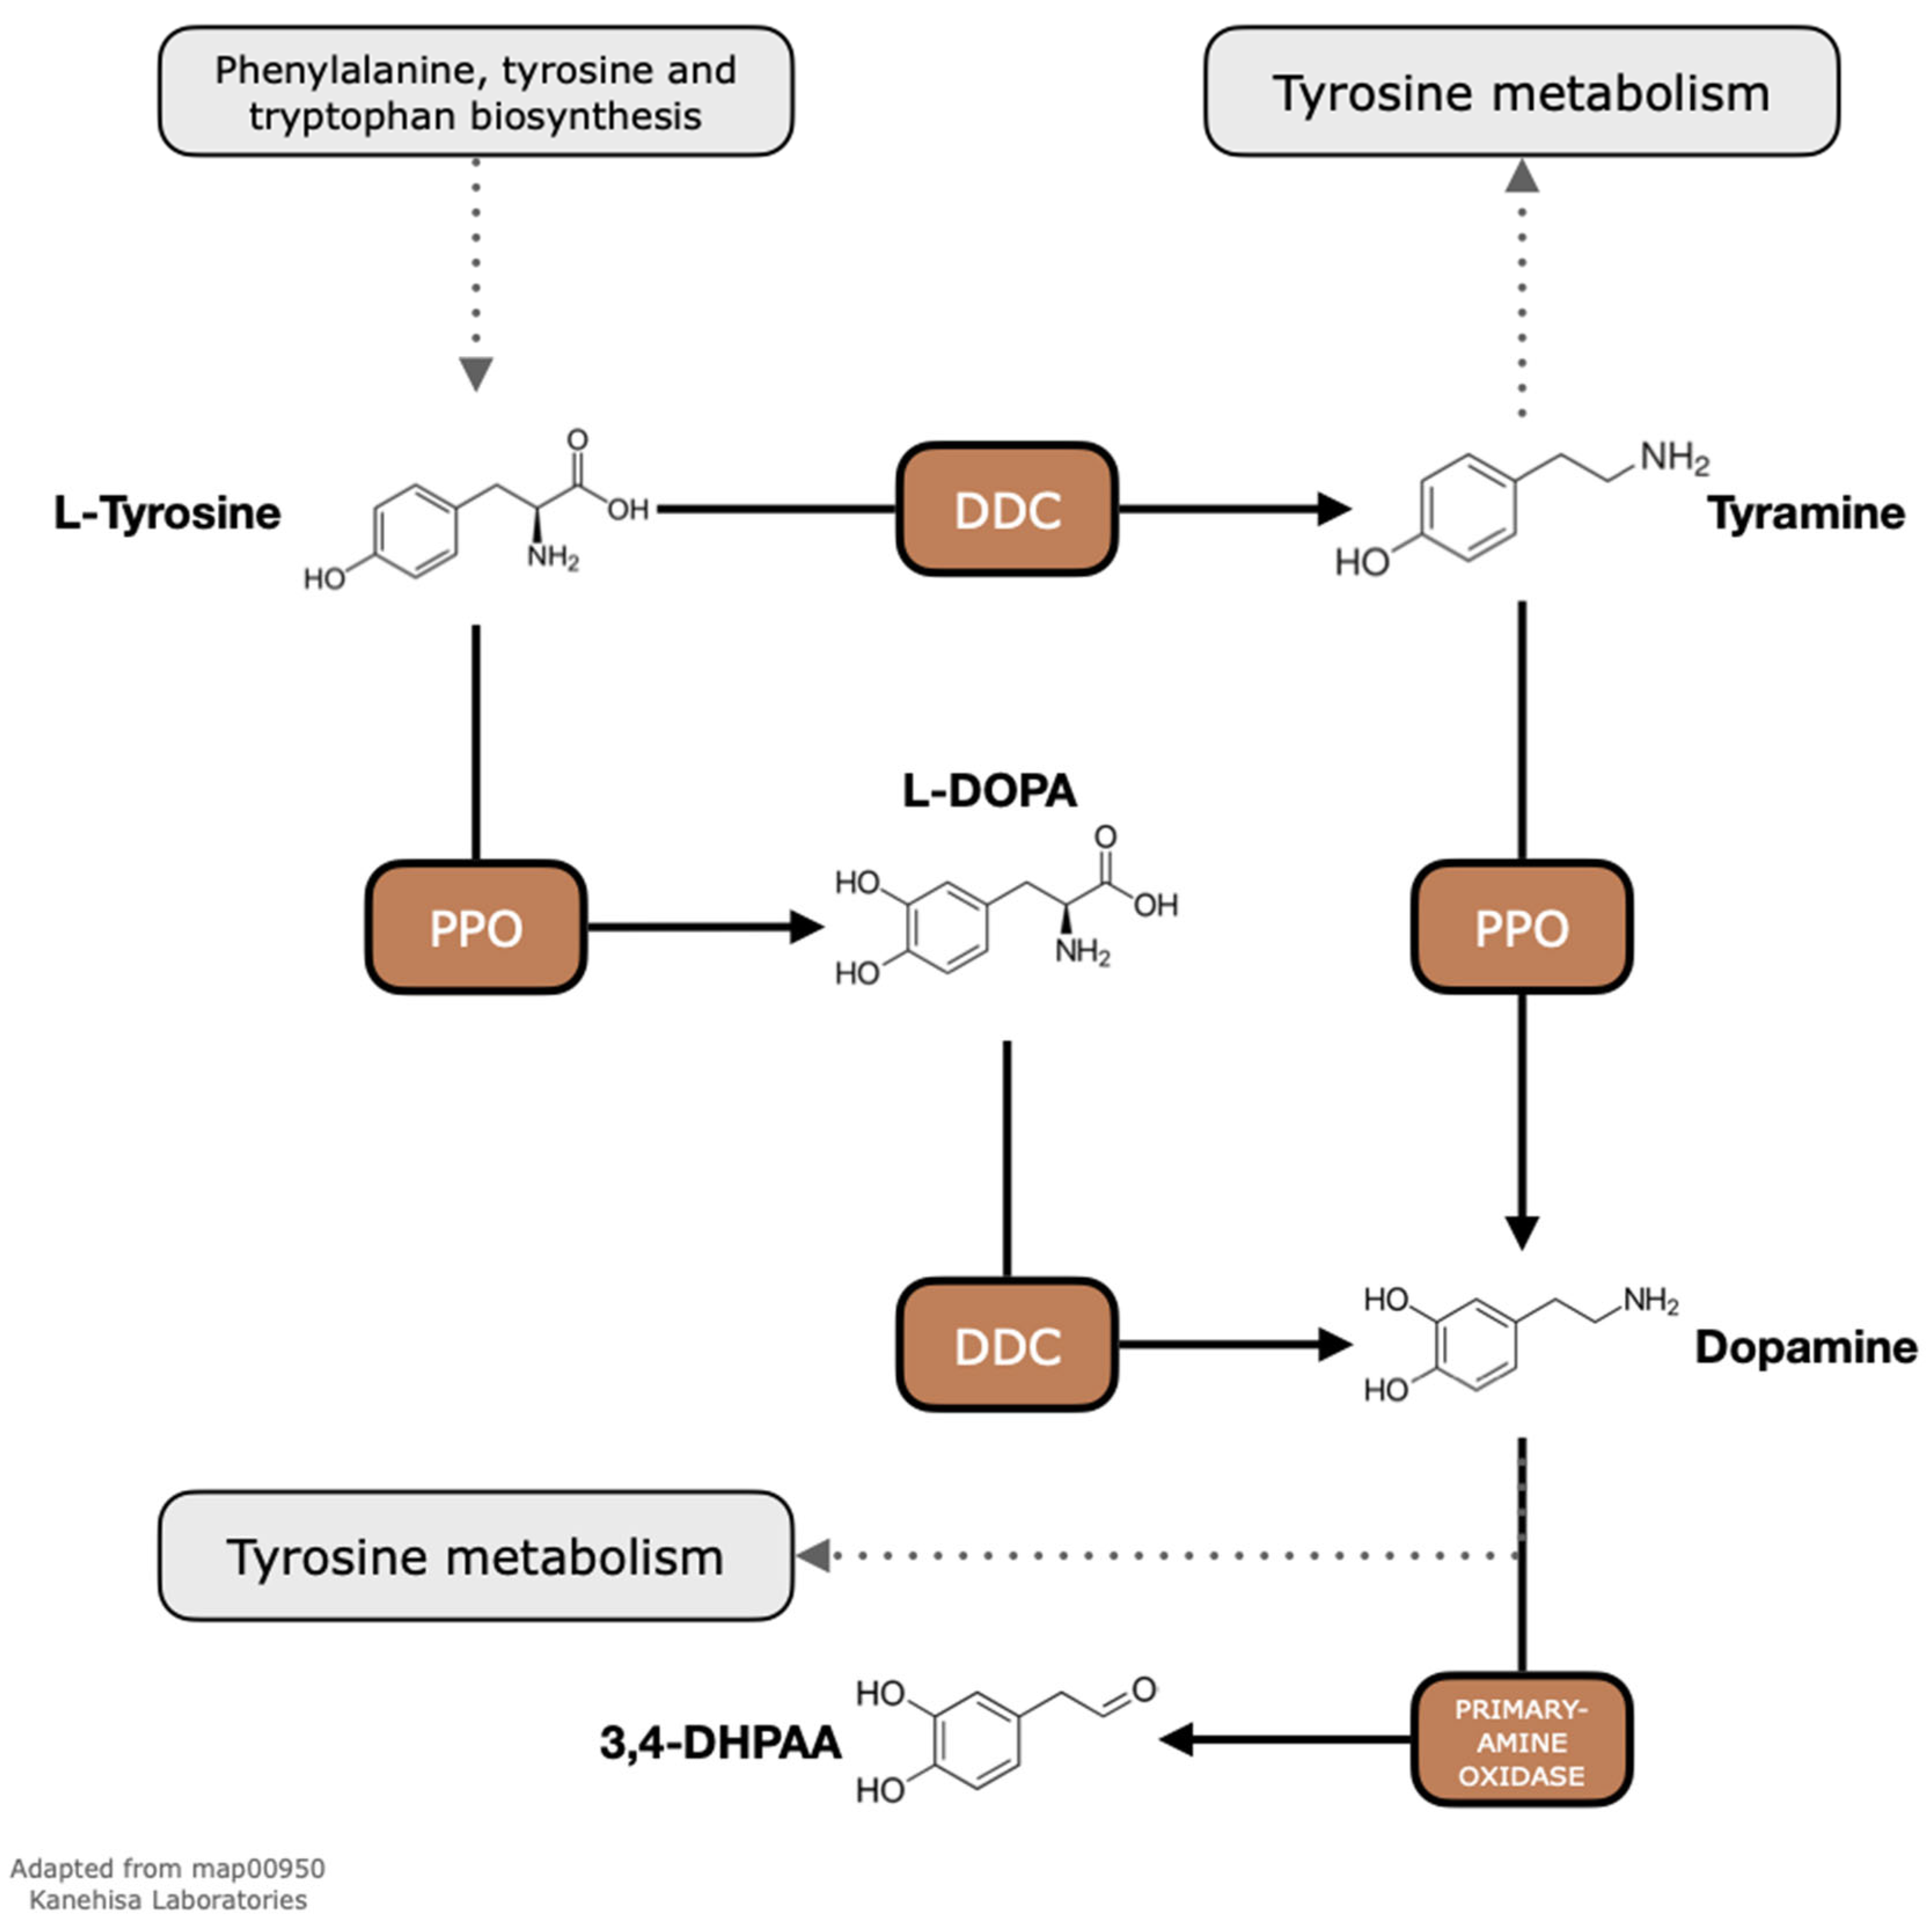
2.1. Exploratory Analyses of Metabolic Pathways Show That PPOs and DDCs Are Present in the Genomes of C. arabica and C. canephora

Our exploratory analyses of metabolic pathways in Coffea revealed important enzymes central for the survival of plants, such as those involved in carbon fixation in photosynthetic organs (Supplementary Figure S1). Among the metabolites predicted to occur along the investigated pathways (Supplementary Figure S2), we focused our attention on L-DOPA, which is a substrate of DDC and a product of PPO (Figure 1).
We found eight PPOs in the C. arabica genome, seven of which were encoded by the C. canephora sub-genome and one of which was encoded by the C. eugenioides sub-genome (Supplementary Table S1). In addition, we found three PPOs in the genome of C. canephora (Supplementary Table S1). All the PPO genes identified in the C. arabica genome were named PPO.CAR followed by a number from 1 to 8, whereas C. canephora PPOs genes were named PPO.CCA followed by a number from 1 to 3. The mean length of Coffea PPOs was 566 amino acids, ranging from 423 (PPO.CCA1) to 584 (PPO.CAR6). Their mean molecular weight was 63,336 g·mol−1 ranging from 48,056 g·mol−1 to 65,183 g·mol−1. Their mean isoelectric point (pI) was 6.28, ranging from 5.55 (PPO.CAR6) to 6.85 (PPO.CAR8).
Regarding DDCs, we found six genomic loci in the C. arabica genome, four of which were encoded by the C. eugenioides sub-genome and two of which were encoded by the C. canephora sub-genome. In addition, we found three DDCs in the genome of C. canephora (Supplementary Table S1). All the DDC genes identified in the C. arabica were named DDC.CAR followed by a number from 1 to 6, whereas C. canephora DDC genes were called DDC.CCA followed by a number from 1 to 3. The mean length of Coffea DDCs was 508 amino acids, ranging from 480 (DDC.CAR6 and DDC.CCA3) to 537 (DDC.CAR2 and DDC.CCA2). Their mean molecular weight was 56,463 g·mol−1, ranging from 53,376 g·mol−1 to 59,696 g·mol−1. Their mean isoelectric point (pI) was 6.08, ranging from 5.77 (DDC.CAR6 and DDC.CA3) to 6.28 (DDC.CAR4).
The phylogeny inference for PPOs recapitulates the evolutionary pattern of angiosperms reported on the Angiosperm Phylogeny Website [46], as shown in Figure 2A. The three main clusters are representing the groups Asterids (containing the orders Solanales, Lamiales, and Gentianales), Rosids (containing the orders Rosales, Fabales, Fagales, Brassicales, and Malvales), and Monocots (containing the orders Arecales, Asparagales, Poales, and Zingiberales). Mostly all Coffea PPOs were clustered within the Asterid group, while a single PPO from C. canephora (PPO.CCA3) and two PPOs from C. arabica (PPO.CAR7 and PPO.CR8) were placed together with the Rosales Trema orientale and Morus notabilis (Figure 2A).
Seven DDC sequences were clustered within the Asterid group, five from C. arabica and two from C. canephora (Figure 2B). A cluster containing two DDCs, one from C. canephora (DDC.CCA3) and the other from C. arabica-subgenome C. canephora (DDC.CAR6), with more than 99% of identity, was placed outside of any of the main phylogenetic clusters, suggesting that these sequences are under evolutionary divergence after a gene duplication event that happened prior to the origin of the C. arabica.
Our expression analysis based on the identified PPOs and DDCs in the C. arabica genome suggests that all PPOs described here were expressed in fully expanded leaves of adult plants (Figure 2C). PPO.CAR1/2/3/4/5 (represented as PPO.CAR1-5 in the heatmap) were a group of highly similar PPOs with more than 98% of sequence identity at the protein level. In addition, these PPO.CAR1-5 displayed higher expression levels in C. arabica leaves when compared to the more distant CAR.PPO6 and the two PPOs clustered within the Rosid group CAR.PPO7/8. Regarding DDCs, only DDC.CAR6 was found to be expressed in C. arabica leaves.

2.2. Chromatographic Analyses

The mean retention time for the L-DOPA standard solution was 3.51 ± 0.41 min (Supplementary Figure S3A). The selectivity was accessed by adding the standard solution to samples without L-DOPA. The fortified solutions were prepared by adding L-DOPA in two concentrations (50 and 100 µg·mL−1). Then, the fortified samples were compared to control samples without L-DOPA in the HPLC runs. By doing so, we were able to observe that the separation had no interference from the matrix in the identification of L-DOPA (Supplementary Figure S3B). The correlation coefficient (R2), detection limit (DL), quantification limit (QL), precision (CV), and accuracy (recovery) are presented in Table 1.
The measured R-squared (R2) value for L-DOPA in Coffee leaves was 0.99998 using HPLC. This is evidence of a strong linear correlation between L-DOPA concentration and peak area, as R2 values above 0.99 are widely accepted as indicators of linear relationships between chemical compound concentrations and their HPLC signal [48,49]. This can be observed in the calibration curve for the quantification of L-DOPA in human plasma using a similar approach which presented an R2 > 0.99 [50].
Using LC–MS/MS with multiple reaction monitoring (MRM), we were able to ascertain that the peak around 3.7 min of acquisition time was indeed L-DOPA, which is naturally synthesized by C. arabica fully expanded leaves and fruits (Table 2). This is because, at this specific time, we could identify all three reported transitions that are characteristic of L-DOPA [51,52,53]. In addition, L-DOPA was also found in C. canephora fully expanded leaves (Figure 3 and Supplementary Dataset S1). In both species, L-DOPA could not be verified in flowers because the LC–MS/MS signal was indistinguishable from the background noise. For this same reason, we could not verify the occurrence of L-DOPA in C. canephora fruits.

3. Discussion

Coffee leaves are byproducts of coffee culture that, in comparison to coffee beans, are mostly disregarded in studies concerning their chemical constituents [6,54,55]. However, the available studies reveal that coffee plants are rich in bioactive compounds such as echinoids, flavonoids, xanthones, and caffein [10]. Additionally, the potential of coffee and its derivatives, including tea, as excellent functional beverages has been recognized, with a history of traditional consumption spanning over 200 years in coffee-growing regions by local communities [54]. To further investigate the potential compounds in fully expanded coffee leaves, we applied a series of in silico analyses to infer metabolic pathways that may be active. Then, we selected a portion of the isoquinoline alkaloid biosynthesis pathway according to the KEGG [45] representation (map00950) which involves the enzymes PPO (EC 1.14.18.1, EC 1.10.3.1) and DDCs (EC 4.1.1.28—Figure 1). Lastly, we investigated the occurrence of the L-DOPA compound using HPLC and LC–MS/MS techniques.

3.1. Multiple PPO Copies Are Present in C. arabica and C. canephora Genomes

Multiple sequence alignment of PPOs showed that all coffee PPOs identified in this study were similar regarding their primary structure and presented the expected conserved domains (PF00264, PF12142, and PF12143) in the same order and positions in comparison to other functional plant PPOs. In addition, 10 out 11 coffee PPOs possessed a chloroplast transport signal peptide between amino acids 1 and 40 (Supplementary Figure S4A). It is well documented that many plant PPOs have this N-terminal domain containing a thylakoid transfer signal peptide to allow translocation through the chloroplast [56].
Only a PPO from C. canephora, named PPO.CCA1, did not present this signal peptide. It is not clear to us if this region was indeed absent in this locus, meaning that this specific PPO occurs outside the chloroplast, or if the predicted transcription start site was, in fact, upstream of the actual reported coordinates. Functional non-chloroplastic plant PPOs have been verified for poplar [57] and snapdragon [58] and are predicted to occur in monocots, such as rice and maize, and eudicots such as columbine [17]. The discovery of non-plastidic PPOs can help in the discovery of additional roles for PPOs in plants [17].
The PPO C-terminal domain PF12143 (whose PFAM description refers to as “unknown function domain; DUF_B2219”) is well conserved in all coffee PPOs. This domain is sometimes regarded to be a blocking-device for the active site via a placeholder residue. Nevertheless, this gatekeeping system is not functional in many plants, with Malus domestica and S. lycopersicum [29] being exceptions. On the other hand, this C-terminal domain is lacking in species such as Vitis vinifera [59]. It is believed that the C-terminal domain is a functional copper transporter system that works prior to a proteolytic cleavage [60].
The number of PPOs in plant genomes varies due to lineage-specific duplications, expansion, or loss [17]. Arabidopsis, a Malvidae, does not encode PPOs, whereas Carica papaya, also a Malvidae, encodes four PPOs [17]. Meanwhile, Glycine max and Populus trichocarpa genomes encode 11 PPOs. We found three PPOs in the C. canephora genome that may have originally arisen due to the ancestral whole-genome triplication event of eudicots [61,62]. Interestingly, we found eight PPOs in the C. arabica genome, with seven of them being located in the sub-genome derived from the ancestral parent C. canephora and one from the ancestral parent C. eugenioides.
The reason for the disparity in the number of PPOs between the C. arabica sub-genomes and the genome of current C. canephora plants remains unclear. This difference could be attributed to events that took place prior to the origin of C. arabica, possibly within the respective lineages of its parent progenitors. In this manner, it is plausible that the ancestors of C. canephora retained duplicated PPO loci as a result of dosage sensitivity gene balancing [63]. Later, this trait was kept in C. arabica.

3.2. Multiple PPO Copies Are Expressed in C. arabica Leaves

RNAseq expression analysis showed that fully expanded C. arabica leaves constitutively transcribed PPOs (Figure 2C). However, due to the high similarity of PPOs at the coding sequence level, the determination of which PPO loci were producing transcripts is not possible with current similarity-based bioinformatic approaches. For example, PPO.CAR1 and PPO.CAR2 were 100% identical throughout their length of 1734 nucleotides. In addition, PPO.CAR3, 4 and 5, all having the same length of 1734 nucleotides, were more than 98% similar to PPO.CAR1/2. For that reason, when transcript fragments from NGS were mapped to them, the algorithms could not discern if all loci were being expressed or just a subset of them.
These five remarkably similar PPOs were distinct loci located on chromosome 5, originating from the parental ancestral C. canephora (Supplementary Dataset S2). They were all single exon genes positioned closely together, strongly indicating their recent emergence from a local gene duplication event. PPO.CAR6 was also located on chromosome 5 originating from the parental ancestral C. canephora; its protein had a similarity of 96.75% to a PPO in chromosome 5 of the currently living C. canephora plants and was also expressed in fully expanded leaves (Figure 2C). Lastly, CAR.PPO7 and CAR.PPO8 were 98.79% similar to each other but only ~50% similar to other PPOs in C. arabica. This may be the reason why they were clustered outside the Rosid group in Figure 2A. The PPO.CAR7 locus was located on chromosome 2 and originated from the parental ancestral C. canephora, whereas PPO.CAR8 was the only locus encoded in the sub-genome originating from the ancestral parent C. eugenioides. Additionally, PPO.CAR8 was also situated on chromosome 2 of its sub-genome.

3.3. Multiple DDC Copies Are Present in C. arabica and C. canephora Genomes but Only One Copy Is Expressed in C. arabica Fully Expanded Leaves

Multiple sequence alignment of DDCs showed that all coffee DDCs were similar regarding their primary structure and presented the expected pyridoxal-dependent decarboxylase conserved domain (Pyridoxal_deC—PF00282) in the middle section of these sequences (Supplementary Figure S4B). This domain occupied approximately 60% to 70% of the length of all DDCs evaluated, and it was the only conserved domain characteristic of DDCs.
In C. arabica, we found four DDCs encoded by the C. eugenioides sub-genome (two on chromosome 11e, one on chromosome 1e, and another on chromosome 9e) and two encoded by the C. canephora sub-genome (both close to each other on chromosome 9c). Similarly, the genome of the currently living C. canephora presented three DDCs, with one located on chromosome 1 and two organized in tandem on chromosome 9. Interestingly, all but two coffee DDCs, one from C. arabica DDC.CAR6 and other from C. canephora DDC.CCA3, were single-exon genes. These multi-exon DDCs were on chromosome 1 of their respective genomes, and they were the most divergent coffee DDCs in our phylogenetic analysis (Figure 2B and Supplementary Dataset S2).
The identity among the multi-exon DDCs, DDC.CCA3, and DDC.CAR6 was 99% throughout their protein length of 480 amino acids. DDC.CAR6 from C. arabica was on the sense (+) strand on its genome, whereas DDC.CCA3 from C. canephora genome was on the antisense (−) strand. In addition, these multi-exon DDCs were shorter and presented only ~55% of identity to other DDCs in coffee. The expression of DDC in C. arabica leaves was only verified for DDC.CAR6 (Figure 2C). It is not clear if this DDC preferentially catalyzes the conversion of L-tyrosine to tyramine or L-DOPA to dopamine. It is also possible that these enzymes catalyze different reactions. Some DDCs seem to be exclusively found in coffee because our phylogenetic inferences clustered the DDC CAR6 and CCA3 outside of any higher plant group evaluated in this study (Figure 2B). Lastly, the apparently silenced DDC 1–5 in leaves may be active in other leaves under a different set of environmental conditions.

3.4. Chromatography Analyses Confirmed the Presence of L-DOPA in Coffee Leaves and Fruits

The technical DL and QL for our chromatography analysis were 0.81 and 2.73 µg·mL−1, respectively, for L-DOPA in coffee extracts. Both values were above the reports for human plasma, DL of 0.025 and QL of 0.1 μg/mL [50]. On the other hand, Pavón-Pérez et al. (2019) [64] reported a DL of 0.01 mg·L−1 and a QL of 0.05 mg·L−1 using LC–MS/MS on Vicia faba extracts. Meanwhile, the reported QL for L-DOPA in rat plasma was 25.0 ng/mL [52], which is higher than our findings. The differences found in these parameters may arise from differences in the studied matrices and in the chromatographic conditions, such as in the equipment and/or methodologies used for detection and quantification.
Our recovery assays to determine the accuracy of the technique returned average values ranging from 81% to 104% (with CV ranging from 0.38% to 1.11%). Those values are within the analytical acceptance range of 70% to 120% with ±20% precision (CV) [65]. On the basis of the results found in this study regarding the recovery values for the L-DOPA compound, we propose that the applied method showed satisfactorily good recovery. Our findings are in accordance with other studies that reported recovery yields of 94% to 117% (relative standard deviation of ≤5.66) [64], 98% to 106% (CV ≤ 15%) [50]. In addition, our recovery was higher than the values reported for the quantitation of L-DOPA in rat plasma by HPLC–UV/Vis in which values ranged from 46.5% to 50.1% (CV ≤ 10.3%) [52]. Our methodology presented a CV ranging from 0.38% to 1.11%. In this work, the CV value was below 5%, which is the precision lower limit for compounds found in low concentrations in biological extracts [48,49,65].
Although the samples of fully expanded leaves from C. arabica and C. canephora and fruits from C. arabica presented analytical signals below 50 μa, it was possible to confirm the presence of L-DOPA in those organs (Figure 3). In addition, the presence of higher-intensity interference in the MRM transition 198 > 152 is notable since the choice of mass transitions in MRM mode allows analysis in qualitative (confirmatory) mode. Lastly, this specific transition may suggest the decarboxylation of L-DOPA at C9, resulting in the production of dopamine.

4. Material and Methods

4.1. Identification of Enzyme-Coding Genes in Coffee Genome and Inference of Metabolic Pathways

A total of 25,605 predicted protein sequences in C. canephora were downloaded from the Coffee genome hub [61]. Then, they were analyzed with the blast2GO [66] suite to search for potential enzymes and their respective enzyme codes (ECs). We used the resulting list of 1141 nonredundant ECs through the online KEGG mapper tool [45] to find metabolic pathways that were possibly active in Coffea. As part of our comprehensive search, we incorporated the following reference KEGG pathway map databases: carbohydrate metabolism (1.1), energy metabolism (1.2), lipid metabolism (1.3), amino-acid metabolism (1.5), metabolism of cofactors and vitamins (1.8), metabolism of terpenoids and polyketides (1.9), and biosynthesis of secondary metabolites (1.10).

4.2. Characterization of PPO- and DDC-Coding Genes in Coffea

The genome sequence of the C. arabica Caturra-red cultivar was retrieved from the NCBI under BioProject accession PRJNA506972 [67]. Then, we predicted protein coding genes using AUGUSTUS v. 3.3.3 [68]. The annotation of protein coding genes was performed using blast2GO [66]. Sequences with the enzymatic code for PPOs (EC 1.14.18.1 and EC 1.10.3.1) and DDC (EC 4.1.1.28) where selected from both C. arabica and C. canephora, and conserved domain analyses were performed using hidden Markov models by aligning the selected protein sequences against the Pfam domain database v35 [69] with the HMMER software v3.3.2 [69]. Finally, the respective coding sequences for each putative PPO and DDC were aligned to the NCBI nonredundant (nr) protein database using blastx v 2.12.0+ [70].
We considered coffee PPOs those protein sequences (1) that presented significant hits to the three typical plant PPO domains in the following amino-carboxyl order: tyrosinase (PF00264), polyphenol oxidase middle domain (PPO1_DWL; PF12142), and PPO1_KFDV (PF12143), (2) with at least 70% of length coverage and 50% of identity to the 3D-chistolograph verified PPO structure from Ipomoea batatas (UniProtKB/Swiss-Prot: Q9MB14.2) [71], and (3) with the five blastx top-hits of known plant PPOs. In addition, we considered the coffee DDC homologs those protein sequences (1) that presented significant hits to the pyridoxal-dependent decarboxylase conserved domain (PF00282.22), (2) with at least 70% of coverage and 50% of identity to the curated DDC from Papaver somniferum (UniProtKB/Swiss-Prot: P54768), and (3) with the five blastx top-hits of known plants DDC, not including the highly similar proteins L-tryptophan decarboxylase (TDC2-like). Then, their physicochemical properties (length of amino-acid sequence, molecular weight, and isoelectric point) were determined with the ExPASy Proteomics tool (https://web.expasy.org/protparam/ accessed on 27 August 2022).

4.3. Phylogenetic Analysis

Representative protein sequences for PPOs and DDC were retrieved from NCBI’s nr database for the following taxa: Amborellales, Arecales, Asparagales, Asterales, Brassicales, Cannabaceae, Cucurbitales, Fabales, Gentianales, Ginkgoales, Lamiales, Liliales, Lycophytes, Malpighiales, Malvaceae, Poales, Ranunculales, Rosales, Solanales, Vitales, and Zingiberales. A tyrosinase from Homo sapiens (GenBank accession AAA61244.1) was used as an outgroup for plant PPOs, and a human DDC (NCBI accession: NP_000781.2) was used as an outgroup for plant DDC. The selected plant species represents diverse phylogenetic groups of higher plants. To this subset of PPOs or DDCs, we added the respective homologs from C. arabica and C. canephora.
The multiple protein sequence alignment was performed with MAFFT v. 7.505 using the iterative refinement method incorporating global pairwise alignment information (G-INS-i) [72,73]. For inferring phylogenetic relationships, coffee sequences with more than 98% of identity at the protein level were collapsed into a single representative sequence. Phylogenetic trees were inferred with PHYLIP [74] v. 3.696 with 1000 bootstrap replicates, using the Jones–Taylor–Thornton substitution model [75] and neighbor-joining clustering method [76]. The consensus tree was chosen by the majority rule and drawn using the Interactive Tree of Life (iTOL v. 6.5.8) webtool [47]. Transfer signal peptides were inferred with the online tool LOCALIZER v. 1.0.4 [77].

4.4. Expression Evaluation of PPOs and DDCs

To identify expressed PPOs and DDCs in C. arabica leaves, we downloaded paired-end RNAseq libraries available at the SRA of the NCBI under bioproject ID PRJNA851465 [78]. In summary, the experiment was conducted in Brazilian farms of two cities (Pirapora and Varginha) during two harvest times (April and October) and with two C. arabica cultivars (Acauã and Catuaí Vermelho IAC 144). After quality assessment steps, the RNAseq reads were mapped to the C. arabica reference genome (BioProject accession PRJNA506972 [67]) using the STAR aligner v. 2.7.8 [79]. Then, fragments mapped to gene exons were quantified with the HTseq-count script [80] and analyzed with edgeR [81]; an expression-based heatmap was produced with the heatmap.2 function from gplot package [82].

4.5. Extraction of L-DOPA from C. arabica Leaves

The extraction procedure was based on a sustainable, simple, and robust method for L-DOPA extraction recently developed for Vicia faba [83]. We collected C. arabica leaves and immediately macerated them with liquid nitrogen until a fine and homogeneous powder was produced. Samples of 200 mg were collected in 15 mL tubes with 5 mL of acetic acid 0.1%. Then, we homogenized samples for 20 min with a magnetic shaker and subsequently centrifuged at 13,000 rpm for 10 min at room temperature (±25 °C). Next, we collected the supernatants, and a second extraction step was performed with the remaining biomass. Lastly, we mixed and filtered both supernatants in a membrane and immediately submitted them to chromatographic analysis.

4.6. Liquid Chromatographic Analysis and Validation Parameters

The analyses were performed at the Brazilian National Institute of Coffee Science and Technology (Instituto Nacional de Ciência e Tecnologia do Café; INCT-Café) at the Federal University of Lavras (Universidade Federal de Lavras; UFLA). The liquid chromatographic runs were performed with a Shimadzu HPLC equipment composed of a high-pressure quaternary pump model LC-20AT, a degasser DGU-20A5, an interface CBM-20A, an automatic injector SIL-20A-HT, and a UV/Vis detector SPD-20A. The used column was a Zorbax Eclipse XDB-C18 (4.6 × 250 mm, 5 µm) connected to an XDB-C18 pre-column (4.6 × 12.5 mm, 5 µm).
The L-DOPA analysis was performed using the methodology proposed by Elbarbry et al. (2019) [50] with modifications. L-DOPA standard was purchased from Sigma-Aldrich (St. Louis, MO, USA). Mobile-phase chemicals were all of HPLC analytical grade: methanol (Merck), glacial acetic acid (J.T.Baker), and type I water from a Milli-Q system.
We used the external standardization method to apply quantification procedures. For the analytical curves, we diluted a stock solution with the L-DOPA standard in perchloric acid (1000 µg·mL−1). From that stock solution, we prepared the analytical curve by varying the concentration from 0.1 to 200 µg·mL−1. The selected mobile phase for the compound elution was acetic acid 1% in water (Solvent A) and methanol (Solvent B) at a ratio of 95:5 (v/v) and a flow rate of 1.0 mL·min−1. We eluted samples and standards in isocratic mode at 30 °C in the column oven. The used light wavelength was 282 nm, and the injection volume was 20 µL.
We filtered the biological samples and standard solutions in a 0.45 µm polyethylene membrane (Millipore) and injected them directly into the chromatographic system. The injections of the standards and biological samples were performed in triplicate, with the analyte identity confirmed by the retention time and the peak profile of the sample compared to that of the standard solution.
To ensure the analytical quality of the results, we evaluated multiple parameters such as selectivity, linearity, detection limit (DL), quantification limit (QL), precision (in terms of coefficient of variation, CV), and accuracy (recovery). All the procedures required to evaluate those parameters were performed to guarantee the standardization of the method [48,49,65]. Firstly, we evaluated the selectivity by adding to a pool of samples in different quantities of the L-DOPA standard. Then, we evaluated the linearity by inferring the linear regression equation and Its respective correlation coefficient (R2). An R2 greater than 0.99 was considered as evidence of an ideal fit of the data to the model.
To verify the ascertainment of detection (DL) and quantification (QL) limits, we considered the parameters related to the selectivity linear regression curve. To this end, we applied the following equations: DL = 3 × (s/S) and QL =10 × (s/S), where s is the standard deviation estimate of the linear regression model, and S is its slope.
The precision was calculated using the intermediate precision method. To do so, we repeated the HPLC analysis for 5 days by evaluating the readings of standard solutions with three known concentrations (1.0, 50.0, and 100.0 µg·mL−1). At the end, the coefficient of variation (CV), expressed as a percentage, was calculated with the function CV = (s/DMC) × 100, where s is the estimated standard deviation, and DMC is the determined mean concentration.
Lastly, we evaluated the accuracy by running recovery assays using three random samples fortified with standard solutions at three concentration levels (1.0, 50.0, and 100.0 µg mL−1). The recovery, expressed as a percentage of L-DOPA, was determined using the following equation: recovery = [(measured concentration)/(expected concentration)] × 100.

4.7. LC–MS/MS for Qualitative Analyses

To verify the occurrence of L-DOPA in Coffea, sample extracts in triplicate from C. arabica and C. canephora leaves, flowers, and fruits were analyzed by LC–MS/MS. Those analyses were performed in an Agilent Technologies system consisting of a binary pump, a degassing unit, a G4226A autosampler, a column oven, and a triple-quadrupole mass spectrometer (QqQ G6420A). The system was controlled by MassHunter Workstation Software (Version B.08.00). The separation was carried out on Zorbax Eclipse XDB-C18, 4.6 × 250 mm × 5 µm, thermostated at 30 °C, using a mobile phase composed of acetic acid 1% in water (Solvent A) and methanol (Solvent B) at a ratio of 95:5 (v/v) and a flow rate of 1.0 mL·min−1. Full scan spectra were acquired from m/z 10 to 500. Identification of L-DOPA was performed in multiple reaction monitoring (MRM) mode, detecting the following transitions: m/z 198 → m/z 152, m/z 198 → m/z 107, and m/z 198 → m/z 135 [51,52,53].

5. Conclusions

Our in silico analysis revealed that the C. arabica genome contains multiple copies of PPOs and DDCs, with some of these genes being expressed in fully expanded leaves. Notably, L-DOPA, one of the products of the PPO enzyme, was detected in both C. arabica and C. canephora leaves. This finding suggests that L-DOPA in fully expanded leaves could potentially play a role in promoting defensive mechanisms against pathogens, possibly involving its conversion to dopamine by DDCs. The presence of dopamine as a naturally occurring metabolite in coffee leaves may be indicative of a mechanism to alleviate nutrient deficiency-induced stresses [42].
Future research endeavors are needed to comprehensively unveil the significance of L-DOPA, PPOs, and DDCs in the context of coffee. It is possible that younger leaves could exhibit elevated L-DOPA concentrations, considering the potential higher PPO activity found in those leaves. Further investigations will shed light on the precise roles and importance of these components in coffee plants [33,34]. Additionally, different coffee varieties or wild C. species may be an enhanced source of L-DOPA. This work advances toward the purpose of using coffee leaves as a source of compounds with nutraceutical importance. Lastly, we demonstrated that in silico analysis is an effective tool to predict metabolic pathways, whose intermediate compounds can be verified using in vitro approaches such HPLC and related techniques. Employing the same in silico approach, we discovered additional potential pathways that could serve as valuable guides for in vitro studies, helping to uncover essential metabolites in coffee.

Supplementary Materials

The supporting information can be downloaded at https://www.mdpi.com/article/10.3390/ijms241512466/s1.

Author Contributions

T.H.C.R., R.R.d.O. and A.C.-J. conceptualized the project; R.R.d.O., T.T.d.N., W.D.S., A.A.S. and M.L.V.d.R. conceptualized and designed the experiments; T.T.d.N., W.D.S. and B.L.M. performed the experiments; T.H.C.R. analyzed the data; T.H.C.R. wrote the manuscript. All authors have read and agreed to the published version of the manuscript.

Funding

Financial support was provided by the Brazilian National Institute of Science and Technology for Coffee, Minas Gerais State Foundation of Support to Research, and the Brazilian National Council for Scientific and Technological Development.

Institutional Review Board Statement

Not applicable.

Informed Consent Statement

Not applicable.

Data Availability Statement

The codes are available at https://github.com/thalescherubino/thesisChapter2/. GenBank IDs for homologous proteins are available in Supplementary Table S2.

Acknowledgments

The authors thank Blake C. Meyers for taking the time to review the manuscript and provide valuable feedback; the members of the Laboratory of Plant Molecular Physiology (LFMP, UFLA/Brazil) for structural support of the experiments; the Agency for the Support and Evaluation of Graduate Education (CAPES), the National Institute of Science and Technology for Coffee (INCT-Café). Financial support from the Brazilian founding agencies including the National Council for Scientific and Technological Development (CNPq grant number 309005/2022-1, and grant #2021/06968-3), and the Foundation for Research Assistance of the Minas Gerais State (FAPEMIG, Grant APQ-01184-17 and CAP APQ 03605/17).

Conflicts of Interest

The authors declare no conflict of interest.

Abbreviations

5CQA: chlorogenic acid, AUS: AURONE SYNTHASE, CO: CATECHOL OXIDASE, CV: coefficient of variation, DDC: DOPA DECARBOXYLASE, DDC.CAR: DOPA DECARBOXYLASE genes in Coffea arabica, DDC.CCA: DOPA DECARBOXYLASE genes in Coffea canephora, DL: detection limit, DMC: determined mean concentration, EC: enzyme commission number, HPLC: high-performance liquid chromatography, HPLC–MS/MS: high-performance liquid chromatography with tandem mass spectrometry, pI: isoelectric point, KEGG: Kyoto Encyclopedia of Genes and Genomes, L-DOPA: L-3,4-dihydroxyphenylalanine-levodopa, MRM: multiple reaction monitoring, NCBI: National Center for Biotechnology Information, PPO: POLYPHENOL OXIDASES, PFAM: Protein Families Database, PPO.CAR: POLYPHENOL OXIDASE genes in Coffea arabica, PPO.CCA: POLYPHENOL OXIDASE genes in Coffea canephora, QL: quantification limit, R2: correlation coefficient, RNAseq: next-generation RNA sequencing, s: standard deviation, SRA: Sequence Read Archive, TYR: L-tyrosine.

References

  1. International Coffee Organization—Trade Statistics Tables. Available online: https://www.ico.org/trade_statistics.asp (accessed on 22 August 2022).
  2. Pham, Y.; Reardon-Smith, K.; Mushtaq, S.; Cockfield, G. The Impact of Climate Change and Variability on Coffee Production: A Systematic Review. Clim. Chang. 2019, 156, 609–630. [Google Scholar] [CrossRef]
  3. Lashermes, P.; Combes, M.-C.; Robert, J.; Trouslot, P.; D’Hont, A.; Anthony, F.; Charrier, A. Molecular Characterisation and Origin of the Coffea arabica L. Genome. Mol. Gen. Genet. MGG 1999, 261, 259–266. [Google Scholar] [CrossRef] [PubMed]
  4. Bertrand, B.; Bardil, A.; Baraille, H.; Dussert, S.; Doulbeau, S.; Dubois, E.; Severac, D.; Dereeper, A.; Etienne, H. The Greater Phenotypic Homeostasis of the Allopolyploid Coffea arabica Improved the Transcriptional Homeostasis over That of Both Diploid Parents. Plant Cell Physiol. 2015, 56, 2035–2051. [Google Scholar] [CrossRef] [PubMed] [Green Version]
  5. Vidal, R.O.; Mondego, J.M.C.; Pot, D.; Ambrósio, A.B.; Andrade, A.C.; Pereira, L.F.P.; Colombo, C.A.; Vieira, L.G.E.; Carazzolle, M.F.; Pereira, G.A.G. A High-Throughput Data Mining of Single Nucleotide Polymorphisms in Coffea Species Expressed Sequence Tags Suggests Differential Homeologous Gene Expression in the Allotetraploid Coffea arabica. Plant Physiol. 2010, 154, 1053–1066. [Google Scholar] [CrossRef] [Green Version]
  6. Silva, F.L.F.; Nascimento, G.O.; Lopes, G.S.; Matos, W.O.; Cunha, R.L.; Malta, M.R.; Liska, G.R.; Owen, R.W.; Trevisan, M.T.S. The Concentration of Polyphenolic Compounds and Trace Elements in the Coffea arabica Leaves: Potential Chemometric Pattern Recognition of Coffee Leaf Rust Resistance. Food Res. Int. 2020, 134, 109221. [Google Scholar] [CrossRef] [PubMed]
  7. Monteiro, Â.; Colomban, S.; Azinheira, H.G.; Guerra-Guimarães, L.; Do Céu Silva, M.; Navarini, L.; Resmini, M. Dietary Antioxidants in Coffee Leaves: Impact of Botanical Origin and Maturity on Chlorogenic Acids and Xanthones. Antioxidants 2019, 9, 6. [Google Scholar] [CrossRef] [Green Version]
  8. Ashihara, H.; Monteiro, A.M.; Gillies, F.M.; Crozier, A. Biosynthesis of Caffeine in Leaves of Coffee. Plant Physiol. 1996, 111, 747–753. [Google Scholar] [CrossRef] [Green Version]
  9. Campa, C.; Mondolot, L.; Rakotondravao, A.; Bidel, L.P.R.; Gargadennec, A.; Couturon, E.; La Fisca, P.; Rakotomalala, J.-J.; Jay-Allemand, C.; Davis, A.P. A Survey of Mangiferin and Hydroxycinnamic Acid Ester Accumulation in Coffee (Coffea) Leaves: Biological Implications and Uses. Ann. Bot. 2012, 110, 595–613. [Google Scholar] [CrossRef] [Green Version]
  10. de Almeida, R.F.; Trevisan, M.T.S.; Thomaziello, R.A.; Breuer, A.; Klika, K.D.; Ulrich, C.M.; Owen, R.W. Nutraceutical Compounds: Echinoids, Flavonoids, Xanthones and Caffeine Identified and Quantitated in the Leaves of Coffea arabica Trees from Three Regions of Brazil. Food Res. Int. 2019, 115, 493–503. [Google Scholar] [CrossRef]
  11. Molitor, C.; Mauracher, S.G.; Pargan, S.; Mayer, R.L.; Halbwirth, H.; Rompel, A. Latent and Active Aurone Synthase from Petals of C. Grandiflora: A Polyphenol Oxidase with Unique Characteristics. Planta 2015, 242, 519–537. [Google Scholar] [CrossRef] [Green Version]
  12. Mayer, A.M.; Harel, E. Polyphenol Oxidases in Plants. Phytochemistry 1979, 18, 193–215. [Google Scholar] [CrossRef]
  13. Goldfeder, M.; Kanteev, M.; Isaschar-Ovdat, S.; Adir, N.; Fishman, A. Determination of Tyrosinase Substrate-Binding Modes Reveals Mechanistic Differences between Type-3 Copper Proteins. Nat. Commun. 2014, 5, 4505. [Google Scholar] [CrossRef] [PubMed] [Green Version]
  14. Mauracher, S.G.; Molitor, C.; Michael, C.; Kragl, M.; Rizzi, A.; Rompel, A. High Level Protein-Purification Allows the Unambiguous Polypeptide Determination of Latent Isoform PPO4 of Mushroom Tyrosinase. Phytochemistry 2014, 99, 14–25. [Google Scholar] [CrossRef] [PubMed] [Green Version]
  15. Kim, H.; Yeon, Y.J.; Choi, Y.R.; Song, W.; Pack, S.P.; Choi, Y.S. A Cold-Adapted Tyrosinase with an Abnormally High Monophenolase/Diphenolase Activity Ratio Originating from the Marine Archaeon Candidatus Nitrosopumilus Koreensis. Biotechnol. Lett. 2016, 38, 1535–1542. [Google Scholar] [CrossRef]
  16. Mayer, A.M. Polyphenol Oxidases in Plants and Fungi: Going Places? A Review. Phytochemistry 2006, 67, 2318–2331. [Google Scholar] [CrossRef] [PubMed]
  17. Tran, L.T.; Taylor, J.S.; Constabel, C.P. The Polyphenol Oxidase Gene Family in Land Plants: Lineage-Specific Duplication and Expansion. BMC Genom. 2012, 13, 395. [Google Scholar] [CrossRef] [Green Version]
  18. Lai, X.; Soler-Lopez, M.; Wichers, H.J.; Dijkstra, B.W. Large-scale recombinant expression and purification of human tyrosinase suitable for structural studies. PLoS ONE 2016, 11, e0161697. [Google Scholar] [CrossRef] [PubMed]
  19. Fernández, E.; Sanchez-Amat, A.; Solano, F. Location and Catalytic Characteristics of a Multipotent Bacterial Polyphenol Oxidase. Pigment Cell Res. 1999, 12, 331–339. [Google Scholar] [CrossRef]
  20. Solano, F. Melanins: Skin Pigments and Much More—Types, Structural Models, Biological Functions, and Formation Routes. New J. Sci. 2014, 2014, e498276. [Google Scholar] [CrossRef] [Green Version]
  21. Sánchez-Ferrer, Á.; Neptuno Rodríguez-López, J.; García-Cánovas, F.; García-Carmona, F. Tyrosinase: A Comprehensive Review of Its Mechanism. Biochim. Biophys. Acta BBA—Protein Struct. Mol. Enzymol. 1995, 1247, 1–11. [Google Scholar] [CrossRef]
  22. Körner, A.; Pawelek, J. Mammalian Tyrosinase Catalyzes Three Reactions in the Biosynthesis of Melanin. Science 1982, 217, 1163–1165. [Google Scholar] [CrossRef] [PubMed]
  23. Thipyapong, P.; Hunt, M.D.; Steffens, J.C. Antisense Downregulation of Polyphenol Oxidase Results in Enhanced Disease Susceptibility. Planta 2004, 220, 105–117. [Google Scholar] [CrossRef]
  24. Queiroz, C.; Mendes Lopes, M.L.; Fialho, E.; Valente-Mesquita, V.L. Polyphenol Oxidase: Characteristics and Mechanisms of Browning Control. Food Rev. Int. 2008, 24, 361–375. [Google Scholar] [CrossRef]
  25. Mayer, A.; Harel, E. Phenoloxidases and Their Significance in Fruit and Vegetables. Food Enzymol. 1991, 1, 373–398. [Google Scholar]
  26. Martinez, M.V.; Whitaker, J.R. The Biochemistry and Control of Enzymatic Browning. Trends Food Sci. Technol. 1995, 6, 195–200. [Google Scholar] [CrossRef]
  27. Li, L.; Steffens, J.C. Overexpression of Polyphenol Oxidase in Transgenic Tomato Plants Results in Enhanced Bacterial Disease Resistance. Planta 2002, 215, 239–247. [Google Scholar] [CrossRef]
  28. Li, Y.; Zafar, A.; Kilmartin, P.A.; Reynisson, J.; Leung, I.K.H. Development and Application of an NMR-Based Assay for Polyphenol Oxidases. ChemistrySelect 2017, 2, 10435–10441. [Google Scholar] [CrossRef]
  29. Kampatsikas, I.; Bijelic, A.; Rompel, A. Biochemical and Structural Characterization of Tomato Polyphenol Oxidases Provide Novel Insights into Their Substrate Specificity. Sci. Rep. 2019, 9, 4022. [Google Scholar] [CrossRef] [Green Version]
  30. Gasparetti, C.; Faccio, G.; Arvas, M.; Buchert, J.; Saloheimo, M.; Kruus, K. Discovery of a New Tyrosinase-like Enzyme Family Lacking a C-Terminally Processed Domain: Production and Characterization of an Aspergillus Oryzae Catechol Oxidase. Appl. Microbiol. Biotechnol. 2010, 86, 213–226. [Google Scholar] [CrossRef]
  31. Hakulinen, N.; Gasparetti, C.; Kaljunen, H.; Kruus, K.; Rouvinen, J. The Crystal Structure of an Extracellular Catechol Oxidase from the Ascomycete Fungus Aspergillus Oryzae. JBIC J. Biol. Inorg. Chem. 2013, 18, 917–929. [Google Scholar] [CrossRef]
  32. McLarin, M.-A.; Leung, I.K.H. Substrate Specificity of Polyphenol Oxidase. Crit. Rev. Biochem. Mol. Biol. 2020, 55, 274–308. [Google Scholar] [CrossRef]
  33. Mazzafera, P.; Robinson, S.P. Characterization of Polyphenol Oxidase in Coffee. Phytochemistry 2000, 55, 285–296. [Google Scholar] [CrossRef]
  34. Mondolot, L.; La Fisca, P.; Buatois, B.; Talansier, E.; De Kochko, A.; Campa, C. Evolution in Caffeoylquinic Acid Content and Histolocalization During Coffea Canephora Leaf Development. Ann. Bot. 2006, 98, 33–40. [Google Scholar] [CrossRef]
  35. Ovallath, S.; Sulthana, B. Levodopa: History and Therapeutic Applications. Ann. Indian Acad. Neurol. 2017, 20, 185–189. [Google Scholar] [CrossRef]
  36. Guigoni, C.; Li, Q.; Aubert, I.; Dovero, S.; Bioulac, B.H.; Bloch, B.; Crossman, A.R.; Gross, C.E.; Bezard, E. Involvement of Sensorimotor, Limbic, and Associative Basal Ganglia Domains in L-3,4-Dihydroxyphenylalanine-Induced Dyskinesia. J. Neurosci. 2005, 25, 2102–2107. [Google Scholar] [CrossRef] [PubMed]
  37. Höglinger, G.U.; Rizk, P.; Muriel, M.P.; Duyckaerts, C.; Oertel, W.H.; Caille, I.; Hirsch, E.C. Dopamine Depletion Impairs Precursor Cell Proliferation in Parkinson Disease. Nat. Neurosci. 2004, 7, 726–735. [Google Scholar] [CrossRef]
  38. Hardebo, J.E.; Owman, C. Barrier Mechanisms for Neurotransmitter Monoamines and Their Precursors at the Blood-Brain Interface. Ann. Neurol. 1980, 8, 1–11. [Google Scholar] [CrossRef] [PubMed]
  39. Wang, Y.; Gao, T.; Zhang, Z.; Yuan, X.; Chen, Q.; Zheng, J.; Chen, S.; Ma, F.; Li, C. Overexpression of the Tyrosine Decarboxylase Gene MdTyDC Confers Salt Tolerance in Apple. Environ. Exp. Bot. 2020, 180, 104244. [Google Scholar] [CrossRef]
  40. Li, C.; Sun, X.; Chang, C.; Jia, D.; Wei, Z.; Li, C.; Ma, F. Dopamine Alleviates Salt-Induced Stress in Malus Hupehensis. Physiol. Plant. 2015, 153, 584–602. [Google Scholar] [CrossRef]
  41. Liang, B.; Li, C.; Ma, C.; Wei, Z.; Wang, Q.; Huang, D.; Chen, Q.; Li, C.; Ma, F. Dopamine Alleviates Nutrient Deficiency-Induced Stress in Malus Hupehensis. Plant Physiol. Biochem. 2017, 119, 346–359. [Google Scholar] [CrossRef]
  42. Lan, G.; Jiao, C.; Wang, G.; Sun, Y.; Sun, Y. Effects of Dopamine on Growth, Carbon Metabolism, and Nitrogen Metabolism in Cucumber under Nitrate Stress. Sci. Hortic. 2020, 260, 108790. [Google Scholar] [CrossRef]
  43. Monente, C.; Ludwig, I.A.; Irigoyen, A.; De Peña, M.-P.; Cid, C. Assessment of Total (Free and Bound) Phenolic Compounds in Spent Coffee Extracts. J. Agric. Food Chem. 2015, 63, 4327–4334. [Google Scholar] [CrossRef]
  44. Farah, A.; Donangelo, C.M. Phenolic Compounds in Coffee. Braz. J. Plant Physiol. 2006, 18, 23–36. [Google Scholar] [CrossRef]
  45. Aoki, K.F.; Kanehisa, M. Using the KEGG Database Resource. Curr. Protoc. Bioinform. 2005, 11, 1–12. [Google Scholar] [CrossRef] [PubMed]
  46. Stevens, P.F. Angiosperm Phylogeny Website, Version 13; Angiosperm Phylogeny Website Version 13 2016. Available online: http://www.mobot.org/MOBOT/research/APweb/welcome.html (accessed on 4 September 2022).
  47. Letunic, I.; Bork, P. Interactive Tree of Life (ITOL) v5: An Online Tool for Phylogenetic Tree Display and Annotation. Nucleic Acids Res. 2021, 49, W293–W296. [Google Scholar] [CrossRef] [PubMed]
  48. Snyder, L.R.; Kirkland, J.J.; Dolan, J.W. Introduction to Modern Liquid Chromatography; John Wiley & Sons: Hoboken, NJ, USA, 2011; ISBN 1-118-21039-5. [Google Scholar]
  49. Harris, D.C. Análise Química Quantitativa, 7th ed.; LTC: Rio Jan, Brazil, 2008. [Google Scholar]
  50. Elbarbry, F.; Nguyen, V.; Mirka, A.; Zwickey, H.; Rosenbaum, R. A New Validated HPLC Method for the Determination of Levodopa: Application to Study the Impact of Ketogenic Diet on the Pharmacokinetics of Levodopa in Parkinson’s Participants. Biomed. Chromatogr. 2019, 33, e4382. [Google Scholar] [CrossRef] [Green Version]
  51. César, I.C.; Byrro, R.M.D.; de Santana e Silva Cardoso, F.F.; Mundim, I.M.; de Souza Teixeira, L.; Gomes, S.A.; Bonfim, R.R.; Pianetti, G.A. Development and Validation of a High-Performance Liquid Chromatography–Electrospray Ionization–MS/MS Method for the Simultaneous Quantitation of Levodopa and Carbidopa in Human Plasma. J. Mass Spectrom. 2011, 46, 943–948. [Google Scholar] [CrossRef] [PubMed]
  52. Chi, J.; Ling, Y.; Jenkins, R.; Li, F. Quantitation of Levodopa and Carbidopa in Rat Plasma by LC–MS/MS: The Key Role of Ion-Pairing Reversed-Phase Chromatography. J. Chromatogr. B 2017, 1054, 1–9. [Google Scholar] [CrossRef]
  53. Yang, G.; Zhang, F.; Deng, L.; Chen, C.; Cheng, Z.; Huang, J.; Liu, J.; Jiang, H. Development and Validation of an LC-MS/MS Method for Simultaneous Quantification of Levodopa and MD01 in Rat Plasma and Its Application to a Pharmacokinetic Study of Mucuna pruriens Extract. Biomed. Chromatogr. 2016, 30, 1506–1514. [Google Scholar] [CrossRef]
  54. Patay, É.B.; Bencsik, T.; Papp, N. Phytochemical Overview and Medicinal Importance of Coffea Species from the Past until Now. Asian Pac. J. Trop. Med. 2016, 9, 1127–1135. [Google Scholar] [CrossRef] [Green Version]
  55. Chen, X.-M.; Ma, Z.; Kitts, D.D. Effects of Processing Method and Age of Leaves on Phytochemical Profiles and Bioactivity of Coffee Leaves. Food Chem. 2018, 249, 143–153. [Google Scholar] [CrossRef]
  56. Kampatsikas, I.; Bijelic, A.; Pretzler, M.; Rompel, A. A Peptide-Induced Self-Cleavage Reaction Initiates the Activation of Tyrosinase. Angew. Chem. Int. Ed. 2019, 58, 7475–7479. [Google Scholar] [CrossRef] [PubMed] [Green Version]
  57. Tran, L.T.; Constabel, C.P. The Polyphenol Oxidase Gene Family in Poplar: Phylogeny, Differential Expression and Identification of a Novel, Vacuolar Isoform. Planta 2011, 234, 799–813. [Google Scholar] [CrossRef] [PubMed]
  58. Ono, E.; Hatayama, M.; Isono, Y.; Sato, T.; Watanabe, R.; Yonekura-Sakakibara, K.; Fukuchi-Mizutani, M.; Tanaka, Y.; Kusumi, T.; Nishino, T. Localization of a Flavonoid Biosynthetic Polyphenol Oxidase in Vacuoles. Plant J. 2006, 45, 133–143. [Google Scholar] [CrossRef]
  59. Virador, V.M.; Reyes Grajeda, J.P.; Blanco-Labra, A.; Mendiola-Olaya, E.; Smith, G.M.; Moreno, A.; Whitaker, J.R. Cloning, Sequencing, Purification, and Crystal Structure of Grenache (Vitis Vinifera) Polyphenol Oxidase. J. Agric. Food Chem. 2010, 58, 1189–1201. [Google Scholar] [CrossRef] [PubMed]
  60. Kanteev, M.; Goldfeder, M.; Fishman, A. Structure-Function Correlations in Tyrosinases. Protein Sci. Publ. Protein Soc. 2015, 24, 1360–1369. [Google Scholar] [CrossRef] [PubMed] [Green Version]
  61. Dereeper, A.; Bocs, S.; Rouard, M.; Guignon, V.; Ravel, S.; Tranchant-Dubreuil, C.; Poncet, V.; Garsmeur, O.; Lashermes, P.; Droc, G. The Coffee Genome Hub: A Resource for Coffee Genomes. Nucleic Acids Res. 2015, 43, D1028–D1035. [Google Scholar] [CrossRef] [PubMed]
  62. Jiao, Y.; Leebens-Mack, J.; Ayyampalayam, S.; Bowers, J.E.; McKain, M.R.; McNeal, J.; Rolf, M.; Ruzicka, D.R.; Wafula, E.; Wickett, N.J. A Genome Triplication Associated with Early Diversification of the Core Eudicots. Genome Biol. 2012, 13, R3. [Google Scholar] [CrossRef] [Green Version]
  63. Freeling, M.; Thomas, B.C. Gene-Balanced Duplications, like Tetraploidy, Provide Predictable Drive to Increase Morphological Complexity. Genome Res. 2006, 16, 805–814. [Google Scholar] [CrossRef] [Green Version]
  64. Pavón-Pérez, J.; Oviedo, C.A.; Elso-Freudenberg, M.; Henríquez-Aedo, K.; Aranda, M. Lc-ms/ms method for l-dopa quantification in different tissues of vicia faba. J. Chil. Chem. Soc. 2019, 64, 4651–4653. [Google Scholar] [CrossRef]
  65. Ribani, M.; Bottoli, C.B.G.; Collins, C.H.; Jardim, I.C.S.F.; Melo, L.F.C. Validação Em Métodos Cromatográficos e Eletroforéticos. Quím. Nova 2004, 27, 771–780. [Google Scholar] [CrossRef] [Green Version]
  66. Götz, S.; García-Gómez, J.M.; Terol, J.; Williams, T.D.; Nagaraj, S.H.; Nueda, M.J.; Robles, M.; Talón, M.; Dopazo, J.; Conesa, A. High-Throughput Functional Annotation and Data Mining with the Blast2GO Suite. Nucleic Acids Res. 2008, 36, 3420–3435. [Google Scholar] [CrossRef] [PubMed]
  67. Johns Hopkins University Coffea arabica V. Caturra Genome 2018. Available online: https://www.ncbi.nlm.nih.gov/assembly/GCF_003713225.1 (accessed on 2 June 2022).
  68. Hoff, K.J.; Stanke, M. Predicting Genes in Single Genomes with AUGUSTUS. Curr. Protoc. Bioinform. 2019, 65, e57. [Google Scholar] [CrossRef] [PubMed] [Green Version]
  69. Mistry, J.; Chuguransky, S.; Williams, L.; Qureshi, M.; Salazar, G.A.; Sonnhammer, E.L.L.; Tosatto, S.C.E.; Paladin, L.; Raj, S.; Richardson, L.J.; et al. Pfam: The Protein Families Database in 2021. Nucleic Acids Res. 2021, 49, D412–D419. [Google Scholar] [CrossRef] [PubMed]
  70. Altschul, S.F.; Madden, T.L.; Schäffer, A.A.; Zhang, J.; Zhang, Z.; Miller, W.; Lipman, D.J. Gapped BLAST and PSI-BLAST: A New Generation of Protein Database Search Programs. Nucleic Acids Res. 1997, 25, 3389–3402. [Google Scholar] [CrossRef] [Green Version]
  71. Klabunde, T.; Eicken, C.; Sacchettini, J.C.; Krebs, B. Crystal Structure of a Plant Catechol Oxidase Containing a Dicopper Center. Nat. Struct. Biol. 1998, 5, 1084–1090. [Google Scholar] [CrossRef]
  72. Katoh, K.; Toh, H. Recent Developments in the MAFFT Multiple Sequence Alignment Program. Brief. Bioinform. 2008, 9, 286–298. [Google Scholar] [CrossRef] [PubMed] [Green Version]
  73. Katoh, K.; Misawa, K.; Kuma, K.; Miyata, T. MAFFT: A Novel Method for Rapid Multiple Sequence Alignment Based on Fast Fourier Transform. Nucleic Acids Res. 2002, 30, 3059–3066. [Google Scholar] [CrossRef] [Green Version]
  74. Felsenstein, J. PHYLIP (Phylogeny Inference Package), Version 3.5 c. 1993. Available online: http://www.dbbm.fiocruz.br/molbiol/main.html (accessed on 2 June 2022).
  75. Jones, D.T.; Taylor, W.R.; Thornton, J.M. The Rapid Generation of Mutation Data Matrices from Protein Sequences. Bioinformatics 1992, 8, 275–282. [Google Scholar] [CrossRef]
  76. Saitou, N.; Nei, M. The Neighbor-Joining Method: A New Method for Reconstructing Phylogenetic Trees. Mol. Biol. Evol. 1987, 4, 406–425. [Google Scholar]
  77. Sperschneider, J.; Catanzariti, A.-M.; DeBoer, K.; Petre, B.; Gardiner, D.M.; Singh, K.B.; Dodds, P.N.; Taylor, J.M. LOCALIZER: Subcellular Localization Prediction of Both Plant and Effector Proteins in the Plant Cell. Sci. Rep. 2017, 7, 44598. [Google Scholar] [CrossRef] [PubMed] [Green Version]
  78. Cardon, C.H.; de Oliveira, R.R.; Lesy, V.; Ribeiro, T.H.C.; Fust, C.; Pereira, L.P.; Colasanti, J.; Chalfun-Junior, A. Expression of Coffee Florigen CaFT1 Reveals a Sustained Floral Induction Window Associated with Asynchronous Flowering in Tropical Perennials. Plant Sci. 2022, 325, 111479. [Google Scholar] [CrossRef] [PubMed]
  79. Dobin, A.; Davis, C.A.; Schlesinger, F.; Drenkow, J.; Zaleski, C.; Jha, S.; Batut, P.; Chaisson, M.; Gingeras, T.R. STAR: Ultrafast Universal RNA-Seq Aligner. Bioinformatics 2013, 29, 15–21. [Google Scholar] [CrossRef] [PubMed]
  80. Anders, S.; Pyl, P.T.; Huber, W. HTSeq—A Python Framework to Work with High-Throughput Sequencing Data. Bioinformatics 2015, 31, 166–169. [Google Scholar] [CrossRef] [PubMed] [Green Version]
  81. Chen, Y.; McCarthy, D.; Ritchie, M.; Robinson, M.; Smyth, G.; Hall, E. EdgeR: Differential Analysis of Sequence Read Count Data User’s Guide; R Package; 2020; pp. 1–121. Available online: http://52.71.54.154/packages/release/bioc/vignettes/edgeR/inst/doc/edgeRUsersGuide.pdf (accessed on 8 March 2023).
  82. Warnes, M.G.R.; Bolker, B.; Bonebakker, L.; Gentleman, R.; Huber, W.; Liaw, A. “Package ‘gplots’”. Various R Programming Tools for Plotting Data: 2016. Available online: https://www.researchgate.net/profile/Arni-Magnusson-2/publication/303186599_gplots_Various_R_programming_tools_for_plotting_data/data/5a8fd3b80f7e9ba4296a11a1/gplots.pdf (accessed on 5 December 2022).
  83. Polanowska, K.; Łukasik, R.; Kuligowski, M.; Nowak, J. Development of a Sustainable, Simple, and Robust Method for Efficient l-DOPA Extraction. Molecules 2019, 24, 2325. [Google Scholar] [CrossRef] [PubMed] [Green Version]
Figure 1. Representation of part of the isoquinoline alkaloid biosynthesis pathway according to the KEGG map00950. Here, we show only the enzymes whose genes could be identified in the coffee genome. POLYPHENOL OXIDASE (PPOs; EC:1.14.18.1 and EC:1.10.3.1) and DOPA DECARBOXYLASE (DDC; EC:4.1.1.28) can both accept the amino acid L-tyrosine as a substrate, producing L-DOPA (L-3,4-dihydroxyphenylalanine) and tyramine, respectively. Then, L-DOPA becomes an intermediate metabolite that can be used as a substrate to DDC to produce dopamine. Alternatively, dopamine can also be produced from a tyramine substrate in a PPO enzyme. Among other factors, the final concentration of L-DOPA and dopamine will depend on the downstream pathways such as the tyrosine metabolism or the synthesis of 3,4-DHPAA (3,4-dihydroxyphenylacetaldehyde) by a primary-amine oxidase (EC:1.4.3.21).
Ijms 24 12466 g001
Figure 2. Consensus tree using the neighbor-joining clustering method depicting the evolutionary relationships of Coffea arabica (CAR) and Coffea canephora (CCA) polyphenol oxidases (PPOs) and DOPA decarboxylases (DDCs), as well as the expression profile of their respective genes in C. arabica leaves. (A) Phylogenetic tree of PPOs; five PPOs in C. arabica (PPO.CAR 1–5) with identity above 98% were collapsed during phylogeny inference. PPO.CAR1/2/3/4/5 were clustered together with other PPOs from C. arabica, C. canephora, and other members of the Asterid group. One PPO from C. canephora (PPO.CCA3) and two PPOs from C. arabica (PPO.CAR7 and PPO.CAR8) were clustered into the Rosid group, suggesting that they are under functional diversification. (B) Phylogenetic tree of DDCs; five DDCs from C. arabica (DDC.CAR 1 to 5) clustered with two from C. canephora (DDC.CCA1 and 2), as well as other members of Asterids. However, two highly similar DDCs, one from C. canephora (DDC.CCA3) and the other from C. arabica (DDC.CAR6), were clustered outside of any other flowering plant group, suggesting a diversification of this gene in Coffea. (C) Heatmap representation of the expressed PPOs and DDCs using RNAseq data from C. arabica fully expanded leaves in a field experiment with two cultivars (Acauã or Catuaí) and two harvest times (April or October), grown in farms of two Brazilian cities (Pirapora or Varginha). Expression values are normalized as counts per million (CPM) and represented on a log2(CPM + 1) scale. Each line in the heatmap represents a sequenced library from eight biological samples: Varginha, Catuaí, October (vco); Varginha, Catuaí, April (vca); Varginha, Acauã, October (vao); Varginha, Acauã, April (vaa); Pirapora, Catuaí, October (pco); Pirapora, Catuaí, April (pca); Pirapora, Acauã, October (pao); Pirapora, Acua, April (paa). Each biosample consists of three biological replicates. PPO.CAR1-5 (representing five highly similar loci with identity above 98%) was constitutively expressed in all analyzed RNAseq samples of leaves, while PPO.CAR6 and the divergent PPO.CAR7/8 were less expressed. Regarding DDCs, only DDC.CAR6 was found to be expressed in C. arabica leaves. In both phylogenetic trees (A,B), node numbers correspond to the sum of occurrences of pairs of groups or individual sequences that clustered together in a total of 1000 bootstraps; dashed lines represent nodes in which group pairs were clustered together in less than 500 (50%) of the bootstraps. The selected species and their respective codes are Ananas comosus (ACO), Aegilops tauschii (ATA), Brachypodium distachyon (BDI), C. arabica (CAR), C. canephora (CCA), Cocos nucifera (CNU), Carica papaya (CPA), Cannabis sativa (CSA), Dendrobium catenatum (DCA), Elaeis guineensis (EGU), Glycine max (GMA), Handroanthus impetiginosus (HIM), Homo sapiens (HSA), Hordeum vulgare (HVU), Ipomoea batatas (IBA), Juglans regia (JRE), Lilium regale (LRE), Malus domestica (MDO), Manihot esculenta (MES), Morus notabilis (MNO), Mucuna pruriens (MPR), Medicago truncatula (MTR), Nicotiana tabacum (NTA), Olea europaea (OEU), Oryza sativa (OSA), Prunus armeniaca (PAR), Prunus avium (PAV), Phoenix dactylifera (PDA), Prunus persica (PPE), Papaver somniferum (PSO), Quercus lobata (QLO), Rosa chinensis (RCH), Setaria italica (SIT), Selaginella moellendorffii (SMO), Solanum pennellii (SPE), Solanum tuberosum (STU), Triticum aestivum (TAE), Theobroma cacao (TCA), Trema orientale (TOR), Trifolium pratense (TPR), Vicia faba (VFA), Vanilla planifolia (VPL), Zea mays (ZMA), and Zingiber officinale (ZOF). GenBank or UniProtKB/Swiss-Prot IDs are available in Supplementary Table S2 (PPOs) and Supplementary Table S3 (DDCs). The small phylogenetic tree at the bottom is based on the Angiosperm Phylogeny Website [47], and colors represent specific phylogenetic groups; homologous Homo sapiens proteins were add as the outgroup.
Ijms 24 12466 g002
Figure 3. Sequential mass spectrometry with multiple reaction monitoring (MRM) profile. In the expected retention time (tR ≈ 3.7 min, highlighted circular section), the presence of the three specified transitions was verified, indicating the presence of L-DOPA molecule in the Coffea arabica leaf sample. In addition, the presence of higher-intensity interference in the transition 198 > 152 (blue) is notable, which may suggest the decarboxylation of L-DOPA in carbon C9, resulting in the production of dopamine.
Ijms 24 12466 g003
Table 1. Analytical parameter for the method standardization.
ParameterL-DOPA
B (linear coefficient)1694.5
A (angular coefficient)177.4
R20.99998
DL (µg·mL−1)0.81
QL (µg·mL−1)2.73
Recovery (%)81 to 104
CV (%)0.38 to 1.11
Table 2. LC–MS/MS analysis results from samples of leaves, flowers, and fruits extracted from Coffea arabica and Coffea canephora. Samples with readings above background noise were verified for the presence of L-DOPA.
SpeciesTissueSample IDCountsSignal Above Noise Level
Coffea arabicaLeaves148Yes
248Yes
348Yes
Flowers447No
547No
647No
Fruits748.5Yes
849Yes
949.5Yes
Coffea canephoraLeaves1048.5Yes
1148Yes
1249Yes
Flowers1348No
1448No
1548No
Fruits1647No
1748No
1848No
Disclaimer/Publisher’s Note: The statements, opinions and data contained in all publications are solely those of the individual author(s) and contributor(s) and not of MDPI and/or the editor(s). MDPI and/or the editor(s) disclaim responsibility for any injury to people or property resulting from any ideas, methods, instructions or products referred to in the content.

