Article

Genome-Wide Identification of GmSPS Gene Family in Soybean and Expression Analysis in Response to Cold Stress

1
Key Laboratory of Biology and Genetic Improvement of Oil Crops, Ministry of Agriculture and Rural Affairs, Oil Crops Research Institute of Chinese Academy of Agricultural Sciences, Wuhan 430062, China
2
College of Life Sciences, Wuhan University, Wuhan 430072, China
*
Authors to whom correspondence should be addressed.
Int. J. Mol. Sci. 2023, 24(16), 12878; https://doi.org/10.3390/ijms241612878
Submission received: 24 May 2023 / Revised: 12 August 2023 / Accepted: 14 August 2023 / Published: 17 August 2023
(This article belongs to the Special Issue Abiotic Stresses in Plants: From Molecules to Environment)

Abstract

:
Sucrose metabolism plays a critical role in development, stress response, and yield formation of plants. Sucrose phosphate synthase (SPS) is the key rate-limiting enzyme in the sucrose synthesis pathway. To date, genome-wide survey and comprehensive analysis of the SPS gene family in soybean (Glycine max) have yet to be performed. In this study, seven genes encoding SPS were identified in soybean genome. The structural characteristics, phylogenetics, tissue expression patterns, and cold stress response of these GmSPSs were investigated. A comparative phylogenetic analysis of SPS proteins in soybean, Medicago truncatula, Medicago sativa, Lotus japonicus, Arabidopsis, and rice revealed four families. GmSPSs were clustered into three families from A to C, and have undergone five segmental duplication events under purifying selection. All GmSPS genes had various expression patterns in different tissues, and family A members GmSPS13/17 were highly expressed in nodules. Remarkably, all GmSPS promoters contain multiple low-temperature-responsive elements such as potential binding sites of inducer of CBF expression 1 (ICE1), the central regulator in cold response. qRT-PCR proved that these GmSPS genes, especially GmSPS8/18, were induced by cold treatment in soybean leaves, and the expression pattern of GmICE1 under cold treatment was similar to that of GmSPS8/18. Further transient expression analysis in Nicotiana benthamiana and electrophoretic mobility shift assay (EMSA) indicated that GmSPS8 and GmSPS18 transcriptions were directly activated by GmICE1. Taken together, our findings may aid in future efforts to clarify the potential roles of GmSPS genes in response to cold stress in soybean.

1. Introduction

Environmental factors such as cold and osmotic stresses could affect plant growth. Cold stress includes chilling (0–15 °C) and freezing (<0 °C), which have an effect on the growth and yield of plants [1,2]. Low temperature affects the absorption of water and nutrients by plants, as well as the fluidity of membrane, and affects gene expression and protein synthesis [2]. It affects cell metabolism by reducing the rate of biochemical reaction or affecting gene expression reprogramming. Cold stress will not only inhibit the metabolic reaction of plants, but also produce osmotic reactions to inhibit plant growth [2,3]. In addition to winter-habit plants, many important crops such as rice, corn, and soybean are very sensitive to cold [4]. Cold stress will seriously harm the growth of soybean, especially spring soybean cultivars, and lead to yield reduction, so it is vital to reveal the adaptation mechanism of soybean to cold stress.
In order to survive, plants have evolved complex mechanisms in response to cold stress. In previous studies, many key factors in the cold stress signal pathway have been found. COR (cold-responsive) genes can be upregulated by CBFs (C-repeat/DRE-binding factors) under cold stress [4,5], which could be induced by low temperature and had conserved functions in flowering plants in response to cold stress [6]. Overexpression of CBF1/DREB1b and CBF3 can enhance the freezing resistance of Arabidopsis [7,8]. ICE transcription factor can induce the expression of CBF genes under normal temperature, and the ice1 mutant blocked the expression of CBF3 itself and its downstream genes to increase the sensitivity of plants to cold stress in Arabidopsis [9]. These results indicate that the ICE-CBF-COR signal pathway is crucial for plants in response to cold stress.
Soybean is a worldwide economical crop and a major source of oil and protein [10]. Some studies have been reported cold stress responses in soybean. Under cold treatment, transcriptome analyses identified many cold-stress-related genes, including CBF/DREB [11]. In addition, the plant hormone ethylene may inhibit soybean CBF/DREB1 pathway through EIN3 (ethylene-insensitive 3) [12]. The sensitivity of soybean to cold stress varies at different developmental stages. During the vegetative growth stage, CBF can be strongly and briefly induced under cold stress, but low-temperature stress delays the reproductive stage of soybean [13,14]. GmTCF1a (tolerant to chilling and freezing 1a) positively regulates cold tolerance in soybean, which is independent of the CBF pathway as AtTCF1 [15,16].
The physiological changes of plants are closely related to freezing resistance, including the accumulation of some solutes, such as soluble sugar, proline, and other lower-molecular-weight solutes [2]. The increase of soluble sugars such as sucrose, glucose, and fructose can function as osmotic protective substances to enhance the resistance of plants to cold [17]. A previous study showed that soluble sugar accumulated significantly within 2 h after plants were exposed to low temperature [18]. Prolonged cold will lead to more sucrose accumulation, which enables Deschampsia antarctica to survive in the Antarctic [19]. When petunia was cold-treated, more sugar and starch were accumulated in the source leaves, while the starch content in the sink tissue decreased. Moreover, the activity of cwINV (cell wall invertase) in the sink tissue decreased, showing the reduction of sugar input and utilization [20]. Accumulating higher sugar in the source tissue can increase osmotic protection and thus enhance the ability of photosynthetic tissue to resist cold stress, which is the core element of cold stress response [21,22]. These results suggest that sugar accumulation plays an important role in plant resistance to cold stress.
Sucrose is the main transport form of photosynthate in plants and plays a crucial role in the normal growth and development of plants [23]. Sucrose phosphate synthase plays a central role in the production of sucrose in photosynthetic cells. The sucrose synthesis involves a two-step reaction, and SPS (EC 2.4.1.14) is the key rate-limiting enzyme in the sucrose synthesis pathway, which catalyzes the conversion of UDP-glucose and fructose-6-phosphate to sucrose-6-phosphate, which is then hydrolyzed to sucrose by sucrose-phosphatase (SPP) [24,25]. SPS activity has been shown to be linked with sucrose accumulation [26]. Spinach SPS expression in cotton promotes sucrose synthesis and improves fiber quality [27]. At the stage of fruit ripening, both SPS expression and activity are upregulated, which in turn promotes sucrose synthesis [28,29,30]. SPS in spinach has also been proposed to play significant roles in stressful environment conditions. When plants are exposed to low-temperature stress, the expression of SPS increases dramatically and more sucrose is synthesized in response to cold stress [31]. SPS is encoded by a multigene family. Genome-wide survey of SPS genes has been performed in Arabidopsis, rice, maize, wheat, tomato, cassava, Litchi, and other plants [32,33,34,35,36]. According to the amino acid sequences, SPS proteins can be divided into four categories (A, B, C, D), with the branch D only present in the poaceae [37]. Expression and functions of different SPS genes vary among different categories in different plants. In soybean leaves, drought and K-deficiency increased soluble sugar content and SPS activity [38], and accumulation of sugar content was correlated with increased SPS activity, suggesting SPS might play important roles in response to abiotic stress in soybean [39].
In this study, a genome-wide survey was performed to explore the special sequence and expression characteristics of soybean SPS family genes. The objective focused on the analysis of phylogenetic relationships, duplications patterns, gene structures, conserved motifs, phosphorylation sites, cis-elements, and tissue expression patterns. The expression change of GmSPS genes under cold stress were also examined. Furthermore, we suggest that the expression level of GmSPS8/18 may be upregulated by GmICE1. Consequently, these findings may provide foundations for functional investigation of GmSPS genes in soybean.

2. Results

2.1. Genome-Wide Identification of GmSPS Genes in Soybean

HMMER (v3.3.2) searches using three conserved domains (PF00862, PF00534, PF05116) of SPS protein and BLASTP using the Arabidopsis SPS sequences were performed in the soybean protein database. Then, 82 and 18 candidate sequences were generated through HMMER (v3.3.2) search and BLASTP, respectively. Finally, a total of seven different soybean loci encoding SPS proteins were identified by removing redundant sequences. The seven putative soybean SPS proteins all contained the sucrsPsyn_pln, and were confirmed by NCBI-CDD (Table S1). Based on the annotation file of soybean genomic sequences, the seven putative soybean SPS genes were found to be distributed on seven different chromosomes, respectively. According to the chromosomal location, these soybean SPS genes were named GmSPS4/6/8/13/14/17/18.
Sequence alignments showed high identity and similarity in GmSPS4/6, GmSPS13/17, and GmSPS8/14/18 at both amino acid (79.29% to 97.26%) and nucleotide level (83.18% to 96.77%) (Table S2). The detailed predictions of GmSPS genes are described in Table 1. The full length of GmSPS-predicted proteins vary from 778 to 1064 amino acids and the molecular weight (Mw) is arranged from 87.6 to 119.3 kDa. In addition, the predicted isoelectric point (pI) ranges from 5.94 to 6.31. More than one transcript were predicted in three GmSPS genes. GmSPS13 contains five transcripts, GmSPS14 contains two transcripts, and GmSPS17 contains four transcripts. Moreover, subcellular localization prediction suggests that GmSPS4/8/14 and GmSPS6/13/17/18 proteins are located in the cytoplasm and nucleus, respectively.

2.2. Phylogenetic Analysis of SPS Proteins

A phylogenetic tree was constructed using the MEGA software (v11.0.11) to assess the phylogenetic relationship of SPSs from soybean with those from M. truncatula, M. sativa, L. japonicus, Arabidopsis, and rice, which are leguminous, dicotyledonous, and monocotyledonous model plants, respectively (Figure 1). Previous studies isolated three MsSPS members (MsSPSA, MsSPSB, MsSPSB3) in M. sativa [40]. However, we identified two MsSPSB3 members (named MsSPSB3-1 and MsSPSB3-2) in diploid M. sativa, which was sequenced in 2020 [41]. MsSPSB3 amplified in previous studies was a partial of MsSPSB3-1 and MsSPSB3-2. Thus, four SPSs (MsSPSA, MsSPSB, MsSPSB3-1, and MsSPSB3-2) from M. sativa were used to construct the phylogenetic tree. These SPS members from six plant species can be clustered into four distinct families (A, B, C, D). The family D is specific to rice, and the family C does not include alfalfa SPS members, which is consistent with previously studies [25,40]. Among the four families, family B had the largest number of SPS members, with twelve. The GmSPS had a closer relationship with leguminous plants than Arabidopsis and rice. In families A, B, and C, SPSs from soybean are more closely related to L. japonicus than two kinds of alfalfa. GmSPS13 and GmSPS17 were grouped into family A, GmSPS8, GmSPS14, and GmSPS18 belonged to family B, and GmSPS4 and GmSPS6 were grouped into family C. No SPS from soybean was grouped into family D. Both soybean and L. japonicus had SPS members of family C, but alfalfa did not.

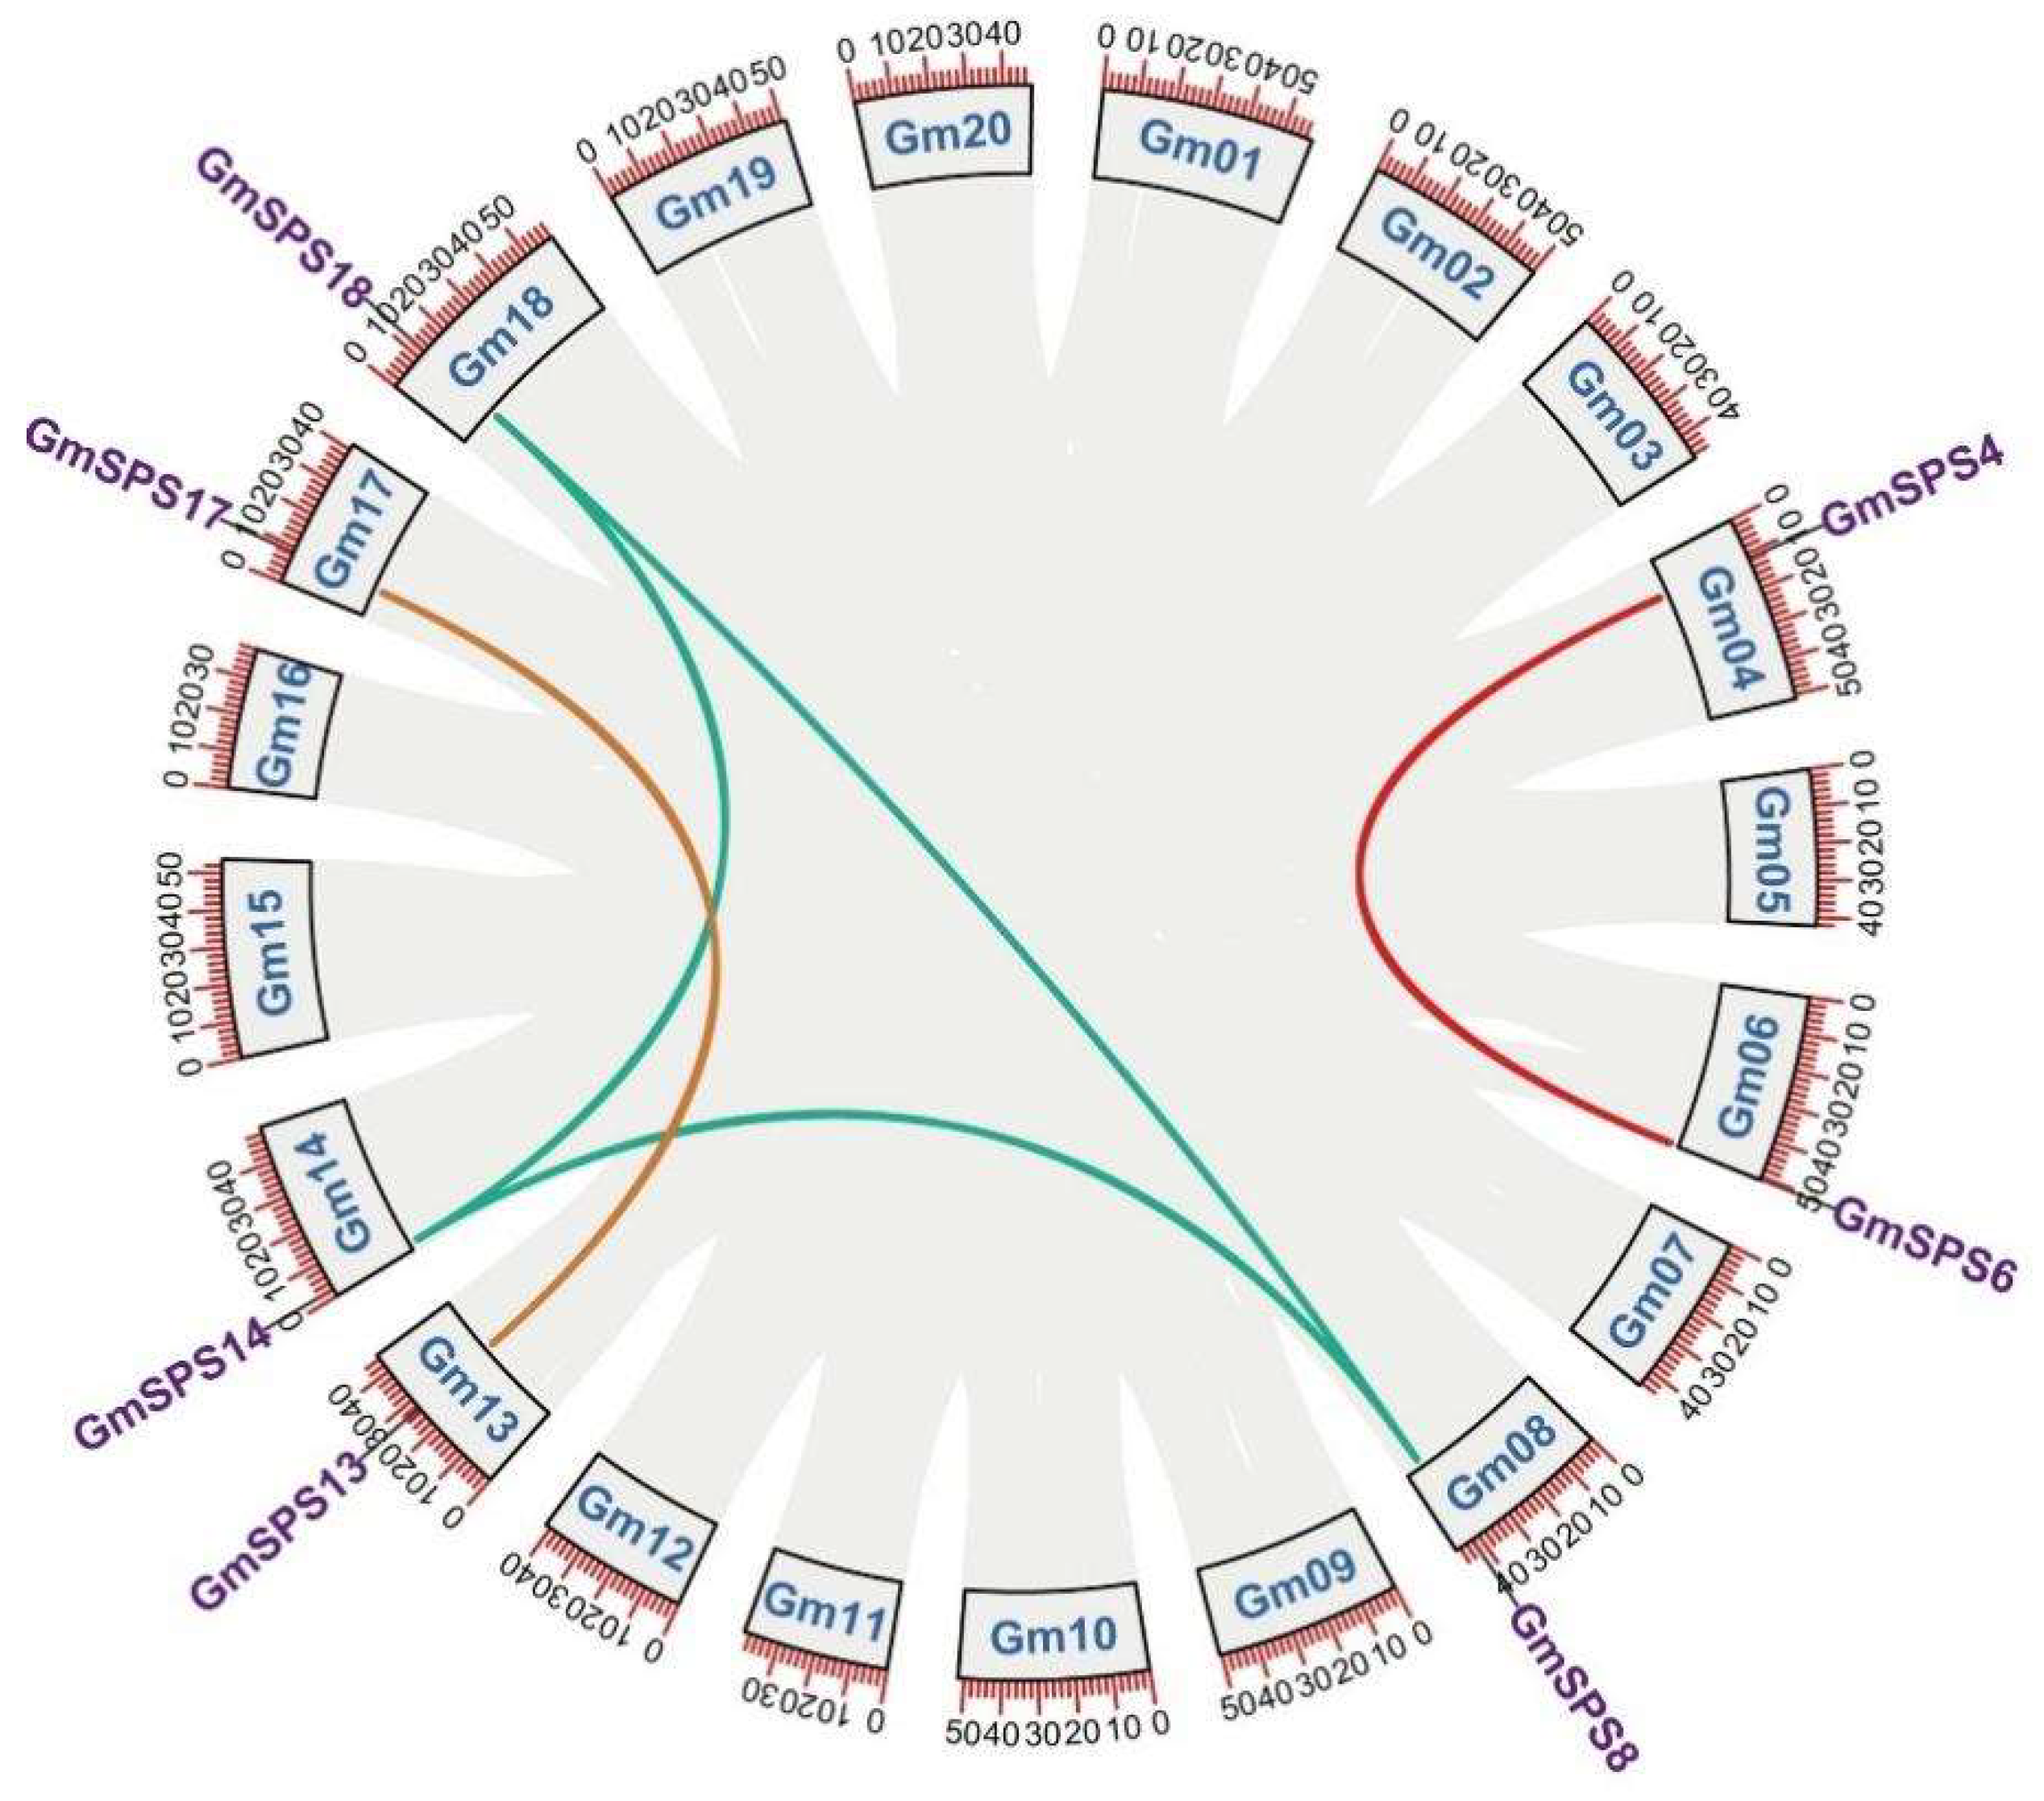
2.3. Collinearity Analysis of GmSPS Genes

Soybean is a paleotetraploid crop which has undergone two whole genome duplications with very high retention of homologs in the genome [42,43]. Whole genome duplication and segmental and tandem duplication are the important events during soybean genome regions [42]. Seven GmSPS genes were not located in the same soybean chromosome. Therefore, no tandem duplication was found in the identified GmSPS genes. Collinearity analyses revealed that five gene pairs underwent segmental duplication events (Figure 2).
Genome duplications occurred at approximately 59 and 13 million years ago, resulting in a highly duplicated genome with nearly 75% of the genes present in multiple copies [42]. The Ks values of segment pairs GmSPS13/17, GmSPS4/6, and GmSPS8/18 were 0.1107, 0.0995, and 0.1182 (Table 2). The divergence times of these duplicated paralogous pairs were associated with the 13 Mya WGD events. However, the Ks of GmSPS18/14 and GmSPS8/14 were larger than 0.6 and the divergence time is associated with the 59 Mya early legume WGD, which indicated that both GmSPS8 and GmSPS18 were originated from GmSPS14 [44]. The Ka/Ks ratio is a measure used to explore the mechanism of gene replication and evolution after ancestor differentiation [45]. A Ka/Ks value < 1 suggests purifying selection, a Ka/Ks value = 1 indicates neutral selection, and a Ka/Ks value > 1 suggests positive selection. In addition, all the GmSPS paralogous pairs showed Ka/Ks < 1, suggesting that GmSPS genes have undergone purification selection during evolution.

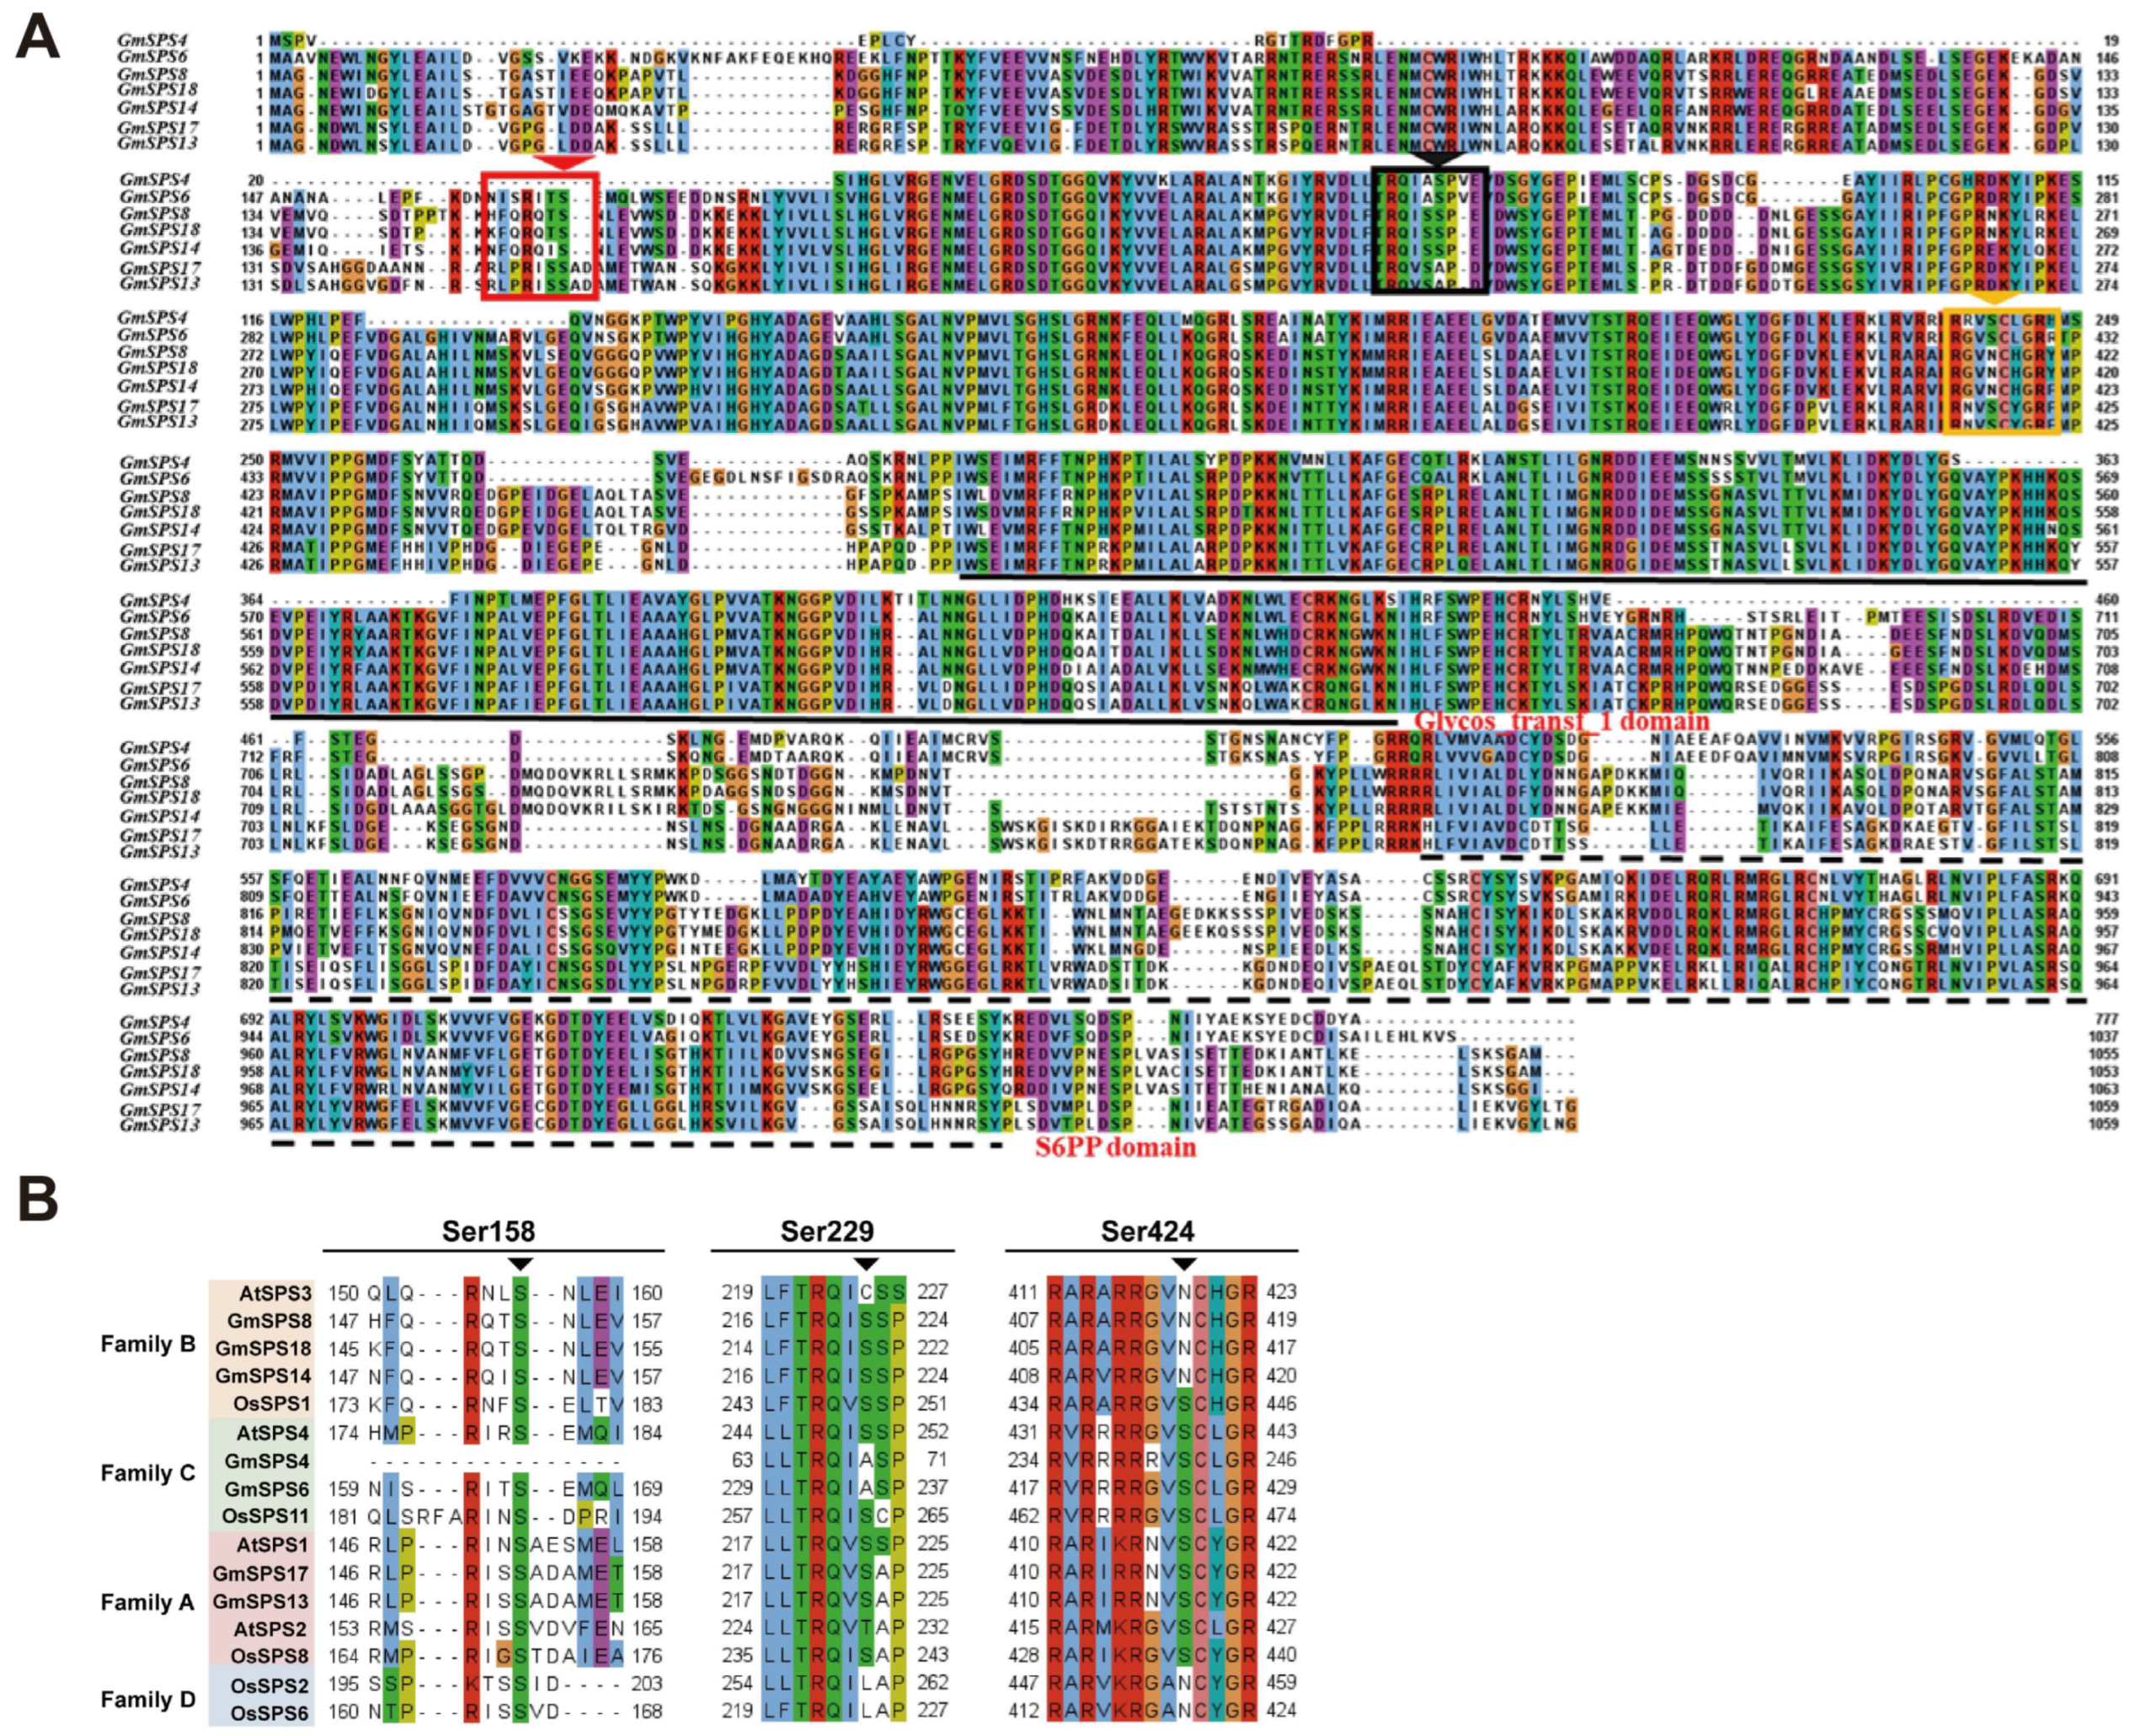
2.4. Gene Structure and Conserved Motif Analyses of GmSPSs

The gene structures of seven GmSPS genes are shown by analyzing the sequence annotation file (Figure 3A). The number of exons and introns in GmSPS genes vary from twelve to seventeen and eleven to sixteen, respectively. GmSPS genes belonging to the same family possess similar number of exons and introns. Family A members, the putative paralogous pairs (GmSPS13/17), contain 13 exons and 12 introns, and family B members GmSPS8/14/18 all contain 12 exons and 11 introns. Family C members, the putative paralogous pairs (GmSPS4/6), contain the most exons (17, 14) and introns (16, 13). Fifteen putative conserved motifs were identified in seven GmSPS proteins based on the amino acid sequence by the program MEME (Figure 3B). The identified multilevel consensus sequences of these motifs are shown in Table S3. All GmSPS proteins contain these fifteen motifs except GmSPS4, which not contain motif 6, motif 8, and motif 9. Most motifs are present in Glycos_transf_1, S6PP and Sucrose_synth domains (Table S3). Motif 5, motif 15, motif 9, motif 4, motif 12, and motif 3 belonged to the sucrose synthase domain. Motif 2, motif 6, motif 10, and motif 1 belonged to the Glycos_transf_1 domain. Motif 13, motif 11, motif 14, and motif 7 belonged to the S6PP domain. Glycos_transf_1 and S6PP domains existed in all GmSPS members. It is worth noting that GmSPS13 did not have the Sucrose_synth domain by using Pfam for functional domain prediction, although it had conserved motifs. This may mean that the Sucrose_synth domain function was missing in GmSPS13. The Glycos_transf_1 domain is associated with transfer of glucosyl, and the S6PP domain may mediate the interaction with SPP.

2.5. Analysis of Phosphorylation Sites in GmSPS Proteins

It has been reported that SPS proteins could be modulated by phosphorylation in response to temperature and other abiotic stresses [37]. The predicted phosphorylation sites of GmSPS proteins were analyzed using NetPhos 3.1 Server (Figure 4 and Figure S1). The results show that the main predicted phosphorylation site of GmSPS proteins was serine. In detail, GmSPS13 had the most predicted serine phosphorylation sites with a total number of 90, and GmSPS4 had the least number of 55. GmSPS14 had the maximum number of predicted threonine phosphorylation sites and the GmSPS6 contained the maximum number of predicted tyrosine phosphorylation sites. Previous research indicated that phosphorylation sites Ser-158, Ser-229, and Ser-424 were involved in light–dark regulation, 14-3-3 protein binding, and osmotic stress activation, respectively [37]. Our results demonstrate that Ser-158 is conserved in GmSPS proteins except GmSPS4. Ser-229 is conserved in GmSPS proteins apart from family C members GmSPS4 and GmSPS6. A conversion from S to A was found in GmSPS4 and GmSPS6, which is consistent with the fact that in LcSPS4, the family C member from Litchi is observed [36]. Ser-424 is conserved in GmSPS proteins except family B members GmSPS8, GmSPS14, and GmSPS18 (Figure 4B). A conversion from S to N was found in GmSPS8, GmSPS14, and GmSPS18, which is consistent with the fact that in AtSPS3 and LcSPS3, the family B member from Arabidopsis and Litchi [36], respectively, are observed. Accordingly, our data suggest that GmSPSs contain several predicted phosphorylation sites including a part of serine, threonine, and tyrosine sites, which could possibly function in response to the abiotic stresses.

2.6. Promoter cis-Element Analysis of GmSPS

Gene promoters are essential for transcriptional regulation [46]. The cis-elements of promoters play significant roles in response to plant growth and various environmental stresses. The 3000 bp sequences upstream of all GmSPS genes were analyzed by PlantCARE and PlantPAN (Table S4). Some kinds of cis-elements were found in the promoter regions of GmSPSs, including TF binding sites, hormone response, abiotic response, and photoperiod response elements (Figure 5). Predicted cis-elements that could respond to the hormones such as auxin, gibberellin, salicylic acid, abscisic acid, and MeJA (methyl jasmonate) were identified. Some elements associated with abiotic stresses response like defense, low temperature, drought-inducibility, and anaerobic induction in upstream regions of the GmSPS genes were also predicted. It is worth noting that all the GmSPS members have many low-temperature-responsive elements, and they are closer to the predicted start codon of family B members (GmSPS8/14/18) than other GmSPSs. These results suggest that GmSPS genes may play important roles in response to environmental factors, especially low-temperature stress.

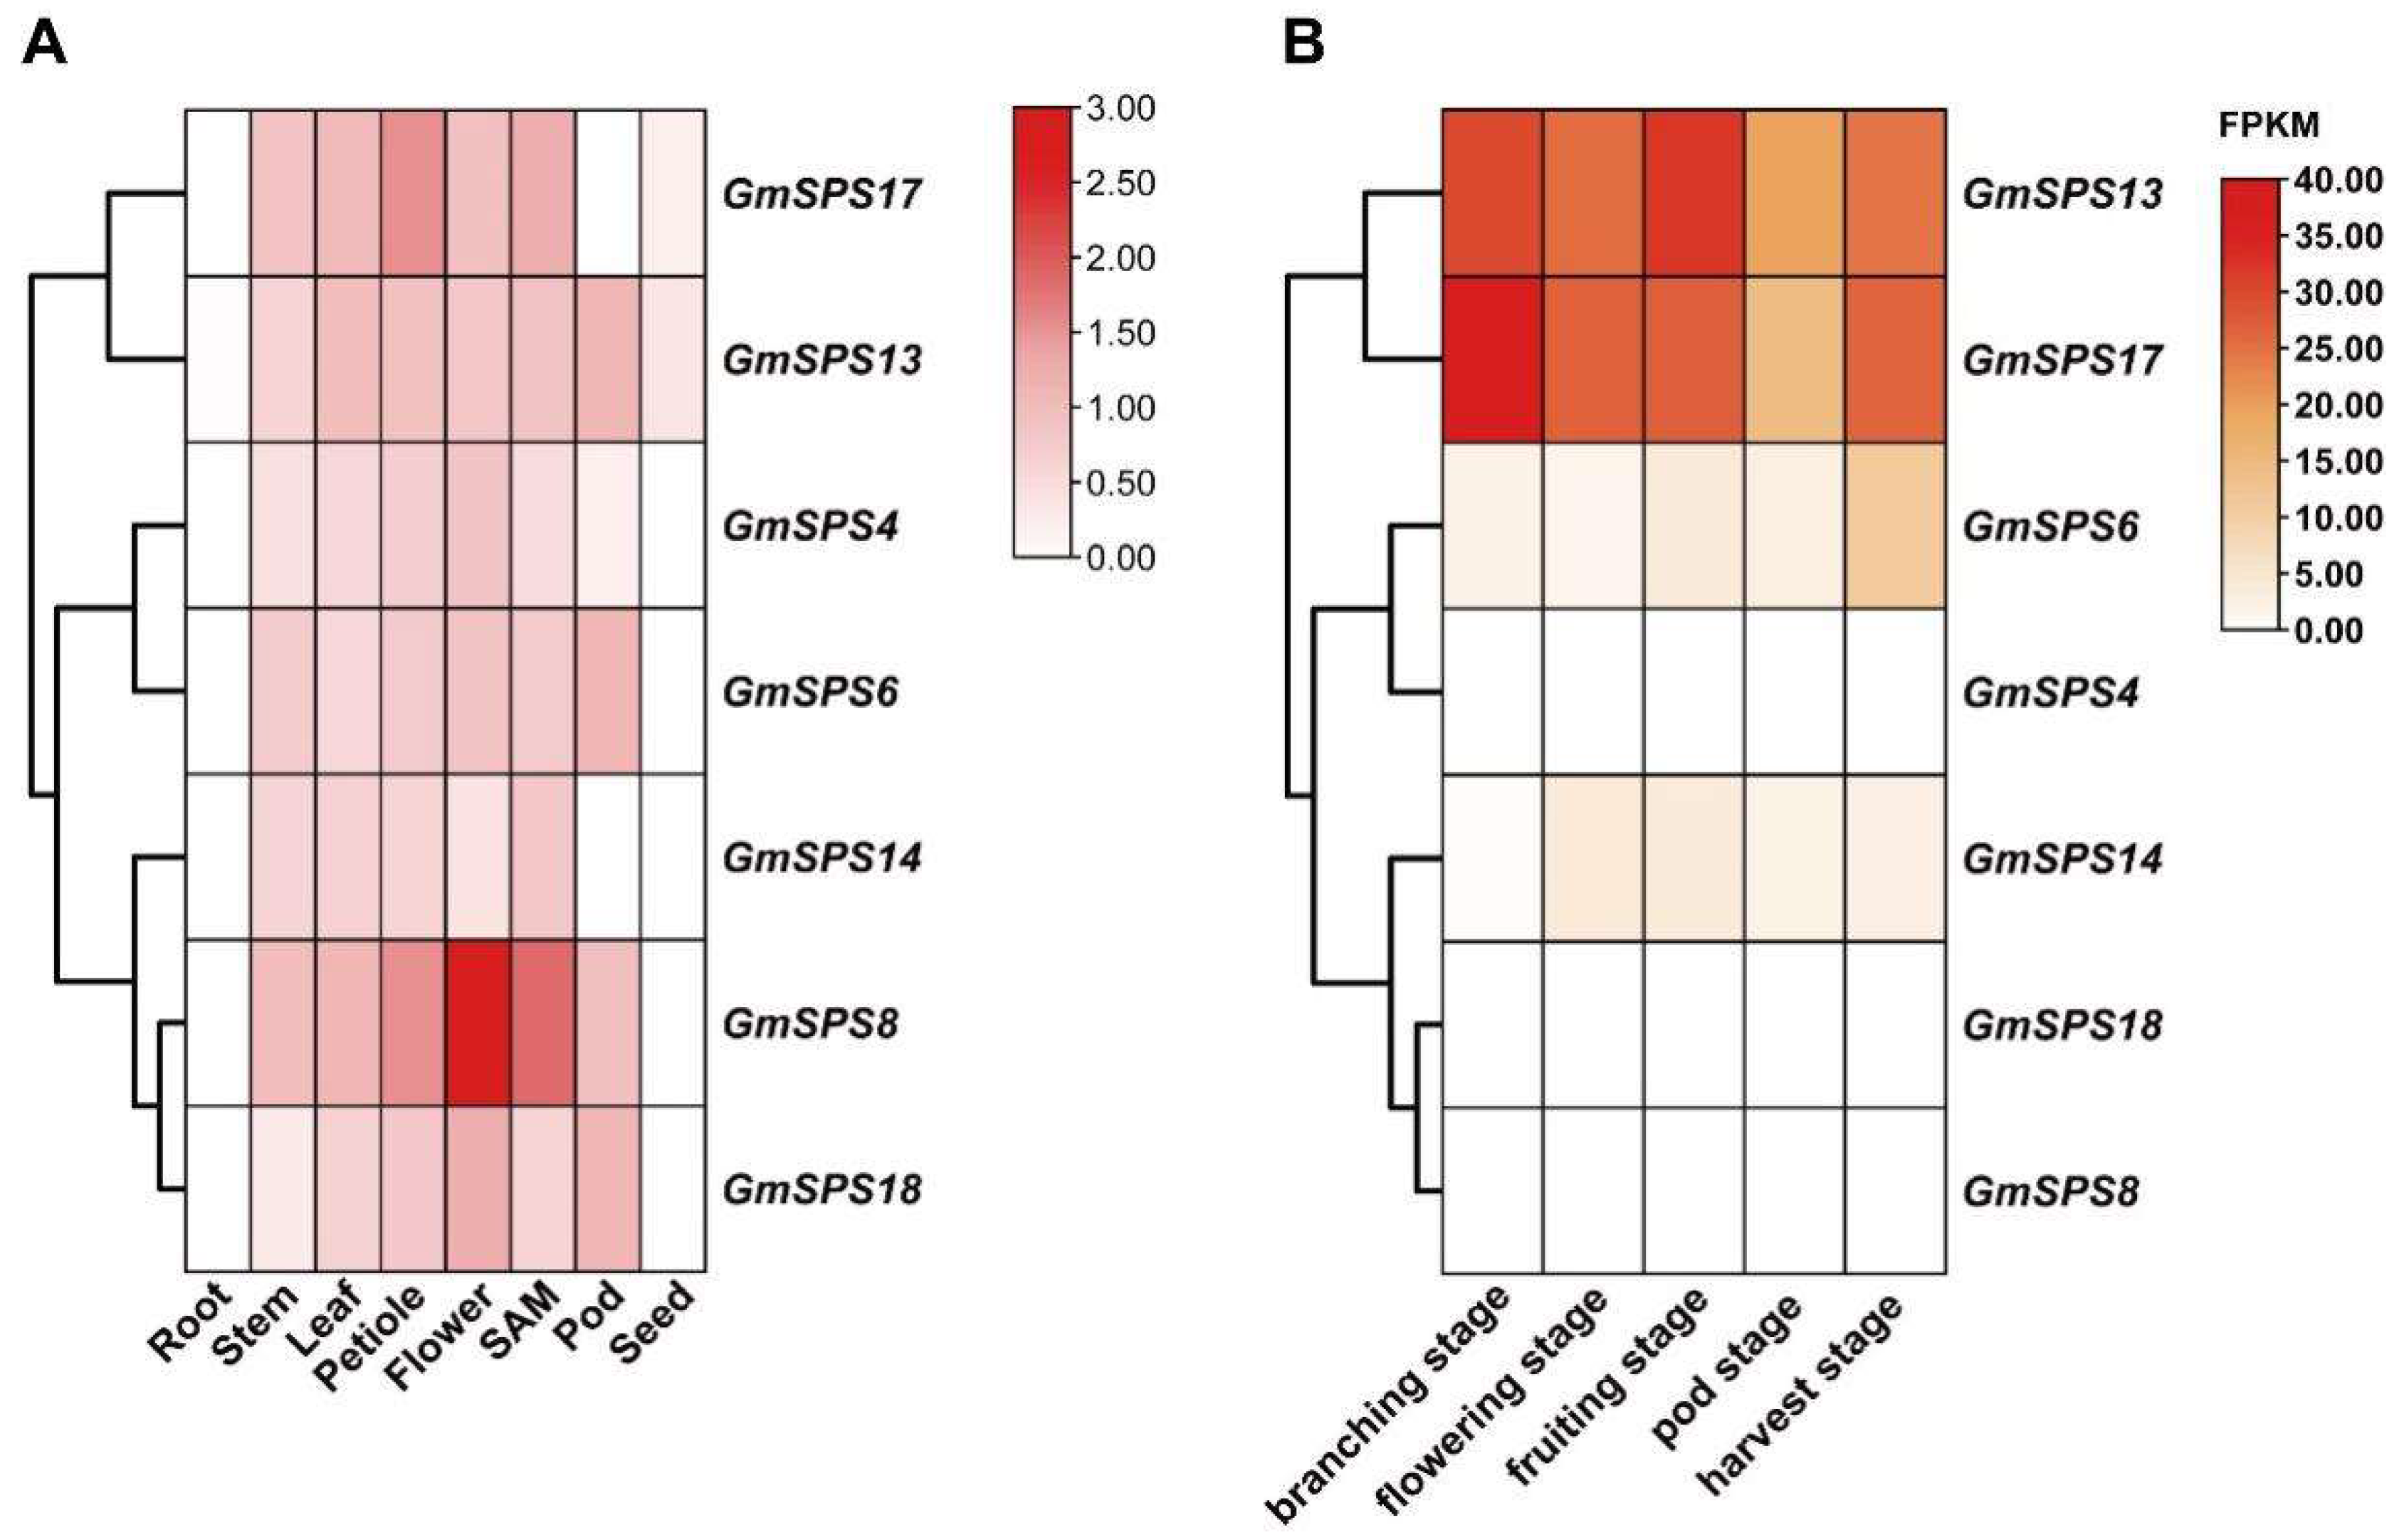
2.7. Tissue-Specific Expression Patterns of GmSPS Members in Soybean

To further clarify the expression pattern of GmSPSs in soybean, the expression levels of GmSPSs in eight different tissues including root, stem, leaf, petiole, flower, SAM (shoot apical meristem), pod, and mature seed were analyzed by qRT-PCR. The relative mRNA abundance of GmSPS genes was shown in a heatmap (Figure 6A). The results demonstrated that all GmSPS genes were expressed in stem, leaf, petiole, flower, and SAM, while not expressed in root and seed, except GmSPS13 and GmSPS17. Our analysis revealed that GmSPS8 had the strongest expression level in the flower. In contrast, GmSPS6/13 and GmSPS17 had higher expression in pod and petiole compared to other tissues, respectively. The expression patterns may lay the foundation for exploring GmSPSs potential functions in the future.
In our previous work, we carried out the transcriptome analysis of soybean nodules at soybean different five developmental stages (branching stage, flowering stage, fruiting stage, pod stage, and harvest stage) inoculated with Bradyrhizobium japonicum strain 113-2 [47]. We analyzed the expression abundance of GmSPS genes using the published data (Figure 6B) and found significant differences in the expression level of GmSPS genes in soybean nodules. Interestingly, the family A members GmSPS13/17 were highly expressed in nodules at all five stages. This is consistent with previous research showing that MsSPSA revealed nodule-enhanced expression [40]. The family B members, GmSPS8/18, were not expressed in nodules at any stage, while GmSPS14 had some expression level in nodules at flowering stage to harvest stage. In addition, the family C member GmSPS4 was not expressed in nodules, while the paralogous gene GmSPS6 had some expression level in nodules at five stages. These results suggest function divergence of some homologous genes.

2.8. Expression Analysis of GmSPS Genes in Response to Cold Stress

It was predicted that a variety of low-temperature-responsive elements would be found in the GmSPS promoters (Figure 5). Moreover, previous research has suggested that SPS plays a key role in abiotic stresses, including cold [31,48,49,50]. To verify whether GmSPS genes responded to cold stress, the expression levels of GmSPSs were examined in leaves after cold treatment at 0 h, 2 h, 4 h, 6 h, 8 h, 12 h, 24 h, and 48 h. All GmSPSs were found to be upregulated under cold treatment (Figure 7). The expression levels of GmSPS4/6 increased significantly at 8 h and reached the highest value at 12 h after cold treatment. The transcript levels of GmSPS8/18 began to accumulate after 2 h after cold treatment, and increased 8-fold at 4 h and more than 20-fold from 6 h to 12 h. The levels of GmSPS13/17 transcripts increased at 6 h and gradually declined from 8 h after cold treatment. The transcript level of GmSPS14 increased over 10-fold at 6 h after cold treatment. Consequently, our results reveal the potential vital biological functions of GmSPSs for cold response.

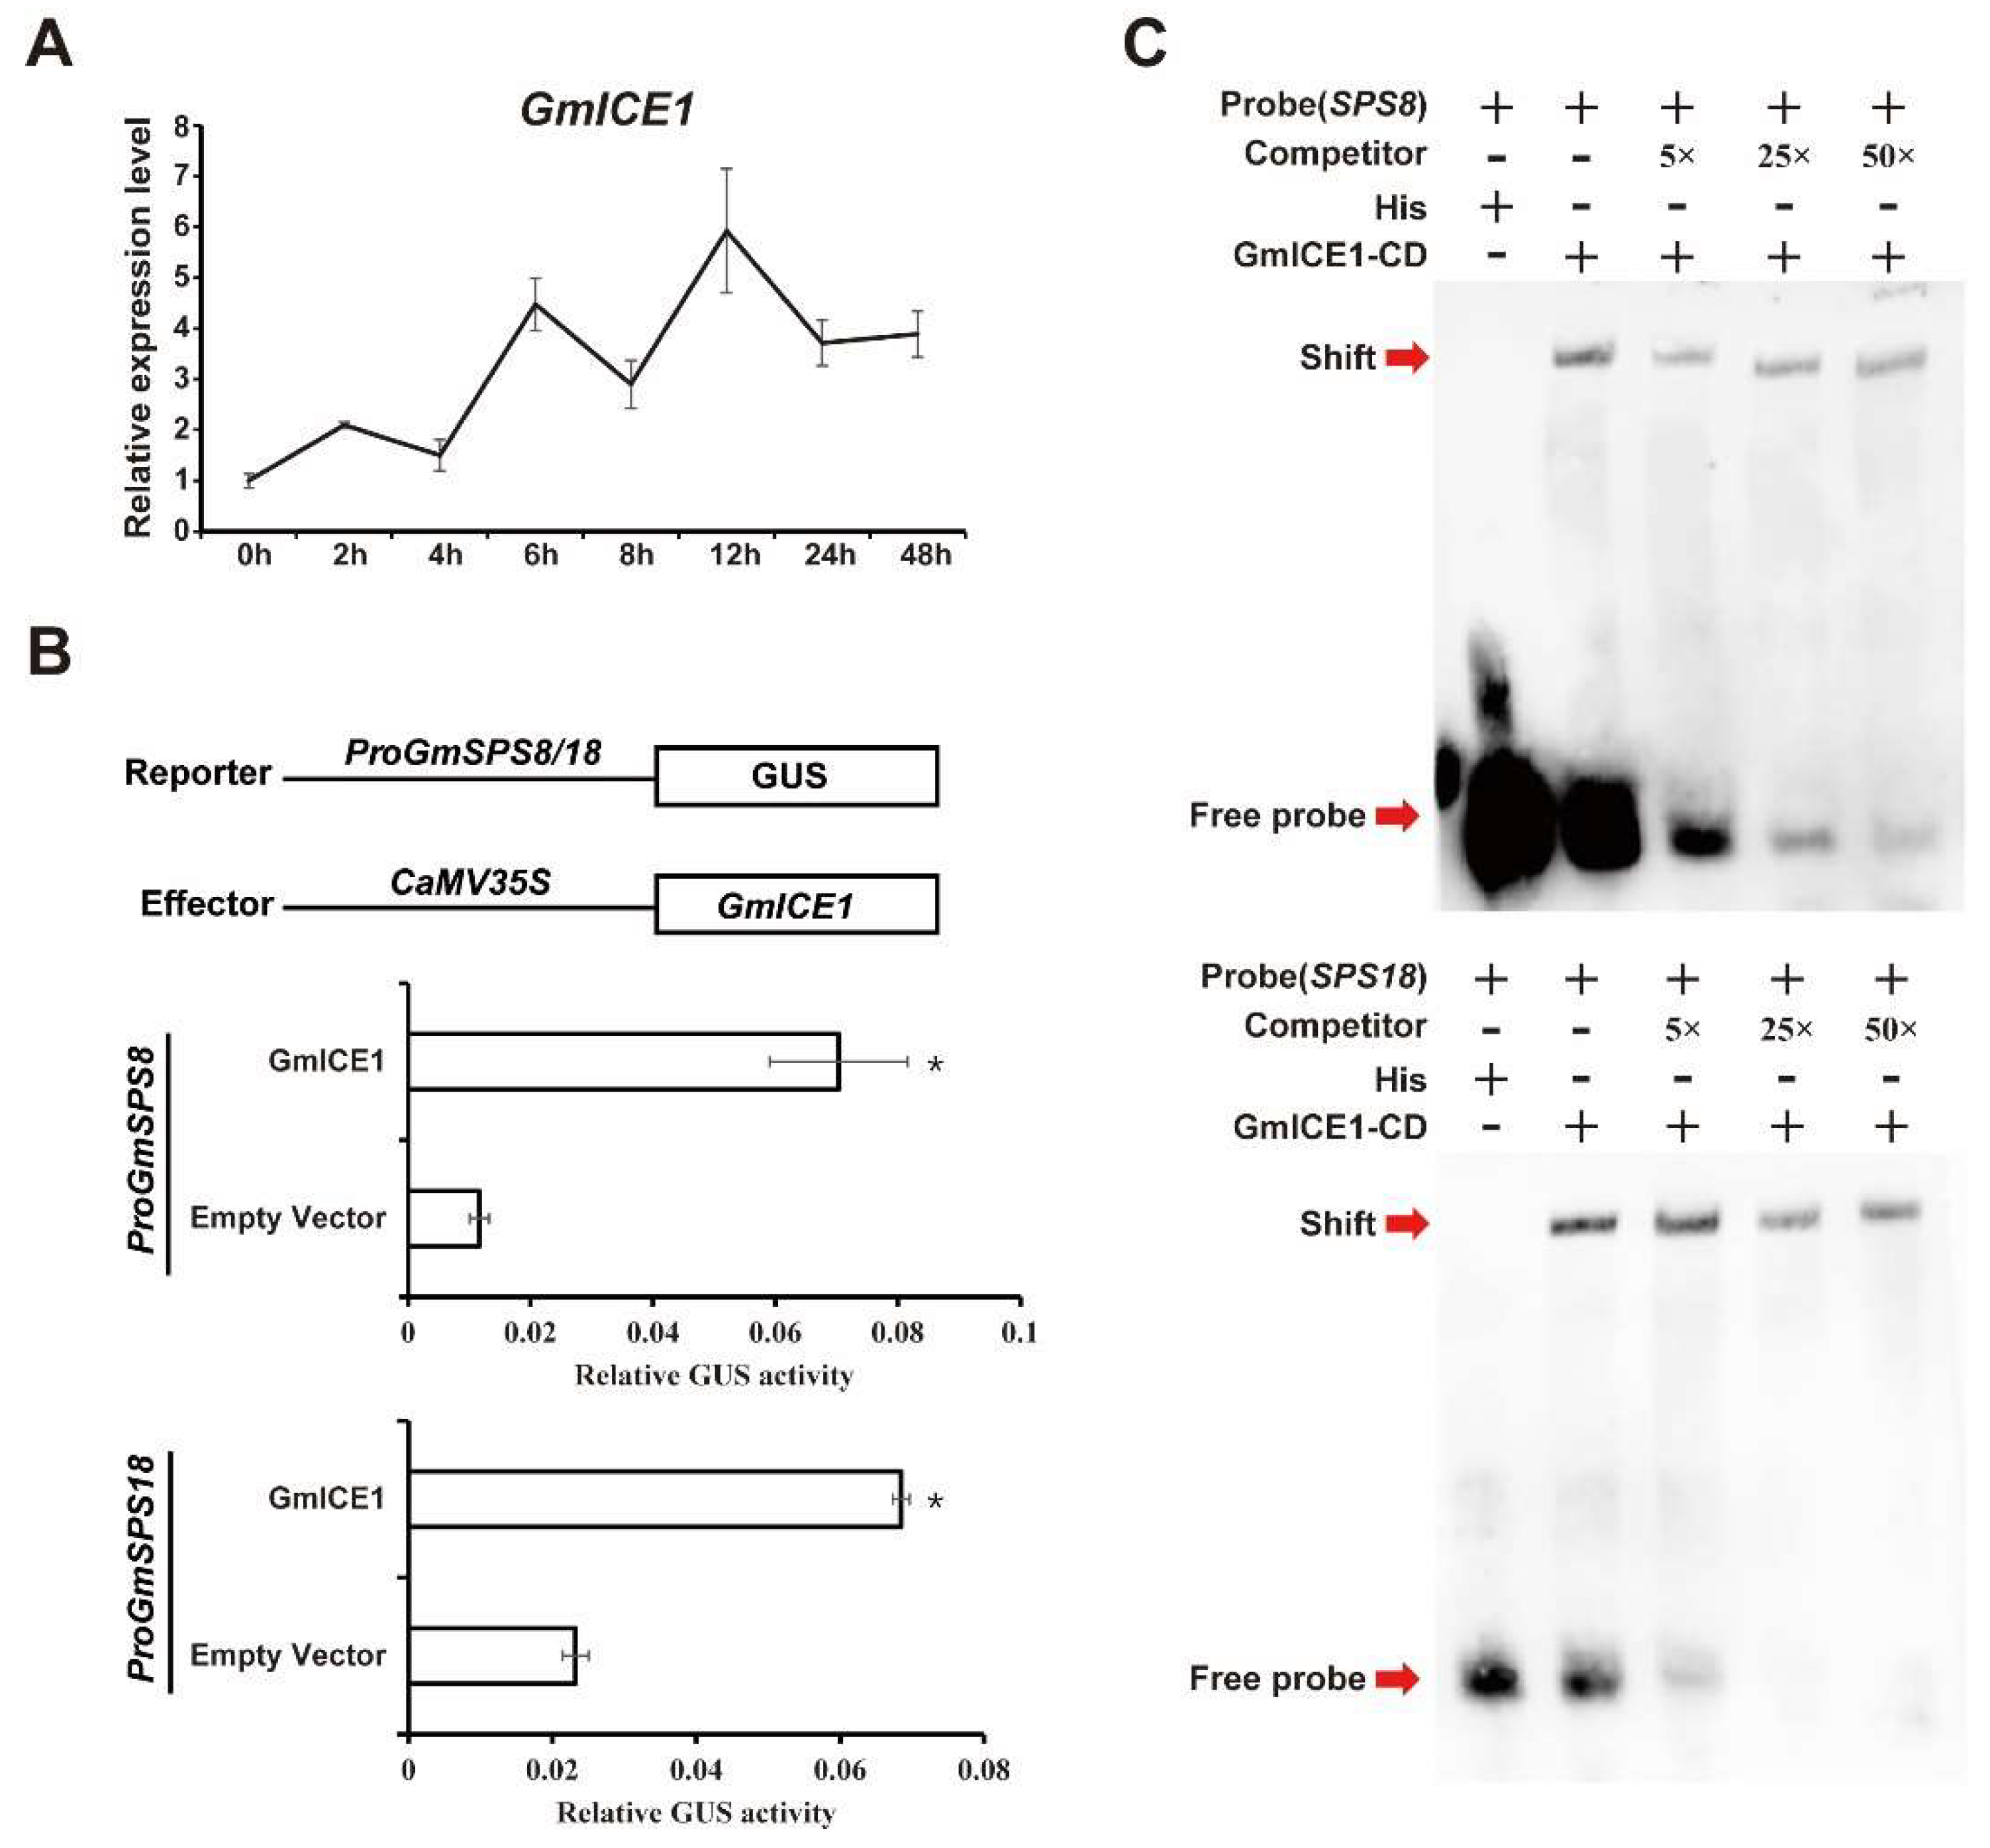
2.9. GmSPS8/18 Were Upregulated by GmICE1 Involved in Cold Stress

The expression of GmSPS genes, especially GmSPS8 and GmSPS18, were significantly upregulated after cold treatment. It was noted that multiple potential binding sites of transcription factor ICE1 existed in the promoter region of GmSPS genes. ICE1 is a central regulator in response to cold stress in plants [9], and GmICE1 is the homolog in soybean. We examined the transcript level of GmICE1 to check whether GmICE1 and GmSPS genes are in a coexpression network. We found that the transcript abundance of GmICE1 was upregulated and reached a peak at 12 h under cold treatment (Figure 8A), which is similar to that of GmSPS8 and GmSPS18. Whether GmICE1 could directly regulate the expression of GmSPS8 and GmSPS18 genes was investigated in transiently transformed tobacco leaves using a GUS reporter assay. The results indicated that tobacco leaves cotransformed with GmICE1 and any one of two soybean promoters produced three- to seven-fold higher value of GUS activity than the control tobacco leaves only transformed with the soybean promoters without GmICE1 (Figure 8B). To verify whether GmICE1 could bind to the promoters of GmSPS8 and GmSPS18 in vitro, EMSAs were conducted. The biotin labeled 50 bp DNA fragment containing CACGTG elements (the putative binding site of ICE1) in GmSPS8 promoter (−66 bp to −115 bp) and in GmSPS18 promoter (−68 bp to −117 bp) were used as probes. Results revealed that recombinant GmICE1-His could bind the biotin-labeled probes, which was weakened by the unlabeled probes in a dose-dependent manner. These data demonstrated that GmICE1 directly bound to GmSPS8 and GmSPS18 promoters (Figure 8C). Taken together, these results confirm that GmICE1 could bind to the promoter regions of GmSPS8 and GmSPS18 in vitro and might activate their transcriptions under cold stress.

3. Discussion

Extreme weather such as low temperature can have a serious impact on the growth of soybean. Previous research showed that the sensitivity of soybean to cold stress varies at different developmental stages [13,14]. Many cold-stress-related genes have been identified through transcriptome analysis in soybean, including CBF/DREB [13]. The ethylene signaling pathway may negatively impact soybean CBF/DREB-regulated cold response by EIN3 [12]. GmTCF1a regulates cold tolerance in soybean and is independent of the CBF pathway [15], but the mechanism underlying cold stress response in soybean remains unclear. In general, sucrose level is increased during cold response of plants. SPS is the key rate-limiting enzyme in the sucrose synthesis pathway in plants [27,28]. Here, we conducted the genome-wide survey of soybean SPS family genes and analyzed their response to cold stress, and our findings showed that the expression of all GmSPS genes increased significantly under cold stress, especially for GmSPS8/18, which can be directly activated by GmICE1 in N. benthamiana. These results provide research ideas and clues for studying soybean cold stress response.
We assessed the phylogenetic relationships of SPS proteins between soybean and other plant species. As previously reported [33,37], all SPS proteins were divided into four families; only SPS proteins from rice belonged to family D. In families A, B, and C, the SPS proteins of legume species were clustered into a small branch, and the SPS proteins of soybean had a closer relationship with that of lotus plants than alfalfa. Different to soybean and lotus, no alfalfa SPS proteins belonged to family C, which was consistent with a previous report [40]. As an ancient tetraploid, soybean has undergone two whole genome duplication events, including an ancient duplication prior to the divergence of papilionoid (58 Mya to 60 Mya) and a Glycine-specific duplication (13 Mya), which resulted in about 75% of the genes being paralogous genes [43]. Three paralogous pairs (GmSPS13/17, GmSPS4/6, and GmSPS8/18) were identified in soybean, and their divergence time was associated with the 13 Mya WGD events. Our analysis shows that GmSPS genes have undergone purification selection during evolution.
The tissue-specific expression pattern was analyzed to understand the potential functions of GmSPS genes. All GmSPS genes are expressed in stem, leaf, petiole, flower, and SAM, but little in root and seed. GmSPS8 has the highest transcript abundance in flower, indicating that itmay play an important function in flower development in soybean. Moreover, the expression level of GmSPS genes in nodules at different developmental stages of soybean were analyzed. The interesting finding was that members of family A (GmSPS13/17) were significantly expressed at branching stage, flowering stage, and fruiting stage, the critical period of symbiotic nitrogen fixation. As the ortholog gene of GmSPS13/17 in alfalfa, SPSA also showed nodule-enhanced expression [40] and was involved in the synthesis of sucrose in nodules [51]. These results indicated that legume SPS members of family A may have the conserved function in carbon metabolism in nodules.
According to the cis-acting elements analysis, GmSPS genes may be involved in response to cold stress. The transcript abundance of all seven GmSPS genes was upregulated in response to cold stress. The expression level of soybean SPS genes in family B (GmSPS8/14/18) and family C (GmSPS4/6) was significantly increased by more than 10 times, and GmSPS18 had the greatest increase (53 times). The transcript level of GmSPS17 was just increased by 2.6 times, and GmSPS13 was slightly upregulated. Our results are similar to the previous studies, which showed that low temperature increased the content and expression level of SPS in chilling-sensitive maize and alfalfa, respectively [52,53]. The transcription levels of many genes are affected under low-temperature stress [54]. Several studies have demonstrated that the ICE1-CBF pathway performs a key role during cold acclimation [55]. In previous studies, the ChIP-seq (chromatin immunoprecipitation sequencing) data of ICE1 indicated that it can bind to the promoter regions of many cold-responsive genes, including CBF and a large number of COR genes [56]. However, it is unknown whether ICE1 could regulate the expression level of SPS genes. Our data suggest that the expression levels of GmSPS8 and GmSPS18 could be activated by GmICE1 using transient expression GUS reporter assays in N. benthamiana. Additionally, the result of EMSA indicates that GmICE1 can directly bind to the promoter regions of GmSPS8/18 in vitro. The PlantPAN prediction results showed that there was no CBF binding site in the promoters of GmSPS8/18. In addition, in Arabidopsis, the expression of AtSPS3 (the orthologous gene of GmSPS8/18) did not significantly change in the cbf123 triple mutant [57]. It is possible that GmSPS8/18 participates in cold stress regulation independently of the CBF pathway in soybean. This may be a new mechanism for soybean plants to resist cold stress.

4. Materials and Methods

4.1. Identification of GmSPS Genes in Soybean

The four known Arabidopsis SPS (AtSPS1/2/3/4) amino acid sequences were extracted from the protein sequence file downloaded from the TAIR site (https://www.arabidopsis.org/) (accessed on 13 June 2022) and then were aligned to a soybean protein sequence file downloaded from the Soybase site (https://www.soybase.org/) (accessed on 13 June 2022) using BLASTP with default parameters [58,59]. In the meantime, the hidden Markov model (HMM) profile files of the SPS conserved domains Sucrose_synth (PF00862), Glycos_transf_1 (PF00534), and S6PP (PF05116) were downloaded from the Pfam site (http://pfam.xfam.org/) (accessed on 13 June 2022) [60]. HMMER (v3.3.2) was used to search the three conserved domains containing proteins in the soybean protein database with default parameter. Subsequently, the candidate soybean SPS proteins which contain the sucrsPsyn_pln were validated with NCBI-CDD (https://www.ncbi.nlm.nih.gov/cdd/) (accessed on 22 July 2022) (Table S1).

4.2. Phylogenetic Analysis of SPS Proteins

To perform the phylogenetic analysis, we integrated SPS protein sequences of soybean, M. truncatula, M. sativa, L. japonicus, Arabidopsis, and rice. The SPS protein sequences of M. truncatula, L. japonicus, and rice were extracted from Phytozome v12 (https://phytozome.jgi.doe.gov) (accessed on 26 August 2022) [25,61]. The M. sativa SPS protein sequences were obtained from https://figshare.com/articles/dataset/Medicago_sativa_genomic_fa_zip/12859889 (accessed on 26 August 2022) [41]. The accession numbers of these SPSs are presented in Table S5. PRANK software (v170427) was used to generate multiple alignments of SPS protein sequences. Next, the alignment results were imported into MEGA11 [62] for phylogenetic analysis using neighbor joining method with JTT + G model and 1000 bootstrap replicates.

4.3. Analysis of Gene Structure and Conserved Motifs

The gene features of GmSPSs were obtained from the annotation file of soybean. In addition, the conserved motifs of seven soybean SPS protein sequences were analyzed by MEME in the MEME-Suite site (https://meme-suite.org/meme/index.html) (accessed on 16 August 2022) [63]. TBtools (v1.120) was used to show the results of gene structure and conserved motifs [64].

4.4. Phosphorylation Sites Analysis in GmSPSs

Seven soybean SPS protein sequences were uploaded to Netphos 3.1 Server (https://services.healthtech.dtu.dk/service.php?NetPhos-3.1) (accessed on 15 August 2022) for phosphorylation sites analysis [65]. The numbers of identified serine, threonine, and tyrosine phosphorylation sites were calculated by the in-house Python script. TBtools was used to draw the heatmaps of phosphorylation sites.

4.5. Chromosomal Location and Collinearity Analysis

The chromosomal location information of all GmSPS genes was obtained from the annotation file of soybean. Furthermore, the chromosomal location figure of GmSPS genes was generated by TBtools. The longest protein-coding transcripts of SPS genes in soybean were screened, and the corresponding protein sequences were extracted. The genome-wide collinearity analysis was carried out by McscanX [66]. Tbtools was used to show the collinearity results. WGD segments pairs were verified using duplicate gene classifier in MCScanX. CDS alignments of each duplicate gene pair of GmSPSs were generated by ParaAT v2 with parameter “-m mafft -f axt -t -g”. Next, KaKs_Calculator 3.0 was used to calculate Ka (nonsynonymous) and Ks (synonymous) using CDS alignment file [67,68]. The divergence time of duplication pairs was calculated using T = Ks/(2 × 6.1 × 10−9) × 10−6 Mya [69].

4.6. cis-Regulatory Element in the Promoter Regions

The cis-regulatory element analyses of 3000 bp upstream sequences from the translation start codon of all GmSPS genes were generated by both PlantCARE (http://bioinformatics.psb.ugent.be/webtools/plantcare/html/) (accessed on 6 November 2022) [70] and PlantPAN (http://plantpan.itps.ncku.edu.tw/promoter_multiple.php) (accessed on 6 November 2022) sites [71]. The putative cis-regulatory elements related to resistance, hormones regulatory, transcription factor binding, etc., were displayed using TBtools.

4.7. Plant Materials and Cold Stress Treatment

At five days after germination, the seedlings of soybean cultivar Tianlong No.1 (TL-1, which was bred by our lab) were transformed to Hoagland nutrient solution under 60% relative humidity with a 12 h/12 h (light/dark) photoperiod at 25 °C. For cold treatment, seedings (V1 stage) were transferred to a low-temperature incubator at 4 °C. The first fully expanded leaves were collected at 0 h, 2 h, 4 h, 6 h, 8 h, 12 h, 24 h, and 48 h after treatment, and immediately frozen in liquid nitrogen then stored at −80 °C for RNA extraction. At each time point of treatment, six plants were harvested, with three biological replicates per sample. Untreated seedlings were used as control.

4.8. RNA Extraction and qRT-PCR Analysis

The qRT-PCR assay was used to analyze the expression pattern of GmSPS genes in various tissues of soybean cultivar TL-1 and soybean leaves under cold treatment. Total RNA was extracted using a TRIpure reagent (Aidlab, Beijing, China) according to the manufacturer’s instruction. The quantity of the extracted RNA samples was further assessed by agarose gel and nanospectrophotometer. The Hiscript II 1st strand cDNA synthesis kit (Vazyme, Nanjing, China) was used to synthesize the first strand of cDNA. The qRT-PCR was performed using iTaq Universal SYBR Green Supermix (Bio-Rad, Hercules, CA, USA) on a Bio-Rad CFX96 Real-Time PCR system. The gene-specific primers of GmSPSs were designed using the primer designing tool of NCBI (https://www.ncbi.nlm.nih.gov/tools/primer-blast/index.cgi) (accessed on 15 June 2022). Meanwhile, GmActin11 (Glyma.18G290800), the expression of which did not change significantly in response to cold, was used as the internal reference gene to adjust the expression level of GmSPS genes. The primers are listed in Table S6. All primers were synthesized by tsingke Biotech (Beijing, China). The qRT-PCR reactions were performed in a 20 μL volume and the cycling program conditions were denaturation at 95 °C for 5 min, followed by 40 cycles of 95 °C for 10 s, 60 °C for 10 s, and 72 °C for 20 s. All samples were performed with three technical and biological repeats. The 2−ΔΔCt method [72] was utilized to analyze the relative expression level of GmSPS genes under cold stress.

4.9. GUS Activity Assay in Transiently Transformed N. benthamiana Leaves

The promoter sequences of GmSPS8 (1956 bp upstream of the ATG) and GmSPS18 (1950 bp upstream of the ATG) were cloned into the PstI/BglII and BamHI/NcoI restriction sites upstream of GUS reporter in the pCAMBIA3301 vector as the reporter constructs. The GmICE1 CDS was constructed into PTF101 vector downstream of the 35S promoter as the effector through homologous recombination. The constructed vectors were transformed into Agrobacterium tumefaciens EHA105 (Tsingke, Beijing, China). Then, the reporters and the effector were transient-expressed in N. benthamiana leaves as previously described [73]. These experiments were repeated at least three times independently. Primers are listed in Table S6.

4.10. Electrophoretic Mobility Shift Assay

The EMSA was performed by generally following the previous method described [74]. The conserved domain sequences (826 bp to 1398 bp) of GmICE1 were cloned into the PET-32a vector. The constructed vector was transformed into the E. coli BL21 (DE3) strain. The recombined protein of GmICE1 was purified using Ni-NTA Agarose (Qiagen, Dusseldorf, Germany). The DNA probes of GmSPS8 and GmSPS18 with biotin label were synthesized by Tsingke. The EMSA probes were obtained through annealing and renaturation of forward and reverse primers. EMSAs were performed using an EMSA Kit (Thermo Fisher Scientific, Waltham, MA, USA). Sequences of the probes and primers are listed in Table S6.

5. Conclusions

In this study, we identified seven SPS genes in soybean genome via genome-wide screening. We carried out a series of analyses, including the phylogenetic relationships, duplications patterns, gene structures, conserved motifs, phosphorylation site, cis-elements, tissue expression patterns, and the expression of GmSPS genes in response to cold stress. We further demonstrated that GmSPS8/18 can be directly activated by GmICE1. These data indicate that GmSPS8/18 play important roles under cold stress. These investigations and analyses could increase our knowledge of the functions of SPS family genes in response to cold stress.

Supplementary Materials

The following supporting information can be downloaded at: https://www.mdpi.com/article/10.3390/ijms241612878/s1.

Author Contributions

J.S., C.Z. and X.Z. conceived and designed the experiments; J.S. and F.J. performed the experiments; J.S. and Y.X. analyzed the data; Y.H., H.C., Z.S., Z.Y. and S.C. contributed reagents/materials/analysis tools; J.S., C.Z. and S.Y. wrote the paper. All authors have read and agreed to the published version of the manuscript.

Funding

This work was supported by Knowledge Innovation Program of Wuhan-Basic Research (2022020801010294), the Agricultural Science and Technology Innovation Program of Chinese Academy of Agricultural Sciences (CAAS-ASTIP-2023-OCRI), the National Key Research and Development Program of China (2020YFD1000903-10).

Institutional Review Board Statement

Not applicable.

Informed Consent Statement

Not applicable.

Data Availability Statement

The datasets used and/or analyzed in this study are available on reasonable request from the corresponding author.

Conflicts of Interest

The authors declare no conflict of interest.

References

  1. Guo, X.; Liu, D.; Chong, K. Cold signaling in plants: Insights into mechanisms and regulation. J. Integr. Plant Biol. 2018, 60, 745–756. [Google Scholar] [PubMed]
  2. Ding, Y.; Shi, Y.; Yang, S. Advances and challenges in uncovering cold tolerance regulatory mechanisms in plants. New Phytol. 2019, 222, 1690–1704. [Google Scholar] [CrossRef] [PubMed]
  3. Ding, Y.; Jia, Y.; Shi, Y.; Zhang, X.; Song, C.; Gong, Z.; Yang, S. OST1-mediated BTF3L phosphorylation positively regulates CBFs during plant cold responses. EMBO J. 2018, 37, e98228. [Google Scholar] [CrossRef] [PubMed]
  4. Chinnusamy, V.; Zhu, J.; Zhu, J.K. Cold stress regulation of gene expression in plants. Trends Plant Sci. 2007, 12, 444–451. [Google Scholar] [CrossRef]
  5. Stockinger, E.J.; Gilmour, S.J.; Thomashow, M.F. Arabidopsis thaliana CBF1 encodes an AP2 domain-containing transcriptional activator that binds to the C-repeat/DRE, a cis-acting DNA regulatory element that stimulates transcription in response to low temperature and water deficit. Proc. Natl. Acad. Sci. USA 1997, 94, 1035–1040. [Google Scholar] [CrossRef]
  6. Jaglo, K.R.; Kleff, S.; Amundsen, K.L.; Zhang, X.; Haake, V.; Zhang, J.Z.; Deits, T.; Thomashow, M.F. Components of the Arabidopsis C-repeat/dehydration-responsive element binding factor cold-response pathway are conserved in Brassica napus and other plant species. Plant Physiol. 2001, 127, 910–917. [Google Scholar] [CrossRef]
  7. Jaglo-Ottosen, K.R.; Gilmour, S.J.; Zarka, D.G.; Schabenberger, O.; Thomashow, M.F. Arabidopsis CBF1 overexpression induces COR genes and enhances freezing tolerance. Science 1998, 280, 104–106. [Google Scholar] [CrossRef]
  8. Gilmour, S.J.; Sebolt, A.M.; Salazar, M.P.; Everard, J.D.; Thomashow, M.F. Overexpression of the Arabidopsis CBF3 transcriptional activator mimics multiple biochemical changes associated with cold acclimation. Plant Physiol. 2000, 124, 1854–1865. [Google Scholar] [CrossRef]
  9. Chinnusamy, V.; Ohta, M.; Kanrar, S.; Lee, B.H.; Hong, X.; Agarwal, M.; Zhu, J.K. ICE1: A regulator of cold-induced transcriptome and freezing tolerance in Arabidopsis. Genes Dev. 2003, 17, 1043–1054. [Google Scholar] [CrossRef]
  10. Wilson, R.F. Soybean: Market Driven Research Needs; Springer: New York, NY, USA, 2008. [Google Scholar]
  11. Maruyama, K.; Takeda, M.; Kidokoro, S.; Yamada, K.; Sakuma, Y.; Urano, K.; Fujita, M.; Yoshiwara, K.; Matsukura, S.; Morishita, Y.; et al. Metabolic pathways involved in cold acclimation identified by integrated analysis of metabolites and transcripts regulated by DREB1A and DREB2A. Plant Physiol. 2009, 150, 1972–1980. [Google Scholar] [CrossRef]
  12. Robison, J.D.; Yamasaki, Y.; Randall, S.K. The ethylene signaling pathway negatively impacts CBF/DREB-regulated cold re sponse in soybean (Glycine max). Front. Plant Sci. 2019, 10, 121. [Google Scholar] [CrossRef] [PubMed]
  13. Yamasaki, Y.; Randall, S.K. Functionality of soybean CBF/DREB1 transcription factors. Plant Sci. 2016, 246, 80–90. [Google Scholar] [CrossRef] [PubMed]
  14. Wang, Z.; Reddy, V.R.; Quebedeaux, B. Growth and photosynthetic responses of soybean to short-term cold temperature. Environ. Exp. Bot. 1997, 37, 13–24. [Google Scholar] [CrossRef]
  15. Dong, Z.; Wang, H.; Li, X.; Ji, H. Enhancement of plant cold tolerance by soybean RCC1 family gene GmTCF1a. BMC Plant Biol. 2021, 21, 369. [Google Scholar] [CrossRef]
  16. Ji, H.; Wang, Y.; Cloix, C.; Li, K.; Jenkins, G.I.; Wang, S.; Shang, Z.; Shi, Y.; Yang, S.; Li, X. The Arabidopsis RCC1 family protein TCF1 regulates freezing tolerance and cold acclimation through modulating lignin biosynthesis. PLoS Genet. 2015, 11, e1005471. [Google Scholar] [CrossRef]
  17. Rathinasabapathi, B. Metabolic engineering for stress tolerance: Installing osmoprotectant synthesis pathways. Ann. Bot. 2000, 86, 709–716. [Google Scholar] [CrossRef]
  18. Wanner, L.A.; Junttila, O. Cold-induced freezing tolerance in Arabidopsis. Plant Physiol. 1999, 120, 391–400. [Google Scholar] [CrossRef]
  19. Zúñiga-Feest, A.; Ort, D.R.; Gutiérrez, A.; Gidekel, M.; Bravo, L.A.; Corcuera, L.J. Light regulation of sucrose-phosphate synthase activity in the freezing-tolerant grass Deschampsia antarctica. Photosynth. Res. 2005, 83, 75–86. [Google Scholar] [CrossRef]
  20. Bauerfeind, M.A.; Winkelmann, T.; Franken, P.; Druege, U. Transcriptome, carbohydrate, and phytohormone analysis of Petunia hybrida reveals a complex disturbance of plant functional integrity under mild chilling stress. Front. Plant Sci. 2015, 6, 583. [Google Scholar] [CrossRef]
  21. Peng, T.; Zhu, X.; Duan, N.; Liu, J.H. PtrBAM1, a β-amylase-coding gene of Poncirus trifoliata, is a CBF regulon member with function in cold tolerance by modulating soluble sugar levels. Plant Cell Environ. 2014, 37, 2754–2767. [Google Scholar] [CrossRef]
  22. Dong, S.; Beckles, D.M. Dynamic changes in the starch-sugar interconversion within plant source and sink tissues promote a better abiotic stress response. J. Plant Physiol. 2019, 234–235, 80–93. [Google Scholar] [CrossRef] [PubMed]
  23. Rolland, F.; Moore, B.; Sheen, J. Sugar sensing and signaling in plants. Plant Cell 2002, 14 (Suppl. S1), 185–205. [Google Scholar] [CrossRef] [PubMed]
  24. Park, J.Y.; Canam, T.; Kang, K.Y.; Ellis, D.D.; Mansfield, S.D. Over-expression of an Arabidopsis family A sucrose phosphate synthase (SPS) gene alters plant growth and fibre development. Transgenic Res. 2008, 17, 181–192. [Google Scholar] [CrossRef] [PubMed]
  25. Okamura, M.; Aoki, N.; Hirose, T.; Yonekura, M.; Ohto, C.; Ohsugi, R. Tissue specificity and diurnal change in gene expression of the sucrose phosphate synthase gene family in rice. Plant Sci. 2011, 181, 159–166. [Google Scholar] [CrossRef]
  26. Volkert, K.; Debast, S.; Voll, L.M.; Voll, H.; Schießl, I.; Hofmann, J.; Schneider, S.; Börnke, F. Loss of the two major leaf isoforms of sucrose-phosphate synthase in Arabidopsis thaliana limits sucrose synthesis and nocturnal starch degradation but does not alter carbon partitioning during photosynthesis. J. Exp. Bot. 2014, 65, 5217–5229. [Google Scholar] [CrossRef]
  27. Haigler, C.H.; Singh, B.; Zhang, D.; Hwang, S.; Wu, C.; Cai, W.X.; Hozain, M.; Kang, W.; Kiedaisch, B.; Strauss, R.E.; et al. Transgenic cotton over-producing spinach sucrose phosphate synthase showed enhanced leaf sucrose synthesis and improved fiber quality under controlled environmental conditions. Plant Mol. Biol. 2007, 63, 815–832. [Google Scholar] [CrossRef]
  28. Miron, D.; Schaffer, A.A. Sucrose phosphate synthase, sucrose synthase, and invertase activities in developing fruit of Lycopersicon esculentum Mill. and the sucrose accumulating Lycopersicon hirsutum Humb. and Bonpl. Plant Physiol. 1991, 95, 623–627. [Google Scholar] [CrossRef]
  29. Dali, N.; Michaud, D.; Yelle, S. Evidence for the involvement of sucrose phosphate synthase in the pathway of sugar accumulation in sucrose-accumulating tomato fruits. Plant Physiol. 1992, 99, 434–438. [Google Scholar] [CrossRef]
  30. do Nascimento, J.R.; Cordenunsi, B.R.; Lajolo, F.M.; Alcocer, M.J. Banana sucrose-phosphate synthase gene expression during fruit ripening. Planta 1997, 203, 83–88. [Google Scholar] [CrossRef]
  31. Guy, C.L.; Huber, J.L.; Huber, S.C. Sucrose phosphate synthase and sucrose accumulation at low temperature. Plant Physiol. 1992, 100, 502–508. [Google Scholar] [CrossRef]
  32. Huang, T.; Luo, X.; Wei, M.; Shan, Z.; Zhu, Y.; Yang, Y.; Fan, Z. Molecular cloning and expression analysis of sucrose phosphate synthase genes in cassava (Manihot esculenta Crantz). Sci. Rep. 2020, 10, 20707. [Google Scholar] [CrossRef] [PubMed]
  33. Lutfiyya, L.L.; Xu, N.; D’Ordine, R.L.; Morrell, J.A.; Miller, P.W.; Duff, S.M. Phylogenetic and expression analysis of sucrose phosphate synthase isozymes in plants. J. Plant Physiol. 2007, 164, 923–933. [Google Scholar] [CrossRef] [PubMed]
  34. Duan, Y.; Yang, L.; Zhu, H.; Zhou, J.; Sun, H.; Gong, H. Structure and expression analysis of sucrose phosphate synthase, sucrose synthase and invertase gene families in Solanum lycopersicum. Int. J. Mol. Sci. 2021, 22, 4698. [Google Scholar] [CrossRef] [PubMed]
  35. Sharma, S.; Sreenivasulu, N.; Harshavardhan, V.T.; Seiler, C.; Sharma, S.; Khalil, Z.N.; Akhunov, E.; Sehgal, S.K.; Röder, M.S. Delineating the structural, functional and evolutionary relationships of sucrose phosphate synthase gene family II in wheat and related grasses. BMC Plant Biol. 2010, 10, 134. [Google Scholar] [CrossRef]
  36. Wang, D.; Zhao, J.; Hu, B.; Li, J.; Qin, Y.; Chen, L.; Qin, Y.; Hu, G. Identification and expression profile analysis of the sucrose phosphate synthase gene family in Litchi chinensis Sonn. PeerJ 2018, 6, e4379. [Google Scholar] [CrossRef]
  37. Castleden, C.K.; Aoki, N.; Gillespie, V.J.; MacRae, E.A.; Quick, W.P.; Buchner, P.; Foyer, C.H.; Furbank, R.T.; Lunn, J.E. Evolution and function of the sucrose-phosphate synthase gene families in wheat and other grasses. Plant Physiol. 2004, 135, 1753–1764. [Google Scholar] [CrossRef]
  38. Huber, S.C. Biochemical basis for effects of k-deficiency on assimilate export rate and accumulation of soluble sugars in soybean leaves. Plant Physiol. 1984, 76, 424–430. [Google Scholar] [CrossRef]
  39. Du, Y.; Zhao, Q.; Chen, L.; Yao, X.; Zhang, H.; Wu, J.; Xie, F. Effect of drought stress during soybean R2-R6 growth stages on sucrose metabolism in leaf and seed. Int. J. Mol. Sci. 2020, 21, 618. [Google Scholar] [CrossRef]
  40. Aleman, L.; Ortega, J.L.; Martinez-Grimes, M.; Seger, M.; Holguin, F.O.; Uribe, D.J.; Garcia-Ibilcieta, D.; Sengupta-Gopalan, C. Nodule-enhanced expression of a sucrose phosphate synthase gene member (MsSPSA) has a role in carbon and nitrogen metabolism in the nodules of alfalfa (Medicago sativa L.). Planta 2010, 231, 233–244. [Google Scholar] [CrossRef]
  41. Li, A.; Liu, A.; Du, X.; Chen, J.Y.; Yin, M.; Hu, H.Y.; Shrestha, N.; Wu, S.D.; Wang, H.Q.; Dou, Q.W.; et al. A chromosome-scale genome assembly of a diploid alfalfa, the progenitor of autotetraploid alfalfa. Hortic. Res. 2020, 7, 194. [Google Scholar] [CrossRef]
  42. Schmutz, J.; Cannon, S.B.; Schlueter, J.; Ma, J.; Mitros, T.; Nelson, W.; Hyten, D.L.; Song, Q.; Thelen, J.J.; Cheng, J.; et al. Genome sequence of the palaeopolyploid soybean. Nature 2010, 463, 178–183. [Google Scholar] [CrossRef] [PubMed]
  43. Zhao, W.; Cheng, Y.; Zhang, C.; You, Q.; Shen, X.; Guo, W.; Jiao, Y. Genome-wide identification and characterization of circular RNAs by high throughput sequencing in soybean. Sci. Rep. 2017, 7, 5636. [Google Scholar] [CrossRef] [PubMed]
  44. Fang, Y.; Cao, D.; Yang, H.; Guo, W.; Ouyang, W.; Chen, H.; Shan, Z.; Yang, Z.; Chen, S.; Li, X.; et al. Genome-wide identification and characterization of soybean GmLOR gene family and expression analysis in response to abiotic stresses. Int. J. Mol. Sci. 2021, 22, 12515. [Google Scholar] [CrossRef] [PubMed]
  45. Salih, H.; Gong, W.; He, S.; Sun, G.; Sun, J.; Du, X. Genome-wide characterization and expression analysis of MYB transcription factors in Gossypium hirsutum. BMC Genet. 2016, 17, 129. [Google Scholar] [CrossRef] [PubMed]
  46. Andersson, R.; Sandelin, A. Determinants of enhancer and promoter activities of regulatory elements. Nat. Rev. Genet. 2020, 21, 71–87. [Google Scholar] [CrossRef]
  47. Yuan, S.L.; Li, R.; Chen, H.F.; Zhang, C.J.; Chen, L.M.; Hao, Q.N.; Chen, S.L.; Shan, Z.H.; Yang, Z.L.; Zhang, X.J.; et al. RNA-Seq analysis of nodule development at five different developmental stages of soybean (Glycine max) inoculated with Bradyrhizobium japonicum strain 113-2. Sci. Rep. 2017, 7, 42248. [Google Scholar] [CrossRef]
  48. Liang, Y.; Zhang, M.; Wang, M.; Zhang, W.; Qiao, C.; Luo, Q.; Lu, X. Freshwater Cyanobacterium Synechococcus elongatus PCC 7942 adapts to an environment with salt stress via ion-induced enzymatic balance of dompatible solutes. Appl. Environ. Microbiol. 2020, 86, e02904-19. [Google Scholar] [CrossRef]
  49. Yang, J.; Zhang, J.; Wang, Z.; Zhu, Q. Activities of starch hydrolytic enzymes and sucrose-phosphate synthase in the stems of rice subjected to water stress during grain filling. J. Exp. Bot. 2001, 52, 2169–2179. [Google Scholar] [CrossRef]
  50. Solís-Guzmán, M.G.; Argüello-Astorga, G.; López-Bucio, J.; Ruiz-Herrera, L.F.; López-Meza, J.E.; Sánchez-Calderón, L.; Carreón-Abud, Y.; Martínez-Trujillo, M. Arabidopsis thaliana sucrose phosphate synthase (sps) genes are expressed differentially in organs and tissues, and their transcription is regulated by osmotic stress. Gene Expr. Patterns 2017, 25–26, 92–101. [Google Scholar] [CrossRef]
  51. Padhi, S.; Grimes, M.M.; Muro-Villanueva, F.; Ortega, J.L.; Sengupta-Gopalan, C. Distinct nodule and leaf functions of two different sucrose phosphate synthases in alfalfa. Planta 2019, 250, 1743–1755. [Google Scholar] [CrossRef]
  52. Bilska-Kos, A.; Mytych, J.; Suski, S.; Magoń, J.; Ochodzki, P.; Zebrowski, J. Sucrose phosphate synthase (SPS), sucrose synthase (SUS) and their products in the leaves of Miscanthus × giganteus and Zea mays at low temperature. Planta 2020, 252, 23. [Google Scholar] [CrossRef]
  53. Bertrand, A.; Bipfubusa, M.; Claessens, A.; Rocher, S.; Castonguay, Y. Effect of photoperiod prior to cold acclimation on freezing tolerance and carbohydrate metabolism in alfalfa (Medicago sativa L.). Plant Sci. 2017, 264, 122–128. [Google Scholar] [CrossRef]
  54. Zeller, G.; Henz, S.R.; Widmer, C.K.; Sachsenberg, T.; Rätsch, G.; Weigel, D.; Laubinger, S. Stress-induced changes in the Ara bidopsis thaliana transcriptome analyzed using whole-genome tiling arrays. Plant J. 2009, 58, 1068–1082. [Google Scholar] [CrossRef] [PubMed]
  55. Kim, Y.S.; Lee, M.; Lee, J.H.; Lee, H.J.; Park, C.M. The unified ICE-CBF pathway provides a transcriptional feedback control of freezing tolerance during cold acclimation in Arabidopsis. Plant Mol. Biol. 2015, 89, 187–201. [Google Scholar] [CrossRef] [PubMed]
  56. Tang, K.; Zhao, L.; Ren, Y.; Yang, S.; Zhu, J.K.; Zhao, C. The transcription factor ICE1 functions in cold stress response by binding to the promoters of CBF and COR genes. J. Integr. Plant Biol. 2020, 62, 258–263. [Google Scholar] [CrossRef]
  57. Shi, Y.; Huang, J.; Sun, T.; Wang, X.; Zhu, C.; Ai, Y.; Gu, H. The precise regulation of different COR genes by individual CBF transcription factors in Arabidopsis thaliana. J. Integr. Plant Biol. 2017, 59, 118–133. [Google Scholar] [CrossRef] [PubMed]
  58. Langenkämper, G.; Fung, R.W.; Newcomb, R.D.; Atkinson, R.G.; Gardner, R.C.; MacRae, E.A. Sucrose phosphate synthase genes in plants belong to three different families. J. Mol. Evol. 2002, 54, 322–332. [Google Scholar] [CrossRef]
  59. Camacho, C.; Coulouris, G.; Avagyan, V.; Ma, N.; Papadopoulos, J.; Bealer, K.; Madden, T.L. BLAST+: Architecture and appli cations. BMC Bioinform. 2009, 10, 421. [Google Scholar] [CrossRef]
  60. Mistry, J.; Chuguransky, S.; Williams, L.; Qureshi, M.; Salazar, G.A.; Sonnhammer, E.L.L.; Tosatto, S.C.E.; Paladin, L.; Raj, S.; Richardson, L.J.; et al. Pfam: The protein families database in 2021. Nucleic Acids Res. 2021, 49, 412–419. [Google Scholar] [CrossRef]
  61. Goodstein, D.M.; Shu, S.; Howson, R.; Neupane, R.; Hayes, R.D.; Fazo, J.; Mitros, T.; Dirks, W.; Hellsten, U.; Putnam, N.; et al. Phytozome: A comparative platform for green plant genomics. Nucleic Acids Res. 2012, 40, 1178–1186. [Google Scholar] [CrossRef]
  62. Tamura, K.; Stecher, G.; Kumar, S. MEGA11: Molecular evolutionary genetics analysis version 11. Mol. Biol. Evol. 2021, 38, 3022–3027. [Google Scholar] [CrossRef] [PubMed]
  63. Bailey, T.L.; Johnson, J.; Grant, C.E.; Noble, W.S. The MEME Suite. Nucleic Acids Res. 2015, 43, 39–49. [Google Scholar] [CrossRef] [PubMed]
  64. Chen, C.; Chen, H.; Zhang, Y.; Thomas, H.R.; Frank, M.H.; He, Y.; Xia, R. TBtools: An integrative toolkit developed for interac tive analyses of big biological data. Mol. Plant 2020, 13, 1194–1202. [Google Scholar] [CrossRef]
  65. Blom, N.; Sicheritz-Pontén, T.; Gupta, R.; Gammeltoft, S.; Brunak, S. Prediction of post-translational glycosylation and phos phorylation of proteins from the amino acid sequence. Proteomics 2004, 4, 1633–1649. [Google Scholar] [CrossRef] [PubMed]
  66. Wang, Y.; Tang, H.; Debarry, J.D.; Tan, X.; Li, J.; Wang, X.; Lee, T.H.; Jin, H.; Marler, B.; Guo, H.; et al. MCScanX: A toolkit for detection and evolutionary analysis of gene synteny and collinearity. Nucleic Acids Res. 2012, 40, e49. [Google Scholar] [CrossRef] [PubMed]
  67. Zhang, Z.; Xiao, J.; Wu, J.; Zhang, H.; Liu, G.; Wang, X.; Dai, L. ParaAT: A parallel tool for constructing multiple protein-coding DNA alignments. Biochem. Biophys. Res. Commun. 2012, 419, 779–781. [Google Scholar] [CrossRef] [PubMed]
  68. Zhang, Z. KaKs_calculator 3.0: Calculating selective pressure on coding and non-coding sequences. Genom. Proteom. Bioinform. 2022, 20, 536–540. [Google Scholar] [CrossRef]
  69. Lynch, M.; Conery, J.S. The evolutionary fate and consequences of duplicate genes. Science 2000, 290, 1151–1155. [Google Scholar] [CrossRef]
  70. Lescot, M.; Déhais, P.; Thijs, G.; Marchal, K.; Moreau, Y.; Van de Peer, Y.; Rouzé, P.; Rombauts, S. PlantCARE, a database of plant cis-acting regulatory elements and a portal to tools for in silico analysis of promoter sequences. Nucleic Acids Res. 2002, 30, 325–327. [Google Scholar] [CrossRef]
  71. Chow, C.N.; Lee, T.Y.; Hung, Y.C.; Li, G.Z.; Tseng, K.C.; Liu, Y.H.; Kuo, P.L.; Zheng, H.Q.; Chang, W.C. PlantPAN3.0: A new and updated resource for reconstructing transcriptional regulatory networks from ChIP-seq experiments in plants. Nucleic Acids Res. 2019, 47, 1155–1163. [Google Scholar] [CrossRef]
  72. Xia, W.; Mason, A.S.; Xiao, Y.; Liu, Z.; Yang, Y.; Lei, X.; Wu, X.; Ma, Z.; Peng, M. Analysis of multiple transcriptomes of the African oil palm (Elaeis guineensis) to identify reference genes for RT-qPCR. J. Biotechnol. 2014, 184, 63–73. [Google Scholar] [CrossRef] [PubMed]
  73. Li, X.; Guo, W.; Li, J.; Yue, P.; Bu, H.; Jiang, J.; Liu, W.; Xu, Y.; Yuan, H.; Li, T.; et al. Histone acetylation at the promoter for the transcription factor PuWRKY31 affects sucrose accumulation in pear fruit. Plant Physiol. 2020, 182, 2035–2046. [Google Scholar] [CrossRef] [PubMed]
  74. Li, M.; Zhang, H.; He, D.; Damaris, R.N.; Yang, P. A stress-associated protein OsSAP8 modulates gibberellic acid biosynthesis by reducing the promotive effect of transcription factor OsbZIP58 on OsKO2. J. Exp. Bot. 2022, 73, 2420–2433. [Google Scholar] [CrossRef] [PubMed]
Figure 1. Phylogenetic analysis of SPS proteins. The tree was constructed and relied on the amino acid sequences by MEGA11 using neighbor joining method with JTT + G model and 1000 bootstrap replicates. Solid small circles with different colors are standard for bootstrap values. The tree can be categorized into four groups with different colors. The red, orange, green, and blue colors represent A–D groups, respectively. Different shapes indicate different species.
Ijms 24 12878 g001
Figure 2. Collinearity analysis of SPS genes in soybean. The different colored lines connect two genes with collinearity. The gray lines represent other collinearity regions in the genome of soybean.
Ijms 24 12878 g002
Figure 3. The gene structure and conserved motifs of GmSPSs. (A) The gene structure of GmSPS genes. The GmSPSs classified into three groups based on the phylogenetic relationships. The filled boxes and lines represent exons and introns, respectively. The blue and yellow boxes represent UTR and CDS, respectively. (B) Conserved motifs in GmSPS proteins. Boxes with different colors represent 15 different conserved motifs. The position and size of GmSPS genes and the corresponding proteins can be estimated by the scale at the bottom.
Ijms 24 12878 g003
Figure 4. Phosphorylation sites analyses in SPS proteins. (A) The protein sequences alignment of GmSPSs. The red, black, and yellow arrows indicate Ser-158, Ser-229, and Ser-424 phosphorylation sites, respectively. Glycos transf_1 domain and S6PP domain are marked with black solid line and black dotted line, respectively. The alignment sequences are shown in jalview using Clustal colourscheme. (B) Ser-158, Ser-229, and Ser-424 phosphorylation sites in SPS families of soybean, Arabidopsis, and rice.
Ijms 24 12878 g004
Figure 5. The cis-element analysis of GmSPSs promoter regions. Different colored boxes represent various elements. These asterisks represent potential binding sites of transcription factor ICE1. The positions of the cis-elements are shown at the bottom.
Ijms 24 12878 g005
Figure 6. Expression profile of seven GmSPS genes in different tissues of soybean. (A) Expression patterns of GmSPS genes in soybean tissues. The expression value was obtained by qRT-PCR. At the right of the figure, different colors indicate the gene transcript abundance values. (B) Expression patterns of GmSPS genes in soybean nodules at different stages. FPKM values of GmSPS genes were obtained from published data [47]. Different colors of the heat map indicate the gene transcript abundance values.
Ijms 24 12878 g006
Figure 7. Relative expression levels of GmSPS genes in response to cold stress. RNA was extracted from treated leaves at 0 h, 2 h, 4 h, 6 h, 8 h, 12 h, 24 h, and 48 h, and qRT-PCR was performed using the specific primers of GmSPS genes. GmActin11 was used as the internal reference. Treatments at each time point have their own controls, and expression at 0 h was set as “1”. The results represent the mean ± SD of three independent biological repetitions.
Ijms 24 12878 g007
Figure 8. GmSPS8 and GmSPS18 transcriptions were directly activated by GmICE1. (A) Relative expression level of GmICE1 in response to cold stress. The expression value was obtained by qRT-PCR. GmActin11 was used as the internal reference. (B) GmICE1 promotes transcription of GmSPS8/18. The promoters of GmSPS8 and GmSPS18 are inserted in GUS reporter vector; in the meantime, the effector vector contains GmICE1. The vectors were coinfiltrated into N. benthamiana leaves to analyze the GUS activity. These results represent the mean ± SD of three independent biological repetitions. Asterisks represent the significant difference as determined by Student’s t-test (* p < 0.05). (C) EMSA showed the binding of GmICE1 to the promoters of GmSPS8 and GmSPS18 in vitro. The conserved domain of GmICE1 was expressed in Escherichia coli BL21 (DE3) cells to produce His-tagged GmICE1 protein. The recombinant protein was purified by Ni-NTA Agarose. Probe indicates DNA sequence with biotin label and the competitor is the same as the DNA sequence but without the biotin label. Red arrows indicate the positions of protein-probe complexes or free probes.
Ijms 24 12878 g008
Table 1. All seven GmSPS genes, including their genome location and physical properties.
Gene
Name
Gene
ID
Genome
Location
Transcript
Numbers
Protein Size
(aa)
MW
(kDa)
pISubcellular
Location
GmSPS4Glyma.04g110200Chr04: 11369193-11375676 177887.585.99Cytoplasm
GmSPS6Glyma.06g323700Gm06: 50675372-50684602 11038117.096.31Nucleus
GmSPS8Glyma.08g308600Gm08: 42128704-42135717 11056118.806.18Cytoplasm
GmSPS13Glyma.13g161600Gm13: 27135652-27142180 51060118.016.04Nucleus
GmSPS14Glyma.14g029100Gm14: 2121804-2128414 21064119.335.94Cytoplasm
GmSPS17Glyma.17g109700Gm17: 8599983-8606617 41060118.086.09Nucleus
GmSPS18Glyma.18g108100Gm18: 12235657-12242570 11054118.396.1Nucleus
Table 2. Identification of substitution rates for homologous GmSPS genes.
Segmental Duplicated GenesMethodKaKsKa/KsT (Mya)
GmSPS17-GmSPS13MA0.0124840.1107690.1127049.079426
GmSPS18-GmSPS14MA0.0748920.6342490.11807951.98762
GmSPS6-GmSPS4MA0.0601170.0995710.603768.161582
GmSPS8-GmSPS14MA0.0681670.6400310.10650552.46156
GmSPS8-GmSPS18MA0.0147380.1182580.1246289.693279
Ka: non-syn substitution rate, Ks: syn substitution rate, T: duplication date.
Disclaimer/Publisher’s Note: The statements, opinions and data contained in all publications are solely those of the individual author(s) and contributor(s) and not of MDPI and/or the editor(s). MDPI and/or the editor(s) disclaim responsibility for any injury to people or property resulting from any ideas, methods, instructions or products referred to in the content.

