Abstract
Coumarin and its derivatives are plant-derived compounds that exhibit potent insecticidal properties. In this study, we found that natural coumarin significantly inhibited the growth and development of Spodoptera litura larvae through toxicological assay. By transcriptomic sequencing, 80 and 45 differentially expressed genes (DEGs) related to detoxification were identified from 0 to 24 h and 24 to 48 h in S. litura after coumarin treatment, respectively. Enzyme activity analysis showed that CYP450 and acetylcholinesterase (AChE) activities significantly decreased at 48 h after coumarin treatment, while glutathione S-transferases (GST) activity increased at 24 h. Silencing of SlCYP324A16 gene by RNA interference significantly increased S. litura larval mortality and decreased individual weight after treatment with coumarin. Additionally, the expression levels of DEGs involved in glycolysis and tricarboxylic acid (TCA) cycle were inhibited at 24 h after coumarin treatment, while their expression levels were upregulated at 48 h. Furthermore, metabonomics analysis identified 391 differential metabolites involved in purine metabolism, amino acid metabolism, and TCA cycle from 0 to 24 h after treated with coumarin and 352 differential metabolites associated with ATP-binding cassette (ABC) transporters and amino acid metabolism. These results provide an in-depth understanding of the toxicological mechanism of coumarin on S. litura.
1. Introduction
Spodoptera litura (Lepidoptera: Noctuidae) is a globally destructive pest that damages multiple host plants and causes enormous economic losses [1]. It has three developmental stages, including the larval, pupal, and adult phases. The larval stage is the most critical for feeding and crop damage [2,3]. Currently, S. litura is controlled primarily using chemical insecticides. However, the inappropriate use of insecticides leads to adverse effects on human health and environment sustainability [4,5]. Therefore, developing pollution-free and environmentally friendly biocontrol strategies are urgently needed.
Plants produce a variety of secondary metabolites to protect themselves against predators such as herbivores and pathogens [6]. Coumarin is a phenolic compound that metabolizes into a toxic compound and affects the gut [7]. In plants, phenolic compounds are one of the most common and widespread groups of secondary metabolites [8]. The oxidation of phenol is catalyzed by polyphenol oxidase and peroxidase, a potential defense mechanism in plants against insect herbivores [9]. Recent studies have demonstrated that natural coumarin and its derivatives exhibit strong insecticidal activity [10]. Poudel et al. reported that coumarin had a toxic effect on Drosophila melanogaster through activation of the aversive gustatory receptor neurons (GNRs), and that gustatory receptor 33 (GR33) is required for oviposition to avoid coumarin-laced food [11]. Interestingly, GR180, a functional receptor responding to coumarin which is highly expressed in the maxillary galea of Helicoverpa armigera, was also involved in sensing sinigrin and strychnine [12]. These results indicated that coumarin might affect the expression of chemosensory receptors, and thus would influence the feeding choice of insects. Additionally, scoparone, a well-known phenolic coumarin, exhibited potent acaricidal activity against Tetranychus cinnabarinus. Further research revealed that scoparone can target the interface between calmodulin 1 (CaM1) and N-type voltage-gate Ca2+ channel (VGCC) and activate the CaM-binding site [13,14]. However, the toxicological mechanism of coumarin against S. litura remains unclear.
Insect midguts play an important role in digestion and nutrient absorption, as well as serve as the target of pathogenic microorganisms, pesticides, and various toxins [15]. Insect glycometabolism does not allow them to directly absorb polysaccharides and oligosaccharides from food; instead, they require decomposition into monosaccharides before they may be utilized [16]. The TCA cycle is an important pathway in terms of energy metabolism responsible for the oxidation of respiratory substrates to produce adenosinetriphosphate (ATP) [17]. Some exogenous substances, including pesticides and alkaloids, significantly inhibit glycometabolism and energy metabolism in insects. For example, in Bombyx mori, sanguinarine impaired trehalose hydrolysis and reduced trehalase activity, which resulted in the inhibition of energy metabolism [18]. Wang et al. revealed that the glycolysis and the TCA cycle showed significant responses to fenpropathrin in B. mori [19]. Additionally, the midgut also plays a major role in insecticide resistance [20]. Most detoxification-related enzymes are produced and secreted in the midgut of insects, including in Anoplophora glabripennis and Plutella xylostella [21,22]. In insects, the detoxification process occurs in three phases: phase I, phase II, and phase III, among which phase I and phase II involve metabolic enzymes including cytochrome P450 monooxygenases (CYPs), glutathione S-transferases (GSTs), and esterases (ESTs) [23]. Insect CYP is one of the most prominent enzyme superfamilies involved in detoxifying xenobiotics by directing the nucleophilic functional group to the xenobiotic compound [24]. GSTs are important in metabolizing endogenous compounds and xenobiotics. GSTs can catalyze the conjugation of reduced glutathione with xenobiotics, making the conjugated compounds soluble and enabling their detoxification through excretion [25,26,27]. Carboxy/cholinesterases (CCEs) are a major class of detoxification genes in all living organisms involved in many metabolic reactions [28]. In Sitobion avenae, CarE and GST activities were positively correlated with the concentration of secondary plant compounds in artificial diets [29]. Shu et al. revealed that camptothecin, a bioactive secondary metabolite from Camptotheca acuminata, significantly disrupted the detoxification pathways in Spodoptera frugiperda [30]. These results suggested that detoxification enzymes are effective insecticidal targets for plant secondary compounds.
In recent years, omics techniques have provided insights into the complex physiological responses in individuals caused by exogenous substances. Metabolomics can be performed to identify and quantify metabolites, while transcriptomics can provide important information about gene expression [31]. In this study, a toxicological test was performed to determine the effects of coumarin on the growth and development of S. litura. A total of 2906 and 1492 DEGs were identified from 0 h to 24 h and 24 h to 48 h after treatment with coumarin by comparative transcriptomics, respectively. Functional analysis revealed that DEGs involved in glycolysis and TCA cycle were downregulated at 24 h after coumarin treatment, while they were upregulated at 48 h. Furthermore, the activities of the enzyme, CYP450, AChE, and GST, were measured. Furthermore, inhibition of the SlCYP324A16 gene significantly increased the sensitivity to coumarin in S. litura larvae.
2. Results
2.1. Toxicological Analysis of S. litura Response to Coumarin
The toxicity experiment was conducted to assess the effect of coumarin on S. litura larval growth and development. The results showed that different concentrations (1%, 2%, and 3%) of coumarin significantly inhibited S. litura larval growth and development (Figure 1; Table 1). Before coumarin treatment (day 0), the average S. litura larval weight was approximately 12 mg (Table 1). With the extension of days, S. litura larval weight increased quickly from day 1. In the control groups, the weight of larvae on the 5th day (day 5) was approximately 26 times that of day 0 (Figure 1A; Table 1). However, the larvae of the coumarin-treated groups appeared feeble, with their growth and development inhibited from day 1 and day 5. Increase in the concentration of coumarin, had an inhibitory effect on S. litura larvae. Especially on day 5, the weight of S. litura larvae in the control groups was 12 times that of the treatment groups after 3% coumarin treatment (Table 1). Additionally, the survival rate significantly decreased with an increase in the concentration of coumarin (Figure 1B,C). These results indicated that coumarin significantly inhibited S. litura larval growth.
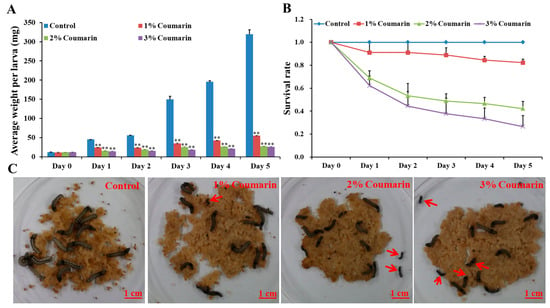
Figure 1.
Effect of different concentration of coumarin on larval growth and development of S. litura from day 0 to day 5. (A) Analysis of average weight per larva after exposure to different concentration of coumarin from day 0 to day 5, Significant differences are indicated by ** p < 0.01; (B) Analysis of survival rate after exposure to different concentration of coumarin from day 0 to day 5; (C) Macroscopic phenotype of day-5 S. litura larvae treated with coumarin. The red arrow indicates the dead larvae.

Table 1.
Stagnant development in coumarin groups of Spodoptera litura from day 1 to day 5.
2.2. Transcriptome Analysis of S. litura after Exposure to Coumarin
After removing the reductant reads, a total of 43,661,616 (92.03%), 50,255,686 (91.59%), and 42,285,760 (92.77%) clean reads from the coumarin treatment at 0 h were obtained; 44,352,000 (92.68%), 42,673,846 (93.31%), and 42,683,020 (93.07%) clean reads from the coumarin treatment at 24 h were obtained; and 44,551,274 (94.61%), 42,626,972 (93.91%), and 42,774,280 (93.61%) clean reads from the coumarin treatment at 48 h were obtained (Table S2). The values of Q20 (those with a base quality greater than 20) and Q30 (those with a base quality greater than 30) were approximately 96% and 91%, respectively. The values of the GC ontent in different samples were about 47% (Table S2). Furthermore, 39,306,176 (90.02%), 45,643,668 (90.82%), and 38,038,940 (89.96%) clean reads from coumarin treatment groups at 0 h; 38,789,705 (87.46%), 37,983,568 (89.01%), and 38,137,885 (89.35%) clean reads from coumarin treatment groups at 24 h; and 39,942,407 (89.65%), 38,252,591 (89.74%), and 38,518,422 (90.05%) clean reads from coumarin treatment groups at 48 h were successfully mapped to the S. litura genome (Table S3).
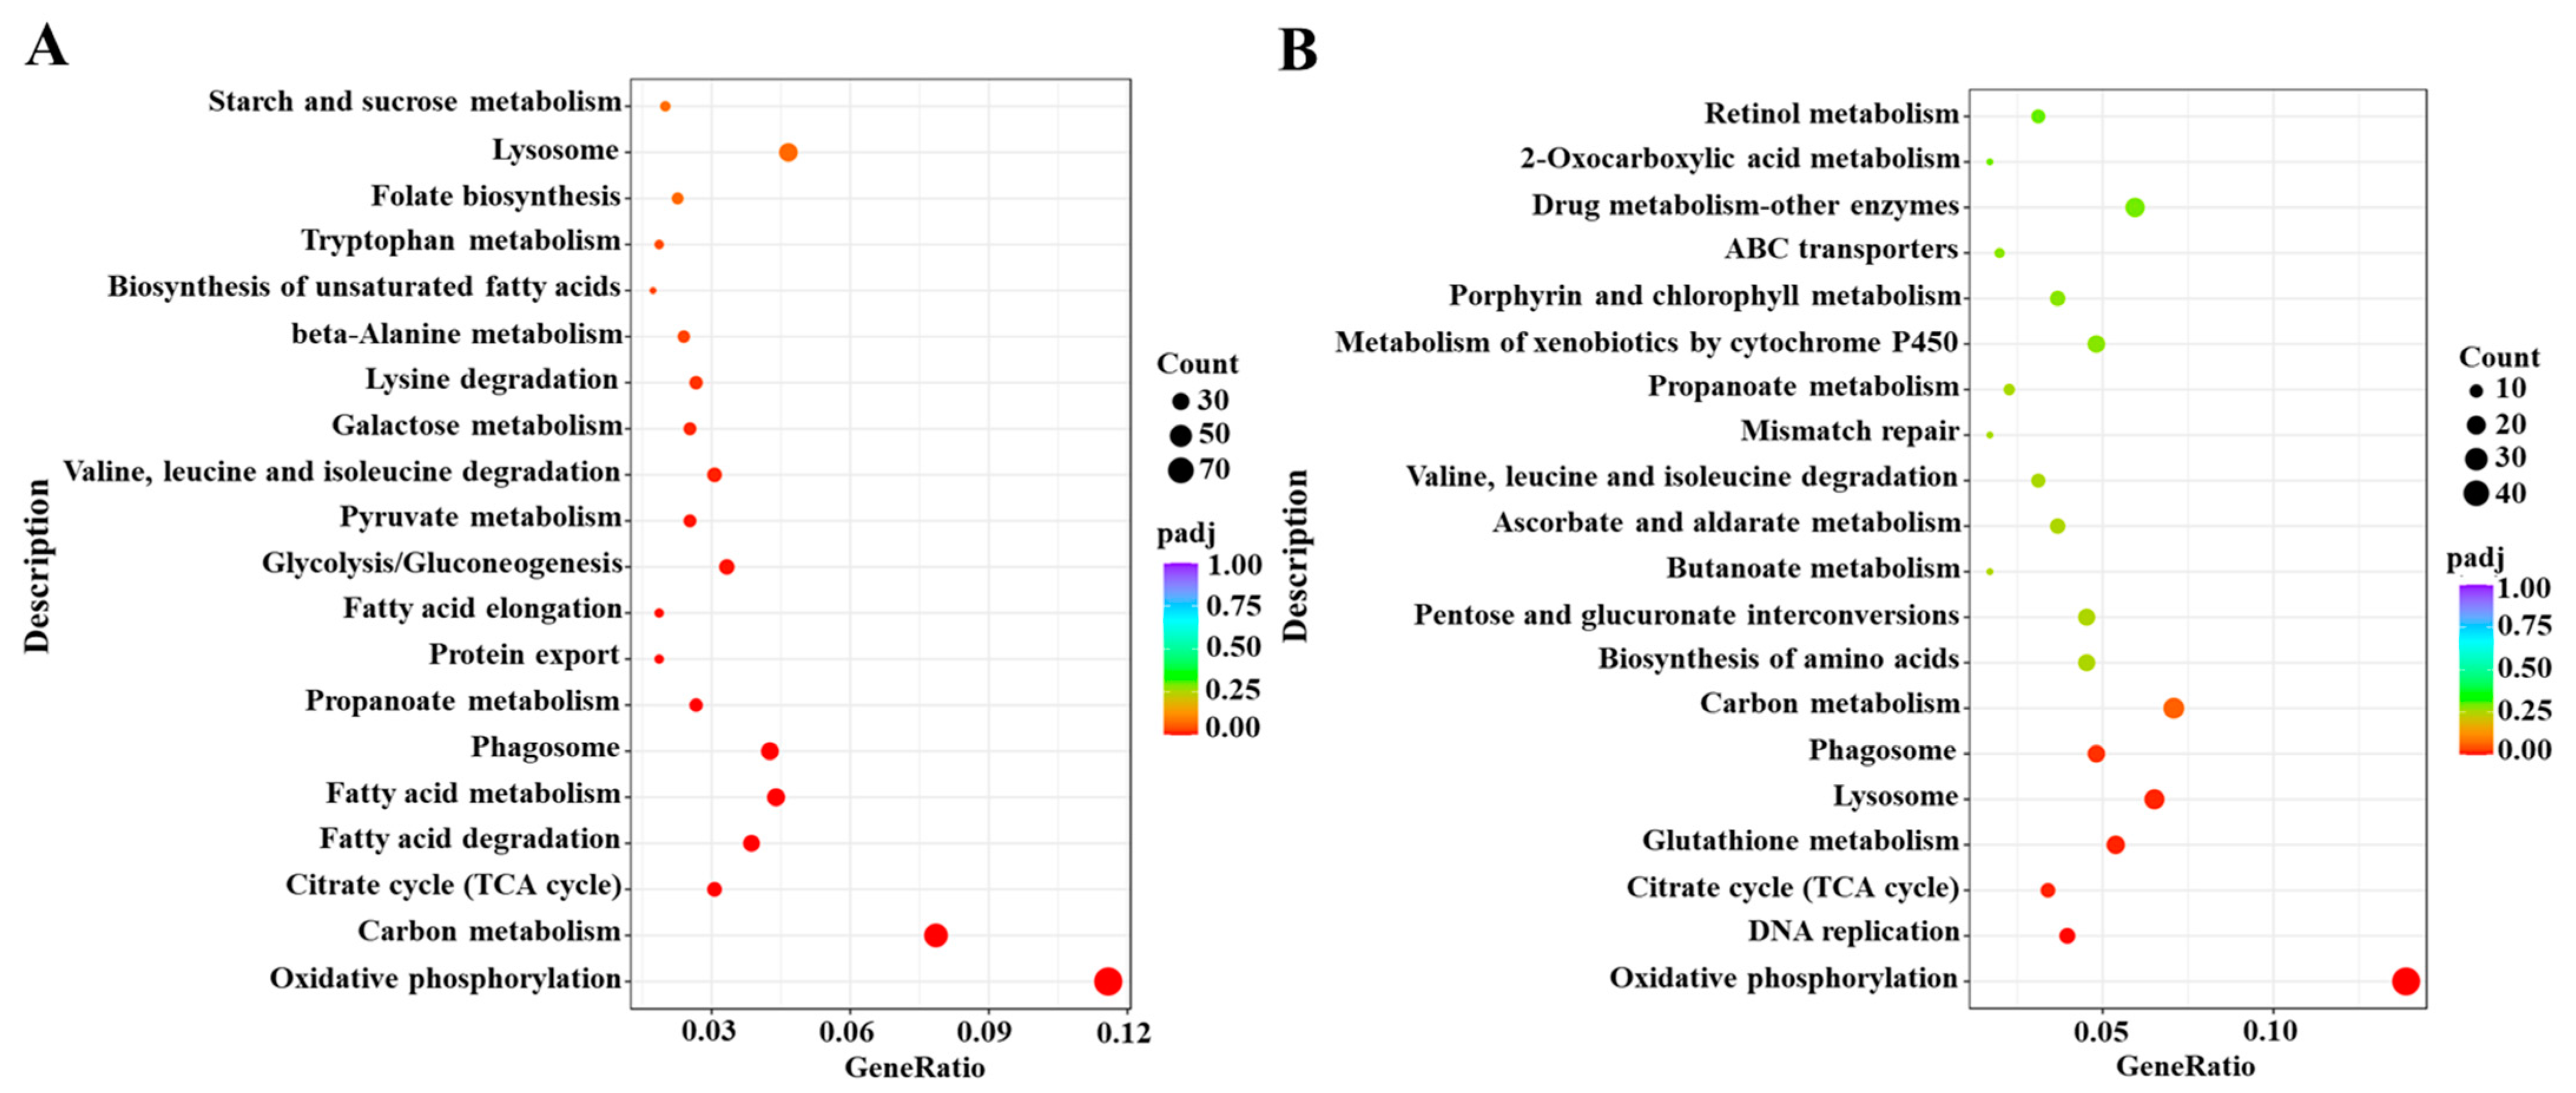
Based on the DESeq method, the DEGs were identified from different comparative groups. A total of 2906 DEGs were identified in Cou-24 h (coumarin treatment at 24 h) groups compared with the Cou-0 h (coumarin treatment at 0 h), of which 1487 DEGs were upregulated and 1419 DEGs were downregulated. A total of 1492 DEGs were identified in Cou-48 h (coumarin treatment at 48 h) groups compared with the Cou-24 h, of which 680 DEGs were upregulated and 812 DEGs were downregulated (Figure S1). Gene ontology (GO) enrichment analysis revealed that most DEGs were mainly associated with peptidase activity, serine hydrolase activity, and serine-type peptidase activity in Cou-24 h compared with Cou-0 h. By comparing Cou-48 h with Cou-24 h groups, most DEGs were mainly related to transmembrane transporter activity, transporter activity, and transmembrane transport (Figure S3). Additionally, Kyoto Encyclopedia of Genes and Genomes Pathway database (KEGG) enrichment analysis suggested that most DEGs were mainly involved in oxidative phosphorylation, carbon metabolism, citrate cycle (TCA cycle), and fatty acid metabolism at 24 h after coumarin treatment. Comparison of Cou-48 h with Cou-24 h groups showed that most DEGs were mainly involved in oxidative phosphorylation, lysosome, glutathione metabolism, and citrate cycle (TCA cycle) (Figure 2).
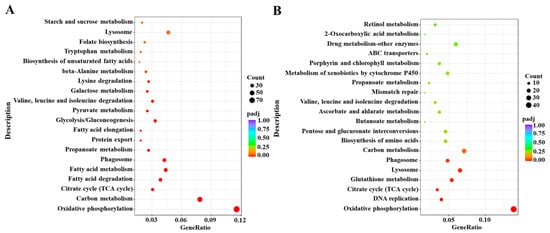
Figure 2.
KEGG enrichment analysis of DEGs from 0 h to 24 h and 24 h to 48 h in S. litura after coumarin treatment. (A) KEGG enrichment analysis of DEGs from 0 h to 24 h in S. litura after coumarin treatment; (B) KEGG enrichment analysis of DEGs from 24 h to 48 h in S. litura after coumarin treatment. The sizes of the bubble indicate the number of DEGs enriched to the corresponding term. The color of the bubble indicates the Q value.
2.3. Identification of DEGs Related to Detoxification after Exposure to Coumarin
Transcriptome analysis showed that many DEGs related to detoxification were altered in different comparable groups. In total, 28 DEGs related to carboxylesterase were identified between Cou-24 h groups and Cou-0 h groups, among which 22 DEGs were upregulated from 0 h to 24 h after coumarin treatment and 6 DEGs were downregulated (Table 2). A total of 17 DEGs associated with glutathione S-transferase were identified, among which 5 DEGs were upregulated and 12 DEGs were downregulated from 0 h to 24 h after coumarin treatment (Table 2). A total of 35 DEGs related to cytochrome P450 were identified, of which 24 DEGs were upregulated from 0 h to 24 h after treated with coumarin and 11 DEGs were downregulated (Table 2). From 24 h to 48 h after coumarin treatment, a total of 20 DEGs related to carboxylesterase were screened, of which 17 DEGs were upregulated and three DEGs were downregulated (Table 3). In addition, a total of nine DEGs associated with GST were identified, of which seven DEGs were upregulated from 24 h to 48 h after exposure to coumarin, and the remaining two DEGs were downregulated (Table 3). A total of sixteen DEGs related to cytochrome P450 were identified from 24 h to 48 h after treatment with coumarin, of which five DEGs were upregulated and eleven DEGs were downregulated (Table 3).
Table 2.
Identification of DEGs related to detoxification from 0 h to 24 h after coumarin treatment.
Table 3.
Identification of DEGs related to detoxification from 24 h to 48 h after coumarin treatment.
Venn diagram analysis revealed that a total of 12 genes related to CarE showed differential expression in both Cou-24_vs_Cou-0 and Cou-48_vs_Cou-24 (Figure 3A). A total of 10 genes related to P450 exhibited difference in both Cou-24_vs_Cou-0 and Cou-48_vs_Cou-24 (Figure 3A). Additionally, a total of five genes associated with GST showed differential expression in both Cou-24_vs_Cou-0 and Cou-48_vs_Cou-24 (Figure 3A). Hierarchical cluster analysis also corresponded to expression patterns at 0, 24, and 48 h after coumarin treatment (Figure 3B and Figure S2).
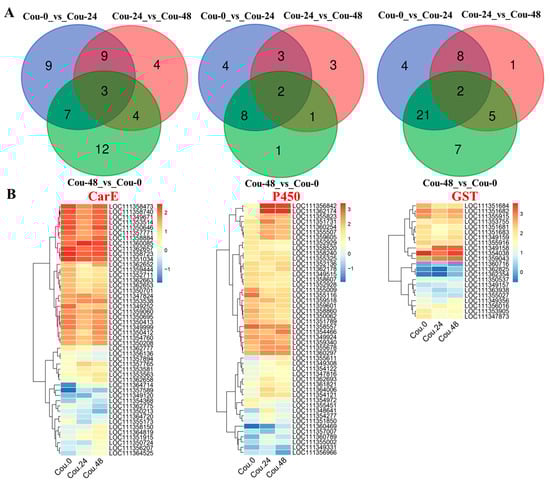
Figure 3.
Venn diagram and clustering analysis of DEGs associated with CarE, P450, and GST in different comparative groups. (A) Venn diagram analysis of DEGs related to CarE, P450, and GST in Cou-0_vs_Cou-24, Cou-24_vs_Cou-48, and Cou-0_vs_Cou-48; (B) The clustering analysis of expression levels of DEGs at 0 h, 24 h, and 48 h after coumarin treatment.
To further validate the expression levels of DEGs involved in detoxification, a total of 12 genes were selected for RT-qPCR analysis. The results showed that the expression patterns of these genes can be divided into five categories. The first category involved DEGs that were consistently upregulated from 0 to 48 h after coumarin treatment, including Venom-COE, GST-like, GST-1, and CYP324A16 (Figure 4). The second category included DEGs in which expression levels were downregulated from 0 h to 24 h after treatment with coumarin, while they were upregulated from 24 to 48 h, including Cholinesterase 1, Esterase B1, AChE1, and P4506B6 (Figure 4). The third category included P4509e2 and P450304a1 in which expression levels were upregulated form 0 to 24 h after coumarin treatment (Figure 4). The expression level of LOC111354038 showed no significant change from 0 to 24 h after coumarin treatment, whereas it was significantly upregulated from 24 to 48 h (Figure 4). These results indicated that coumarin treatment significantly affected the expression level of detoxification enzyme-related genes in S. litura. Notably, we found that the expression level of SlCYP324A16 at 24 h after treatment with coumarin was 78.6 times that of 0 h, and that at 48 h after treatment was 224 times that of 0 h. We speculated that SlCYP324A16 might play an important role in the detoxification of coumarin.
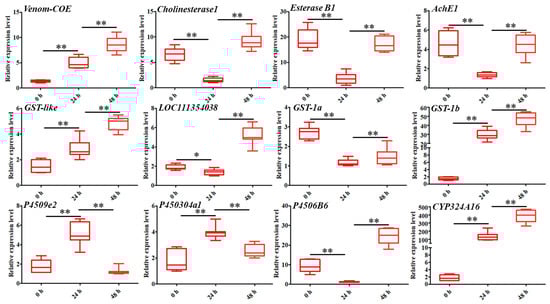
Figure 4.
Analysis of the expression levels of twelve DEGs associated with CarE, GST, and P450 at 0 h, 24 h, and 48 after coumarin treatment, respectively. Data were normalized using glyceraldehyde-3-phosphate dehydrase (GAPDH) and are represented as the means ± standard errors of the means from three independent experiments. Significant differences are indicated by * p < 0.05 and ** p < 0.01.
2.4. Determination of Detoxification Enzyme Activity
The activities of P450, GST, and AChE were measured to evaluate the effect of coumarin on detoxification enzyme activity. The results showed that CYP450 and AChE activities significantly decreased from 24 to 48 h after coumarin treatment, while they showed no significant change from 0 to 24 h (Figure 5. In contrast, GST activity was significantly increased from 0 to 24 h after treatment with coumarin, while it showed no significant change from 24 to 48 h (Figure 5). These results indicated that coumarin significantly reduced CYP450 and AChE activity and increased GST activity.
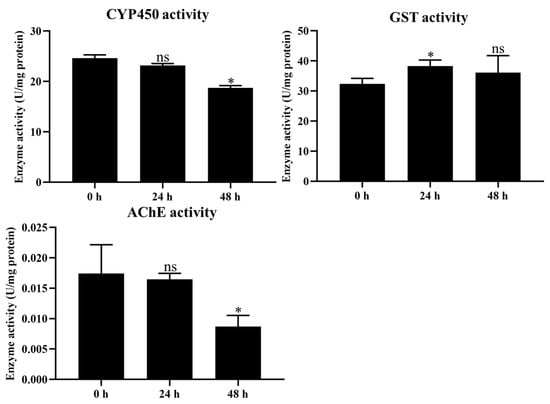
Figure 5.
Measurement of CYP450, GST, and AChE activities at 0 h, 24 h, and 48 h after coumarin treatment. Each experiment contained three biological replicates. Statistical analysis was conducted using the SPSS 16.0 software. Significant differences are indicated by * p < 0.05. The ns indicates no significant difference.
2.5. Effect of Coumarin on S. litura after Silencing of SlCYP324A16
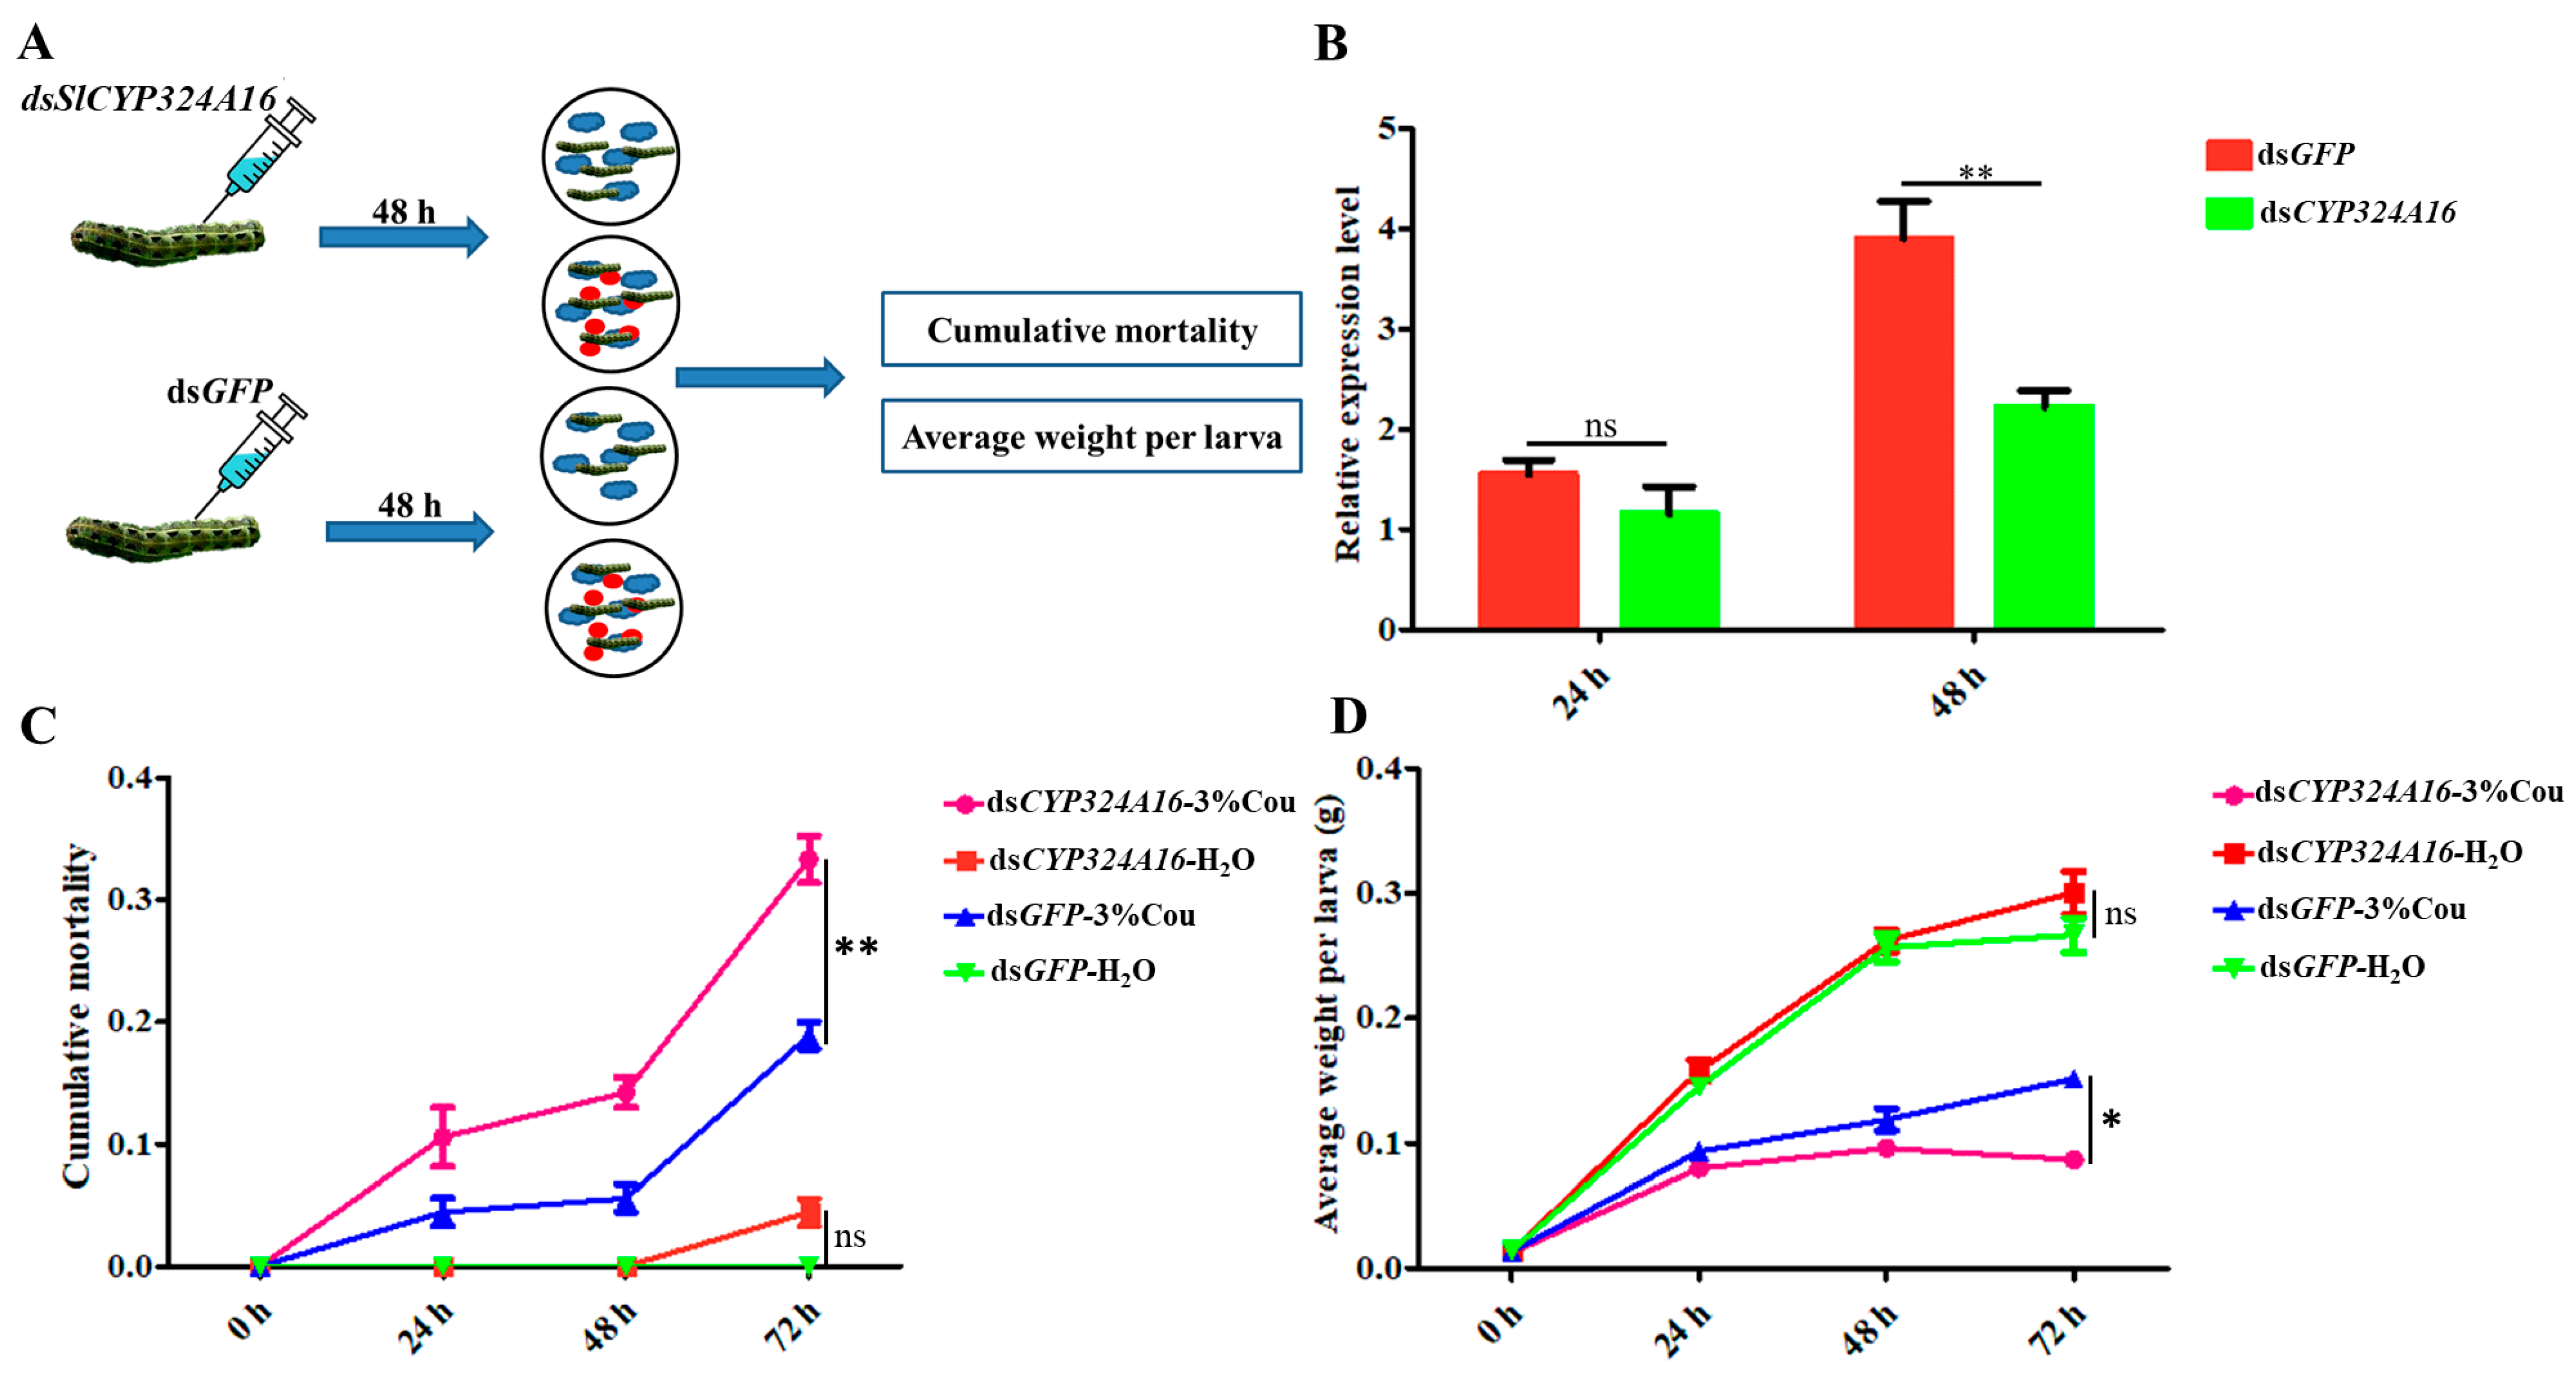
RT-qPCR analysis revealed that SlCYP324A16 gene expression increased rapidly from 0 h to 48 h after coumarin treatment. We considered that SlCYP324A16 is an important target gene involved in the response to coumarin. RNAi was performed to assess the effect of coumarin on S. litura after SlCYP324A16 silencing. The results showed that SlCYP324A16 expression level was significantly downregulated at 48 h after dsRNA injection (Figure 6B). Furthermore, SlCYP324A16 silencing resulted in a significant increase in the cumulative mortality compared with dsGFP groups (Figure 6C). Additionally, the weight of S. litura larvae significantly reduced in both dsGFP groups and dsSlCYP324A16 groups after coumarin treatment. S. litura larval weight has no obvious difference between dsGFP and dsSlCYP324A16 after H2O treatment, whereas larval weight in dsSlCYP324A16 group was lower than dsGFP group after coumarin treatment (Figure 6D). These results indicated that the knockdown of the SlCYP324A16 gene significantly increased the sensitivity of S. litura to coumarin.
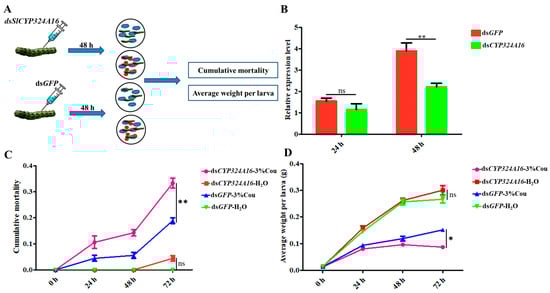
Figure 6.
Effects of coumarin on the growth and development of S. litura after silencing of SlCYP324A16 gene. (A) Illustration of the protocol used for RNA interference. The blue cloud symbol represented the artificial diet. The red oval symbol represented 3% coumarin; (B) Analysis of SlP4506k1 expression levels after treatment with dsSlP4506k1 and dsGFP; (C) Analysis of the cumulative mortality of S. litura larvae exposed to coumarin after silencing of the SlP4506k1 gene; (D) Average weight of S. litura larvae exposure to coumarin after silencing of the SlP4506k1 gene. Statistical analysis was conducted using the SPSS 16.0 software. The significant differences are indicated by * p < 0.05 and and ** p < 0.01. The ns indicates no significant difference.
2.6. Identification of DEGs Involved in Glycolysis and TCA cycle after Exposure to Coumarin
The transcriptome analysis revealed that several DEGs involved in glycolysis and TCA cycle were modified in different comparable groups. A total of 25 DEGs involved in glycolysis were identified and showed upregulation from 0 to 24 h after coumarin treatment. In addition, a total of 23 DEGs involved in the TCA cycle were identified between Cou-24 h groups and Cou-0 h groups, among which 22 DEGs were downregulated from 0 h to 24 h after coumarin treatment and one gene was upregulated (Table 4). From 24 to 48 h after coumarin treatment, a total of four glycolysis-related DEGs were identified, and these genes were upregulated compared Cou-48 h groups and Cou-24 h groups. A total of 12 DEGs associated with TCA cycle were identified and showed upregulation from 24 to 48 h after coumarin treatment (Table 5). KEGG enrichment analysis also revealed that the expression levels of key genes involved in glycolysis were significantly downregulated from 0 to 24 h after treatment with coumarin. However, glycolysis-related genes had no significant change from 24 to 48 h after coumarin treatment (Figure 7). Additionally, TCA cycle-related genes were also significantly downregulated at 24 h after coumarin treatment, while these genes were upregulated from 24 to 48 h after coumarin treatment (Figure 8). These results indicated that coumarin significantly inhibited S. litura glycolysis and TCA cycle at 24 h, while these pathways were activated at 48 h.
Table 4.
Identification of DEGs involved in glycolysis and TCA cycle from 0 h to 24 h after coumarin treatment.
Table 5.
Identification of DEGs involved in glycolysis and TCA cycle from 24 h to 48 h after coumarin treatment.
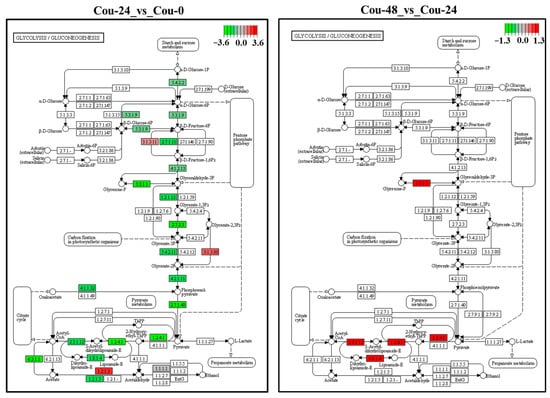
Figure 7.
KEGG analysis of the changes in the glycolysis/gluconeogenesis pathway in S. litura at 0 h, 24 h, and 48 h after coumarin treatment. The red box indicates upregulation of DEGs and the green box indicates downregulation of DEGs.
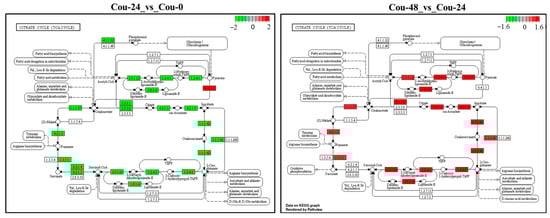
Figure 8.
KEGG analysis of the changes in the TCA cycle pathway in S. litura at 0 h, 24 h and 48 h after coumarin treatment. The red box indicates upregulation of DEGs and the green box indicates downregulation of DEGs.
2.7. Metabolite Profiling of S. litura Hemolymph after Exposure to Coumarin
Metabolic analysis identified a total of 4498 metabolites using UPLC-MS (2345 and 2153 for negative- and positive-ion modes, respectively) in S. litura hemolymph from coumarin treatment groups at different time points. Of these, 4219 were categorized into 10 classified super classes, including lipids and lipid-like molecules (1173), organic acids and derivatives (857), organoheterocyclic compounds (749), benzenoids (498), organic oxygen compounds (431), phenylpropanoids and polyketides (183), nucleosides, nucleotides, and analogues (136), organic nitrogen compounds (70), and others (122) (Table S4).
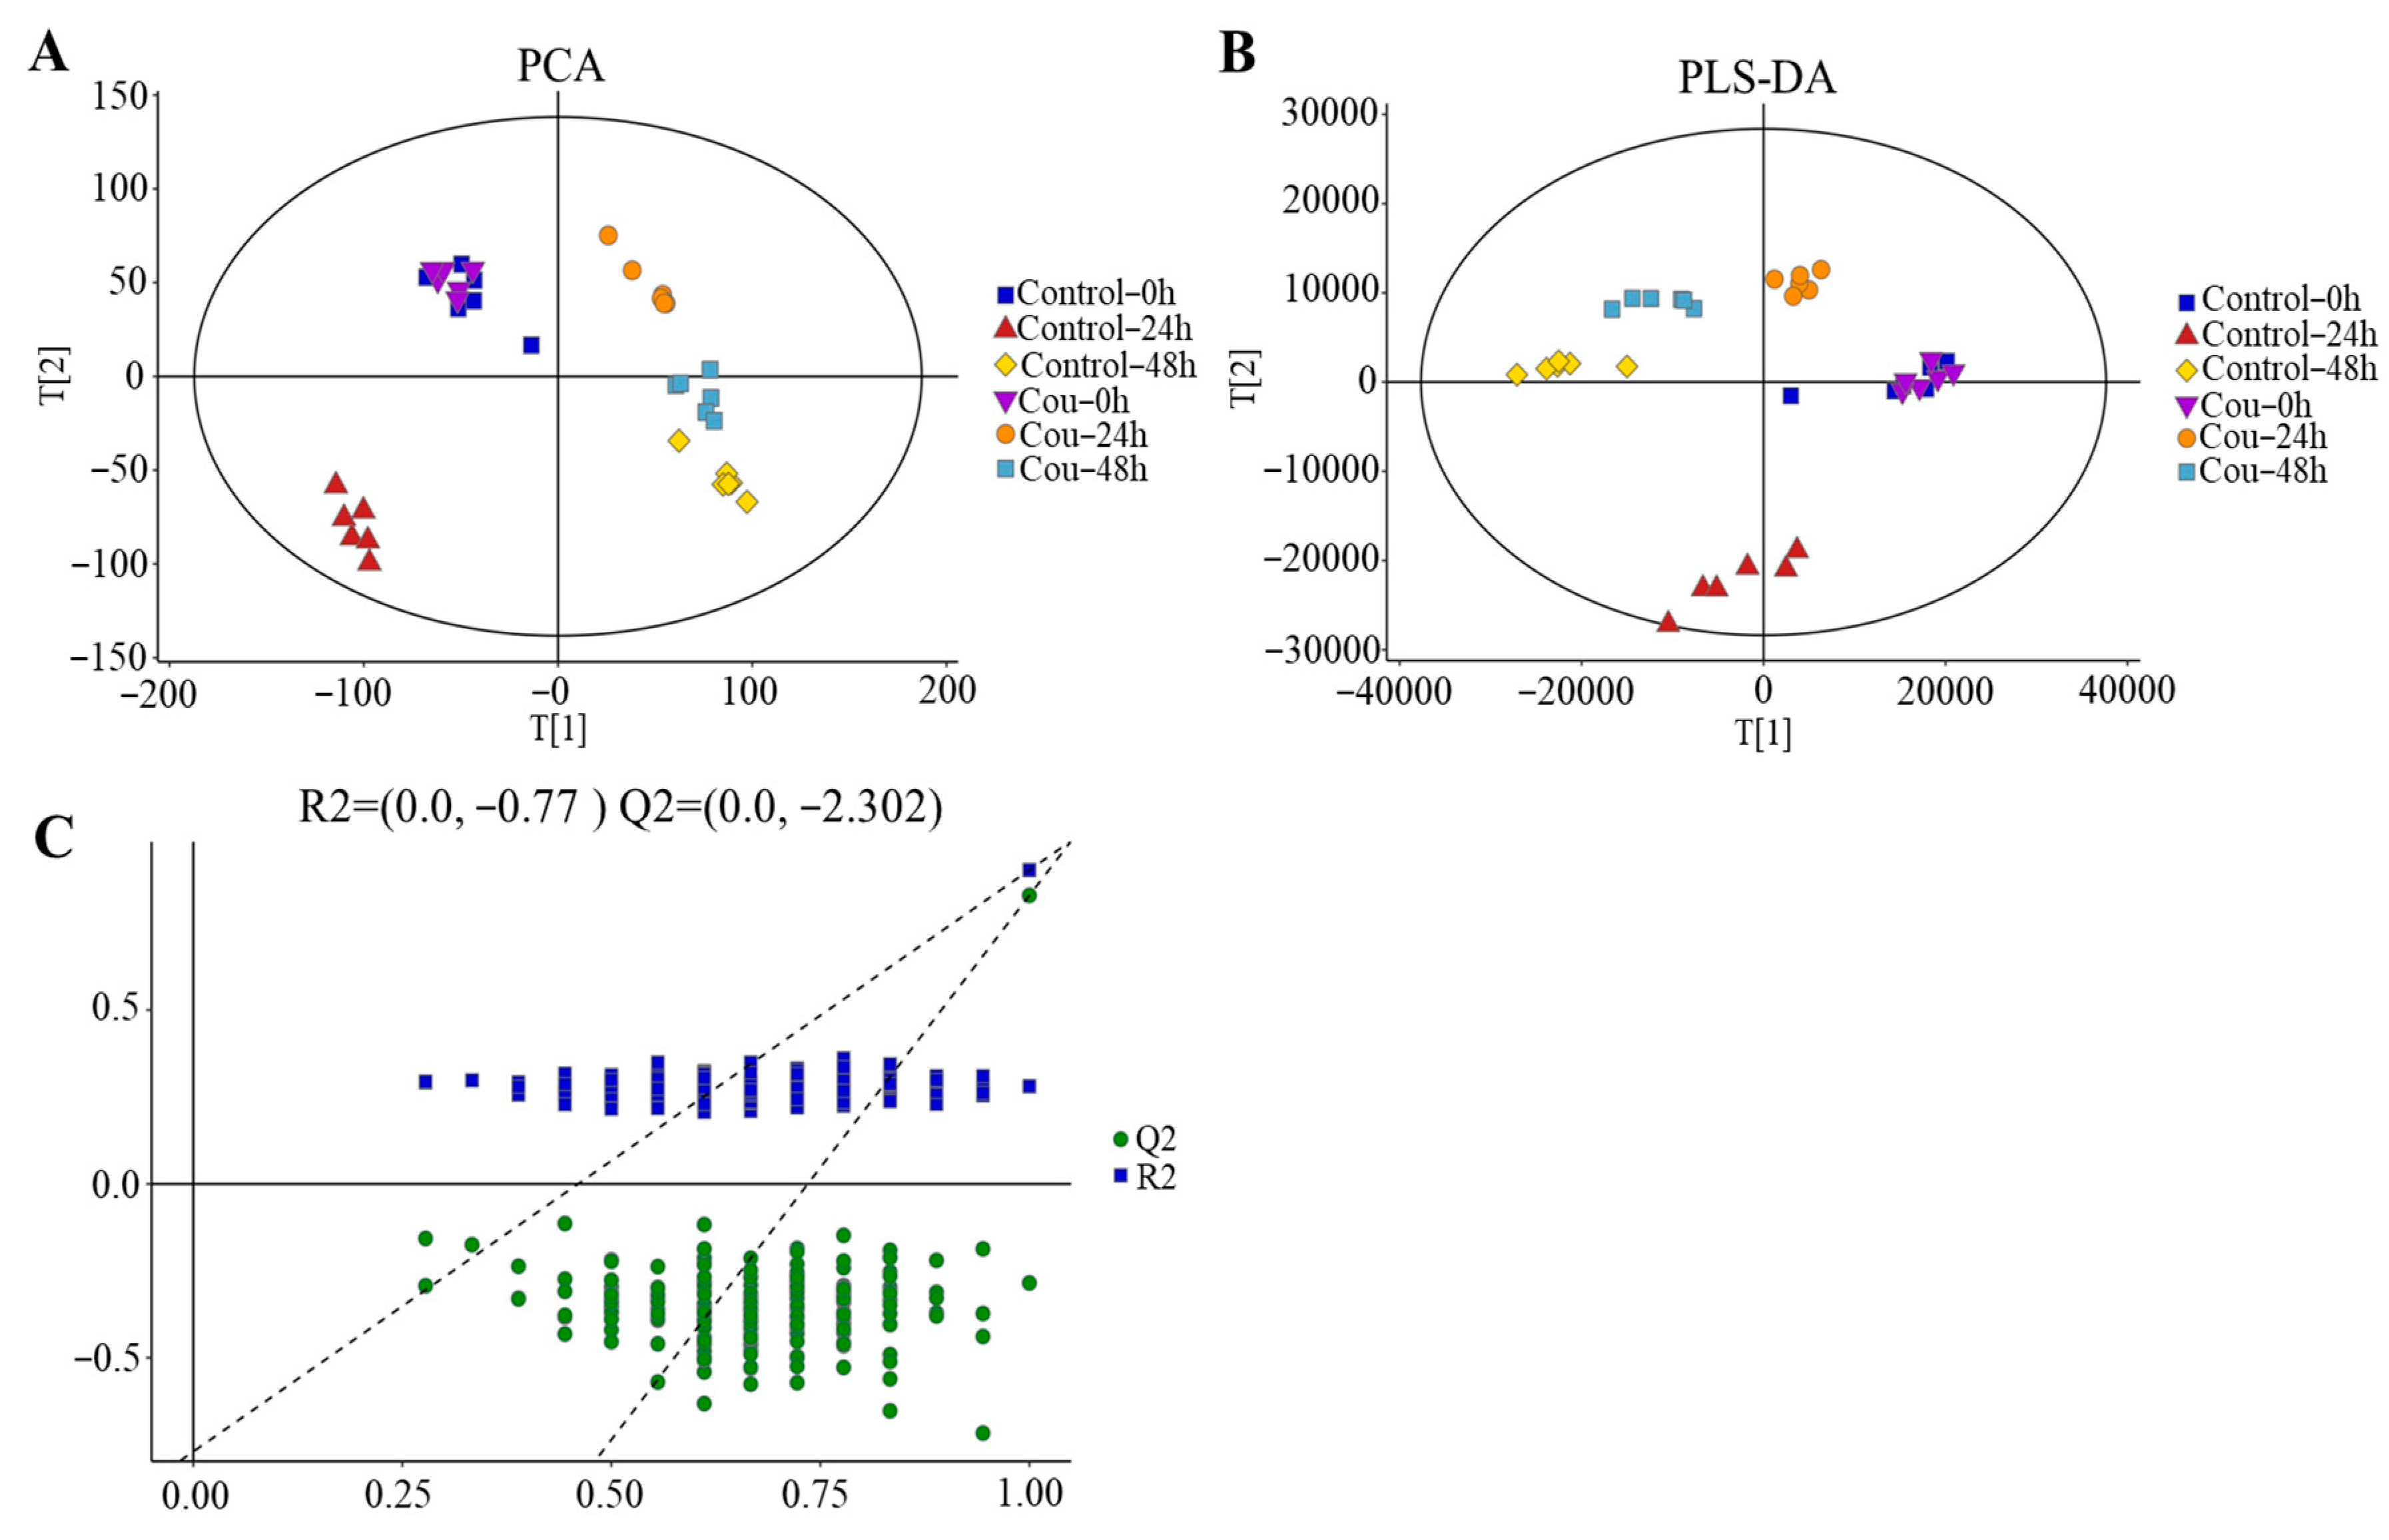
The good stability and repeatability of the analysis were revealed using PCA and PLS-DA score plots. The results showed that a clear separation between control groups and coumarin treatment groups at 0 h, 24 h, and 48 h were exhibited on score plots of PCA and PLS-DA, indicating that two coumarin treatment groups at 24 h and 48 h had a distinct metabolic profile, but the score plots at 0 h overlapped between control groups and coumarin treatment groups (Figure 9A,B). A seven-fold cross validation R2Y (0.999) and Q2 (0.973) of the comparison of the Cou-24 h groups with Cou-0 h groups, showed fitness and predictability, and the negative Q2 in the 200-times response permutation testing revealed no overfitting in OPLA-DA (Figure 9C). A seven-fold cross validation R2Y (0.996) and Q2 (0.945) of the comparison of the Cou-48 h groups with Cou-24 h groups, showed fitness and predictability, and the negative Q2 in the 200-times response permutation testing revealed no overfitting in OPLA-DA (Figure 9C).
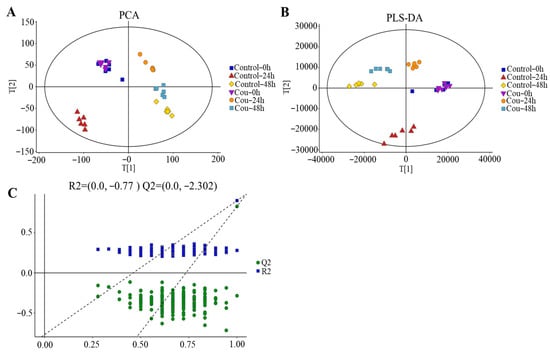
Figure 9.
Score plots of multivariate analysis. (A) Principal component analysis (PCA) score plots for all samples. (B) Partial least squares-discriminant analysis (PLS-DA) score plots for different samples. (C) Results of 200-times response permutation testing of OPLS-DA. Q2 and R2 represent the intercepts of the regression curve and y-axis generated by the linear regression between the R2 and Q2 values of “permuted” model and the R2Y and Q2Y values. Control-0 h, Control-24 h, and Control-48 h: S. litura hemolymph samples were collected at 0 h, 24 h, and 48 h from control groups without coumarin; Cou-0 h, Cou-24 h, and Cou-48 h: S. litura hemolymph samples were collected at 0 h, 24 h, and 48 h from control groups containing coumarin.
2.8. Effect of Coumarin Treatment on Metabolite Profiling in S. litura Hemolymph
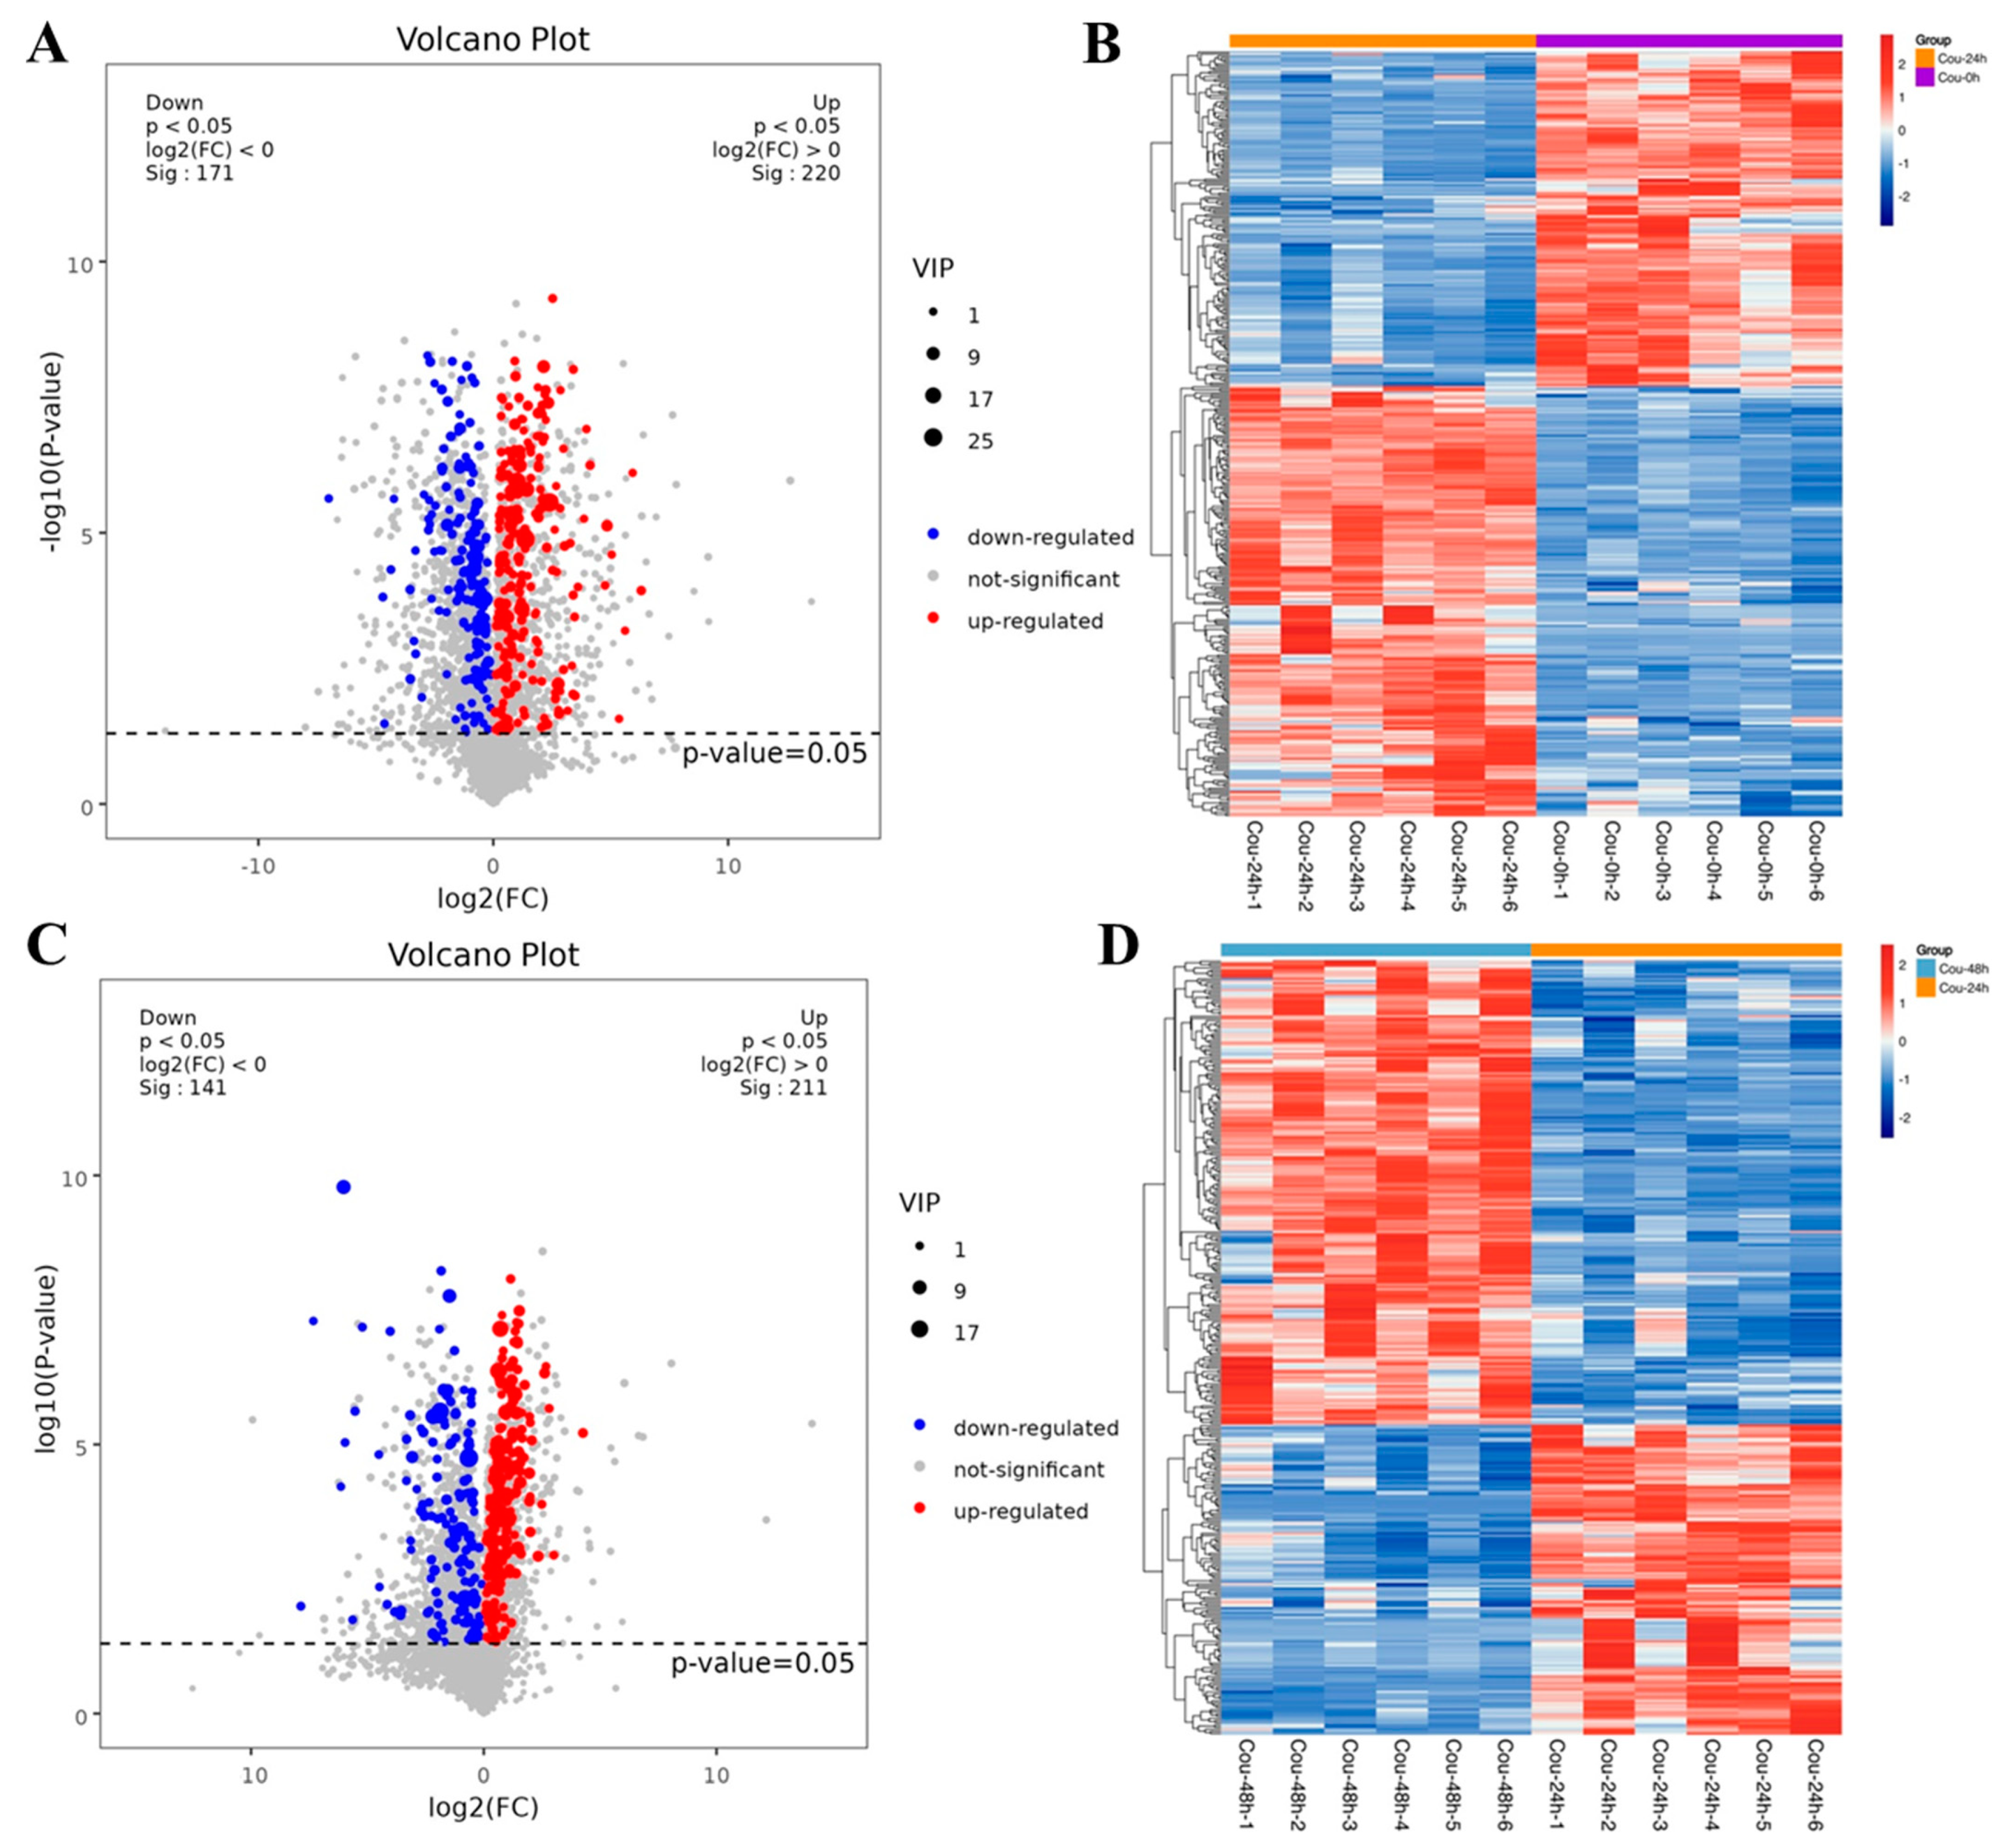
The metabolic profiles in S. litura hemolymph after coumarin treatment at 0 h, 24 h and 48 h were determined to assess the effect of coumarin on hemolymph. According to the criteria of VIP value > 1 in the OPLS-DA analysis and FDR (q-value) < 0.05 in the Benjamini-Hochberg method, a total of 391 significantly-expressed metabolites (220 upregulated and 171 downregulated) were identified from 0 h to 24 h after treatment with coumarin, and 352 significantly-expressed metabolites (211 upregulated and 141 downregulated) were identified from 24 h to 48 h (Figure 10A,C; Table S4). Further analysis revealed that the metabolites identified from 0 h to 24 h could be grouped into 11 classified super classes, with organic acids and derivates (100) being the most altered compounds in terms of metabolite numbers (Table S4). The second super classes in metabolite numbers were lipids and lipid-like molecules (70) and organoheterocyclic compounds (63) were identified in both super classes. From 24 h to 48 h after coumarin treatment, identified metabolites could be grouped into 11 classified super classes, of which organic acids and derivates (90) were the most altered compounds in terms of metabolite numbers, and the second super class in metabolite numbers were lipids and lipid-like molecules (68) and organoheterocyclic compounds (52) were identified in both super classes (Table S4).

Figure 10.
Expression levels of metabolites in different comparative groups. (A,C) Volcano plot for all differential metabolites in different comparative groups. Each dot indicates one metabolite with detectable expression in both conditions, with the colored dots marking the threshold (false discovery rate (FDR) < 0.05) for defining a metabolite as differentially expressed. Red and blue points indicate the significantly upregulated and downregulated metabolites, respectively; The gray points represent no significantly differential metabolites. (B,D) Hierarchical cluster analysis of all differential metabolites (FDR < 0.05). Each sample is represented as a single column and each metabolite is represented by a single row. Red coloration indicates significantly increased metabolite levels, and blue coloration indicates low metabolite levels.
2.9. Metabolic Pathway of S. litura Affected by Coumarin
An analysis of KEGG enrichment was performed to understand the biological functions of identified metabolites after coumarin treatment at different time points The results showed that a total of 15 pathways were found from 0 to 24 h after coumarin treatment, among which the most enriched pathways were mainly associated with amino acid and nucleotide metabolism as well as energy metabolism, including purine metabolism, alanine, aspartate and glutamate metabolism, lysine metabolism and citrate cycle (Figure 11A; Table S5). Correlation analysis revealed that a total of 14 differential metabolites showed positive correlation, including alpha-lactose, 9-hydroxy-7E-Nonene-3,5-diynoic acid, 2,2-dichloro-12-(4-chlorophenyl) dodecanoic acid, 2-hydroxyphenethylamine, 1-nitro-3,5-dinitroso-1,3,5-triazinane, acetamide, L-histidine, trans-cinnamic acid, N-(1-deoxy-1-fructosyl) tyrosine, L-alloisoleucine, Indoleacrylic acid, gluconic acid, flurtamone, and betamethasone phosphate (Figure 11B). From 24 h to 48 h after treatment with coumarin, a total of 17 pathways were detected, of which most were mainly related to ABC transporters, arginine biosynthesis, butanoate metabolism, and alanine, aspartate, and glutamate metabolism (Figure 11C). A total of 15 differential metabolites exhibited positive correlation, among which D-Malic acid, 2,2-dichloro-12-(4-chlorophenyl) dodecanoic acid, 1-nitro-3,5-dinitroso-1,3,5-triazinane, and pyrogallol-2-O-glucuronide (Figure 11D) had a strong positive correlation. Additionally, D-Proline and mandelonitrile rutinoside also exhibited positive correlation (Figure 11C).
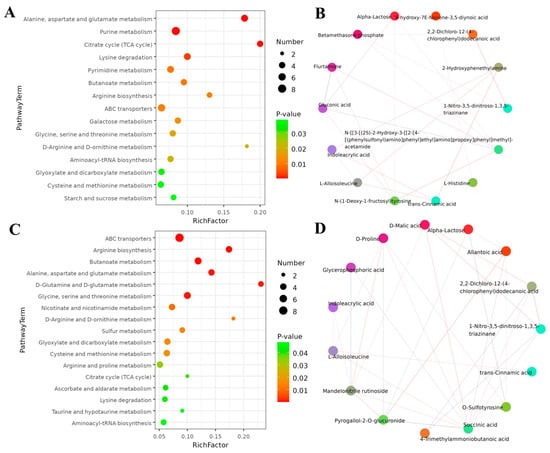
Figure 11.
KEGG pathway enrichment analysis of differential metabolism after exposure to coumarin. (A,C) Significantly enriched pathways with FDR (q-value) < 0.05; (B,D) Relationships between different enriched metabolites.
3. Discussion
Pest management currently faces a worldwide ecological challenge resulting from environmental pollution and insecticide resistance caused by the extensive use of synthetic chemical insecticides [32]. Plant-derived pesticides are cheap, biodegradable, ecofriendly, and act by several mechanisms of action in a more specific way. In plants, secondary products are small molecular weight compounds produced by secondary metabolic pathways and exhibit superior insecticidal properties [33]. The secondary phenolic metabolites are generally regarded as defensive molecules that can disrupt insect growth and oviposition [34]. In the current study, we found that natural coumarin significantly inhibited the growth and development of S. litura larvae. An increase in the concentration of coumarin resulted in a significant decrease in the weight of S. litura larvae. Sharma et al. revealed that coumarin caused a high percentage of egg and larval mortality of the potato tuber moth, Phthorimaea operculella Zell [35]. Moreover, a total of four coumarins isolated from the crude seed extract of Mammea siamensis-surangin B, surangin C, mammea E/BB, and mammea E/BC were reported to have insecticidal properties [36]. These results indicated that coumarins are highly phytotoxic and effective in controlling pests.
GO enrichment analysis showed that DEGs were mainly related to peptidase activity and transmembrane transporter activity in S. litura after coumarin treatment. Most of genes related to peptidase activity showed significant difference and indicated that coumarin treatment may increase the proteolysis at 24 h. However, DEGs associated with ABC transporters and metabolism of xenobiotics by cytochrome P450 exhibited obvious difference at 48 h. We considered that coumarin treatment significantly increased the expression levels of insecticide resistance-related genes. By transcriptome analysis, a total of 80 and 45 DEGs related to detoxification were identified from 0 to 24 h and 24 to 48 h after coumarin treatment, respectively. Among them, most of carboxylesterase-related genes were downregulated from 0 to 24 h, while they were upregulated from 24 to 48 h after coumarin treatment. Our results indicated that coumarin could significantly inhibit the carboxylesterase in the early stages of processing. In insects, carboxylesterase enzymes are frequently implicated in the resistance to organophosphorus, carbamates, and pyrethroids [37]. Pengsook et al. found that thymol isolated from Alpinia galanga could significantly decrease carboxylesterase in S. litura [38]. GSTs are phase II metabolizing isozymes that catalyze the reaction between reduced glutathione and conjugate xenobiotic compounds, which in particular contribute significantly to organophosphate, organochlorine, cyclodiene, and pyrethroid resistance [39]. We also found that the expression levels of DEGs associated with GST were significantly downregulated after coumarin treatment in S. litura. However, GST activity significantly increased at 48 h after coumarin treatment. Duan et al. found that citalopram and mirtazapine increased GST activity in Daphnia magna, indicating that psychoactive drugs posed a high toxic threat to aquatic organisms [40]. We considered that coumarin significantly inhibited the expression level of GST-related genes, and GST enzyme activities were increased to compensate for the deficiency of the enzyme. P450 plays a vital role in the metabolism of insecticides and plant allelochemicals in insects [41]. We found that SlCYP324A16 was rapidly upregulated from 0 to 24 h after coumarin treatment. Silencing of SlCYP324A16 by RNA interference significantly increased S. litura mortality and decreased larval weight. In previous research, the cytochrome P450 gene, CYP321A1, was significantly upregulated after exposure to tannin in S. litura’s midgut and body fat [41]. These results indicated that SlCYP324A16 could be an important target in the response to coumarin.
Comparative transcriptome analysis showed that DEGs in glycolysis pathway were downregulated from 0 to 24 h after coumarin treatment. In comparison, they had no significant change from 24 to 48 h. In addition, DEGs in the citrate cycle were downregulated from 0 to 24 h after treatment; however, their expression levels were significantly upregulated from 24 to 48 h. These results indicated that coumarin exposure reduced the energy-related metabolism of S. litura by inhibiting the expression of key genes in glycolysis and citrate cycle. In our previous research, NMR-based metabolomic analysis revealed that S. litura glycolysis and TCA cycle were significantly inhibited after exposure to validamycin [42]. Li et al. also found that sanguinarine impaired trehalose hydrolysis, reduced trehalase activity and transcription, and led to the inhibition of energy metabolism in B. mori [18]. Based on these results, we considered that both validamycin and sanguinarine disrupted the insect’s energy metabolism by inhibiting trehalase activity. However, it is not clear whether coumarin works by inhibiting trehalase activity. Glycolysis and TCA cycle are important sources of energy for insects and are crucial for their growth and development [43]. The results indicated that S. litura larvae entered a starvation state, which resulted in inadequate energy intake.
PCA analysis of metabolic profiles suggested that the coumarin-treated group overlapped with control group at 0 h. However, the metabolic profiles of the coumarin-treated group could be entirely separated from that of the control group. At 48 h, the metabolic profiles of the treatment group and control group were less overlapped. These results further indicated that significant changes in the metabolic pattern in S. litura occurred, 0–24 h after ingestion of coumarin. We speculated that the coumarin had significant effects on physiological metabolism at the early stage (0–24 h) of midgut entry, while the effect weakened at the late stage (24–48 h). KEGG enrichment analysis showed that identified differential metabolites from 24 to 48 h after coumarin treatment were mainly related to ABC transporters. ABC transporters are widely distributed in organisms and play an important role in the transport of xenobiotics [44]. In S. frugiperda, camptothecin treatment significantly induced the upregulation of ABC transporter-related genes in the fat body. Plants can release a variety of toxic secondary metabolites to deter the feeding of herbivorous insects. As part of these countermeasures, members of ABC transporter family play a crucial role in overcoming multiple chemical plant defenses [44]. Therefore, we considered that ABC transporters may be involved in transporting coumarin extracellular during the stage of coumarin treatment, thereby reducing the toxicity of coumarin against S. litura.
4. Materials and Methods
4.1. Spodoptera litura Rearing and Toxicity Assay
The S. litura larvae were collected from the orange orchard at Gannan Normal University, Ganzhou, China. Larvae were reared for six generations using artificial diets containing wheat germ, yeast, carrageenan, konjac flour, sorbic acid, vitamin C, corn oil, and linoleic acid at 25 °C, 65% relative humidity, and a photoperiod of 12:12 h (L:D). The adults after molting were transferred into a clean plastic container and fed using 10% honey soaked in cotton balls.
Toxicity assay was performed following a previous protocol with minor modifications [42]. A total of 240 third-instar larvae were randomly divided into 12 groups (n = 20 in each group) for the toxicity assay of coumarin. The coumarin (98%) was purchased from Aladdin Industrial Corporation (Shanghai, China). After weighing, three groups of larvae were supplemented with the same amounts of artificial diets containing 1% coumarin, 2% coumarin, and 3% coumarin, respectively. The control group was fed diet only. Each group had three biological replicates. The weight of individual larvae in each group and the number of dead larvae in different groups were recorded daily. The survival rates were calculated using the formula: survival rate = (the number of surviving larvae − the number of dead larvae)/20 × 100%. The phenotype of S. litura larvae were observed at the fifth day after coumarin treatment using a camera.
4.2. Extraction of RNA, cDNA Synthesis, and RT-qPCR Analysis
The total RNA was extracted from different samples using the animal tissue total RNA kit (Simgen, Hangzhou, China). RNA quality and quantity were measured with a NanoDrop 2000 spectrophotometer (Thermo Fisher Scientific, New York, NY, USA). The total RNA was reverse-transcribed in a 20 µL reaction system using a cDNA synthesis master mix kit according to a previous protocol. All cDNA samples were diluted to the same concentration that served as a template for RT-qPCR analysis. The RT-qPCR reactions were performed using a LightCycler®96PCR Detection System (Roche, Basel, Switzerland). The specific sample addition procedures were performed following a previous report [45]. The relative expression levels were analyzed using the 2−∆∆Ct method. The constitutively expressed glyceraldehyde-3-phosphate dehydrogenase (GAPDH) was used as a reference gene. All primers are presented in Table S1. There were three biological and technical replicates conducted for each sample.
4.3. cDNA Library Preparation and Sequencing
A total of 180 fifth-instar larvae were divided into three groups (60 larvae in each group) and treated with 3% coumarin. The high quality of RNA from S. litura midgut in each group was used for cDNA library construction based on Illumina’s protocols, and cDNA libraries were constructed with the TruSeq RNA Sample Preparation Kit v2 (Illumina, San Diego, CA, USA). Then, the prepared libraries were evaluated on an Agilent BioAnalyzer 2100 system, followed by sequencing on an Illumina HiSeq platform at Novogene (Tianjin, China). The obtained raw reads in fastq format were further processed to remove contained N base and low quality of reads using in-house perl scripts. The Q30 (percentage of sequences with sequencing error rate lower than 0.1%), Q20 (percentage of sequences with sequencing error rate lower than 1%), and the GC content of the clean data were determined.
4.4. Data Analysis, DEGs Identification, and Bioinformatics Analysis
Based on sequencing results, the expression levels of the genes were calculated using Fragments Per Kilobase of transcript sequence per Millions (FPKM). Differential expression analyses of two groups were conducted using the DESeq2 (Version 1.24.0) software, and differentially expressed genes (DEGs) were identified by a threshold of |log2(fold change)| ≥ 1 and p-value < 0.05. Gene Ontology (GO) enrichment analysis of DEGs was implemented using the clusterProfiler R package (3.8.1). GO terms with corrected p-value < 0.05 were considered as significantly enriched by DEGs. A Kyoto Encyclopedia of Genes and Genomes (KEGG) pathway enrichment analysis for the DEGs was performed using KOBAS. A p-value of <0.01 was set as the threshold.
4.5. Determination of Various Enzymes Activity
A total of 90 third-instar larvae were divided into three groups (n = 30 in each group) for enzyme determination. The S. litura midgut samples were collected from 0 h, 24 h, and 48 h after 3% coumarin treatment. P450 enzyme activities from different samples were measured according to previous protocol with minor modification [46]. In brief, the S. litura midgut samples were ground into powder by liquid nitrogen, and homogenized in 1 mL Tris-HCl buffer (0.1 M, pH 8.6) by a glass homogenizer. The mixture was centrifuged at 10,000× g for 15 min at 4 °C. The obtained supernatant was collected as an enzyme solution. The above enzyme solution was added into 5 μL of 10 mM NADPH, and incubated for 1 min at 34 °C. Approximately 250 μL of 0.02 mM 7-ethoxycoumarin O-deethylase (ECOD) was added, and enzyme activity was measured using a fluorospectrophotometer. Standard curve was prepared from 10 μL of stepwise-diluted solution (0.05–0.5 mM) of 7-hydroxycoumarin.
The AChE enzyme activity was measured using a kit purchased from Nanjing Jiancheng Bioengineering Institute (Nanjing, China), following the manufacturer’s instructions. Briefly, moderate saline was added to different midgut samples, ground using an electric grinding machine, and centrifuged at 2500 rpm for 10 min. The supernatant from different samples were collected and kept for later use. Additionally, the protein concentration of different samples was measured using the BCA method. The reaction mixture was prepared by adding different volume of samples, 1 μmol/mL standard application solution, ddH2O, substrate buffer, and color application solution, and the mixture was placed at 37 °C for 6 min. Approximately 30 μL of inhibitor and 100 μL of transparent agent were added and placed at room temperature for 15 min. The absorbance was measured at 412 nm. The AChE content was calculated using the formula: AChE content = (Ameasure − Acontrol)/(Astandard − Ablank) × Cstandard/Cpr.
The GST enzyme activity was measured using a kit purchased from Nanjing Jiancheng Bioengineering Institute (Nanjing, China) following the manufacturer’s instructions. In brief, moderate saline was added to different midgut samples, ground using an electric grinding machine, and centrifuged at 2500 rpm for 10 min. The supernatant from different samples were collected and kept for later use. Additionally, the protein concentration of different samples was measured using the BCA method. The reaction mixture was prepared by adding different volume of matrix fluid and supernatant, and then incubated at 37 °C for 10 min. Furthermore, different volumes of liquid for application, ethanol, and supernatant were added and centrifuged at 4000 rpm for 10 min. The supernatant was collected for further color reaction. The color reaction system was prepared containing different volumes of GSH standard solvent application solution, 20 mol/L GSH standard buffer, supernatant, and liquid for application. The mixture was placed at room temperature for 15 min, and the absorbance was measured at 412 nm.
4.6. dsRNA Synthesis and Microinjection
SlP4506k1 gene was silenced using RNAi to determine its role in the response of S. litura midgut to coumarin treatment. Double-stranded SlCYP324A16 (dsSlCYP324A16) and green fluorescent protein (dsGFP) were synthesized using the T7 RioMAX Express RNAi System (Promega, San Luis Obispo, CA, USA) according to the manufacturer’s instructions. The specific primers containing a T7 promoter sequence were designed using the Primer Premier 5 software and presented in Table S1. The synthetic dsSlCYP324A16 was diluted to 800 ng/µL working solution using RNase-free water. For the RNAi experiment, a total of 180 fourth-instar S. litura larvae were divided into 12 groups. Among them, six groups were injected with dsSlCYP324A16 (5 µL per larva). After 48 h, three groups were transferred to diets with 3% coumarin, and the remaining three groups were introduced to diets without coumarin. A similar amount of dsGFP was injected as a control. The control groups were treated with the same methods (Figure 6A). The efficiency of SlCYP324A16 silencing was determined at 24 h and 48 h after injection of dsRNA using RT-qPCR. Furthermore, the cumulative mortality and average weight per larva were analyzed at 0, 24, 48, and 72 h in different groups. All data were analyzed using one-way ANOVA in the SPSS 16.0 software. P-values less than 0.05 and 0.01 were defined as significant and extremely significant, respectively.
4.7. Hemolymph Sample Pretreatment for UPLC-MS Analysis
For metabolomics analysis, a total of 360 fifth-instar larvae were divided into twelve groups, of which six groups were treated with 3% coumarin and the remaining six groups were treated with sterile water. The hemolymph was collected at 0 h, 24 h, and 48 h from treatment groups and control groups. For hemolymph sample pretreatment, a volume of 100 μL hemolymph was transferred to a 1.5 mL centrifuge tube, to which 300 μL of protein precipitator containing methanol and acetonitrile (Vmet:Vace = 2:1) and 2 μg/mL of 2-chlorophene alanine was added. The mixed samples were swirled for 1 min and further treated by ultrasound on ice for 10 min, and then placed at −40 °C for 30 min. The mixture was centrifuged at 13,000 rpm for 10 min at 4 °C. Approximately 200 μL of supernatant was transferred into a UPLC vial and dried. A total of 300 μL mixture of methanol and ddH2O (1:4) was added to dissolve the dried samples. The above samples were placed at −40 °C for 2 h, and further centrifuged at 13,000 rpm at 4 °C for 10 min. A total of 150 μL of supernatant was collected by using an injector and filtered through a 0.22 μm organic phase pinhole microfilter. Finally, the filtrate was transferred into a UPLC vial and stored at −80 °C for subsequent UPLC-MS analysis. Quality control (QC) samples were pooled by mixing all samples at an equal volume.
4.8. UPLC-MS Analysis for Untargeted Metabolite Profiling
UPLC-MS analysis was performed using an ACQUITY UPLC I-Class system (Waters Corporation, Milford, CT, USA) combined with VION IMS QTOF Mass spectrometer (Waters Corporation, Milford, CT, USA) to determine the metabolite profile from different samples. Approximately one microliter aliquot of the filtrate was injected into an ACQUITY UPLC BEH C18 column (1.7 μm, 2.1 × 100 mm; Waters Corp.) at a flow rate of 0.4 mL/min and a column oven at 45 °C. Water and acetonitrile/methanol (2/3, v/v) containing 0.1% formic acid were utilized as mobile phases A and B, respectively. Metabolite elution was conducted based on the following linear gradient: 0 min, 1% B; 1 min, 30% B; 2.5 min, 60% B; 6.5 min, 90% B; 8.5 min, 100% B; 10.7 min, 100% B; 10.8 min, 1% B; and 13 min, 1% B. All the samples were maintained at 4 °C.
Data acquisition was conducted in full-scan mode (m/z ranges from 50 to 1000) combined with MSE mode, including two independent scans with different collision energies (CE) were alternatively acquired during the run. The parameters of the mass spectrometry were as follows: a low-energy scan (CE 4 eV) and a high-energy (CE ramp 20–45 eV) to fragment the ions. Argon (99.999%) was used as collision-induced dissociation gas; scan time: 0.2 s; interscan delay: 0.02 s; capillary voltage: 2.5 kV; cone voltage: 40 V; source temperature: 115 °C; desolvation gas temperature: 450 °C; and desolvation gas flow, 900 L/h. The QCs were injected at regular intervals (every nine samples) throughout the analytical run to assess repeatability of the data. All procedures were carried out in the laboratory of Shanghai Luming Biotechnology Co., Ltd. (Shanghai, China).
4.9. Data Preprocessing and Statistical Analysis
The original LC-MS data were processed using the software progenesis QI v2.3 (Nonlinear Dynamics, Newcastle, UK) for baseline filtering, peak picking, integration, retention time (RT) alignment, peak alignment, and normalization. The main parameters of 5 ppm precursor tolerance, 10 ppm product tolerance, and 5% product ion threshold were applied. Compound identification were based on precise mass-to-charge ratio (m/z), secondary fragments and isotopic distribution using the Human Metabolome Database (HMDB), Lipidmaps (V2.3), Metlin, EMDB, PMDB, and self-built databases to conduct qualitative analysis.
The extracted data were then further processed by removing peaks with missing values (ion intensity = 0) in more than 50% of the group, by replacing zero value by half of the minimum value, and by screening according to the qualitative results of the compound. Compounds with resulting scores below 36 (out of 60) points were also deemed to be inaccurate and removed. A data matrix was obtained from the positive- and negative-ion data.
The matrix was imported into R to carry out a principal component analysis (PCA) to observe the overall distribution among the samples and the stability of the whole analysis process. Orthogonal Partial Least-Squares-Discriminant Analysis (QPLS-DA) and Partial Least-Squares-Discriminant Analysis (PLS-DA) were utilized to distinguish the metabolites that differ between groups. To prevent overfitting, seven-fold cross-validation and 200 response permutation testing (RPT) were used to evaluate the quality of the model.
Variable importance of projection (VIP) values obtained from the OPLS-DA model was used to rank the overall contribution of each variable to group discrimination. A two-tailed Student’s t-test was further used to verify whether the difference in metabolites groups were significant. Differential metabolites were selected with VIP > 1.0 and p-value < 0.05. Additionally, the Kyoto Encyclopedia of Genes and Genomes (KEGG; http://www.genome.jp/kegg/, accessed on 1 April 2023) was used to identify important pathways.
5. Conclusions
Considering these results, we proposed a hypothetical diagram illustrating that AChE and CYP450 activities were inhibited after coumarin entered the S. litura midgut, which resulted in the disruption of the detoxification of coumarin (Figure 12). Furthermore, in the early stage of coumarin treatment, coumarin significantly inhibited glycolysis and TCA cycle pathways, resulting in a reduction in energy production. However, coumarin treatment in the late stage resulted in a high level of coumarin being transported from the intracellular to extracellular spaces by ABC transporters, contributing to the reduction in toxicity. Our results provide insights for elucidating the toxicity mechanism of coumarin and lay a foundation for controlling S. litura.
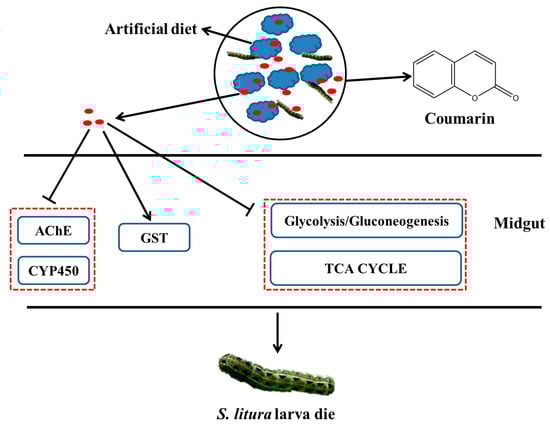
Figure 12.
A hypothesized schematic diagram of coumarin effect on enzymes and glycometabolism in S. litura.
Supplementary Materials
The supporting information can be downloaded at: https://www.mdpi.com/article/10.3390/ijms241713177/s1.
Author Contributions
Conceptualization, T.X. and H.Y.; methodology, Y.L. and Z.L.; software, Y.L.; validation, T.X., Y.L., and H.Y.; formal analysis, Z.L.; investigation, T.X.; resources, H.Y.; data curation, T.X.; writing—original draft preparation, T.X.; writing—review and editing, H.Y.; visualization, Z.L.; supervision, Z.L.; project administration, H.Y.; funding acquisition, Z.L. All authors have read and agreed to the published version of the manuscript.
Funding
This work was financially supported by the National Science Foundation of Jiangxi Province (2020BAB215004) and the earmarked fund for Jiangxi Agriculture Research System (JXARXS-07).
Institutional Review Board Statement
Not applicable.
Informed Consent Statement
Not applicable.
Data Availability Statement
Data is contained within the article or Supplementary Materials. For other information, please contact the corresponding author.
Conflicts of Interest
The authors declare no conflict of interest.
References
- Ahmad, M.; Ghaffar, A.; Rafiq, M. Host plants of leaf worm, Spodoptera litura (Fabricius) uidae in Pakistan. Asian J. Agri Biol. 2013, 1, 23–28. [Google Scholar]
- de Fouchier, A.; Sun, X.; Caballero-Vidal, G.; Travaillard, S.; Jacquin-Joly, E.; Montagne, N. Behavioral effect of plant volatiles binding to Spodoptera littoralis larval odorant receptors. Front. Behav. Neurosci. 2018, 12, 264. [Google Scholar] [CrossRef] [PubMed]
- Li, L.L.; Xu, J.W.; Yao, W.C.; Yang, H.H.; Dewer, Y.; Zhang, F. Chemosensory genes in the head of Spodoptera litura. Bull. Entomol. Res. 2021, 111, 454–463. [Google Scholar] [CrossRef]
- Du, L.X.; Liu, Y.; Zhang, J.; Gao, X.W.; Wang, B.; Wang, G.R. Identification and characterization of chemosensory genes in the antennal transcriptome of Spodoptera exigua. Comp. Biochem. Physiol. Part D Genom. Proteom. 2018, 27, 54–65. [Google Scholar] [CrossRef] [PubMed]
- Bi, H.L.; Xu, J.; Tan, A.J.; Huang, Y.P. CRISPR/Cas9-mediated targeted gene mutagenesis in Spodoptera litura. Insect Sci. 2016, 23, 469–477. [Google Scholar] [CrossRef]
- Miresmailli, S.; Isman, M.B. Botanical insecticides inspired by plant-herbivore chemical interactions. Trends Plant Sci. 2014, 19, 29–35. [Google Scholar]
- Rao, D.E.; Divya, K.; Prathyusha, I.V.S.N.; Krishna, C.R.; Chaitanya, K.V. Insect-resistant plants. Curr. Dev. Biotechnol. Bioeng. 2017, 15, 47–74. [Google Scholar]
- Bhonwong, A.; Stout, M.J.; Attajarusit, J.; Tantasawat, P. Defensive role of tomato polyphenol oxidases against cotton bollworm (Helicoverpa armigera) and beet armyworm (Spodoptera exigua). J. Chem. Ecol. 2009, 35, 28–38. [Google Scholar] [CrossRef]
- Harborne, J.B. The natural coumarins: Occurrence, chemistry and biochemistry (book). Plant Cell Environ. 1982, 5, 435–436. [Google Scholar] [CrossRef]
- Zhao, L.X.; Wang, Z.X.; Peng, J.F.; Zou, Y.L.; Hui, Y.Z.; Chen, Y.Z.; Gao, S.; Fu, Y.; Ye, F. Design, synthesis, and herbicidal activity of novel phenoxypyridine derivatives containing natural product coumarin. Pest. Manag. Sci. 2021, 77, 4785–4798. [Google Scholar] [CrossRef]
- Poudel, S.; Lee, Y. Gustatory receptors required for avoiding the toxic compound coumarin in Drosophila melanogaster. Mol. Cells 2016, 39, 310–315. [Google Scholar] [PubMed]
- Chen, Y.; Wang, P.C.; Zhang, S.S.; Yang, J.; Li, G.C.; Huang, L.Q.; Wang, C.Z. Functional analysis of a bitter gustatory receptor highly expressed in the larval maxillary galea of Helicoverpa armigera. PLoS Genet. 2022, 18, e1010455. [Google Scholar] [CrossRef] [PubMed]
- Zhou, H.; Liu, J.L.; Wan, F.L.; Guo, F.Y.; Ning, Y.S.; Liu, S.S.; Ding, W. Insight into the mechanism of action of scoparone inhibiting egg development of Tetranychus cinnabarinus Boisduval. Comp. Biochem. Physiol. C Toxicol. Pharmacol. 2021, 246, 109055. [Google Scholar] [CrossRef] [PubMed]
- Zhou, H.; Wan, F.L.; Guo, F.Y.; Liu, J.L.; Ding, W. High value-added application of a renewable bioresource as acaricide: Investigation the mechanism of action of scoparone against Tetranychus cinnabarinus. J. Adv. Res. 2021, 38, 29–39. [Google Scholar] [CrossRef]
- Hakim, R.S.; Baldwin, K.; Smagghe, G. Regulation of midgut growth, development, and metamorphosis. Annu. Rev. Entomol. 2010, 55, 593–608. [Google Scholar] [CrossRef]
- Intra, J.; Perotti, M.; Pasini, M.E. Cloning, sequence identification and expression profile analysis of α-L-fucosidase gene from the Mediterranean fruit fly Ceratitis capitate. J. Insect Physiol. 2011, 57, 452–461. [Google Scholar] [CrossRef]
- Yan, P.C.; Wen, C.W.; Zhang, S.Z.; Zhang, Z.D.; Xu, J.P.; Deng, M.J. A toxicological, metabonomic and transcriptional analysis to investigate the property of mulberry 1-deoxynojirimycin against the growth of Samia cynthia ricini. Pestic. Biochem. Physiol. 2018, 152, 45–54. [Google Scholar] [CrossRef]
- Li, P.; Hu, J.W.; Wen, C.W.; Hang, Y.; Zhou, Z.H.; Xie, M.; Lv, J.C.; Wang, C.M.; Huang, Y.H.; Xu, J.P.; et al. Sanguinarine caused larval lethality and growth inhibition by suppressing energy metabolism in silkworms, Bombyx mori. Pestic. Biochem. Physiol. 2019, 160, 154–162. [Google Scholar] [CrossRef]
- Wang, X.Y.; Zhao, Z.Q.; Song, C.X.; Su, Z.H.; Li, M.W.; Wu, Y.C.; Jin, B.R.; Deng, M.J. Fumarate mitigates disruption induced by fenpropathrin in the silkworm Bombyx mori (Lepidoptera): A metabolomics study. Insect Sci. 2023, 30, 789–802. [Google Scholar] [CrossRef]
- Zhu, Y.C.; Guo, Z.B.; Chen, M.S.; Zhu, K.Y.; Liu, X.F.; Scheffler, B. Major putative pesticide receptors, detoxification enzymes, and transcriptional profile of the midgut of the tobacco budworm, Heliothis virescens (Lepidoptera: Noctuidae). J. Invertebr. Pathol. 2011, 106, 296–307. [Google Scholar] [CrossRef]
- Scully, E.D.; Hoover, K.; Carlson, J.E.; Tien, M.; Geib, S.M. Midgut transcriptome profiling of Anoplophora glabripennis, a lignocellulose degrading cerambycid beetle. BMC Genom. 2013, 14, 850. [Google Scholar] [CrossRef] [PubMed]
- Xia, J.X.; Guo, Z.J.; Yang, Z.Z.; Zhu, X.; Kang, S.; Yang, X.; Yang, F.S.; Wu, Q.J.; Wang, S.L.; Xie, W.; et al. Proteomics-based identification of midgut proteins correlated with Cry1Ac resistance in Plutella xylostella (L.). Pestic. Biochem. Physiol. 2016, 132, 108–117. [Google Scholar] [CrossRef] [PubMed]
- Wu, Z.Z.; Pu, X.H.; Shu, B.S.; Bin, S.Y.; Lin, J.T. Transcriptome analysis of putative detoxification genes in the Asian citrus psyllid, Diaphorina citri. Pest Manag. Sci. 2020, 76, 3857–3870. [Google Scholar] [CrossRef]
- Wang, H.D.; Shi, Y.; Wang, L.; Liu, S.; Wu, S.W.; Yang, Y.H.; Feyereisen, R.; Wu, Y.D. CYP6AE gene cluster knockout in Helicoverpa armigera reveals role in detoxification of phytochemicals and insecticides. Nat. Commun. 2018, 9, 4820. [Google Scholar] [CrossRef] [PubMed]
- Kostaropoulos, I.; Mantzari, A.E.; Papadopoulos, A.I. Alterations of some glutathione S-transferase characteristics during the development of Tenebrio molitor (Insecta: Coleoptera). Insect Biochem. Mol. Biol. 1996, 26, 8–9. [Google Scholar] [CrossRef]
- Enayati, A.A.; Ranson, H.; Hemingway, J. Insect glutathione transferases and insecticide resistance. Insect Mol. Biol. 2005, 14, 3–8. [Google Scholar] [CrossRef]
- Kostaropoulos, I.; Papadopouslos, A.I.; Metaxakis, A.; Boukouvala, E.; Papadopoulou-Mourkidou, E. The role of glutathione S-transferases in the detoxification of some organophosphorus insecticides in larvae and pupae of the yellow mealworm, Tenebrio molitor (Coleoptera: Tenebrionidae). Pest Manag. Sci. 2001, 57, 501–508. [Google Scholar] [CrossRef]
- Wei, P.; Cen, M.; Nan, C.; Feng, K.Y.; Shen, G.M.; Cheng, J.Q.; He, L. Downregulation of carboxylesterase contributes to cyflumetofen resistance in Tetranychus cinnabarinus (Boisduval). Pest Manag. Sci. 2019, 75, 2166–2173. [Google Scholar] [CrossRef]
- Zhang, M.X.; Feng, T.T.; Pu, G.L.; Sun, X.Q.; Zhuo, X.G.; Cai, Q.N. Xenobiotic metabolism of plant secondary compounds in the English grain aphid, Sitobion avenae (F.) (Hemiptera: Aphididae). Pestic. Biochem. Physiol. 2013, 107, 44–49. [Google Scholar] [CrossRef]
- Shu, B.S.; Yang, X.M.; Dai, J.H.; Yu, H.K.; Yu, J.C.; Li, X.L.; Cao, L.; Lin, J.T. Effects of camptothecin on histological structures and gene expression profiles of fat bodies in Spodoptera frugiperda. Ecotoxicol. Environ. Saf. 2021, 228, 112968. [Google Scholar] [CrossRef]
- Li, F.L.; Yu, Y.X.; Guo, M.M.; Lin, Y.; Jiang, Y.H.; Qu, M.; Sun, X.J.; Li, Z.X.; Zhai, Y.X.; Tan, Z.J. Integrated analysis of physiological, transcriptomics and metabolomics provides insights into detoxification disruption of PFOA exposure in Mytilus edulis. Ecotoxicol. Environ. Saf. 2021, 214, 112081. [Google Scholar] [CrossRef] [PubMed]
- Rattan, R.S. Mechanism of action of insecticidal secondary metabolites of plant origin. Crop Prot. 2010, 29, 913–920. [Google Scholar] [CrossRef]
- Miralpeix, B.; Rischer, H.; Hakkinen, S.T.; Ritala, A.; Seppanen-Laakso, T.; Oksman-Caldentey, K.; Capell, T.; Christou, P. Metabolic engineering of plant secondary products: Which way forward. Curr. Pharm. Des. 2013, 19, 5622–5639. [Google Scholar] [CrossRef]
- Golan, K.; Sempruch, C.; Gorska-Drabik, E.; Czerniewicz, P.; Lagowska, B.; Kot, I.; Kmiec, K.; Magierowicz, K.; Leszczynski, B. Accumulation of amino acids and phenolic compounds in biochemical plant responses to feeding of two different herbivorous arthropod pests. Arthropod-Plant Interact. 2017, 11, 675–682. [Google Scholar] [CrossRef]
- Sharma, D.C.; Badiyala, A.; Choudhary, A. Bioefficacy and persistent toxicity of biopesticides and insecticides against potato tuber moth, Phthorimaea operculella zell. Pestic. Res. J. 2006, 18, 43–46. [Google Scholar]
- Yerer, M.B.; Dayan, S.; Han, M.I.; Sharma, A.; Tuli, H.S.; Sak, K. Nanoformulations of coumarins and the hybrid molecules of coumarins with potential anticancer effects. Anticancer Agents Med. Chem. 2020, 20, 1797–1816. [Google Scholar] [CrossRef]
- Hemingway, J.; Hawkes, N.J.; McCarroll, L.; Ranson, H. The molecular basis of insecticide resistance in mosquitoes. Insect Biochem. Mol. Biol. 2004, 34, 653–665. [Google Scholar] [CrossRef]
- Pengsook, A.; Tharamak, S.; Keosaeng, K.; Koul, O.; Bullangpoti, V.; Kumrungsee, N.; Pluempanupat, W. Insecticidal and growth inhibitory effects of some thymol derivatives on the beet armyworm, Spodoptera exigua (Lepidoptera: Noctuidae) and their impact on detoxification enzymes. Pest Manag. Sci. 2022, 78, 684–691. [Google Scholar] [CrossRef]
- Wang, Z.L.; Zhao, Z.; Abou-Zaid, M.M.; Arnason, J.T.; Liu, R.; Walshe-Roussel, B.; Waye, A.; Liu, S.Q.; Saleem, A.; Caceres, L.A.; et al. Inhibition of insect glutathione S-transferase (GST) by conifer extracts. Arch. Insect Biochem. Physiol. 2014, 87, 234–249. [Google Scholar] [CrossRef]
- Duan, S.Z.; Fu, Y.R.; Dong, S.S.; Ma, Y.F.; Meng, H.Y.; Guo, R.X.; Chen, J.Q.; Liu, Y.H.; Li, Y. Psychoactive drugs citalopram and mirtazapine caused oxidative stress and damage of feeding behavior in Daphnia magna. Ecotoxicol. Environ. Saf. 2021, 230, 113147. [Google Scholar] [CrossRef]
- Zhao, P.; Xue, H.; Zhu, X.Z.; Wang, L.; Zhang, K.X.; Li, D.Y.; Ji, J.C.; Niu, L.; Gao, X.K.; Luo, J.Y.; et al. Silencing of cytochrome P450 gene CYP321A1 effects tannin detoxification and metabolism in Spodoptera litura. Int. J. Biol. Macromol. 2022, 194, 895–902. [Google Scholar] [CrossRef] [PubMed]
- Yu, H.Z.; Zhang, Q.; Lu, Z.J.; Deng, M.J. Validamycin treatment significantly inhibits the glycometabolism and chitin synthesis in the common cutworm, Spodoptera litura. Insect Sci. 2022, 29, 840–854. [Google Scholar] [CrossRef] [PubMed]
- Bhagavan, N.Y.; Ha, C. Chapter 12-Carbohydrate metabolism I: Glycolysis and the tricarboxylic acid cycle. Essent. Med. Biochem. 2011, 5, 115–133. [Google Scholar]
- Wu, C.; Chakrabarty, S.; Jin, M.H.; Liu, K.Y.; Xiao, Y.T. Insect ATP-binding cassette (ABC) transporters: Roles in xenobiotic detoxification and Bt insecticidal activity. Int. J. Mol. Sci. 2019, 20, 2829. [Google Scholar] [CrossRef] [PubMed]
- Song, J.C.; Lu, Z.J.; Yi, L.; Yu, H.Z. Functional characterization of a trehalose-6-phosphate synthase in Diaphorina citri revealed by RNA interference and transcriptome sequencing. Insects 2021, 12, 1074. [Google Scholar] [CrossRef]
- Huang, C.F.; Sun, C.N. Microsomal monooxygenases in diamondback moth larvae resistant to fenvalerate and piperonyl butoxide. Pestic. Biochem. Physiol. 1989, 33, 168–175. [Google Scholar] [CrossRef]


Disclaimer/Publisher’s Note: The statements, opinions and data contained in all publications are solely those of the individual author(s) and contributor(s) and not of MDPI and/or the editor(s). MDPI and/or the editor(s) disclaim responsibility for any injury to people or property resulting from any ideas, methods, instructions or products referred to in the content. |
© 2023 by the authors. Licensee MDPI, Basel, Switzerland. This article is an open access article distributed under the terms and conditions of the Creative Commons Attribution (CC BY) license (https://creativecommons.org/licenses/by/4.0/).