
Metabolomics: Perspectives on Clinical Employment in Autism Spectrum Disorder

 , , , ,
  and
and
Abstract
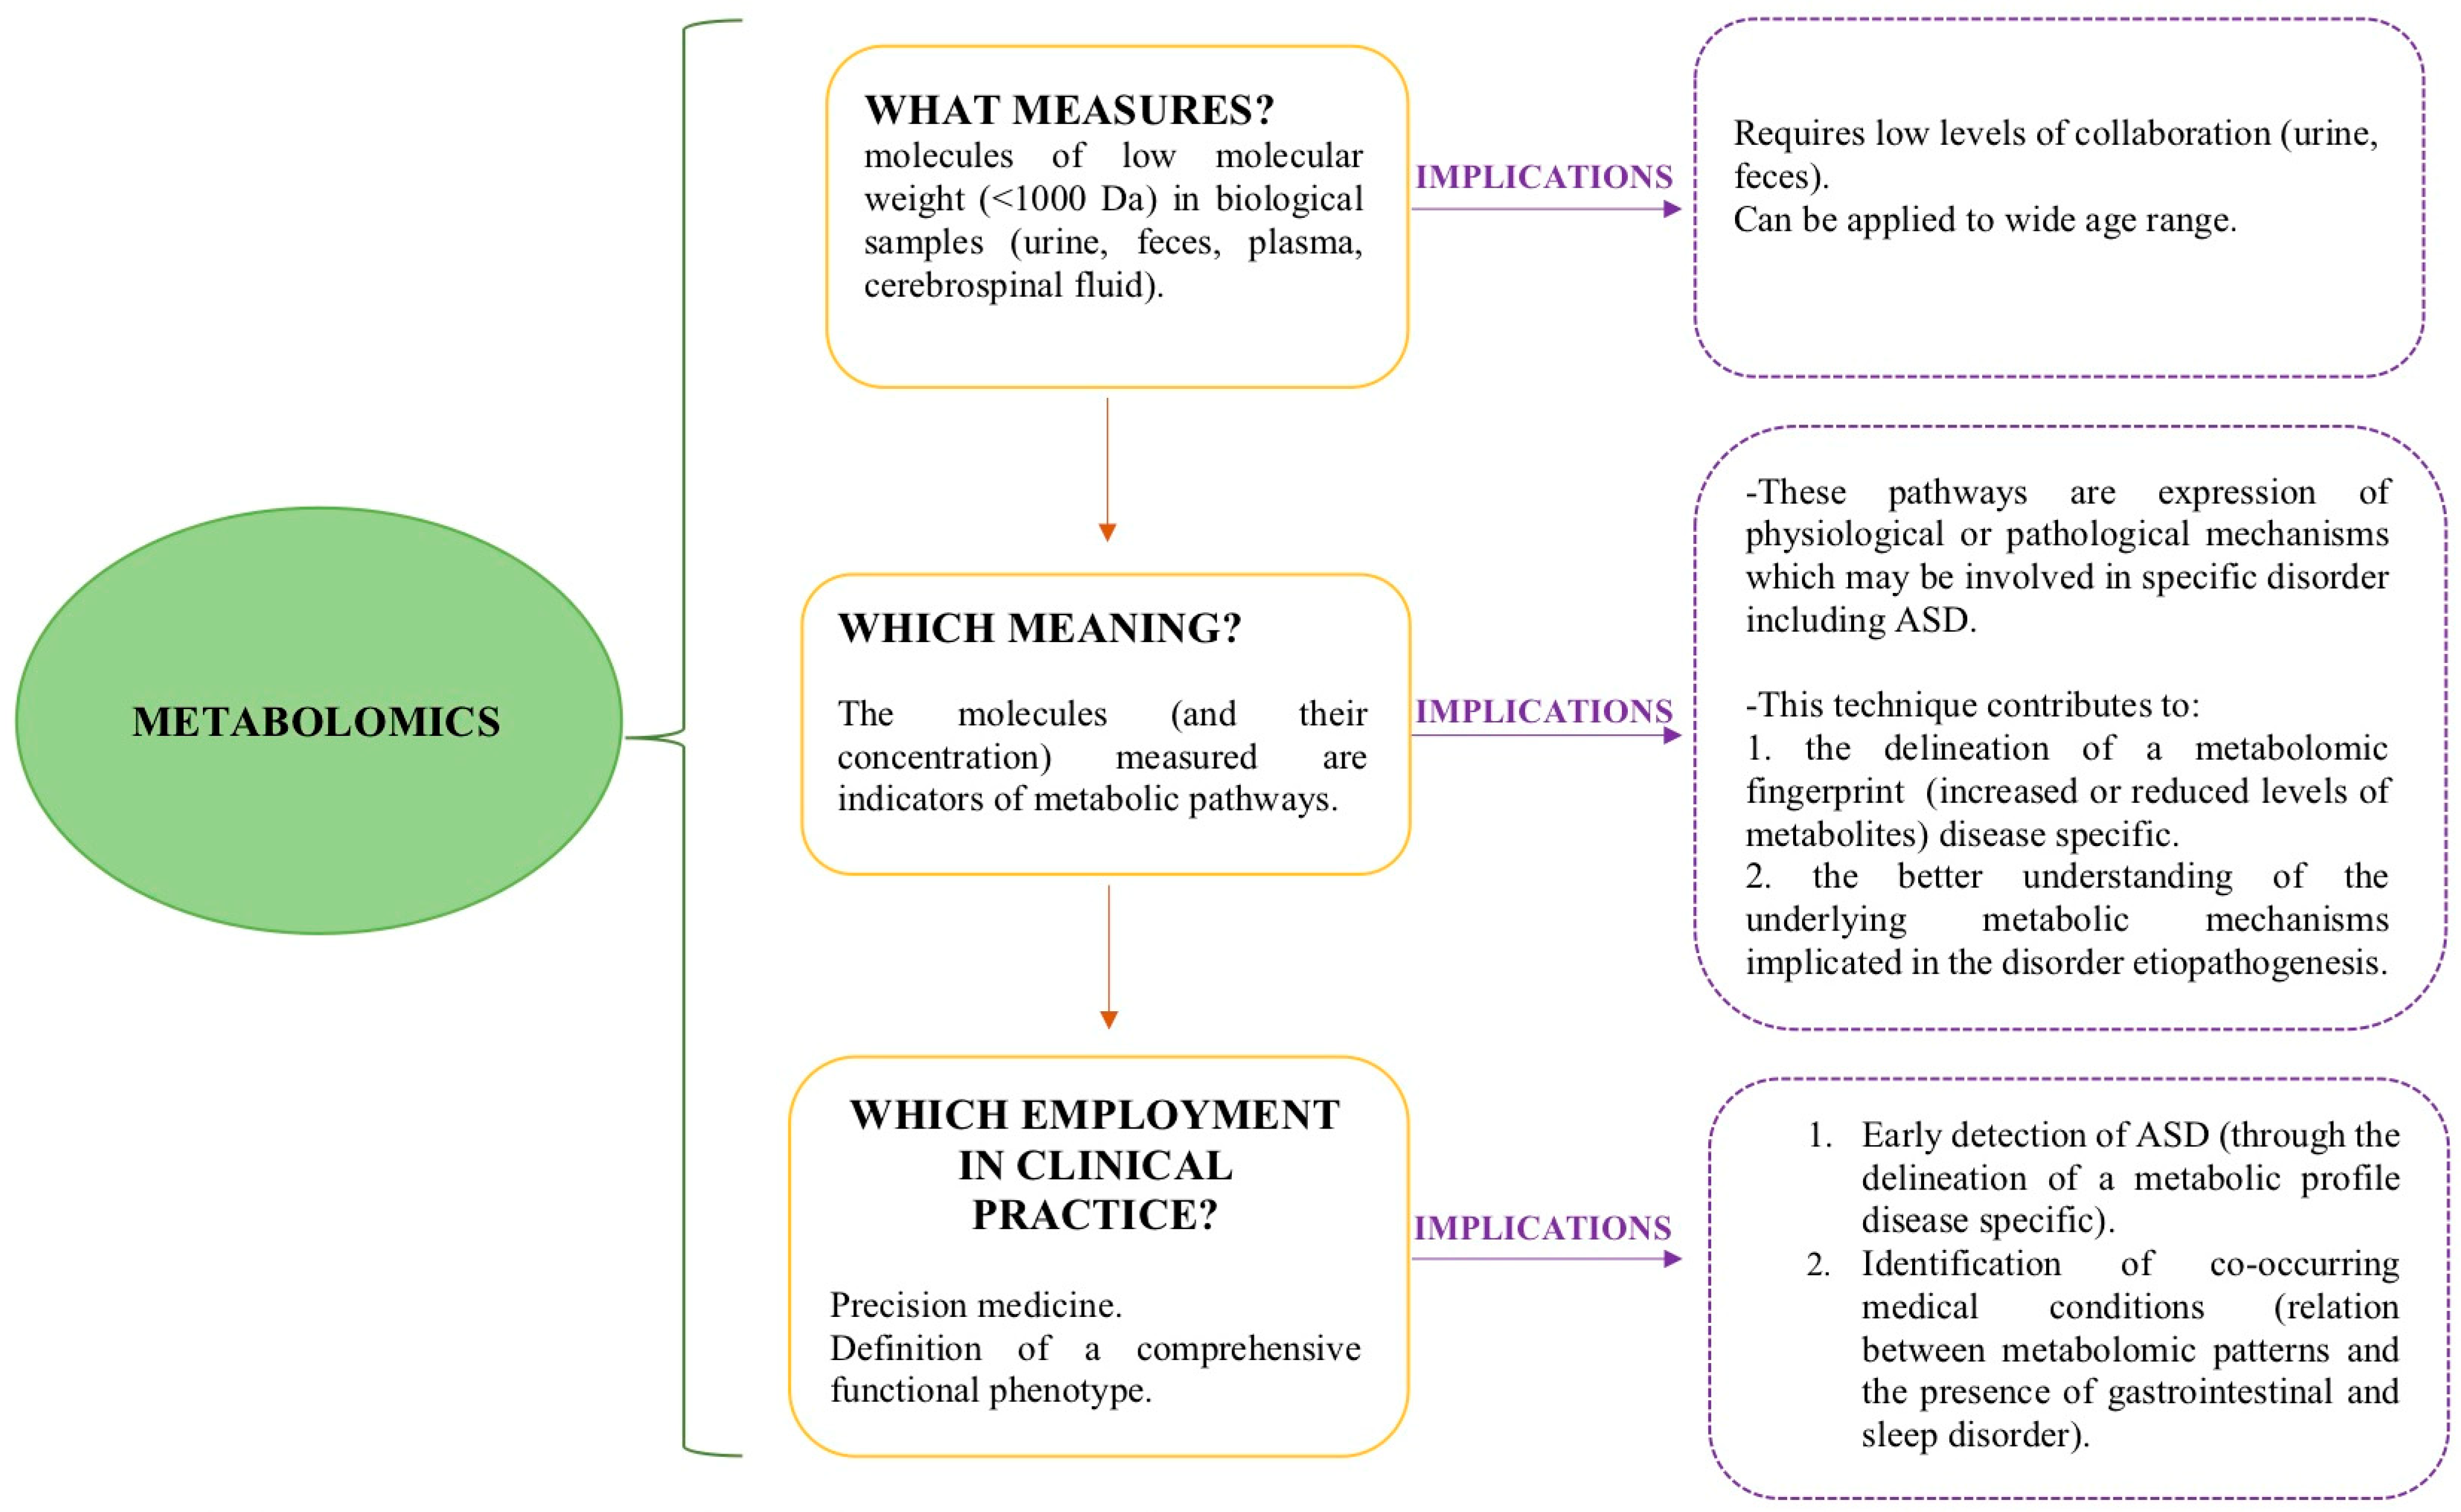
:1. Introduction
- Investigate the metabolomic profiles of individuals with ASD in order to improve early diagnosis;
- Highlight possible relations between metabolomic patterns and symptom severity profiles among individuals with ASD;
- Identify the association between metabolomic patterns and the presence of co-occurrent medical conditions in the ASD clinical population.
2. Discussion
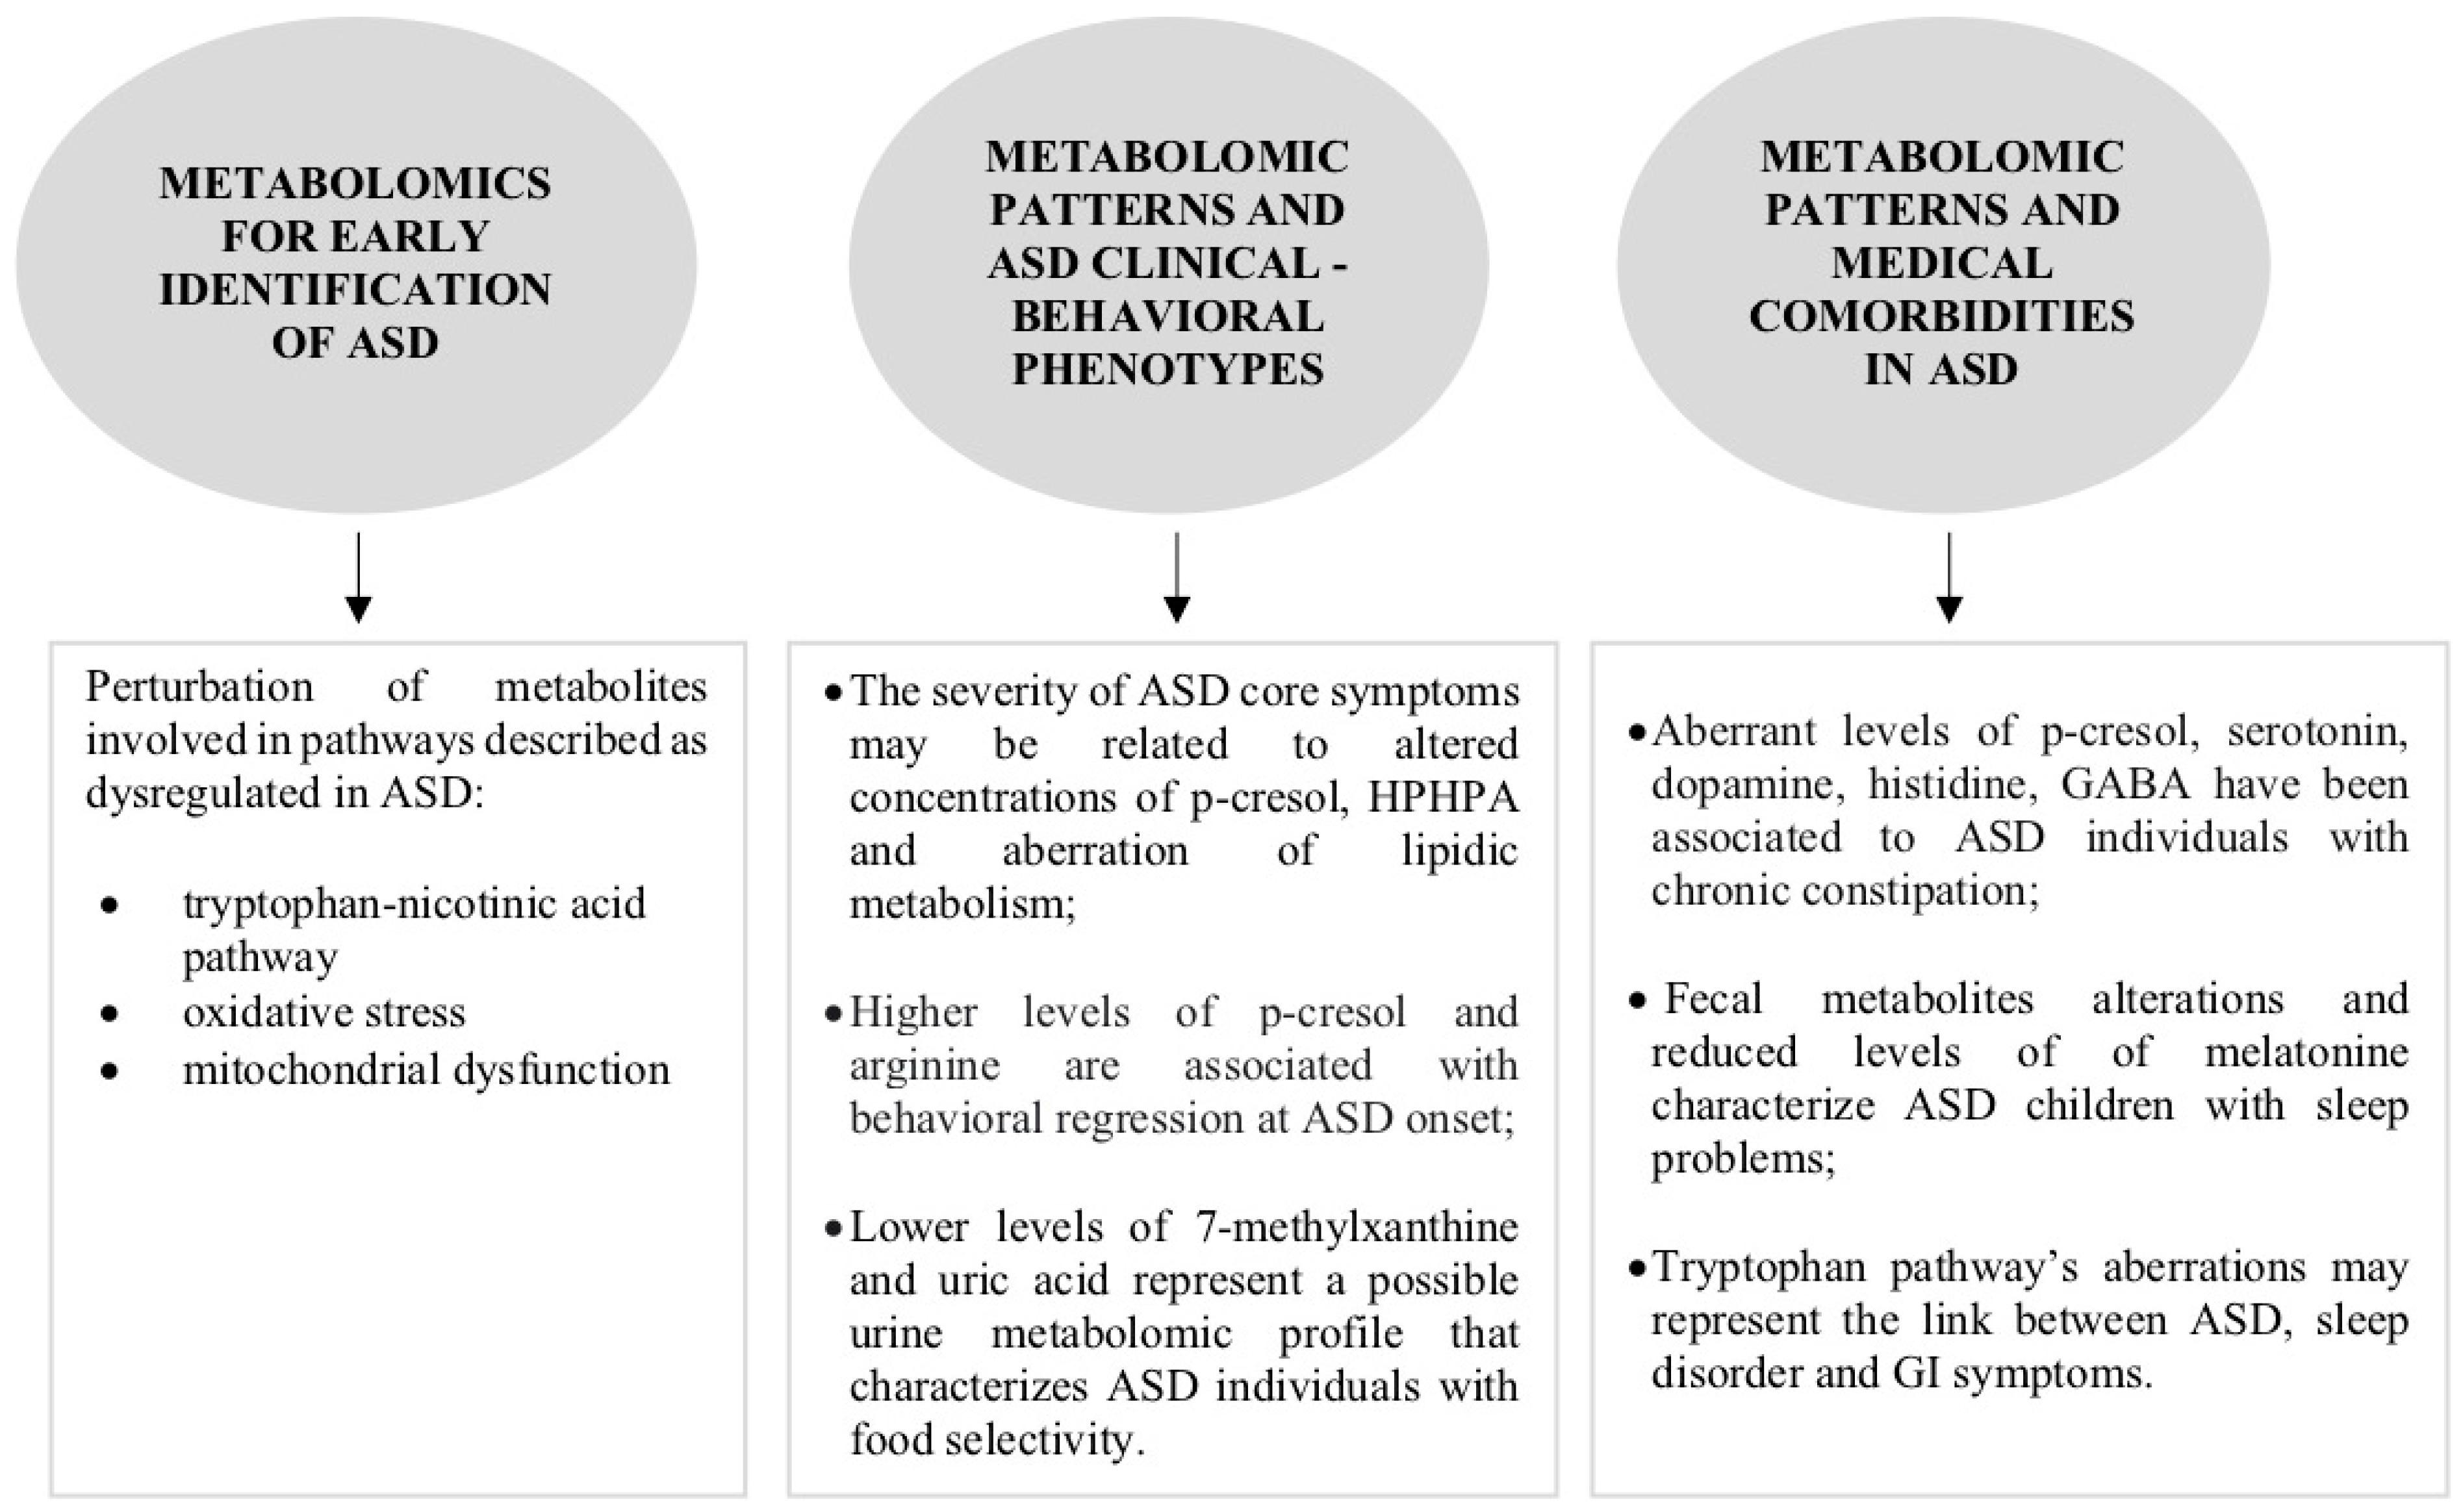
2.1. What Is the Role of Metabolomics in the Early Identification of ASD?
2.2. Can Metabolomics Contribute to the Clinical Phenotype Stratification of ASD?
2.3. Can Metabolomic Patterns Be Indicators of Co-Occurrent Medical Conditions in ASD?
2.3.1. Gastrointestinal Disorders
2.3.2. Sleep Disorders
3. Conclusions
Author Contributions
Funding
Institutional Review Board Statement
Informed Consent Statement
Data Availability Statement
Conflicts of Interest
References
- American Psychiatric Association. Diagnostic and Statistical Manual of Mental Disorders-5; American Psychiatric Association: Washington, DC, USA, 2013. [Google Scholar]
- Fein, D.; Stevens, M.; Dunn, M.; Waterhouse, L.; Allen, D.; Rapin, I.; Feinstein, C. Subtypes of pervasive developmental disorder: Clinical characteristics. Child. Neuropsychol. 1999, 5, 1–23. [Google Scholar] [CrossRef]
- Stevens, M.; Fein, D.; Dunn, M.; Allen, D.; Waterhouse, L.H.; Feinstein, C.; Rapin, I. Subgroups of children with autism by cluster analysis: A longitudinal examination. J. Am. Acad. Child Adoles Psy 2000, 29, 346–352. [Google Scholar] [CrossRef]
- Stevens, E.; Dixon, R.D.; Novack, N.N.; Granpeesheh, D.; Smith, T.; Linstead, E. Identification and analysis of behavioral phenotypes in autism spectrum disorder via unsupervised machine learning. Int. J. Med. Informatics 2019, 129, 29–36. [Google Scholar] [CrossRef]
- Tian, J.; Gao, X.; Yang, L. Repetitive Restricted Behaviors in Autism Spectrum Disorder: From Mechanism to Development of Therapeutics. Front. Neurosci. 2022, 16, 780407. [Google Scholar] [CrossRef] [PubMed]
- Chaidez, V.; Hansen, R.L.; Hertz-Picciotto, I. Gastrointestinal problems in children with autism, developmental delays or typical development. J. Autism Dev. Disord. 2014, 44, 1117–1127. [Google Scholar] [CrossRef] [PubMed]
- Lai, M.C.; Kassee, C.; Besney, R.; Bonato, S.; Hull, L.; Mandy, W.; Szatmari, P.; Ameis, S.H. Prevalence of co-occurring mental health diagnoses in the autism population: A systematic review and meta-analysis. Lancet Psychiatry 2019, 6, 819–829. [Google Scholar] [CrossRef] [PubMed]
- Levy, S.E.; Giarelli, E.; Lee, L.C.; Schieve, L.A.; Kirby, R.S.; Cunniff, C.; Nicholas, J.; Reaven, J.; Rice, C.E. Autism spectrum disorder and co-occurring developmental, psychiatric, and medical conditions among children in multiple populations of the United States. J. Dev. Behav. Pediatr. 2010, 31, 267–275. [Google Scholar] [CrossRef] [PubMed]
- Schaefer, G.B.; Mendelsohn, N.J.; Professional Practice and Guidelines Committee. Clinical genetics evaluation in identifying the etiology of autism spectrum disorders: 2013 guideline revisions. Genet. Med. 2013, 15, 399–407. [Google Scholar] [CrossRef]
- Lai, M.C.; Lombardo, M.V.; Baron-Cohen, S. Autism. Lancet 2014, 383, 896–910. [Google Scholar] [CrossRef]
- Abrahams, B.S.; Geschwind, D.H. Advances in autism genetics: On the threshold of a new neurobiology. Nat. Rev. Genet. 2008, 9, 341–355. [Google Scholar] [CrossRef]
- Anderson, G.M.; Horne, W.C.; Chatterjee, D.; Cohen, D.J. The hyperserotoninemia of autism. Ann. N. Y. Acad. Sci. 1990, 600, 331–340. [Google Scholar] [CrossRef] [PubMed]
- Gabriele, S.; Sacco, R.; Persico, A.M. Blood serotonin levels in autism spectrum disorder: A systematic review and meta-analysis. J. Eur. Neuropsychopharmacol. 2014, 24, 919–929. [Google Scholar] [CrossRef]
- Hammock, E.; Veenstra-VanderWeele, J.; Yan, Z.; Kerr, T.M.; Morris, M.; Anderson, G.M.; Sue Carter, C.; Cook, E.H.; Jacob, S. Examining autism spectrum disorders by biomarkers: Example from the oxyto- cin and serotonin systems. J. Am. Acad. Child Adolesc. Psychiatry 2012, 51, 712–721. [Google Scholar] [CrossRef]
- Bardanzellu, F.; Fanos, V. How could metabolomics change pediatric health? Ital. J. Pediatr. 2020, 46, 37. [Google Scholar] [CrossRef] [PubMed]
- Odom, J.; Sutton, V.R. Metabolomics in Clinical Practice: Improving Diagnosis and Informing Management. Clin. Chem. 2021, 67, 1606–1617. [Google Scholar] [CrossRef] [PubMed]
- Holmes, E.; Wilson, I.D.; Nicholson, J.K. Metabolic phenotyping in health and disease. Cell 2008, 134, 714–717. [Google Scholar] [CrossRef]
- Guo, L.; Milburn, M.V.; Ryals, J.A.; Lonergan, S.C.; Mitchell, M.W.; Wulff, J.E.; Alexander, D.C.; Evans, A.M.; Bridgewater, B.; Miller, L.; et al. Plasma metabolomic profiles enhance precision medicine for volunteers of normal health. Proc. Natl. Acad. Sci. USA 2015, 112, E4901–E4910. [Google Scholar] [CrossRef]
- Ruggeri, B.; Sarkans, U.; Schumann, G.; Perisco, A.M. Biomarkers in autism spectrum disorder: The old and the new. Psychopharmacology 2014, 231, 1201–1216. [Google Scholar] [CrossRef]
- Glinton, K.E.; Elsea, S.H. Untargeted Metabolomics for Autism Spectrum Disorders: Current Status and Future Directions. Front. Psychiatry 2019, 10, 647. [Google Scholar] [CrossRef]
- Mussap, M.; Siracusano, M.; Noto, A.; Fattuoni, C.; Riccioni, A.; Rajula, H.S.R.; Fanos, V.; Curatolo, P.; Barberini, L.; Mazzone, L. The Urine Metabolome of Young Autistic Children Correlates with Their Clinical Profile Severity. Metabolites 2020, 10, 476. [Google Scholar] [CrossRef]
- Rangel-Huerta, O.D.; Gomez-Fernández, A.; de la Torre-Aguilar, M.J.; Gil, A.; Perez-Navero, J.L.; Flores-Rojas, K.; Martín-Borreguero, P.; Gil-Campos, M. Metabolic profiling in children with autism spectrum disorder with and without mental regression: Preliminary results from a cross-sectional case–control study. Metabolomics 2019, 15, 99. [Google Scholar] [CrossRef] [PubMed]
- Liang, Y.; Xiao, Z.; Ke, X.; Yao, P.; Chen, Y.; Lin, L.; Lu, K. Urinary Metabonomic Profiling Discriminates Between Children with Autism and Their Healthy Siblings. Clin. Res. 2020, 26, e926634. [Google Scholar] [CrossRef] [PubMed]
- Laghi, L.; Mastromarino, P.; Prosperi, M.; Morales, M.A.; Calderoni, S.; Santocchi, E.; Muratori, F.; Guiducci, L. Are fecal metabolome and microbiota profiles correlated with autism severity? A cross-sectional study on ASD preschoolers. Metabolites 2021, 11, 654. [Google Scholar] [CrossRef] [PubMed]
- Gevi, F.; Zolla, L.; Gabriele, S.; Persico, A.M. Urinary metabolomics of young italian autistic children supports abnormal tryptophan and purine metabolism. Mol. Autism 2016, 7, 47. [Google Scholar] [CrossRef] [PubMed]
- Yap, I.K.; Angley, M.; Veselkov, K.A.; Holmes, E.; Lindon, J.C.; Nicholson, J.K. Urinary metabolic phenotyping differentiates children with autism from their unaffected siblings and age-matched controls. J. Proteome Res. 2010, 9, 2996–3004. [Google Scholar] [CrossRef]
- Ming, X.; Stein, T.P.; Barnes, V.; Rhodes, N.; Guo, L. Metabolic Perturbance in Autism Spectrum Disorders: A Metabolomics Study. J. Proteome Res. 2012, 11, 5856–5862. [Google Scholar] [CrossRef] [PubMed]
- Kuwabara, H.; Yamasue, H.; Koike, S.; Inoue, H.; Kawakubo, Y.; Kuroda, M.; Takano, Y.; Iwashiro, N.; Natsubori, T.; Aoki, Y.; et al. Altered metabolites in the plasma of autism spectrum disorder: A capillary electrophoresis time-of-flight mass spectroscopy study. PLoS ONE. 2013, 8, e73814. [Google Scholar] [CrossRef] [PubMed]
- Emond, P.; Mavel, S.; Aidoud, N.; Nadal-Desbarats, L.; Montigny, F.; Bonnet-Brilhault, F.; Barthélémy, C.; Merten, M.; Sarda, P.; Laumonnier, F.; et al. GC-MS-based urine metabolic profiling of autism spectrum disorders. Anal. Bioanal. Chem. 2013, 15, 5291–5300. [Google Scholar] [CrossRef]
- Noto, A.; Fanos, V.; Barberini, L. The urinary metabolomics profile of an Italian autistic children population and their unaffected siblings. J. Matern. Fetal Neonatal Med. 2014, 27, 46–52. [Google Scholar] [CrossRef]
- Kałużna-Czaplińska, J.; Żurawicz, E.; Struck, W.; Markuszewski, M. Identification of organic acids as potential biomarkers in the urine of autistic children using gas chromatography/mass spectrometry. J. Chromatogr. B Anal. Technol. Biomed. Life Sci. 2014, 966, 70–76. [Google Scholar] [CrossRef]
- West, P.R.; Amaral, D.G.; Bais, P.; Smith, A.M.; Egnash, L.A.; Ross, M.E.; Palmer, J.A.; Fontaine, B.R.; Conard, K.R.; Corbett, B.A.; et al. Metabolomics as a tool for discovery of biomarkers of ASD in the blood plasma of children. PLoS ONE 2014, 9, e112445. [Google Scholar] [CrossRef]
- Wang, H.; Liang, S.; Wang, M.; Gao, J.; Sun, C.; Wang, J.; Xia, W.; Wu, S.; Sumner, S.J.; Zhang, F.; et al. Potential serum biomarkers from metabolomics study of autism. J. Psychiatry Neurosci. 2016, 41, 23–37. [Google Scholar] [CrossRef] [PubMed]
- Xiong, X.; Liu, D.; Wang, Y.; Zeng, T.; Peng, Y. Urinary 3-(3-Hydroxyphenyl)-3-hydroxypropionic Acid, 3-Hydroxyphenylacetic Acid, and 3-Hydroxyhippuric Acid Are Elevated in Children with Autism Spectrum Disorder. BioMed Res. Int. 2016, 2016, 9485412. [Google Scholar] [CrossRef]
- Lussu, M.; Noto, A.; Masili, A.; Rinaldi, A.C.; Dessì, A.; De Angelis, M.; De Giacomo, A.; Fanos, V.; Atzori, L.; Francavilla, R. The urinary 1H-NMR metabolomics profile of an Italian autistic children population and their unaffected siblings. Autism Res. 2017, 10, 1058–1066. [Google Scholar] [CrossRef]
- Bitar, T.; Mavel, S.; Emond, P.; Nadal-Desbarats, L.; Lefèvre, A.; Mattar, H.; Soufia, M.; Blasco, H.; Vourc’h, P.; Hleihel, W.; et al. Identification of metabolic pathway disturbances using multimodal metabolomics in autistic disorders in a Middle Eastern population. J. Pharm. Biomed. Anal. 2018, 152, 57–65. [Google Scholar] [CrossRef]
- Barone, R.; Alaimo, S.; Messina, M.; Pulvirenti, A.; Bastin, J.; MIMIC-Autism Group; Ferro, A.; Frye, R.E.; Rizzo, R. A subset of patients with autism spectrum disorders show a distinctive metabolic profile by dried blood spot analyses. Front. Psychiatry 2018, 9, 636. [Google Scholar] [CrossRef]
- Orozco, J.S.; Hertz-Picciotto, I.; Abbeduto, L.; Slupsky, C.M. Metabolomics analysis of children with autism, idiopathic-developmental delays, and Down syndrome. Transl. Psychiatry 2019, 9, 243. [Google Scholar] [CrossRef]
- Leboucher, A.; Pisani, D.F.; Martinez-Gili, L.; Chilloux, J.; Bermudez-Martin, P.; Van Dijck, A.; Ganief, T.; Macek, B.; Becker, J.A.J.; Le Merrer, J.; et al. The translational regulator FMRP controls lipid and glucose metabolism in mice and humans. Mol. Metab. 2019, 21, 22–35. [Google Scholar] [CrossRef] [PubMed]
- Liu, A.; Zhou, W.; Qu, L.; He, F.; Wang, H.; Wang, Y.; Cai, C.; Li, X.; Zhou, W.; Wang, M. Altered Urinary Amino Acids in Children With Autism Spectrum Disorders. Front. Cell Neurosci. 2019, 13, 7. [Google Scholar] [CrossRef]
- Gevi, F.; Belardo, A.; Zolla, L. A metabolomics approach to investigate urine levels of neurotransmitters and related metabolites in autistic children. Biochim. Biophys. Acta Mol. Basis Dis. 2020, 1866, 165859. [Google Scholar] [CrossRef] [PubMed]
- Ma, Y.; Zhou, H.; Li, C.; Zou, X.; Luo, X.; Wu, L.; Li, T.; Chen, X.; Mao, M.; Huang, Y.; et al. Differential Metabolites in Chinese Autistic Children: A Multi-Center Study Based on Urinary 1H-NMR Metabolomics Analysis. Front. Psychiatry 2021, 12, 624767. [Google Scholar] [CrossRef]
- Chung, M.K.; Smith, M.R.; Lin, Y.L.; Walker, D.I.; Jones, D.; Patel, C.J.; Kong, S.W. Plasma metabolomics of autism spectrum disorder and influence of shared components in proband families. Exposome 2021, 1, osab004. [Google Scholar] [CrossRef]
- Corraud, J.; Ernst, M.; Svane Laursen, S.; Hougaard, D.M.; Cohen, A.S. Studying Autism Unsing Untargeted Metabolomics in Newborn Screening Samples. J. Mol. Neurosci. 2021, 71, 1378–1393. [Google Scholar] [CrossRef]
- Timperio, A.M.; Gevi, F.; Cucinotta, F.; RIcciardello, A.; Turriziani, L.; Scattoni, M.L.; Persico, A.M. Urinary untargeted metabolic profile differentiates children with autism from their unaffected siblings. Metabolites 2022, 12, 797. [Google Scholar] [CrossRef]
- Khan, Z.U.N.; Chand, P.; Majid, H.; Ahmed, S.; Khan, A.H.; Jamil, A.; Ejaz, S.; Wasim, A.; Khan, K.A.; Jafri, L. Urinary metabolomics using gas chromatography-mass spectrometry: Potential biomarkers for autism spectrum disorder. BMC Neurol. 2022, 22, 101. [Google Scholar] [CrossRef] [PubMed]
- Altieri, L.; Neri, C.; Sacco, R.; Curatolo, P.; Benvenuto, A.; Muratori, F.; Santocchi, E.; Bravaccio, C.; Lenti, C.; Saccani, M.; et al. Urinary p-cresol is elevated in small children with severe autism spectrum disorder. Biomarkers 2011, 16, 252–260. [Google Scholar] [CrossRef] [PubMed]
- Needham, B.D.; Adame, M.D.; Serena, G.; Rose, D.R.; Preston, G.M.; Conrad, M.C.; Campbell, A.S.; Donabedian, D.H.; Fasano, A.; Ashwood, P.; et al. Plasma and Fecal Metabolite Profiles in Autism Spectrum Disorder. Biol. Psy 2021, 89, 451–462. [Google Scholar] [CrossRef]
- Zhu, J.; Hua, X.; Yang, T.; Guo, M.; Li, Q.; Xiao, L.; Li, L.; Chen, J.; Li, T. Alterations in gut vitamin and amino acid metabolism are associated with symptoms and neurodevelopment in children with autism spectrum disorder. JADD 2021, 52, 3116–3128. [Google Scholar] [CrossRef]
- Wang, L.; Zheng, R.; Xu, Y.; Zhou, Z.; Guan, P.; Wu, Y.; Zhou, J.; Cheng, Z.; Zhang, L. Altered Metabolic Characteristics in Plasma of Young Boys with Autism Spectrum Disorder. JADD 2022, 52, 4897–4907. [Google Scholar] [CrossRef] [PubMed]
- Brister, D.; Rose, S.; Delhey, L.; Tippett, M.; Jin, Y.; Gu, H.; Frye, R.E. Metabolomic Signatures of Autism Spectrum Disorder. J. Pers. Med. 2022, 12, 1727. [Google Scholar] [CrossRef]
- Gabriele, S.; Sacco, R.; Altieri, L.; Neri, C.; Urbani, A.; Bravaccio, C.; Riccio, M.P.; Iovene, M.R.; Bombace, F.; De Magistris, L.; et al. Slow Intestinal Transit Contributes to Elevate Urinary p-Cresol Level in Italian Autistic Children. Autism Res. 2016, 9, 752–759. [Google Scholar] [CrossRef]
- Kang, D.W.; Ilhan, Z.E.; Isern, N.G.; Hoyt, D.W.; Howsmon, D.P.; Shaffer, M.; Lozupone, C.A.; Hahn, J.; Adams, J.B.; Krajmalnik-Brown, R. Differences in fecal microbial metabolites and microbiota of children with autism spectrum disorders. Anaerobe 2018, 49, 121–131. [Google Scholar] [CrossRef]
- Hua, X.; Zhu, J.; Yang, T.; Guo, M.; Li, Q.; Chen, J.; Li, T. The gut microbiota and associated metabolites are altered in sleep disorder of children with autism. Front. Psychiatry 2020, 11, 855. [Google Scholar] [CrossRef]
- Dan, Z.; Mao, X.; Liu, Q.; Guo, M.; Zhuang, Y.; Liu, Z.; Chen, K.; Chen, J.; Xu, R.; Tang, J.; et al. Altered gut microbial profile is associated with abnormal metabolism activity of autism spectrum disorder. Gut Microbes 2020, 11, 1246–1267. [Google Scholar] [CrossRef] [PubMed]
- Daneberga, Z.; Nakazawa-Miklasevica, M.; Berga-Svitina, E.; Murmane, D.; Isarova, D.; Cupane, L.; Masinska, M.; Nartisa, I.; Lazdane, A.; Miklasevics, E. Urinary organic acids spectra in children with altered gut microbiota composition and autistic spectrum disorder. Nord. J. Psychiatry 2022, 76, 523–529. [Google Scholar] [CrossRef]
- Kang, D.-W.; Adams, J.B.; Vargason, T.; Santiago, M.; Hahn, J.; Krajmanik-Brown, R. Distinct fecal and plasma metabolites in children with autism spectrum disorders and their modulation after microbiota transfer therapy. mSphere 2020, 5, e00314-20. [Google Scholar] [CrossRef]
- Chen, Q.; Qiao, Y.; Xu, X.-J.; Tao, Y.; You, X. Urine Organic Acids as Potential Biomarkers for Autism-Spectrum Disorder in Chinese Children. Front. Cell Neurosci. 2019, 13, 150. [Google Scholar] [CrossRef] [PubMed]
- Shaw, W. Dopamine excess and/or norepinephrine and epinephrine deficiency in autistic patients due to prenatal and/or postnatal deficiency of dopamine beta-hydroxylase. J. Orthomol. Med. 2021, 36, 1–25. [Google Scholar]
- van ’t Hof, M.; Tisseur, C.; van Berckelear-Onnes, I.; van Nieuwenhuyzen, A.; Daniels, A.M.; Deen, M.; Hoek, H.W.; Ester, W.A. Age at autism spectrum disorder diagnosis: A systematic review and meta-analysis from 2012 to 2019. Autism 2021, 25, 862–873. [Google Scholar] [CrossRef]
- Tanner, A.; Dounavi, C. The Emergence of Autism Symptoms Prior to 18 Months of Age: A Systematic Literature Review. JADD 2021, 51, 973–993. [Google Scholar] [CrossRef] [PubMed]
- Han, V.X.; Patel, S.; Jones, H.F.; Dale, R.C. Maternal immune activation and neuroinflammation in human neurodevelopmental disorders. Nat. Rev. Neurol. 2021, 17, 564–579. [Google Scholar] [CrossRef] [PubMed]
- Lu, J.; Wang, Z.; Liang, Y.; Yao, P. Rethinking autism: The impact of maternal risk factors on autism development. Am. J.Transl. Res. 2022, 14, 1136–1145. [Google Scholar]
- Mussap, M.; Noto, A.; Fanos, V. Metabolomics of autism spectrum disorder: Early insights regarding mammalian-microbial cometabolites. Expert. Rev. Mol. Diagn. 2016, 16, 869–881. [Google Scholar] [CrossRef]
- Persico, A.; Napolioni, V. Urinary p-cresol in autism spectrum disorder. Neurotoxicol. Teratol. 2013, 36, 82–90. [Google Scholar] [CrossRef] [PubMed]
- Rossignol, D.A.; Frye, R.E. Mitochondrial dysfunction in autism spectrum disorders: A systematic review and meta- analysis. Mol. Psychiatry 2012, 17, 290–314. [Google Scholar] [CrossRef] [PubMed]
- Frye, R.E.; Melnyk, S.; MacFabe, D.F. Unique acylcarnitine profiles are potential biomarkers for acquired mitochondrial disease in autism spectrum disorder. Transl. Psychiatry 2013, 3, e220. [Google Scholar] [CrossRef]
- Correia, C.; Coutinho, A.M.; Diogo, L.; Grazina, M.; Marques, C.; Miguel, T.; Ataìde, A.; Almeida, J.; Borges, L.; Oliveira, C.; et al. Brief report: High frequency of biochemical markers for mitochondrial dysfunction in autism: No association with the mitochondrial aspartate/glutamate carrier SLC25A12 gene. J. Autism Dev. Disord. 2006, 36, 1137–1140. [Google Scholar] [CrossRef]
- Giulivi, C.; Zhang, Y.F.; Omanska-Klusek, A.; Ross-Inta, C.; Wong, S.; Wong, S.; Hertz-Picciotto, I.; Tassone, F.; Pessah, I.N. Mitochondrial dysfunction in autism. JAMA 2010, 304, 2389–2396. [Google Scholar] [CrossRef]
- Mizejewski, G.J.; Lindau-Shepard, B.; Pass, K.A. Newborn screening for autism: In search of candidate biomarkers. Biomark. Med. 2013, 7, 247–260. [Google Scholar] [CrossRef]
- Panisi, C.; Guerini, F.R.; Abruzzo, P.M.; Balzola, F.; Biava, P.M.; Bolotta, A.; Brunero, M.; Burgio, E.; Chiara, A.; Clerici, M.; et al. Autism Spectrum Disorder from the Womb to Adulthood: Suggestions for a Paradigm Shift. J. Pers. Med. 2021, 11, 70. [Google Scholar] [CrossRef]
- Lee, M.; Martin-Ruiz, C.; Graham, A.; Court, J.; Jaros, E.; Perry, R.; Iversen, P.; Bauman, M.; Perry, E. Nicotinic receptor abnormalities in the cerebellar cortex in autism. Brain J. Neurol. 2002, 125, 1483–1495. [Google Scholar] [CrossRef]
- Wozniak, R.H.; Leezenbaum, N.B.; Northrup, J.B.; West, K.L.; Iverson, J.M. The development of autism spectrum disorders: Variability and causal complexity. WIREs Cogn. Sci. 2017, 8, e1426. [Google Scholar] [CrossRef] [PubMed]
- Ristori, M.V.; Mortera, S.L.; Marzano, V.; Guerrera, S.; Vernocchi, P.; Ianiro, G.; Gardini, S.; Torre, G.; Valeri, G.; Vicari, S.; et al. Proteomics and Metabolomics Approaches towards a Functional Insight onto AUTISM Spectrum Disorders: Phenotype Stratification and Biomarker Discovery. Int. J. Mol. Sci. 2020, 21, 6274. [Google Scholar] [CrossRef]
- Gabriele, S.; Sacco, R.; Cerullo, S.; Neri, C.; Urbani, A.; Tripi, G.; Malvy, J.; Barthelemy, C.; Bonnet-Brihault, F.; Persico, A.M. Urinary p-cresol is elevated in young French children with autism spectrum disorder: A replication study. Biomarkers 2014, 19, 463–470. [Google Scholar] [CrossRef]
- Saito, Y.; Sato, T.; Nomoto, K.; Tsuji, H. Identification of phenol- and p-cresol-producing intestinal bacteria by using media supplemented with tyrosine and its metabolites. FEMS Microbiol. Ecol. 2018, 94, fiy125. [Google Scholar] [CrossRef]
- Bermudez-Martin, P.; Becker, J.A.J.; Caramello, N.; Fernandez, S.P.; Costa-Campos, R.; Canaguier, J.; Barbosa, S.; Martinez-Gili, L.; Myridakis, A.; Dumas, M.E.; et al. The microbial metabolite p-Cresol induces autistic-like behaviors in mice by remodeling the gut microbiota. Microbiome 2021, 9, 157. [Google Scholar] [CrossRef] [PubMed]
- Guzmán-Salas, S.; Weber, A.; Malci, A.; Lin, X.; Herrera-Molina, R.; Cerpa, W.; Dorador, C.; Signorelli, J.; Zamorano, P. The metabolite p-cresol impairs dendritic development, synaptogenesis, and synapse function in hippocampal neurons: Implications for autism spectrum disorder. J. Neurochem. 2022, 161, 335–349. [Google Scholar] [CrossRef]
- Southan, C.; DeWolf, W.E., Jr.; Kruse, L.I. Inactivation of dopamine beta-hydroxylase by p-cresol: Evidence for a second, minor site of covalent modification at tyrosine 357. Biochim. Biophys. Acta 1990, 1037, 256–258. [Google Scholar] [CrossRef]
- Pizzarelli, R.; Cherubini, E. Alterations of GABAergic signaling in autism spectrum disorders. Neural Plast. 2011, 2011, 297153. [Google Scholar] [CrossRef]
- Shaw, W. Increased urinary excretion of a 3-(3-hydroxyphenyl)-3-hydroxypropionic acid (HPHPA), an abnormal phenylalanine metabolite ofClostridiaspp. in the gastrointestinal tract, in urine samples from patients with autism and schizophrenia. Nutr. Neurosci. 2010, 13, 135–143. [Google Scholar] [CrossRef] [PubMed]
- Shaw, W. Integrative Psychiatry for Depression: Redefining Models for Assessment, Treatment, and Prevention; Greenblatt, J.M., Brogan, K., Eds.; CRC Press, Taylor & Francis Group: Boca Raton, FL, USA, 2016. [Google Scholar]
- Gątarek, P.; Jóźwik-Pruska, J.; Bjørklund, G.; Chirumbolo, S.; Kałużna-Czaplińska, J. Urinary carboxylic acids (UCAs) in subjects with autism spectrum disorder and their association with bacterial overgrowth. Rev. Anal. Chem. 2020, 39, 78–87. [Google Scholar] [CrossRef]
- Lis, A.W.; Mclaughlin, D.I.; Mclaughlin, R.K.; Lis, E.W.; Stubbs, E.G. Profiles of ultraviolet-absorbing components of urine from autistic children, as obtained by high-resolution ion-exchange chromatography. Clin. Chem. 1976, 22, 1528–1532. [Google Scholar] [CrossRef]
- Baker, N.; Baker, A. Developmental regression in autism spectrum disorder. Sudan. J. Paediatr. 2015, 15, 21–26. [Google Scholar]
- El-Ansary, A.K.; Ben Bacha, A.G.; Al-Ayahdi, L.Y. Plasma fatty acids as diagnostic markers in autistic patients from Saudi Arabia. Lipids Health Dis. 2011, 10, 62. [Google Scholar] [CrossRef] [PubMed]
- Pastural, É.; Ritchie, S.; Lu, Y.; Jin, W.; Kavianpour, A.; Su-Myat, K.K.; Heath, D.; Wood, P.L.; Fisk, M.; Goodenowe, D.B. Novel plasma phospholipid biomarkers of autism: Mitochondrial dysfunction as a putative causative mechanism. Prostaglandins Leukot. Essent. Fatty Acids 2009, 81, 253–264. [Google Scholar] [CrossRef] [PubMed]
- Smith, A.M.; Natowicz, M.R.; Braas, D.; Ludwig, M.A.; Ney, D.M.; Donley, E.L.R.; Burrier, R.E.; Amaral, D.G. A metabolomics approach to screening for autism risk in the children’s autism metabolome project. Autism Res. 2020, 13, 1270–1285. [Google Scholar] [CrossRef]
- Al-Beltagi, M. Autism medical comorbidities. World J. Clin. Pediatr. 2021, 10, 15–28. [Google Scholar] [CrossRef]
- Ferguson, B.J.; Dovgan, K.; Takahashi, N.; Beversdorf, D.Q. The relationship among gastrointestinal symptoms, problem behaviors, and internalizing symptoms in children and adolescents with autism spectrum disorder. Front. Psychiatry 2019, 10, 194. [Google Scholar] [CrossRef] [PubMed]
- Chakraborty, P.; Carpenter, K.L.H.; Major, S.; Deaver, M.; Vermeer, S.; Herold, B.; Franz, L.; Howard, J.; Dawson, G. Gastrointestinal problems are associated with increased repetitive behaviors but not social communication difficulties in young children with autism spectrum disorders. Autism 2021, 25, 405–415. [Google Scholar] [CrossRef]
- Collins, S.M.; Surette, M.; Bercik, P. The interplay between the intestinal microbiota and the brain. Nat. Rev. Microbiol. 2012, 10, 735–742. [Google Scholar] [CrossRef]
- Toor, D.; Wasson, M.K.; Kumar, P.; Karthikeyan, G.; Kaushik, N.K.; Goel, C.; Singh, S.; Kumar, A.; Prakash, H. Dysbiosis Disrupts Gut Immune Homeostasis and Promotes Gastric Diseases. Int. J. Mol. Sci. 2019, 20, 2432. [Google Scholar] [CrossRef]
- Williams, B.L.; Hornig, M.; Parekh, T.; Lipkin, W.I. Application of novel PCR-based methods for detection, quantitation, and phylogenetic characterization of Sutterella species in intestinal biopsy samples from children with autism and gastrointestinal disturbances. mBio 2012, 3, e00261-11. [Google Scholar] [CrossRef]
- Fanos, V.; Noto, A.; Mussap, M. The juniper bush of autism spectrum disorder (ASD): Metabolomics, microbiomics, acetaminophen. What else? J. Pediatr. Neonat. Individual Med. 2018, 7, e070205. [Google Scholar] [CrossRef]
- Sparks, B.; Cooper, J.; Hayes, C.; Williams, K. Constipation in children with Autism Spectrum Disorder Associated with increased emergency department visits and inpatient admissions. J. Pediatr. 2018, 202, 194–198. [Google Scholar] [CrossRef] [PubMed]
- Mazzone, L.; Postorino, V.; Siracusano, M.; Riccioni, A.; Curatolo, P. The Relationship between Sleep Problems, Neurobiological Alterations, Core Symptoms of Autism Spectrum Disorder, and Psychiatric Comorbidities. J. Clin. Med. 2018, 7, 102. [Google Scholar] [CrossRef] [PubMed]
- Benabou, M.; Rolland, T.; Leblond, C.S.; Millot, G.A.; Huguet, G.; Delorme, R.; Leboyer, M.; Pagan, C.; Callebert, J.; Maronde, E.; et al. Heritability of the melatonin synthesis variability in autism spectrum disorders. Sci. Rep. 2017, 7, 17746. [Google Scholar] [CrossRef] [PubMed]

| Early Identification of ASD | ||||||
|---|---|---|---|---|---|---|
| Study | Sample | Aim of the Study | Clinical Tools | Biofluid | Main Metabolomic Findings in ASD | Main Authors’ Conclusions |
| Yap et al., 2010 [26] | 39 ASD 28 SIBS 34 TD | To characterize metabolomic profiles of individuals with ASD, unaffected SIBS and TD groups. | - | Urine | ↑ Increased: acetate, dimethylamine, succinate, taurine, N-methylnicotinamide, N-methylnicotinic acid, N-acetyl glycoprotein fragments, N-methyl-2-pyridone-5-carboxamide ↓ Decreased: hippurate, glutamate, phenylacetylglutamine | Children with ASD show alterations in gut microbiota metabolism, amino acid metabolism and nicotinic acid metabolism. |
| Ming et al., 2012 [27] | 48 ASD 53 TD | To identify a pattern of metabolic perturbance in ASD. | - | Urine | ↑ Increased: urocanate, glutaroylcarnitine, 3methylglutaroylcarnitine, 2-(4-hydroxyphenil) propionate, taurocholenate sulphate ↓ Decreased: glycine, serine, threonine, β-alanine, histidine, taurine, N-acetylglycine, 3-(3-Hydroxyphenil) propionate, carnosine, urate, 5-aminovalerate | - Increased levels of gut-derived metabolites. - Increased oxidative stress within ASD. |
| Kuwabara et al., 2013 [28] | 25 ASD 28 TD | To identify metabolites as potential biomarkers for ASD. | ADI-R GAF Wechsler scales |
Blood/ Plasma | ↑ arginine, taurine ↓ 5-Oxoproline, lactic acid | Association between deviated plasma metabolite levels, oxidative stress and mitochondrial dysfunction in individuals with ASD. |
| Emond et al., 2013 [29] | 26 ASD 24 TD | To identify potential biomarkers of ASD. | - | Urine | ↑ Increased: citrate, succinate, glycolate ↓ Decreased: vanillylhydracrylate, 3-methyladipate, palmitate, stearate, p-hydroxymandelate, 3-hydroxyphenylacetate, phosphate, hippurate, 3-hydroxyhippurate, 1H-indole-3-acetate, 3- methyladipate, 4-Hydroxyphenyl-2-hydroxyacetate | The metabolic fingerprint of autistic children is marked by changes in 15 metabolites, 3 increased and 12 decreased. 1H-indole-3-acetate could be implicated in microbial pathways associated with gut bacterial flora. |
| Noto et al., 2014 [30] | 21 ASD 21 SIBS | To classify metabolome alterations between children with ASD and unaffected SIBS. | ADOS-2 | Urine | ↑ Increased: 3-(3-hydroxyphenyl)-3-hydroxypropanoic acid, ribose, 3,4-dihydroxybutyric acid, arabinofuranose, glycolic acid, glycine, cisacotinic acid, phenylalanine, tyrosine, p-hydroxyphenylacetic acid, homovanillic acid, tryptophan, polyols arabitol, xylitol, threitol, pyroglutamic acid ↓ Decreased: fructose, 1,2,3-butanetriol, propylene glycol | Elevated urinary concentrations of several sugars and organic acids among children with ASD, probably due to the interactions among diet, genes and microbiome. |
| Kałużna-Czaplinska et al., 2014 [31] | 14 ASD 10 TD | To identify alterations in small molecular weight compounds and to find potential biomarkers of ASD. | - | Urine | ↑ Increased: citrate, L-threonic acid, 2,3-dihydroxybutanedioic acid, α α- hydroxybutyric acid, β-hydroxybutyric acid, m- hydroxybenzoic acid, succinate, oxalic acid, p-hydroxyphenylacetic acid, D-mannitol, ribonic acid, D-arabinitol, L-tyrosine, α-hydroxyglutaric acid, homocisteine ↓ Decreased: PPA, phosphoric acid, butanoic acid, L-serine, sebacic acid (acid decanedioic), tryptophan | Discriminant metabolites are known to be involved in multiple biochemical processes, especially in energy and lipid metabolism and oxidative stress. Some of them, such as tartaric acid, are markers of dysbiosis. |
| West et al., 2014 [32] | 52 ASD 30 TD | To discover discriminant metabolic features of ASD. | ADOS-G ADI-R SCQ | Blood/ Plasma | ↑ homocitrulline, glutamate | Differences in some key metabolites’ abundances (such as homocitrulline) might provide a signature that could distinguish individuals at higher risk for developing ASD. |
| Wang et al., 2016 [33] | 73 ASD 63 TD | To identify potential biomarkers for the early diagnosis of ASD. | ABC CARS DQ | Blood | ↑ decanoylcarnitine, pregnanetriol ↓ uric acid, docosahexaenoic acid, adrenic acid, sphingosine 1-phosphat | Two metabolites (docosahexaenoic acid and sphingosine 1-phosphat) have potential as biomarkers for the clinical diagnosis and evaluation of ASD. |
| Xiong et al., 2016 [34] | 62 ASD 62 TD | To identify potential biomarkers for ASD. | Urine | ↑ HPHPA, 3-hydroxyphenylacetic acid, 3-Hydroxyhippuric acid | The measurement of these compounds represents a promising potential clinical tool for ASD diagnosis. | |
| Lussu et al., 2017 [35] | 21 ASD 21 SIBS | To identify metabolome variations to discriminate between people with ASD and SIBS. | ADOS-G | Urine | ↑ glycine, tryptophan, hippurate, creatine, D-threitol ↓ glutamate, taurine, lactate, valine, betaine, cretinine | The urine of children with ASD reflected alterations in neurotransmitters, tryptophan–serotonin pathways, mammalian–microbial cometabolism and oxidative stress metabolism. |
| Bitar et al., 2018 [36] | 40 ASD 40 TD | To identify metabolomic disturbances associated with ASD. | CARS | Urine | ↑ Increased: phosphoserine, glutamic acid, nicotinamide ribotide trigonelline, 5-aminoImidazole-4-carboxamide, riboflavin, glycerol−3-phosphate, cholic acid ↓ Decreased: threonine, creatine, serine, N-acetylphenylalanine, tyrosine, hydroxybenzoic acid, hydroxyproline, urocanic acid, cysteic acid, 2-hydroxybutyric acid, citric acid, guanine, N-amidino aspartic acid, acetylcarnitine, methyl acetoacetic acid | Perturbations in tyrosine, 2-hydroxybutyrate, creatine and glutamate, amino acids, carbohydrates and oxidative stress pathways. Perturbations in trigonelline, cysteic acid and guanine. |
| Barone et al., 2018 [37] | 83 ASD 79 TD | ADOS-2 ADI-R Standardized battery for IQ/DQ | Blood Urine | ↑ citrulline, acetylcarnitine, methylmalonyl/3-OH-isovalerylcarnitine, decanoylcarnitine, tetradecadienoylcarnitine, hexadecanoylcarnitine, octadecenoylcarnitin | Of the 45 analyzed metabolites, 20% were significantly increased in ASD, including the amino acid citrulline and acylcarnitines, indicative of impaired mitochondrial fatty acid β-oxidation. | |
| Orozco et al., 2019 [38] | 167 ASD 51 DD 31 DS 193 TD | - To investigate the association between metabolic alterations and developmental disabilities. - To understand the specific biological perturbations associated with developmental disorders. | - | Blood | ↑ betaine, choline, lactate, cis-aconitate, ornithine, alanine, arginine, asparagine, glycine, histidine, serine ↓ 2-aminobutyrate, 2-hydroxybutyrate, 3-hydroxybutyrate | Despite the varied origins of developmental disabilities, it was observed that there were similar perturbations in one-carbon metabolism (associated with the folic acid–folate cycle) pathways among Down syndrome and ASD cases. Other metabolites and pathways were uniquely associated with DS or ASD. |
| Leboucher et al., 2019 [39] | 25 FXS 29 TD | To investigate the systemic consequences of FMRP absence. | - | Blood | ↑ free fatty acids ↓ glucose, insulin | FMRP loss increased hepatic protein synthesis and impacted pathways notably linked to lipid metabolism. |
| Liu et al., 2019 [40] | 57 ASD 81 TD | To assess the differences in amino acid metabolism between ASD and TD. | - | Urine | ↑ arginine, ornithine, 5-hydroxytryptamine, methionine sulfoxide ↓ aspartate, homocysteine, lysine, 5-aminovaleric acid | A possible imbalance between excitatory–inhibitory amino acid metabolism was found in children with ASD. |
| Liang et al., 2020 [23] | 22 ASD 22 SIBS | To discriminate the metabolic modifications between ASD and TD. | CARS ABC | Urine | ↑ tryptophan, hippurate, glycine, creatine ↓ trigonelline, melatonin, pantothenate, serotonin, taurine | Several metabolic pathways differentiate ASD from TD, highlighting the role of the gut–brain axis in ASD’s pathophysiology. |
| Gevi et al., 2020 [41] | 40 ASD 40 TD | To analyze the altered metabolic pathway involved in neurotransmitter production in ASD. | - | Urine | ↑ homovanillic acid, 4-cresol, vitamin C (ascorbate), dopamine, glutamate ↓ MHPG, vanillylmandelic acid, pyridoxal phosphate, noradrenalin, adrenalin, homovanillic acid, GABA | The identification of several urinary metabolites involved in the dopamine pathway explains the involvement of the gut microbiota in regulating neurodevelopmental disorders (“microbiota-gut-brain axis”). |
| Ma et al., 2021 [42] | 117 ASD 119 TD | To identify metabolic variations between ASD and TD. | ADOS-2 ADI-R | Urine | ↑ glycine, guanidinoacetic acid, creatine, hydroxyphenylacetylglycine, phenylacetylglycine, formate ↓ 3-aminoisobutanoic acid, alanine, taurine, creatinine, hypoxanthine, N-methylnicotinamide | Urinary amino acid metabolites were significantly altered in children with ASD; the pathways in which they are involved play a key role in autism pathophysiology. |
| Chung et al., 2021 [43] | 75 ASD 29 TD | To identify a metabolomic profile of ASD. | - | Blood | ↓ O-phosphotyrosine | - A total of 191 features were associated with ASD. - Glutathione metabolism was affected in ASD. - exogenous chemicals (pharmaceuticals, natural dietary molecules, food additives) are significantly associated with ASD. - O-phosphotyrosine endogenous metabolite was associated with a decreased risk of ASD. |
| Corraud et al., 2021 [44] | 37 ASD 37 TD | Application of newborns’ DBS for the study of metabolomic abnormalities related to ASD. | - | Blood | ↑ methacholine in newborns later diagnosed with ASD | Methacholine structural analog was found at a higher—although not significant—abundance in newborns that were diagnosed with ASD by age 7, suggesting it is a relevant early marker for ASD. |
| Timperio et al., 2022 [45] | 30 ASD 30 SIBS | To detect metabolic fingerprint related to ASD. | VABS | Urine | ↑ thiamine-phosphate, deoxyribose-phosphate, hypoxantine, guanine, cystine, acetylysine, hypoxanthine, xanthosine, phenylalanine, p-cresol ↓ tyrosine | Phenylalanine–tyrosine–tryptophan metabolism, phenylalanine metabolism, purine metabolism and glutathione metabolism represent the most perturbed metabolic pathways in ASD. |
| Khan et al., 2022 [46] | 65 ASD 20 TD | To identify potential biomarkers for ASD diagnosis. | - | Urine | ↑ Increased: indole acetic acid, adipic acid, suberic acid, homovanillic acid, 3-hydroxy butyric acid, aconitic acid, succinic acid, citric acid, palmitic acid, lactic acid, 2-ketoglutaric acid, hippuric acid, 5-hydroxymethyl-2-furoic acid, pimelic acid ↓ Decreased: 3-hydroxy isovaleric acid | 3-hydroxy isovaleric acid, homovanillic acid, adipic acid, suberic acid and indole acetic acid represent the most discriminant metabolites between the ASD and TD groups. |
| Association between Metabolome and ASD Clinical Phenotype | ||||||
|---|---|---|---|---|---|---|
| Study | Sample | Aim of the Study | Clinical Tools | Biofluid | Main Findings of Metabolities in ASD | Main Authors’ Conclusions |
| Altieri et al., 2011 [47] | 59 ASD 59 TD | To measure p-cresol to assess possible pathophysiological roles of the gut in ASD. | ADOS-2 ADI-R CARS VABS IQ | Urine | ↑ p-cresol | Higher levels of p-cresol in: - ASD children compared to TD - ASD children < 8y/o - females compared to males - individuals with history of behavioral regression |
| Rangel-Huerta et a. 2019 [22] | 30 ASD 30 TD | To evaluate the metabolomic profiles of children with ASD with (AR) and without regression (ANR). | PDDBI Battelle developmental test ADI-R | Blood | Differences between TD and ASD: In ASD: ↑ increase of: 4-methyl-2-oxopetane, arginine, tryptophan, homoarginine, n-alpha-acetylornithine, N-acetylarginine, 1-methyl-nicotinamide and N-methyl-2-pyridone-5-carboxamide ↓ decrease of: glutamate, aspartate, nicotinamide, 1-palmitoyl-glycerol-phosphatidyl-etholamine (GPE), 1-stearoyl-GPE Differences between AR and ANR: ASD-ANR: ↑ 3-methylxanthine, 7-methylurate and 3-methylhistidine kynurenine, 5-bromotryptophan, 3-indoxyl sulfate, indolelactate, 6-hydroxyindole sulfate, ASD-AR: ↑ several species of mono-and diacylglycerols ↓ ilaurate, myristate and palmitate (free fatty acid) | - Several differences between TD and ASD children were detected, involving mainly amino acid, lipid and nicotinamide metabolism. - subtle differences between the ANR and AR group; - AR phenotype present alterations of amino acid, NAD+ and lipid metabolism, (arginine and glutamate pathway) |
| Mussap et al., 2020 [21] | 31 ASD 26 TD | To explore metabolic perturbations in ASD: -to investigate the possible association between the severity of core symptoms and specific metabolic signatures; - to examine whether the urine metabolome discriminates severe from mild-to-moderate restrictive and repetitive behaviors | ADOS-2 RBS-R ABC-C | Urine | ↑ Increase of: hypoxanthine, allantoin, lactic acid, succininc acid, quinic acid (more pronounced ASD-FS), hippuric acid (less pronounced in ASD-FS), tryptophan, indole-3-acetic acid, quinolinic acid, 5-hydroxyindoleacetic, 2-hydroxylacrylic, p-cresol, trihydroxypentanoic acid, HPHPA ↓ Decrease of: 7-methylxanthine (less pronunced in ASD-FS), uric acid, scylloinositol, kynurenic acid | The severity of ASD core symptoms and problematic behaviors may be associated with specific metabolic perturbations, most of them induced by an overgrowth of Clostridia spp., changes in the gut microbiome (e.g., overgrowth of Candida sp.), and by alterations in mitochondrial functions. |
| Laghi et al. 2021 [24] | 80 ASD (6 low ADOS-2; 42 moderate ADOS-2; 32 high ADOS-2) With or without GI symptoms | To identify possible correlations between metabolome, microbiota, calprotectin levels and ASD symptoms severity | ADOS-2 GSI | Fecal | ASD- GI vs. ASD-NGI: ↑ acetate, formate, orotate, propionate, uridine ↓ alanine, ethanol, isoleucine, leucine, methionine, phenylalanine, tyrosine High-ADOS vs. Low-ADOS: ↑ fucose, 1,3-dihydroxyacetone, N-methylhydantoin | - Close relationship between the ASD severity and the fecal metabolomic profile. - No links between ASD severity or GI symptoms and gut species relative abundance; - fecal metabolome discriminates the ASD severity and intestinal microorganisms mediate the link between metabolome and ASD severity, regardless of GI symptomatology. |
| Needham et al., 2021 [48] | 130/231 ASD 101 TD | To determine molecular signature of ASD and its correlation with clinical phenotypes | ADOS ADI-R | Fecal Blood | Correlation between metabolomic profile and ASD symptoms: - Positive correlations: cysteine, methionine, glutathione, energy metabolites Negative correlations: gamma-glutamyl amino acids | - Differences in amino acid, lipid, and xenobiotic metabolism discriminate ASD and TD groups; - Specific metabolic profiles correlates with clinical behavior scores. |
| Zhu et al., 2021 [49] | 120 ASD 60 TD | Investigate gut metabolomic profile and its interaction with clinical phenotype | ABC(a) SRS CARS Gesell Developmental Scale | Fecal | Differences between ASD and TD: ↑ Increase of: xanturenic acid, 5-Hydroxy-N-formylkyurenine, 5-Hydroxytryptophan, serotonin, N-Feruloyl serotonin, homocysteine ↓ Decrease of: 6-Hydroxymelatonin, 5-Hydroxy-indoleacetic acid, DHF, glycine, N-feruloyl glycine, 5-MTHF, carnitine, N-Acetyl-cisteine, S-Aminoethyl-L-cysteine, sulfurous acid, glutamine, GABA, indole-acetyl glutamic acid, N-Phenylacetyl glutamic acid, S(PGA1)-glutathione, glutathionyl spermidine, agmatine, p-coumaroyl agmatine, spermidine, spermine, N1,N12-Diacetyl spermine Correlations between metabolomic profile and ASD symtpoms: - Positive correlations: retinol, Hcy, serotonin, N-feruloyl serotonin, 5-HIAA - Negaative correlations: agmtine, S-aminoethyl-L-cysteine, 6-hydroxymelatonin, pyridoxamine, GABA, 5-trans prostaglandin F2β | The main discriminant gut metabolites involved in ASD are related to vitamin and amino acid pathways; Vitamin and amino acid metabolism pathways – with a stronger enrichment for tryptophan, retinol, cysteine-methionine metabolism- represents the most metabolic alteration in ASD sample and are correlated with symptoms severity. |
| Wang et al., 2022 [50] | 29 ASD 30 TD | To identify plasma metabolic signature of ASD; To explore the relationship between metabolomic aberration and clinical profiles | ABC(a) CARS Gesell Developmental Schedule | Blood | Differences between ASD and TD: ↑ Increase of: l-Valine, palmitoleic acid, epsilon-caprolactam, arachidonic acid, prostaglandin D2. ↓ Decrease of: choline, aminoimidazole ribotide), 1-Acylglycerophosphocholine, deoxyribose, benzoic acid, 3-Butynoate, ornithine Correlation between metabolomic profile and ASD symptoms: Negative correlation: choline and ornithine | - Upregulation of arachidonic acid metabolism differentiate the ASD group from the TD group; - Ornithin may represent a potential discriminant biomarker in ASD; - Ornithin and Choline levels are related with aberrant behaviors. |
| Brister et al., 2022 [51] | 57 ASD 37 TD | To target metabolic signature related to ASD; To evaluate the link between metabolomic aberration and clinical profile (behavior and cognition) among ASD. | VABS ABC SRS CELF PLS-5 CSHQ | Blood | Differences between ASD and TD: ↑ Increase of: cytidine, taurine, glycine, 1-methylhistamine, adenosine triphosphate, 2,3,4,5-tetrahydroxypentanoic acid, dihydroxyacetone, 4-pyridoxic acid, Xylitol, Isobutyric acid, L-Histidine, DL-Acetylcarnitine, pyroglutamic acid ↓ Decrease of: 5-Aminolevulinic acid, dodecanoic acid, 4-hydroxyproline, phenylpyruvic acid, capric acid, D-Leucic acid, L-2 Phenyllactic acid, 4-Hydroxybenzaldehyde Differences between ASD with and without NDR with NDR: ↑ niacinamide, acetamide without NDR: ↓ 2-Pyrocatechuic acid | - 23 metabolites related to Histidine metabolism, GSH metabolism and AAA biosynthesis were found to be significant different between ASD and TD; - alteration in nicotinamide metabolism differentiated the most the ASD group from the controls. |
| Associations between ASD, Metabolomes and Medical Comorbidities | ||||||
|---|---|---|---|---|---|---|
| Study | Sample | Aim of the Study | Clinical Tools | Biofluid | Main Findings of Metabolites in ASD | Main Authors’ Conclusions |
| Gevi et al. 2016 [25] | 30 ASD 30 TD | To detect differences in urinary metabolic patterns. | - | Urine | ↑ Increased: xanthurenic acid, quinolinic acid, indoxyl sulfate, indole derivatives (indolyl-3-acetic acid, and indolyl lactate), inosine, hypoxanthine, xanthosine, uridine, phenylalaine, 6-phospho-d-gluconic acid, thiamine, tryptophan, riboflavin, p-cresol, 4-pyrodic acid, histidine, trehalose/sucrose, xanthosine ↓ Decreased: kynurenic acid, melatonin, n-acetyl-5-methoxy- tryptamine cellobiose, pyroglutamic acid, methionine, p-hydroxybenzoate, pantothenate, adp, ribose, glucose-6-phosphate, indole-3-carboxylic acid | Perturbed metabolic pathways in ASD: - Tryptophan metabolism - Purine metabolism - Vitamin B6 metabolism - Phenylalanine–tyrosine–tryptophan biosynthesis The tryptophan metabolic pathway collectively displays the largest perturbations in ASD. These metabolic abnormalities could underline several comorbidities frequently associated with ASD, such as sleep disorders and gastrointestinal symptoms, and could contribute to autism severity. |
| Gabriele et al., 2016 [52] | 53 ASD | To investigate potential factors contributing to elevated urinary p-cresol levels in ASD. | GMDS | Urine Fecal | ↑ p-cresol (the total p-cresol measured here is actually the sum of free p-cresol and its two conjugated derivatives, namely p-cresylsulfate and p-cresylglucuronate) | The results support a primary role for slow intestinal transit in linking ASD to elevated urinary p-cresol, which seemingly characterizes most autistic children with chronic constipation. |
| Kang et al., 2018 [53] | 21 ASD 23 TD | To detect fecal metabolites’ differences between ASD and TD and to further investigate the link with the gut microbiome. | - | Fecal | ↑ isopropanol, p-cresol ↓ GABA | The results show discriminant fecal metabolomic profiles between ASD and TD and confirm the reduced abundances of microbial species related to Prevotella copri in the ASD clinical group. |
| Hua et al., 2020 [54] | 120 ASD (60 with and 60 without SDs) | - To investigate changes in gut microbiota. – To evaluate changes in metabolites. – To evaluate their correlation with ASD’s core symptoms and sleep problems. | ABC SRS CSHQ | Fecal | In ASD+SDs: ↑ serotonin ↓ 3-hydroxybutyric acid, melatonin | The results suggest that there were changes in fecal metabolites related to key gut microbiota components in children with ASD suffering from sleep problems. The 3-hydroxybutyric acid level may influence the melatonin level, which is associated with sleep disorders. |
| Dan et al., 2020 [55] | 143 ASD 143 TD (30 C-ASD; 30 NC-ASD; 30 TD) | - To understand the relationship between gut microbiota and fecal metabolites in ASD. - To investigate the potential interaction between ASD and GI symptoms. | - | Fecal | ↑ Increased: quinic acid, 3-Dehydroquinate, thr-Phe, desaminotyrosine, vanillactic acid, indole-3-carboxylic acid, hexanoic acid, 3-Indoxyl-D-Glucopyranoside, 2,5-dioxopentanoate, γ-glutamylglycine, phosphatidylcholine, D-4′-phosphopantothenate, pantothenic acid, 3-(uracil-1-yl)-L-alanine, 3-Dehydrocarnitine, methylselenocysteine selenoxide, deoxyinosine, 1-methyladenosine, orotidine-5P 2′-deoxyuridine ↓ Decreased: tyr-leu, DL-P-Hydroxyphenyl lactic acid, indoleacetaldehyde, imidazole-4-acetaldehyde, adenine, deoxyadenosine, 2′-deoxyguanosine | The interaction analysis between gut microbiota, metabolites and neurotransmitters provides clues for better understanding the mechanisms underlying altered social behaviors in ASD. |
| Daneberga et al., 2022 [56] | 44 ASD | To identify urinary metabolites as biomarkers for GI disorders. | - | Urine Microbiome composition | No significant differences in quantified metabolites compared with reference values. Correlations between metabolomic and microbiome profiles: ↑ p-cresol and ↑ Firmicutes phylum ↑ HPHPA and ↓ Bacteroidetes/Firmicutes ratio | Urinary metabolites can be used as biomarkers for GI alterations with caution and not solely. A combination of urinary organic acid and microbiota analyses is necessary to assess a treatment for gastrointestinal issues. |
| Kang et al., 2020 [57] | 18 ASD 20 TD | Determine which metabolites were different in the ASD group before and after MTT. | - | Fecal Plasma | At the baseline in ASD group: ↑ caprylate, heptanoate ↓ nicotinamide, riboside, IMP, iminodiacetate, methylsuccinate, galactonate, valyglycine, sarcosine, lecyglycine | Children with ASD present different levels of plasma metabolites at baseline compared with TD. MTT promoted changes in plasma metabolites, driving a number of metabolites to be more similar to those from TD children. |
| P-Cresol | 2-Hydroxyacrylic Acid | 3-Hydroxy Pentanoic Acid | HPHPA | 3-Hydroxy Butyric Acid | Kynurenic, Quinolinic and Xanthurenic Acids | Serotonin | Melatonin | |
|---|---|---|---|---|---|---|---|---|
| Metabolite | Organic aromatic compound | Carboxylic acid, organic | Short-chain fatty acid (pentanoic acid) | Abnormal phenylalanine metabolite | Straight-chain 3- hydroxy monocarboxylic | Urinary metabolites | Indoleamines | Biogenic amine |
| Pathway | Tyrosine biosynthesis | Not available | Not available | Flavan-3-ol | - Fatty acid biosynthesis - Ketone body metabolism | Tryptophan | Tryptophan | Tryptophan |
| Production | Intestinal microflora, fecal biomarker of Clostridium difficile infection | Intestinal microflora; produced by Clostridia spp. through the reduction of lactic acid to propionic acid via an acrylyl-CoA intermediate | Liver Commonly found in human feces and produced by different Clostridia spp. and gut bacteria | GI tract, caused by Clostridia spp. | Released from muscles for hepatic and renal gluconeogenesis | - Peripheral cells and tissues, GI microbiota (kinurenic acid) - Brain (quinolinic and xanthurenic acids) | GI tract, CNS and blood from the amino acid L-Tryptophan | Brain (pineal gland) |
| Physiological function | Antimutagenic, antiseptic, cancer-preventive | Not available | Neuroprotective agent | Waste product | Involved in melatonin production; energy source for extrahepatic tissues (brain, lung) | Oxydoreduction processes that influence neural development | Biochemical messenger involved in sleep, arousal state and sexual behavior | Regulator of circadian rhythms, mood, learning, memory, immune activity and reproduction |
| Pathological function | Abnormal concentrations cause fatigue, uremia and hypoglycemia | Not available | Abnormal concentrations cause propionic acidemia | Increased levels are neurotoxic and metabotoxic | Interacts with butyrate metabolism that directly influences the release of serotonin via the vagus nerve, leading to a reduction in melatonin secretion and arising sleep problems | Role in the oxidative stress balance (decreases in kynurenine and kynurenic acid; increases in quinolinic acid and xanthurenic acid) | Its deficiency causes sleep disorders; impact on psychiatric symptoms (depression, OCD, phobias, PTSD, anxiety) | Altered concentrations interact with the circadian organization of physiological functions (sleep cycle, immune activity, antioxidative status, glucose regulation) |
Disclaimer/Publisher’s Note: The statements, opinions and data contained in all publications are solely those of the individual author(s) and contributor(s) and not of MDPI and/or the editor(s). MDPI and/or the editor(s) disclaim responsibility for any injury to people or property resulting from any ideas, methods, instructions or products referred to in the content. |
© 2023 by the authors. Licensee MDPI, Basel, Switzerland. This article is an open access article distributed under the terms and conditions of the Creative Commons Attribution (CC BY) license (https://creativecommons.org/licenses/by/4.0/).
Share and Cite
Siracusano, M.; Arturi, L.; Riccioni, A.; Noto, A.; Mussap, M.; Mazzone, L. Metabolomics: Perspectives on Clinical Employment in Autism Spectrum Disorder. Int. J. Mol. Sci. 2023, 24, 13404. https://doi.org/10.3390/ijms241713404
Siracusano M, Arturi L, Riccioni A, Noto A, Mussap M, Mazzone L. Metabolomics: Perspectives on Clinical Employment in Autism Spectrum Disorder. International Journal of Molecular Sciences. 2023; 24(17):13404. https://doi.org/10.3390/ijms241713404
Chicago/Turabian StyleSiracusano, Martina, Lucrezia Arturi, Assia Riccioni, Antonio Noto, Michele Mussap, and Luigi Mazzone. 2023. "Metabolomics: Perspectives on Clinical Employment in Autism Spectrum Disorder" International Journal of Molecular Sciences 24, no. 17: 13404. https://doi.org/10.3390/ijms241713404
APA StyleSiracusano, M., Arturi, L., Riccioni, A., Noto, A., Mussap, M., & Mazzone, L. (2023). Metabolomics: Perspectives on Clinical Employment in Autism Spectrum Disorder. International Journal of Molecular Sciences, 24(17), 13404. https://doi.org/10.3390/ijms241713404