
Ethanol Kinetics in the Human Brain Determined by Magnetic Resonance Spectroscopy

Abstract
:1. Introduction
2. Results
3. Discussion
4. Materials and Methods
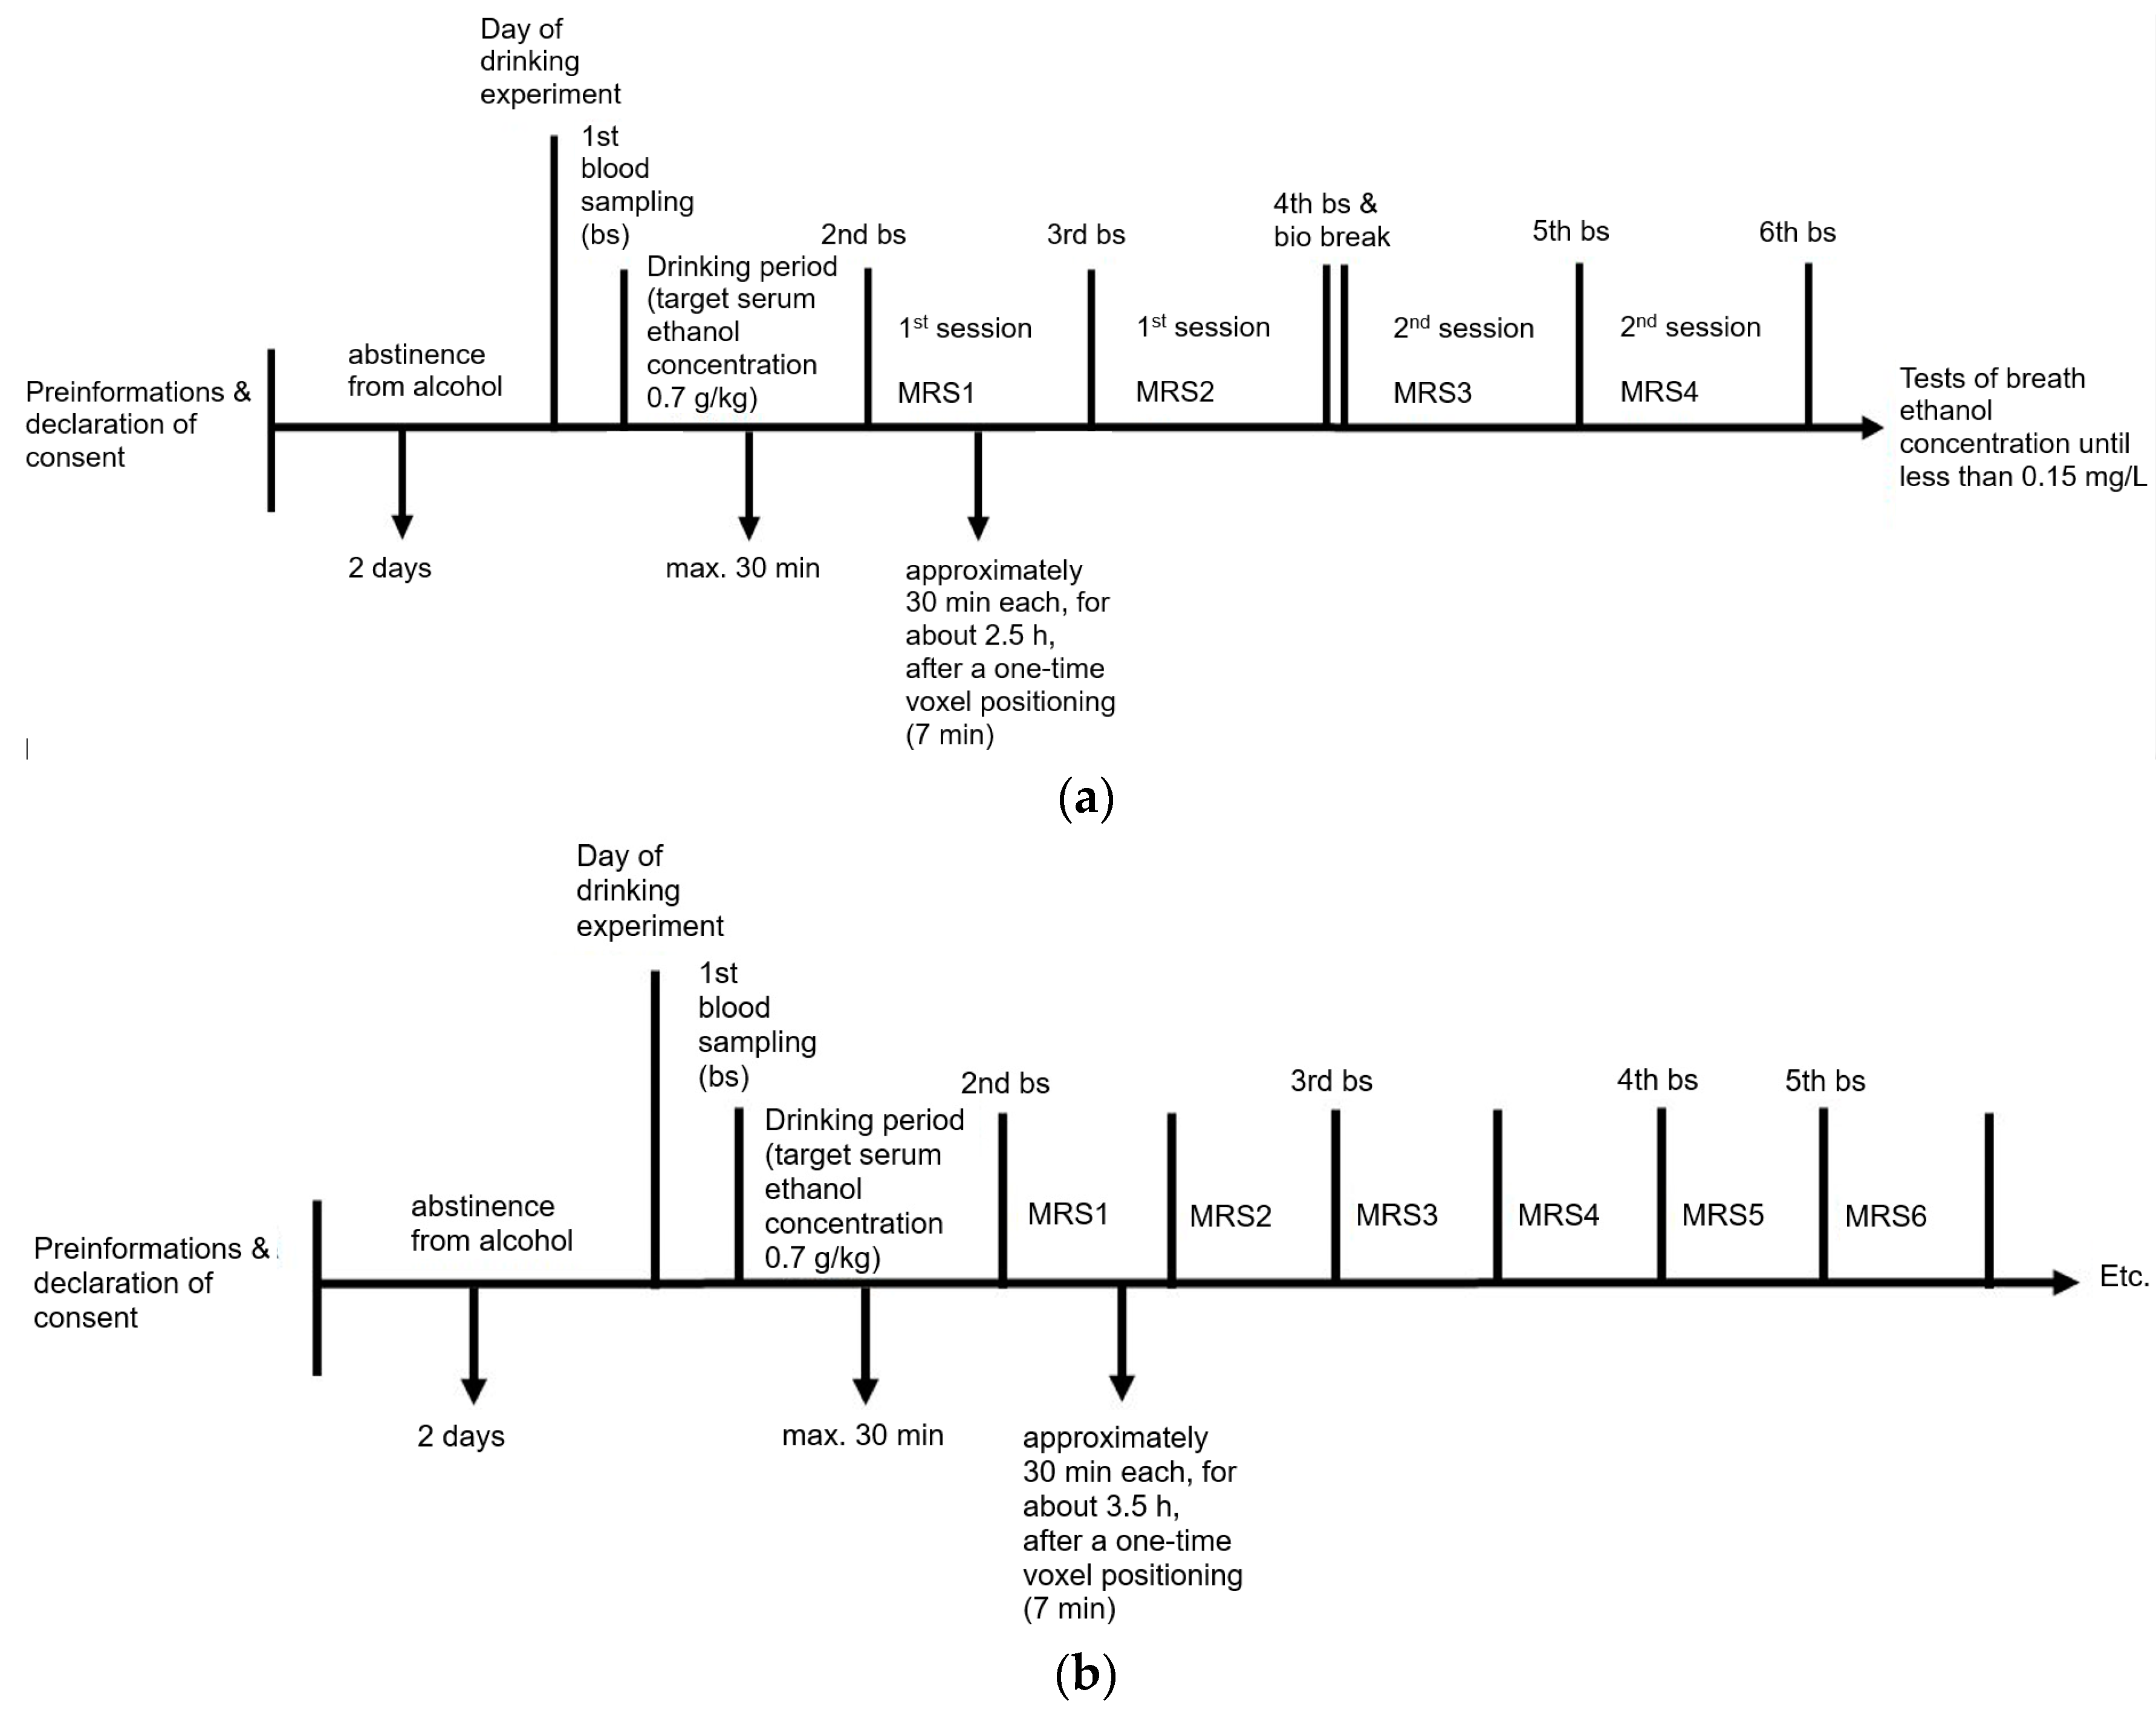
4.1. Experimental Set-Up
4.2. Chemicals and Instrumentation
4.2.1. Determination of the Blood Ethanol Concentration
4.2.2. MRS Measurements
4.2.3. Postprocessing and Quantification
4.2.4. Comparison of Plasma Ethanol and Brain Ethanol Concentrations
4.3. Statistical Evaluation
Author Contributions
Funding
Institutional Review Board Statement
Informed Consent Statement
Data Availability Statement
Conflicts of Interest
References
- Huckenbeck, W.; Bonte, W. Alkohologie. In Handbuch Gerichtliche Medizin; Madea, B., Brinkmann, B., Eds.; Springer: Berlin/Heidelberg, Germany, 2003; Volume 2, pp. 379–636. [Google Scholar]
- Abrahao, K.P.; Salinas, A.G.; Lovinger, D.M. Alcohol and the Brain: Neuronal Molecular Targets, Synapses, and Circuits. Neuron 2017, 96, 1223–1238. [Google Scholar] [CrossRef]
- Roberto, M.; Varodayan, F. Synaptic targets: Chronic Alcohol Actions. Neuropharmacology 2017, 122, 85–99. [Google Scholar] [CrossRef]
- Monnig, M.A.; Woods, A.J.; Walsh, E.; Martone, C.M.; Blumenthal, J.; Monti, P.M.; Cohen, R.A. Cerebral Metabolites on the Descending Limb of Acute Alcohol: A Preliminary 1H MRS Study. Alcohol Alcohol. 2019, 54, 487–496. [Google Scholar] [CrossRef]
- Tunc-Skarka, N.; Weber-Fahr, W.; Ende, G. Recreational alcohol use induces changes in the concentrations of choline-containing compounds and total creatine in the brain: A 1H MRS study of healthy subjects. Magn. Reson. Mater. Phys. Biol. Med. 2015, 28, 503–510. [Google Scholar] [CrossRef]
- Egervari, G.; Siciliano, C.A.; Whiteley, E.L.; Ron, D. Alcohol and the brain: From genes to circuits. Trends Neurosci. 2021, 44, 1004–1015. [Google Scholar] [CrossRef]
- Moore, K.A.; Kunsman, G.W.; Levine, B.S.; Herman, M.M.; Cervenak, J.; Hyde, T.M. A comparison of ethanol concentration in the occipital lobe and cerebellum. Forensic. Sci. Int. 1997, 86, 127–134. [Google Scholar] [CrossRef]
- Bonventre, J.; Valanju, S.; Bastos, M.L. Evaluation of ethanol analysis on brain and liver by head-space gas chromatography. Forensic. Sci. Int. 1982, 19, 75–83. [Google Scholar] [CrossRef]
- Takayasu, T.; Ohshima, T.; Tanaka, N.; Maeda, H.; Kondo, T.; Nishigami, J.; Ohtsuji, M.; Nagano, T. Experimental studies on postmortem diffusion of ethanol-d6 using rats. Forensic Sci. Int. 1995, 76, 179–188. [Google Scholar] [CrossRef]
- Hine, C.H. Blood/brain distribution in 100 postmortem cases. Proc. Am. Acad. Forensic. Sci. 1951, 1, 161–164. [Google Scholar]
- Backer, R.C.; Pisano, R.V.; Sopher, I.M. The comparison of alcohol concentrations in postmortem fluids and tissues. J. Forensic. Sci. 1980, 25, 327–331. [Google Scholar] [CrossRef]
- Hetherington, H.P.; Telang, F.; Pan, J.W.; Sammi, M.; Schuhlein, D.; Molina, P.; Volkow, N.D. Spectroscopic imaging of the uptake kinetics of human brain ethanol. Magn. Reson. Med. 1999, 42, 1019–1026. [Google Scholar] [CrossRef]
- Mendelson, J.H.; Woods, B.T.; Chiu, T.M.; Mello, N.K.; Lukas, S.E.; Teoh, S.K.; Sintavanarong, P.; Cochin, J.; Hopkins, M.A.; Dobrosielski, M. In vivo proton magnetic resonance spectroscopy of alcohol in human brain. Alcohol 1990, 7, 443–447. [Google Scholar] [CrossRef] [PubMed]
- Kubo, H.; Harada, M.; Sakama, M.; Matsuda, T.; Otsuka, H. Preliminary Observation of Dynamic Changes in Alcohol Concentration in the Human Brain with Proton Magnetic Resonance Spectroscopy on a 3T MR Instrument. Magn. Reson. Med. Sci. 2013, 12, 235–240. [Google Scholar] [CrossRef] [PubMed]
- Biller, A.; Bartsch, A.J.; Homola, G.; Solymosi, L.; Bendszus, M. The effect of ethanol on human brain metabolites longitudinally characterized by proton MR spectroscopy. J. Cereb. Blood Flow Metab. 2009, 29, 891–902. [Google Scholar] [CrossRef] [PubMed]
- Sammi, M.K.; Pan, J.W.; Telang, F.W.; Schuhlein, D.; Molina, P.E.; Volkow, N.D.; Springer, C.S.; Hetherington, H.P. Measurements of human brain ethanol T2 by spectroscopic imaging at 4 T. Magn. Reson. Med. 2000, 44, 35–40. [Google Scholar] [CrossRef] [PubMed]
- Kaufman, M.J.; Chiu, T.M.; Mendelson, J.H.; Woods, B.T.; Teoh, S.K.; Erös-Sarnyai, M.; Mercer, G.; Mello, N.K. Brain Alcohol Detectability Increase with Repeated Administration in Humans: A Proton Spectroscopy Study. Magn. Reson. Med. 1996, 35, 435–440. [Google Scholar] [CrossRef]
- Nagel, B.J.; Kroenke, C.D. The use of magnetic resonance spectroscopy and magnetic resonance imaging in alcohol research. Alcohol Res. Health 2008, 31, 243–246. [Google Scholar]
- Flory, G.S.; O’Malley, J.; Grant, K.A.; Park, B.; Kroenke, C.D. Quantification of ethanol methyl 1H magnetic resonance signal intensity following intravenous ethanol administration in primate brain. Methods 2010, 50, 189–198. [Google Scholar] [CrossRef]
- Chiu, T.M.; Mendelson, J.H.; Woods, B.T.; Teoh, S.K.; Levisohn, L.; Mello, N.K. In vivo proton magnetic resonance spectroscopy detection of human alcohol tolerance. Magn. Reson. Med. 1994, 32, 511–516. [Google Scholar] [CrossRef]
- Thierauf-Emberger, A.; Echle, J.; Dacko, M.; Lange, T. Comparison of ethanol concentrations in the human brain determined by magnetic resonance spectroscopy and serum ethanol concentrations. Int. J. Leg. Med. 2021, 134, 1713–1718. [Google Scholar] [CrossRef]
- Cavassila, S.; Deval, S.; Huegen, C.; van Ormondt, D.; Graveron-Demilly, D. Cramér-Rao bounds: An evaluation tool for quantitation. NMR Biomed. 2001, 14, 278–283. [Google Scholar] [CrossRef]
- Haffner, H.T.; Dettling, A. Pharmakokinetik und Konzentrationsberechnungen. In Begutachtung im Verkehrsrecht; Haffner, H.A.T., Skopp, G., Graw, M., Eds.; Springer: Berlin/Heidelberg, Germany, 2012; pp. 21–44. [Google Scholar]
- Rose, S.E.; Crozier, S.; Brereton, I.M.; Moxon, L.N.; Galloway, G.J.; Bore, P.; Doddrell, D.M. Measurement of the T2 relaxation time of ethanol and cerebral metabolites, in vivo. Magn. Reson. Med. 1992, 23, 333–345. [Google Scholar] [CrossRef]
- Fein, G.; Meyerhoff, D.J. Ethanol in human brain by magnetic resonance spectroscopy: Correlation with blood and breath levels, relaxation, and magnetization transfer. Alcohol. Clin. Exp. Res. 2000, 24, 1227–1235. [Google Scholar] [CrossRef] [PubMed]
- Moxon, L.N.; Rose, S.E.; Haseler, L.J.; Galloway, G.J.; Brereton, I.M.; Bore, P.; Doddrell, D.M. The visibility of the 1H NMR signal of ethanol in the dog brain. Magn. Reson. Med. 1991, 19, 341–348. [Google Scholar] [CrossRef] [PubMed]
- Kaufman, M.J.; Chiu, T.M.; Mendelson, J.H.; Woods, B.T.; Mello, N.K.; Lukas, S.E.; Fivel, P.A.; Wighton, L.G. In vivo proton magnetic resonance spectroscopy of alcohol in rhesus monkey brain. Magn. Reson. Imaging 1994, 12, 1245–1253. [Google Scholar] [CrossRef] [PubMed]
- Meyerhoff, D.J.; Rooney, W.D.; Tokumitsu, T.; Weiner, M.W. Evidence of multiple ethanol pools in the brain: An in vivo proton magnetization transfer study. Alcohol. Clin. Exp. Res. 1996, 20, 1283–1288. [Google Scholar] [CrossRef]
- Petroff, O.A.C.; Novotny, E.J.; Ogino, T.; Avison, M.; Prichard, J.W. In vivo measurements of ethanol concentration in rabbit brain by 1H magnetic resonance spectroscopy. J. Neurochem. 1990, 54, 1188–1195. [Google Scholar] [CrossRef]
- Scheenen, T.W.J.; Klomp, D.W.J.; Wijnen, J.; Heerschap, A. Short echo time 1H-MRSI of the human brain at 3T with minimal chemical shift displacement errors using adiabatic refocusing pulses. Magn. Reson. Med. 2008, 59, 1–6. [Google Scholar] [CrossRef]
- Ogg, R.J.; Kingsley, P.B.; Taylor, J.S. WET, a T1- and B1-insensitive water-suppression method for in vivo localized 1H NMR spectroscopy. J. Magn. Reson. B 1994, 104, 1–10. [Google Scholar] [CrossRef]
- Barker, P.B.; Soher, B.J.; Blackband, S.J.; Chatham, J.C.; Mathews, V.P.; Bryan, R.N. Quantitation of proton NMR spectra of the human brain using tissue water as an internal concentration reference. NMR Biomed. 1993, 6, 89–94. [Google Scholar] [CrossRef]
- Provencher, S.W. Estimation of metabolite concentrations from localized in vivo proton NMR spectra. Magn. Reson. Med. 1993, 30, 672–679. [Google Scholar] [CrossRef] [PubMed]
- Soher, B.J.; Semanchuk, P.; Todd, D.; Ji, X.; Deelchand, D.; Joers, J.; Oz, G.; Young, K. Vespa: Integrated applications for RF pulse design, spectral simulation and MRS data analysis. Magn. Reson. Med. 2023, 90, 823–838. [Google Scholar] [CrossRef] [PubMed]
- Spurny, B.; Heckova, E.; Seiger, R.; Moser, P.; Klöbl, M.; Vanicek, T.; Spies, M.; Bogner, W.; Lanzenberger, R. Automated ROI-Based Labeling for Multi-Voxel Magnetic Resonance Spectroscopy Data Using Free Surfer. Front. Mol. Neurosci. 2019, 12, 28. [Google Scholar] [CrossRef] [PubMed]


| V-Nr. | Amount of Wodka (40 vol-%) [mL] | Drinking Time [min] | Plasma Ethanol Concentration at the End of Drinking [g/L] | Interval between End of Drinking and First MRS Measurement [min] | Interval between Beginning of Drinking and First MRS Measurement [min] | Highest Measured Plasma Ethanol Concentration [g/L] | Highest Measured Brain Ethanol Concentration [mM] | Ascending Part of the Curve Observable |
|---|---|---|---|---|---|---|---|---|
| 1 | 155 | 14 | 0.16 | 20 | 34 | 0.66 | 11.2 | Shortly |
| 2 | 200 | 16 | 0.63 | 21 | 37 | 0.92 | 13.6 | No |
| 3 | 95 | 13 | 0.28 | 26 | 39 | 0.43 | 7.1 | No |
| 4 | 153 | 12 | 0.29 | 33 | 45 | 0.83 | 14.1 | No |
| 5 | 116 | 37 | 0.72 | 25 | 62 | 0.72 | 10.4 | No |
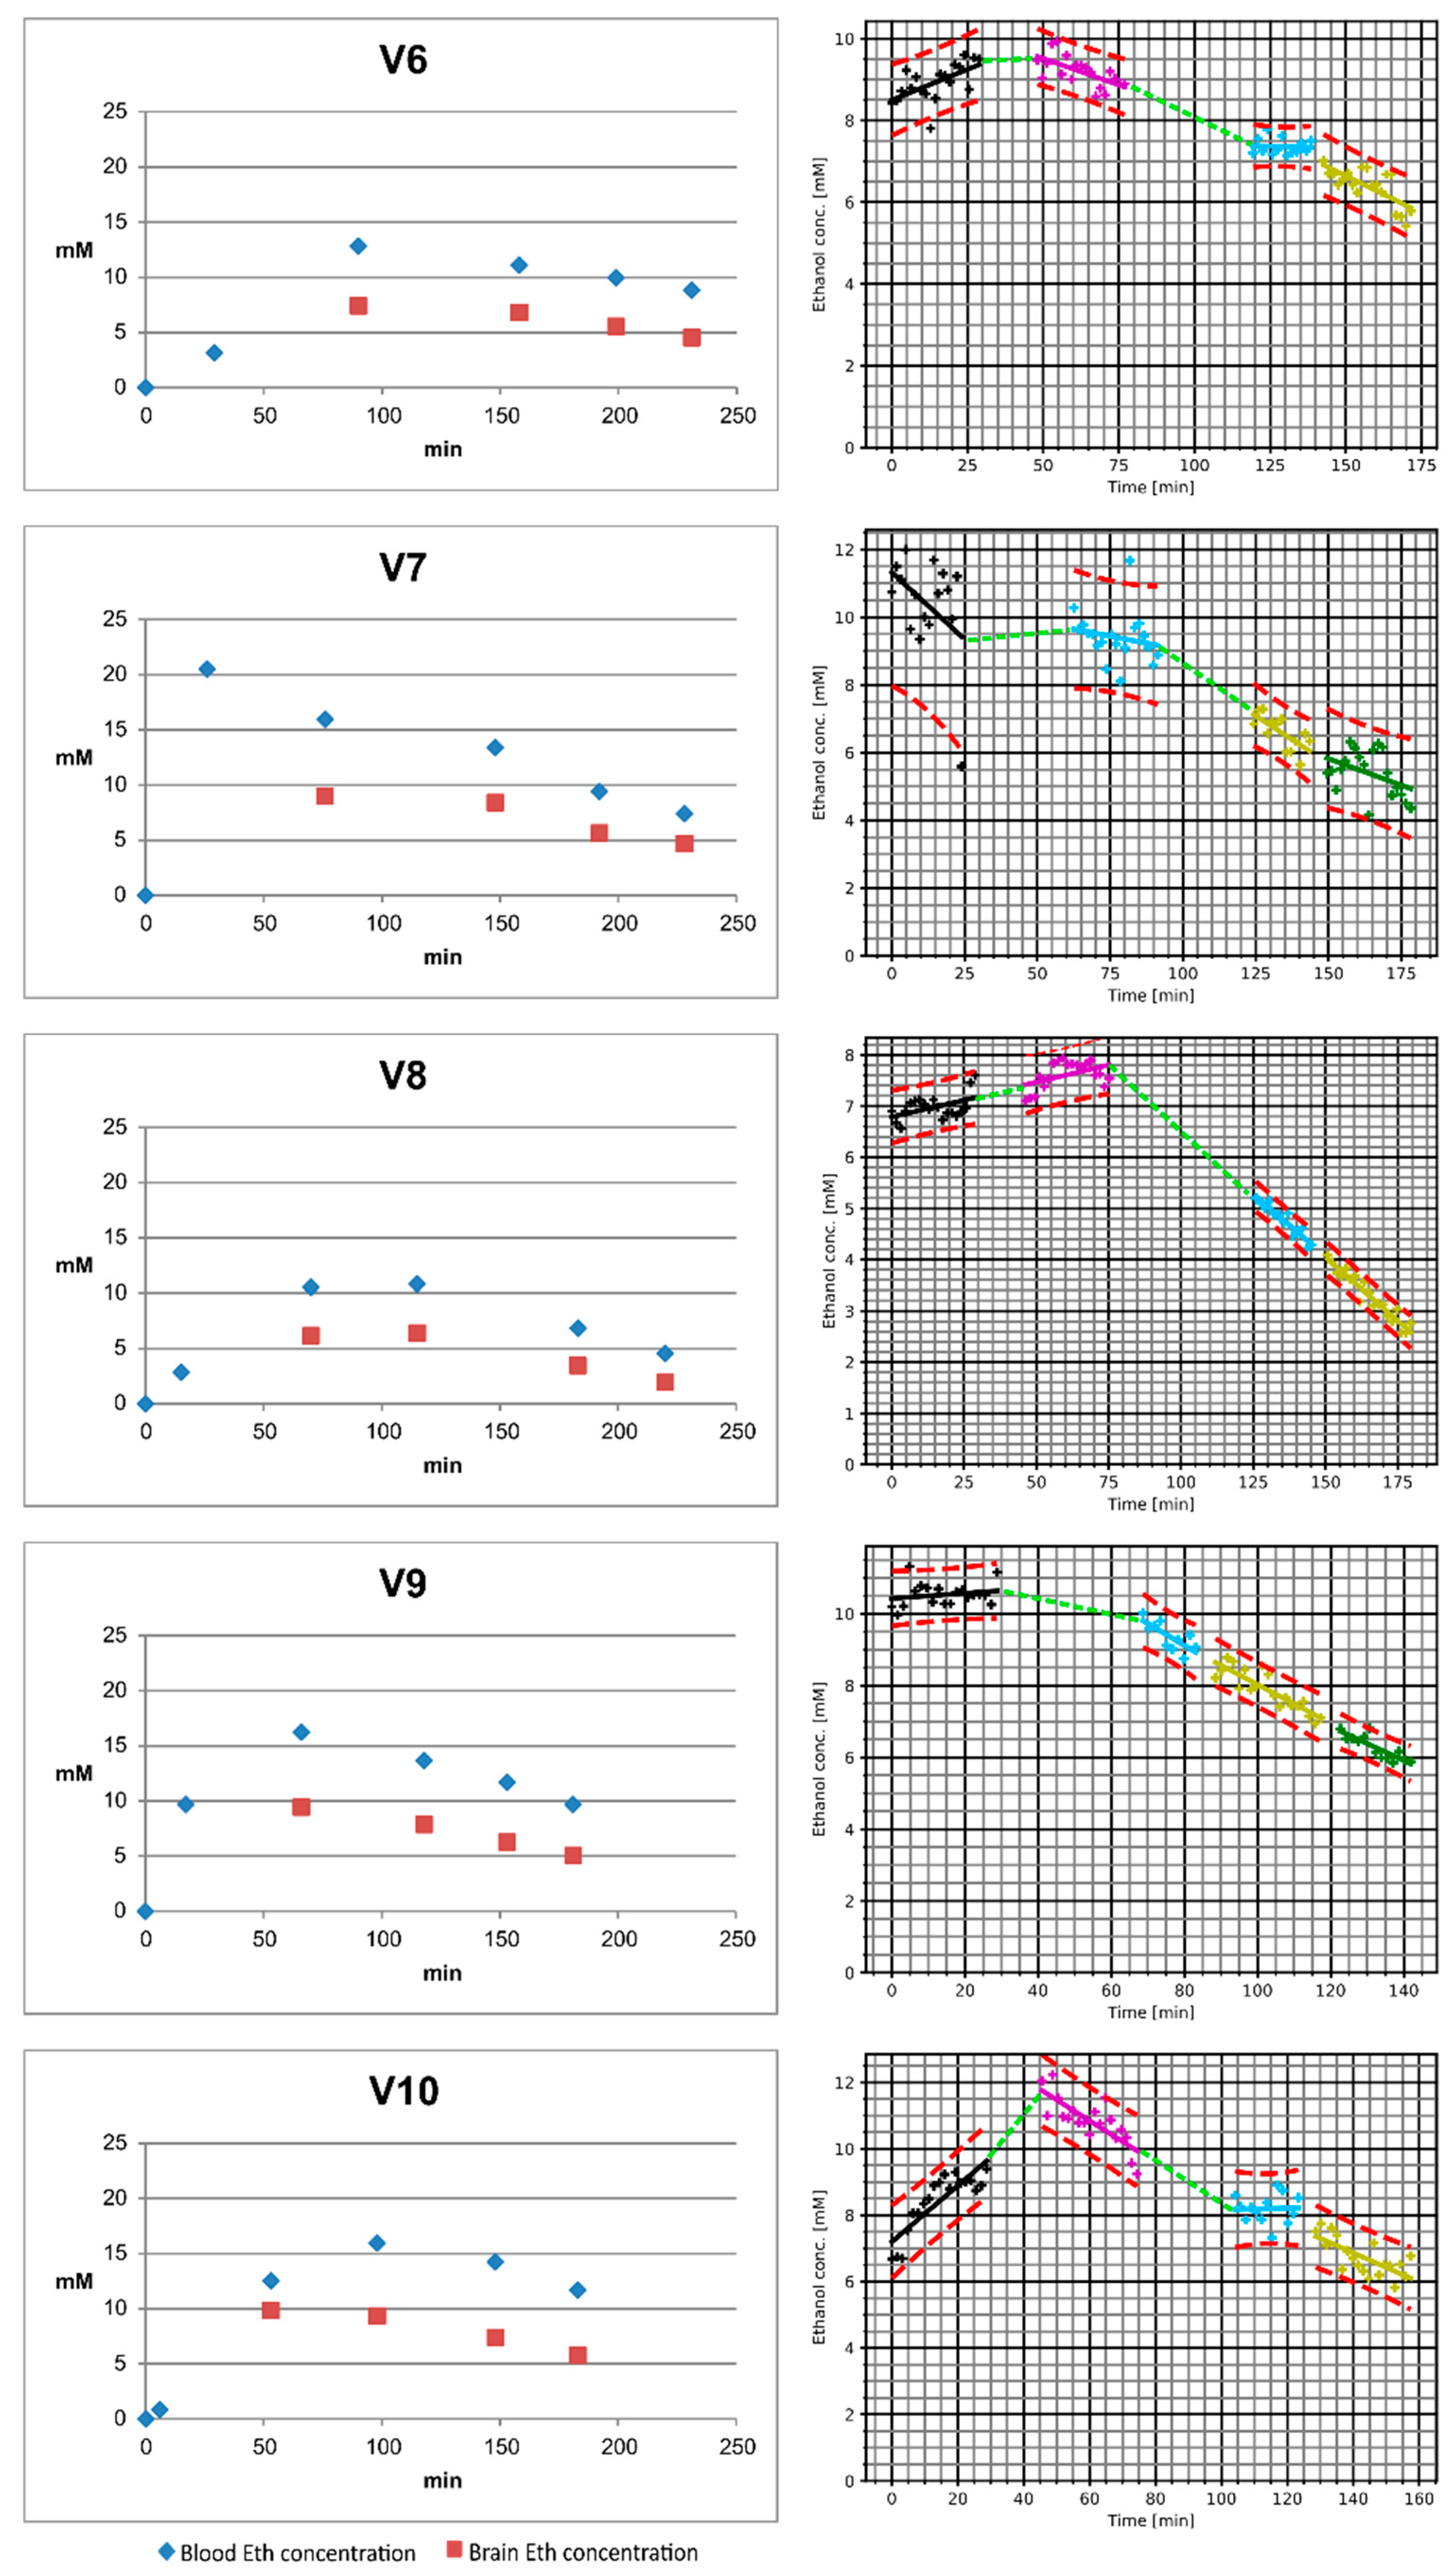
| 6 | 137 | 29 | 0.14 | 27 | 56 | 0.59 | 9.9 | Yes |
| 7 | 135 | 26 | 0.95 | 19 | 45 | 0.95 | 12.0 | (Not available) |
| 8 | 95 | 15 | 0.13 | 19 | 34 | 0.5 | 7.9 | Yes |
| 9 | 100 | 17 | 0.45 | 14 | 31 | 0.75 | 11.3 | No |
| 10 | 160 | 6 | 0.04 | 15 | 21 | 0.74 | 12.2 | Yes |
| Pearson’s Corr. Coeff. | Slope | Intercept | |
|---|---|---|---|
| V01 | 0.9909 | 0.9028 | −3.6794 |
| V02 | 0.9989 | 0.7264 | −1.8130 |
| V03 | 0.9969 | 0.5688 | −0.1000 |
| V04 | 0.9884 | 0.6953 | −2.5368 |
| V05 | 0.9982 | 0.7434 | −2.3142 |
| V06 | 0.9737 | 0.9330 | −2.2611 |
| V07 | 0.9862 | 0.5600 | 0.7960 |
| V08 | 0.9997 | 0.8402 | −1.5809 |
| V09 | 0.9987 | 0.7452 | −1.6414 |
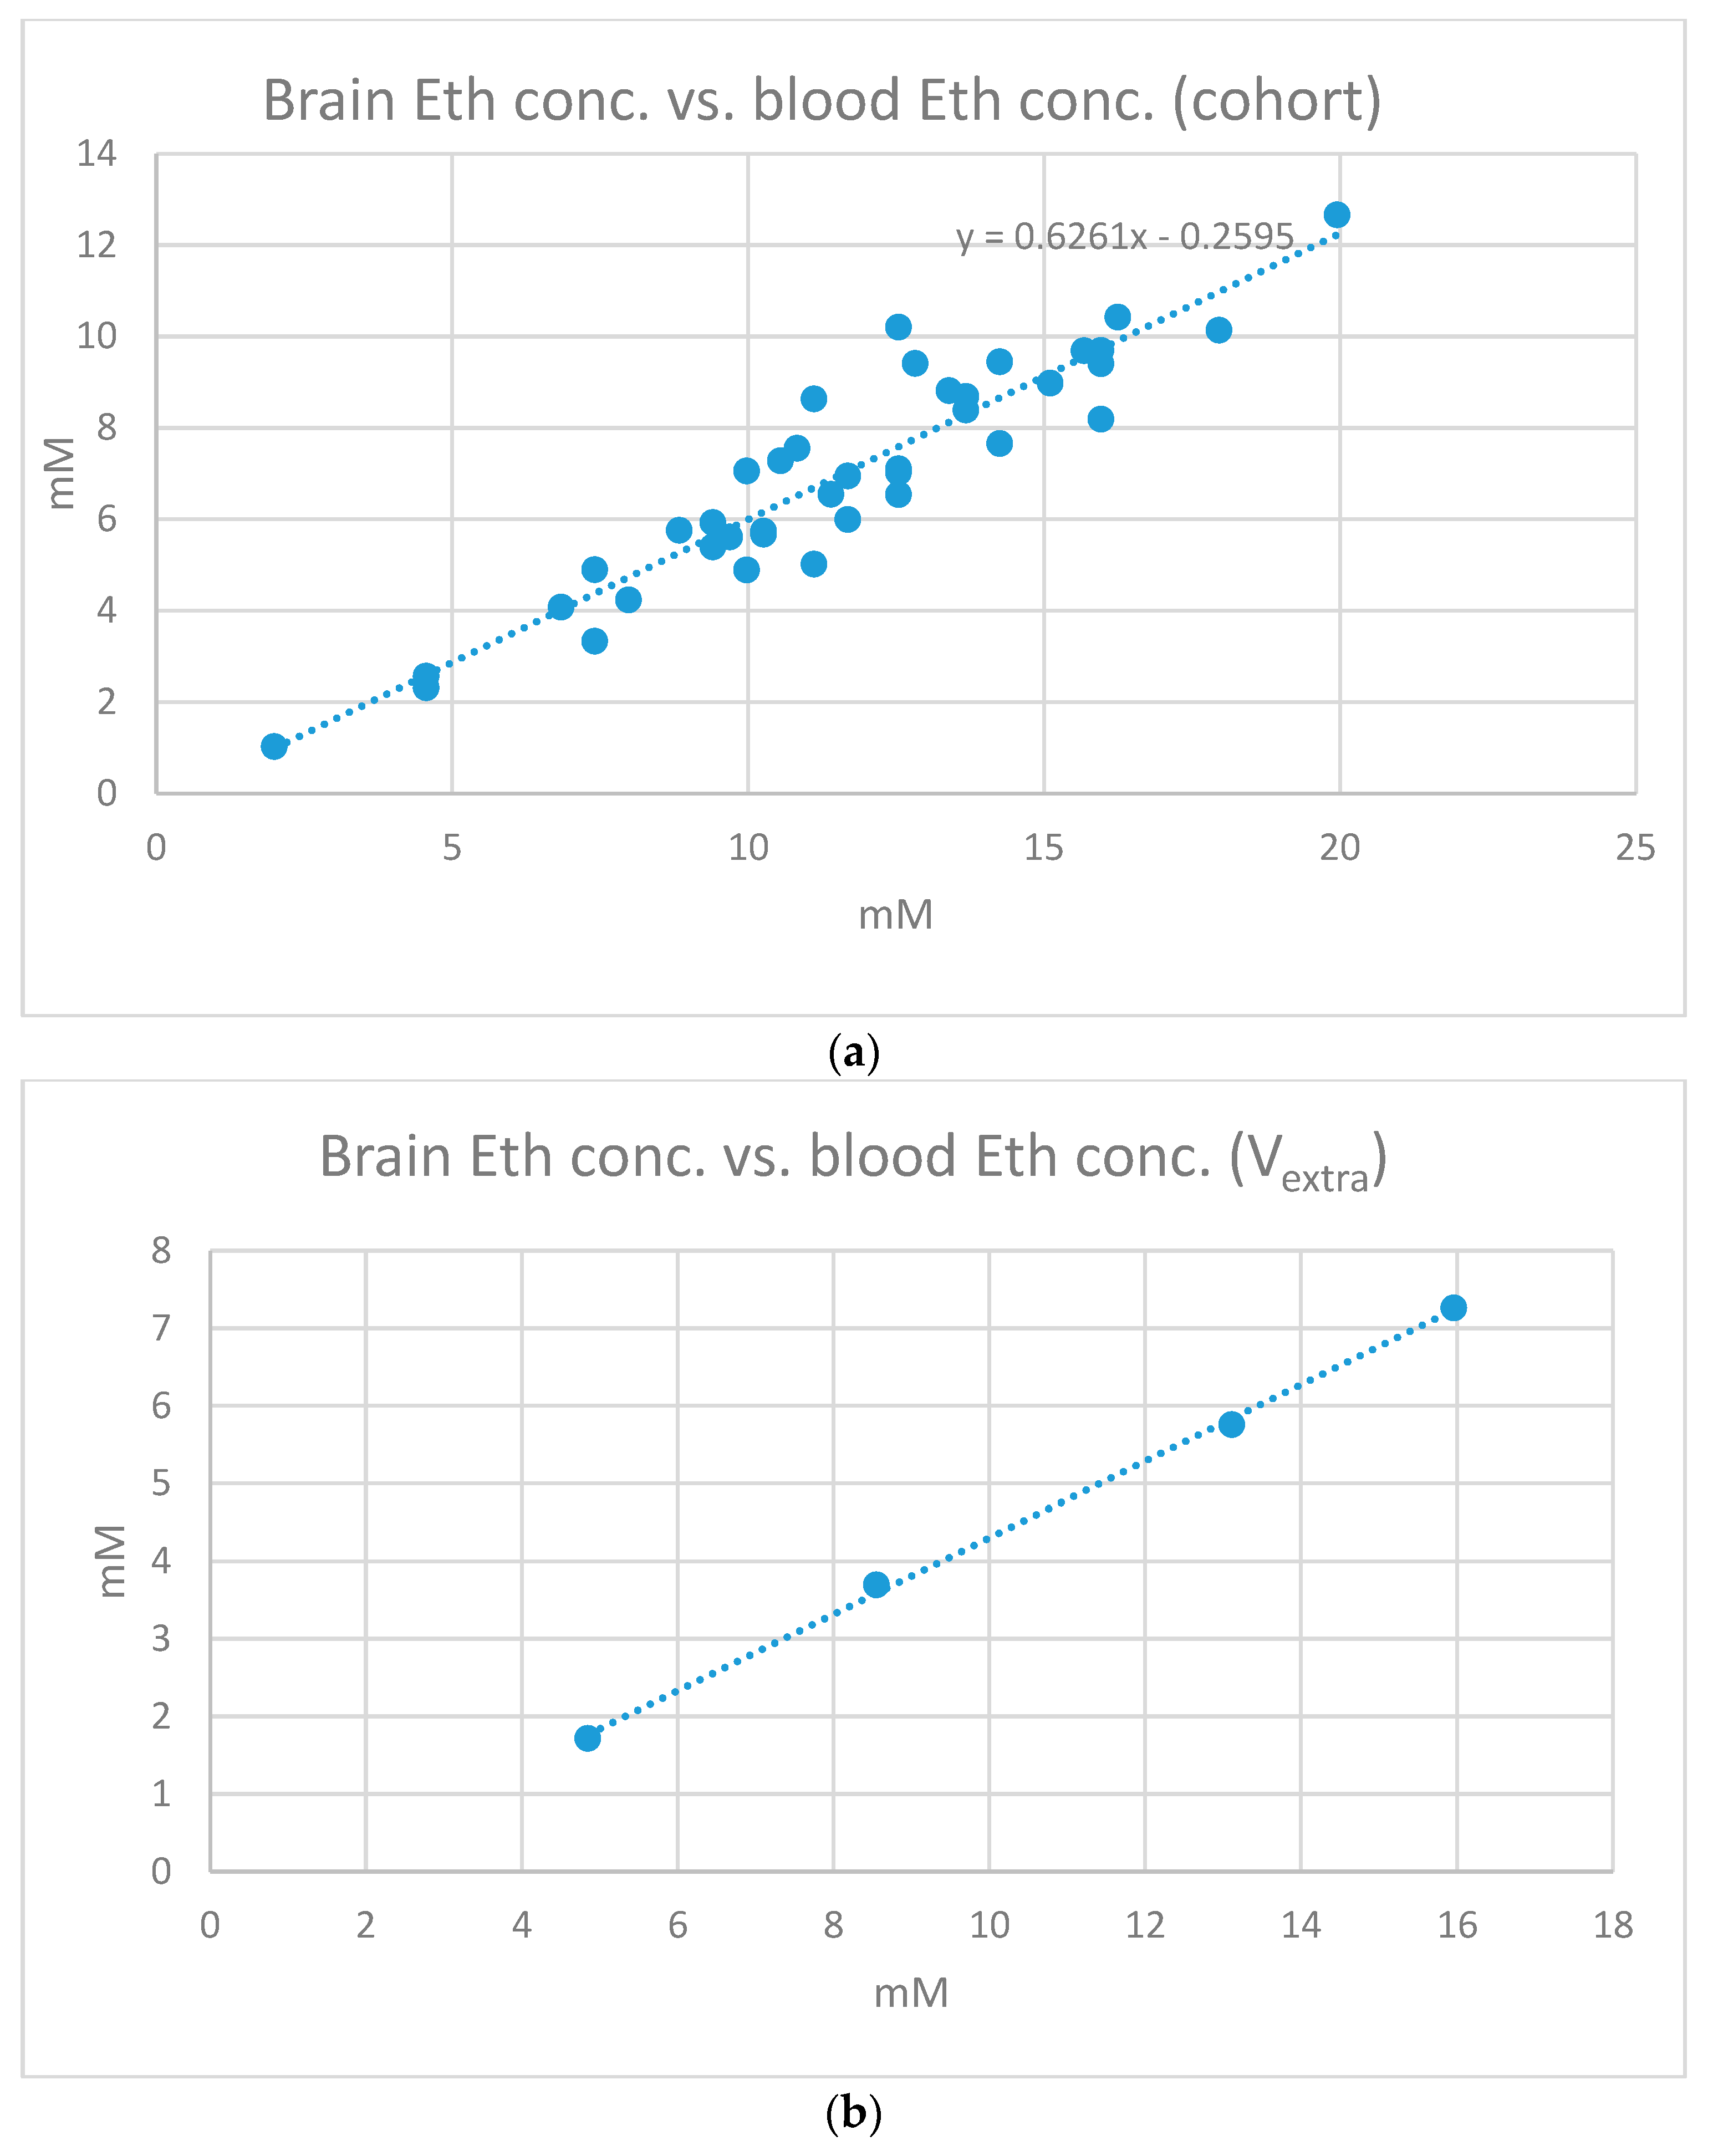
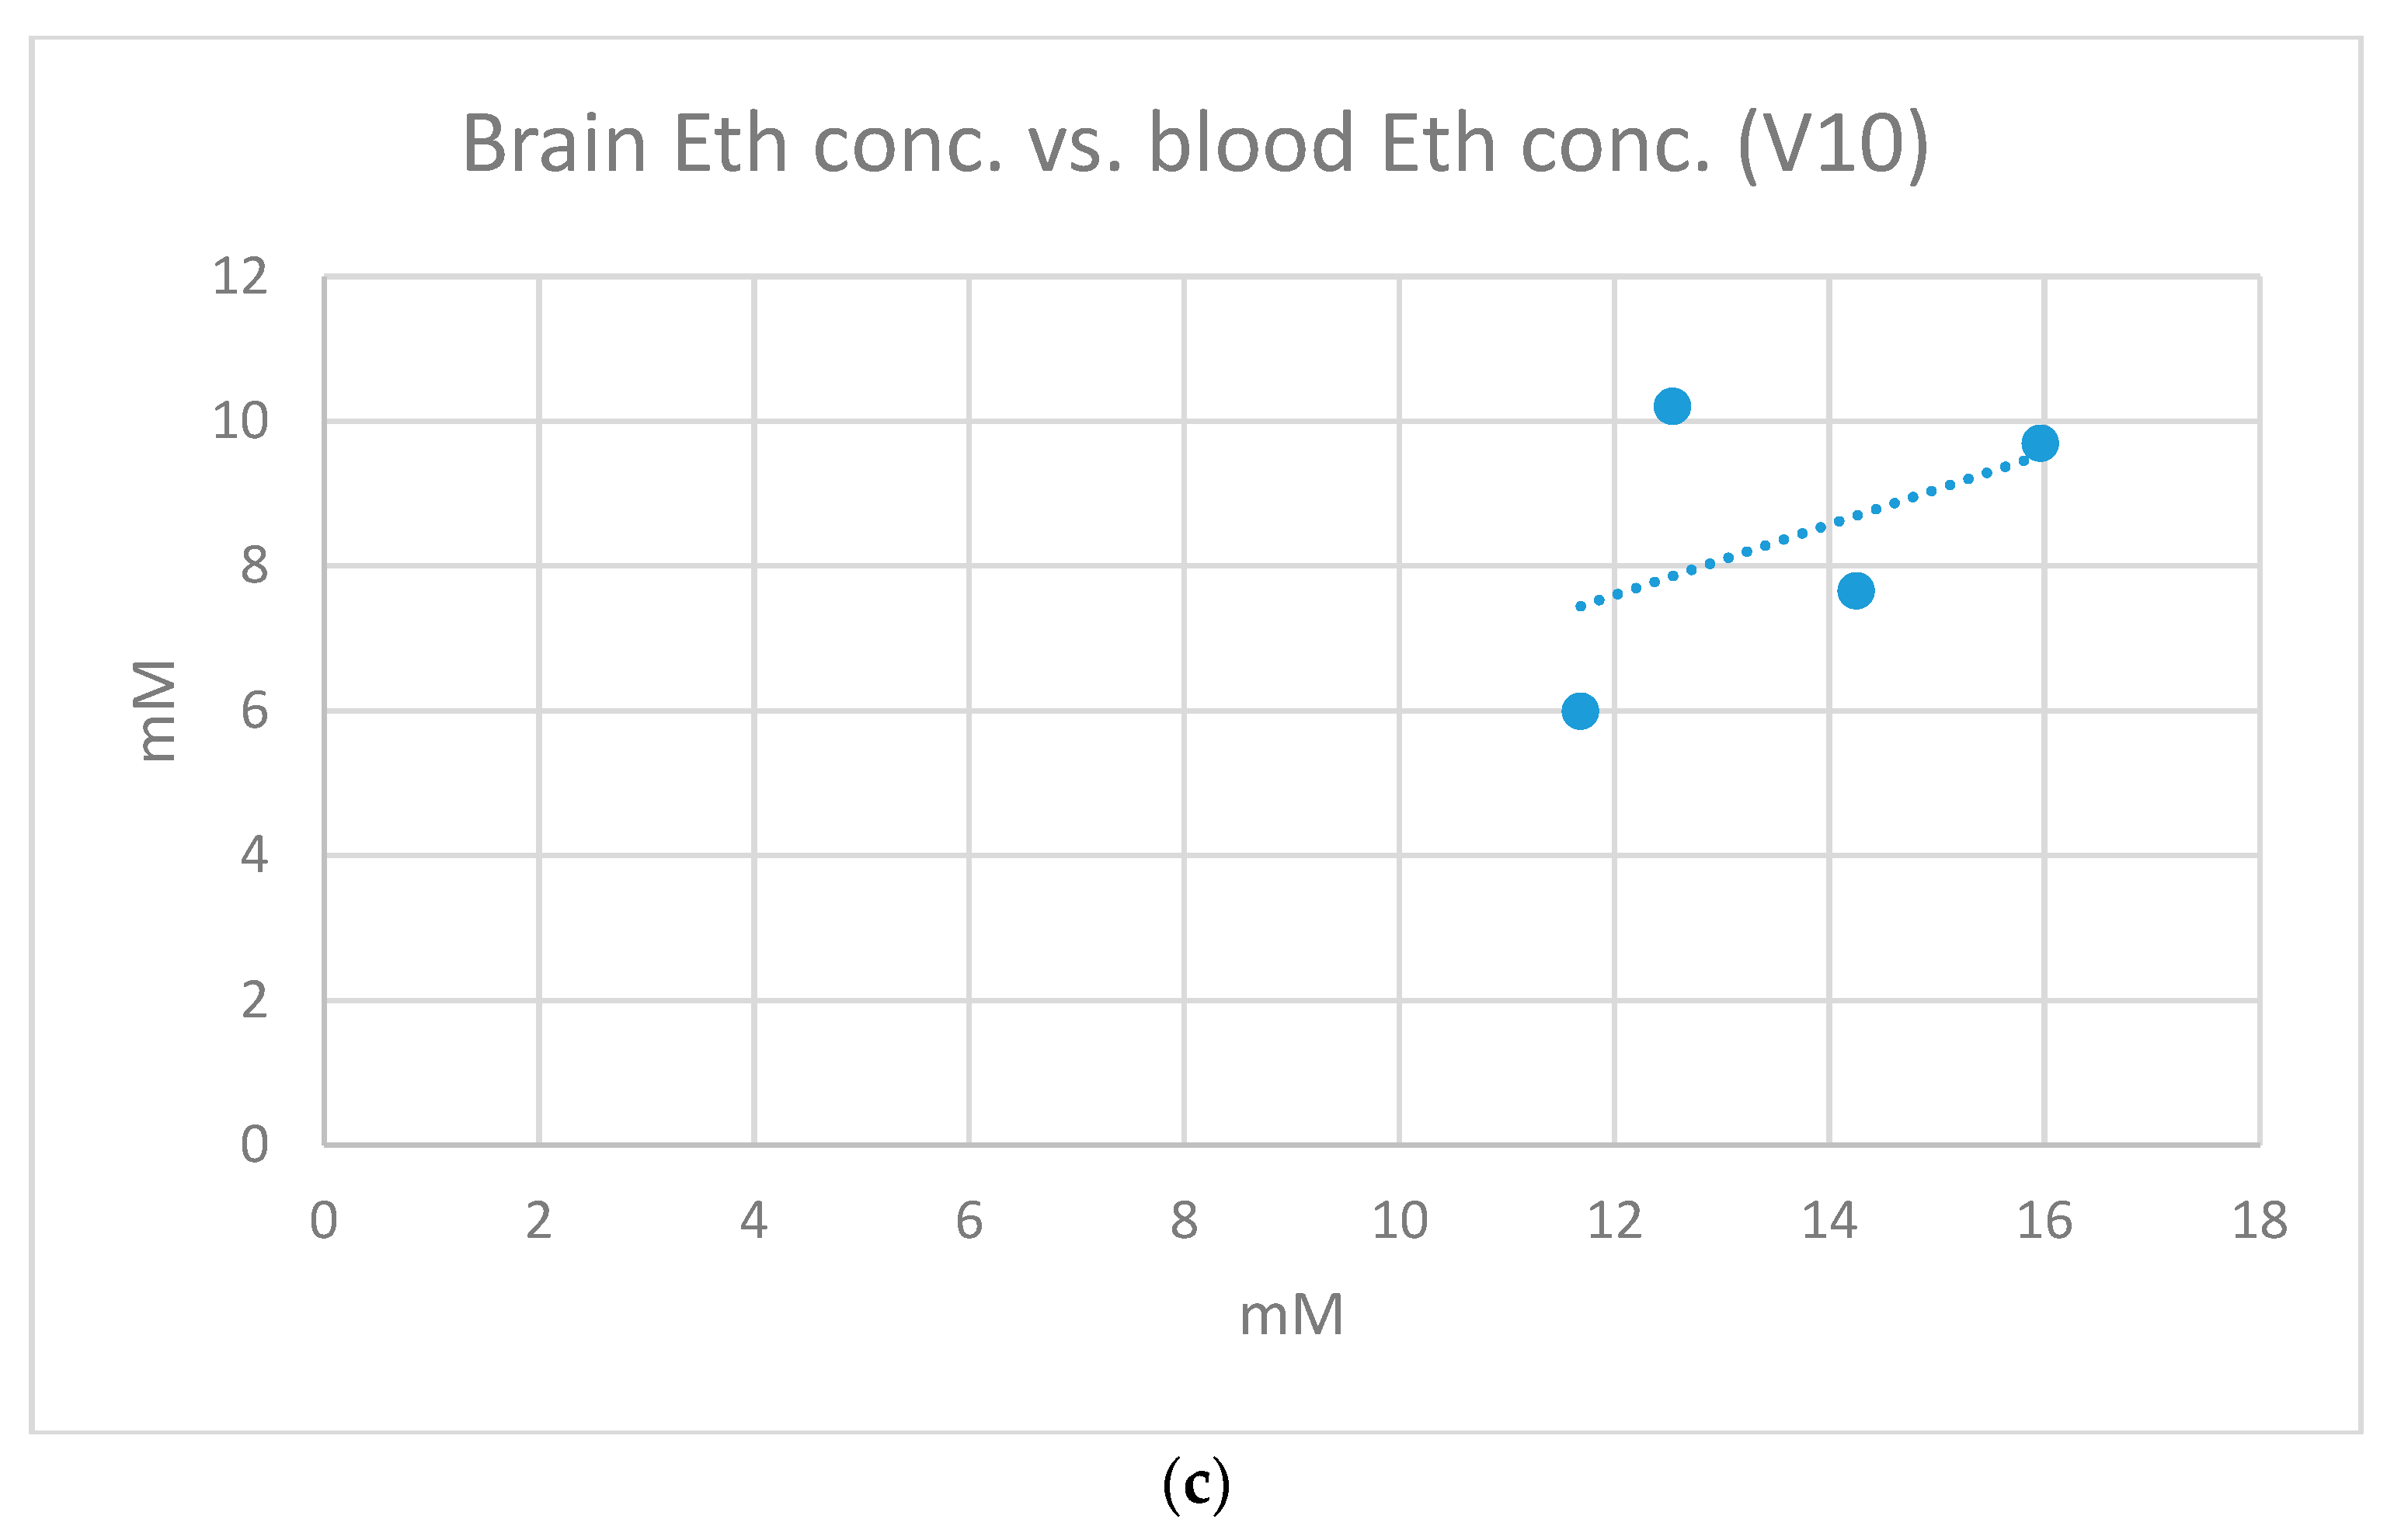
| V10 | 0.4773 | 0.4880 | 1.7454 |
| 0.9409 ± 0.1631 | 0.7203 ± 0.1481 | −1.3385 ± 1.6565 |
| V-Nr. | Sex | Age [a] | Body Weight [kg] | Body Height [cm] | BMI | Ethanol Uptake per Week (Average) | Known Illnesses | Regular Medication |
|---|---|---|---|---|---|---|---|---|
| 1 | M | 35 | 80 | 178 | 25.2 | 0.5 l red wine | None | None |
| 2 | M | 61 | 112 | 194 | 29.8 | 0.25 l beer | Hemithyreoidektomie | None |
| 3 | F | 29 | 58 | 168 | 20.5 | 0.1 l wine | None | None |
| 4 | M | 33 | 80 | 186 | 23.1 | 1 l beer | Coeliac disease | None (gluten-free diet) |
| 5 | F | 28 | 65 | 165 | 23.9 | 0.5 l wine | None | None |
| 6 | M | 67 | 72 | 176 | 23.2 | 1 l wine | Arterial hypertension | Ramipril |
| 7 | F | 60 | 90 | 154 | 37.9 | Very low | Arterial hypertension | Ramipril, hydrochlorothiazide, amlodipine |
| 8 | F | 29 | 57 | 160 | 22.3 | 0.25 l wine | None | None |
| 9 | F | 63 | 60 | 168 | 21.3 | 0.25 l wine | Arterial hypertension | Spironolactone, cholecalciferol |
| 10 | M | 61 | 84 | 187 | 24 | Very low | Tinnitus | Testosterone |
Disclaimer/Publisher’s Note: The statements, opinions and data contained in all publications are solely those of the individual author(s) and contributor(s) and not of MDPI and/or the editor(s). MDPI and/or the editor(s) disclaim responsibility for any injury to people or property resulting from any ideas, methods, instructions or products referred to in the content. |
© 2023 by the authors. Licensee MDPI, Basel, Switzerland. This article is an open access article distributed under the terms and conditions of the Creative Commons Attribution (CC BY) license (https://creativecommons.org/licenses/by/4.0/).
Share and Cite
Thierauf-Emberger, A.; Schuldis, D.; Dacko, M.; Lange, T. Ethanol Kinetics in the Human Brain Determined by Magnetic Resonance Spectroscopy. Int. J. Mol. Sci. 2023, 24, 13499. https://doi.org/10.3390/ijms241713499
Thierauf-Emberger A, Schuldis D, Dacko M, Lange T. Ethanol Kinetics in the Human Brain Determined by Magnetic Resonance Spectroscopy. International Journal of Molecular Sciences. 2023; 24(17):13499. https://doi.org/10.3390/ijms241713499
Chicago/Turabian StyleThierauf-Emberger, Annette, Dominik Schuldis, Michael Dacko, and Thomas Lange. 2023. "Ethanol Kinetics in the Human Brain Determined by Magnetic Resonance Spectroscopy" International Journal of Molecular Sciences 24, no. 17: 13499. https://doi.org/10.3390/ijms241713499